
Abstract
Introduction:
Existing estimates of rates of childhood disability in Kenya are based on data with important limitations. Individual-level data on childhood disability at the local level is also lacking, leaving critical knowledge gaps for clinical and programmatic development.
Objectives:
We aimed to estimate the rates of children at-risk for disability, examine the external factors related to risk of childhood disability, and gain a better understanding of the challenges experienced by children at-risk for disabilities and their families within western Kenya.
Methods:
We conducted a small, cross-sectional randomized community survey to assess the rates of childhood disability across six administrative locations in Uasin Gishu County, Kenya, and to understand the experiences of these children and their caretakers.
Results:
Rate of childhood disability in Uasin Gishu county was estimated to be 5%, with the most common disabilities being mood disorders. Caretakers reported several barriers to accessing treatment for their children at-risk of having disabilities, including financial concerns and lack of transportation.
Conclusions:
Our findings suggest a need for improved access to care in this region, including addressing significant barriers to accessing care such as stigma and socioeconomic challenges. These community-level data will inform the development of future infrastructure and programming for this population.
Introduction
Nearly, 1 billion people globally are estimated to live with a disability, 1 including over 11% of the world’s children and adolescents. 2 Children with disabilities experience significant barriers to wellness and inclusion, such as poor health outcomes, 1 limited socioeconomic resources, 1 barriers to education, 3 negative stigma, 4 and limited access to trained healthcare providers. 5
In Kenya, prevalence of developmental disability among children under five is estimated to be around 10%.6,7 However, current estimates are based on data with important limitations, such as using malnutrition or stunting as proxy measures for development 6 and focusing only on children <5 years of age. 7 These models exclude older children and children with other types of neurodevelopmental disabilities, including physical and communicative disabilities. Tools for assessing risk of childhood disability have been developed and validated for use in low- and middle-income country (LMIC) populations,8,9 but these have not been used to collect individual- or community-level data on prevalence of childhood disability risk in western Kenya. Accurate estimates of the prevalence of disability at the community level are critical as they inform financial and professional investment in disability services and research, as well as infrastructure for developmental services, which could help address these barriers and improve the quality of life for individuals living with disability.
To address the need for community-level estimates for childhood disability, a small, randomized community sampling study was performed within Uasin Gishu county in western Kenya. We selected this site because communities within this region previously identified childhood disability as a top concern through a community-based participatory research process, 10 and opportunities exist for future development of local infrastructure for childhood disability services. We aimed to estimate the rates of children at-risk for disability, examine the external factors related to risk of childhood disability, and gain a better understanding of the challenges experienced by children at-risk for disabilities and their families within this region.
Methods
This cross-sectional, village- and household-randomized community sampling survey took place within the Academic Model Providing Access To Healthcare (AMPATH) program. AMPATH is a partnership among a consortium of global universities, led by Indiana University, Moi University, and Moi Teaching and Referral Hospital (MTRH), in partnership with the Kenyan government. AMPATH’s mission is to build a holistic and sustainable health system in Kenya and across the globe. 11
From October to December 2021, we sampled households from the same six administrative locations in Uasin Gishu county engaged by Kamanda et al. 10 : Pioneer, Kapyemit, Chuiyat, Olare, Sergoit, and Kapsoya. These locations represent both periurban and rural settings. We randomly selected six villages (one in each location), from which we sampled 50 households each, for a total of 300 households. As this was an unfunded study, we had a set number of households from each village that we were able to evaluate with the resources available. Of note, our resulting sample size is within the range of what previous similar studies have used. 10 Randomization occurred by assigning each village a number and utilizing a random number generator. To ensure transparency in our recruitment processes and support of local leadership, we relied on guidance from the chiefs, assistant chiefs, and elders to identify appropriate sampling methods for individual households. Due to the small number of households in the selected villages in Pioneer, Chuiyat, and Sergoit, it was advised we start from a designated location in the village and visit each household in sequential order until we had contacted fifty households. We were advised to visit every fourth household in Kapyemit and every other house in Olare. In Kapsoya, we were advised to select ten random households from each of the village’s five streets. The inclusion criteria were as follows: the household head was ⩾18 years old and fluent in English, Swahili, Kalenjin, Dholuo, or Kikuyu. Guardians determined by research staff to have a mental impairment preventing the individual from understanding or responding to questions were excluded. Written informed consent was obtained for all participants (>18 years old), or their Legally Authorized Representative (⩽18 years old), in their preferred language prior to study activities. No households declined to participate, and none met exclusion criteria.
Data was collected by a team of Community Health Volunteers (CHVs). CHVs were trained by a member of the research team to follow a Standard Operating Procedure for recruitment and data collection. CHVs were assigned to villages according to their familiarity with the village and fluency in the language spoken in the village.
Every household responded to a demographic questionnaire (Appendix A), which included questions related to socioeconomic status (roof, toilet, enrolment in Kenya’s public health insurance) and general perceptions of individuals with disabilities. Household food insecurity was measured using a validated two-question screening tool endorsed by the American Academy of Pediatrics. 12 A household was categorized as food insecure if they responded “sometimes” or “often” to either of two questions: “In the last 12 months, did you ever worry whether your food will run out before you get money to buy more?” or “In the last 12 months, did you feel the food you bought just did not last and you didn’t have money to get more?” 12 . Households with children were administered questions evaluating developmental and functional areas for each household child. For children aged <2 years, the Developmental Screening Questionnaire (DSQ) (Appendix B) was administered. The DSQ was developed and validated for use in LMICs and assesses eight functional domains—gross motor, fine motor, vision, hearing, cognition, socialization, behavior, and speech. 8 For households with children aged 2–17, the Washington Group Child Functioning Module was administered, evaluating disability within functional domains. 9 The Washington Group Child Functioning Module was similarly validated for use in LMIC populations to measure childhood disability. The module is comprised of two sub-modules based on age: children 2–4 years of age (Appendix C) and children 5–17 years of age (Appendix D). Domains evaluated in 2–4-year-olds include: seeing, hearing, mobility, fine motor, communication, cognition/learning, playing, and controlling behavior. Domains evaluated in 5–17-year-olds include: seeing, hearing, mobility, self-care, communication, cognition, behavior, socialization, and mood disorders (anxiety/depression).
If a caregiver reported a child was unable to perform a task or had considerable difficulty performing a task within the DSQ or Washington Group Child Functioning Modules, the child was considered “at-risk” for disability. For each child determined to be at-risk for disability, an additional questionnaire regarding services and barriers to receiving care was administered (Appendix E).
This study was approved as exempt by the Institutional Review Board of Indiana University (IRB# 11987) and the Institutional Research and Ethics Committee of Moi University (FAN: 0003863).
Statistical analysis
Descriptive statistics were used to summarize overall survey results, with mean and standard deviation being reported for numerical variables and count data and proportions reported for categorical data. One-way ANOVA was used to compare sociodemographic variables among the six villages and discover significant differences for inclusion in follow-up analysis. Preliminary univariate analyses were performed for each sociodemographic variable to evaluate potential associations with having a child at-risk for disability in the household (α set at 0.05). Multiple variable logistic regression was performed adjusting for National Hospital Insurance Fund (NHIF) coverage, toilet type, years of schooling for the head of household, food insecurity, and the number of children in the household. Analyses including Kruskal–Wallis rank sum test, 13 Pearson’s Chi-squared test, 14 and Fisher’s exact test 15 were performed using R 16 and GraphPad. 17 Free text answers were summarized qualitatively.
Results
Of the 300 households surveyed, 92% had a least one child, with a total of 792 children (45% female, average age 8.6 years) included. The average number of years of schooling completed for the head of household was 9.70 (SD = 4.46). Most homes had sheet metal roofs (n = 296, 99%) and pit latrine toilets (n = 257, 83%). Coverage through the Kenyan National Hospital Insurance Fund (NHIF) was split with approximately one third reporting having either basic or comprehensive coverage (n = 93, 31%) and two thirds having no coverage (n = 207, 66%). A total of 267 households (89%) were classified as food insecure. Demographics by location are shown in Table 1.
Demographics of participants.

Mean (SD); n (%).
When asked about the level of stigma that persons with disabilities face in their communities, the majority of respondents indicated these persons face moderate (n = 99, 33%) or severe (n = 80, 27%) stigma. Over half of all participants indicated they had a little hope (n = 106, 35%) or no hope at all (n = 57, 19%) that persons with disabilities could live good and meaningful lives. These responses varied by location (Table 1). Overall, a larger majority of households with a child at-risk for disability (n = 30) reported moderate to severe stigma risk (67%) compared to households with no children at-risk for disability (60%). However, this difference was found to be not significant, X2 (1, 30) = 0.56, p = 0.45. There was a significant difference between the percentage of households with a child at-risk for disability reporting moderate or a lot of hope for individuals with disabilities (67%) compared to households with no children at-risk for disability (45%), X2 (1, 30) = 6.52, p < 0.01.
Disability risk
Thirty-nine children (5%) in 30 households were determined to be at-risk for a disability based on the standardized assessment tools used. Most came from Kapyemit (n = 22), and none were from Sergoit. We identified one child aged 0–2 at-risk for disability, 9 children aged 2–4, and 29 children aged 5–17. Among all children identified as at-risk for disability, mood disorders were the most common disability risk (n = 14, 36%), followed by cognitive delay (n = 12, 31%), expressive language delay (n = 11, 28%), and vision difficulty (n = 10, 26%) (Figure 1). Disability risks for the one child aged 0–2 were gross motor, cognition, socialization, and speech. Among the children aged 2–4 at-risk for disability (N = 9), vision impairment (n = 5, 56%), fine motor delay (n = 2, 22%), and behavioral challenges (n = 2, 22%) were most common. Among children aged 5–17 at-risk for disability (N = 29), mood disorders (n = 14, 48%), cognitive delay (n = 12, 41%), and expressive language delay (n = 11, 38%) were most common. The only variable associated with higher odds of having a child at-risk for disability was presence of an indoor flush toilet (OR = 3.24, 95% CI: 1.25, 8.46). No other sociodemographic variables were significant.
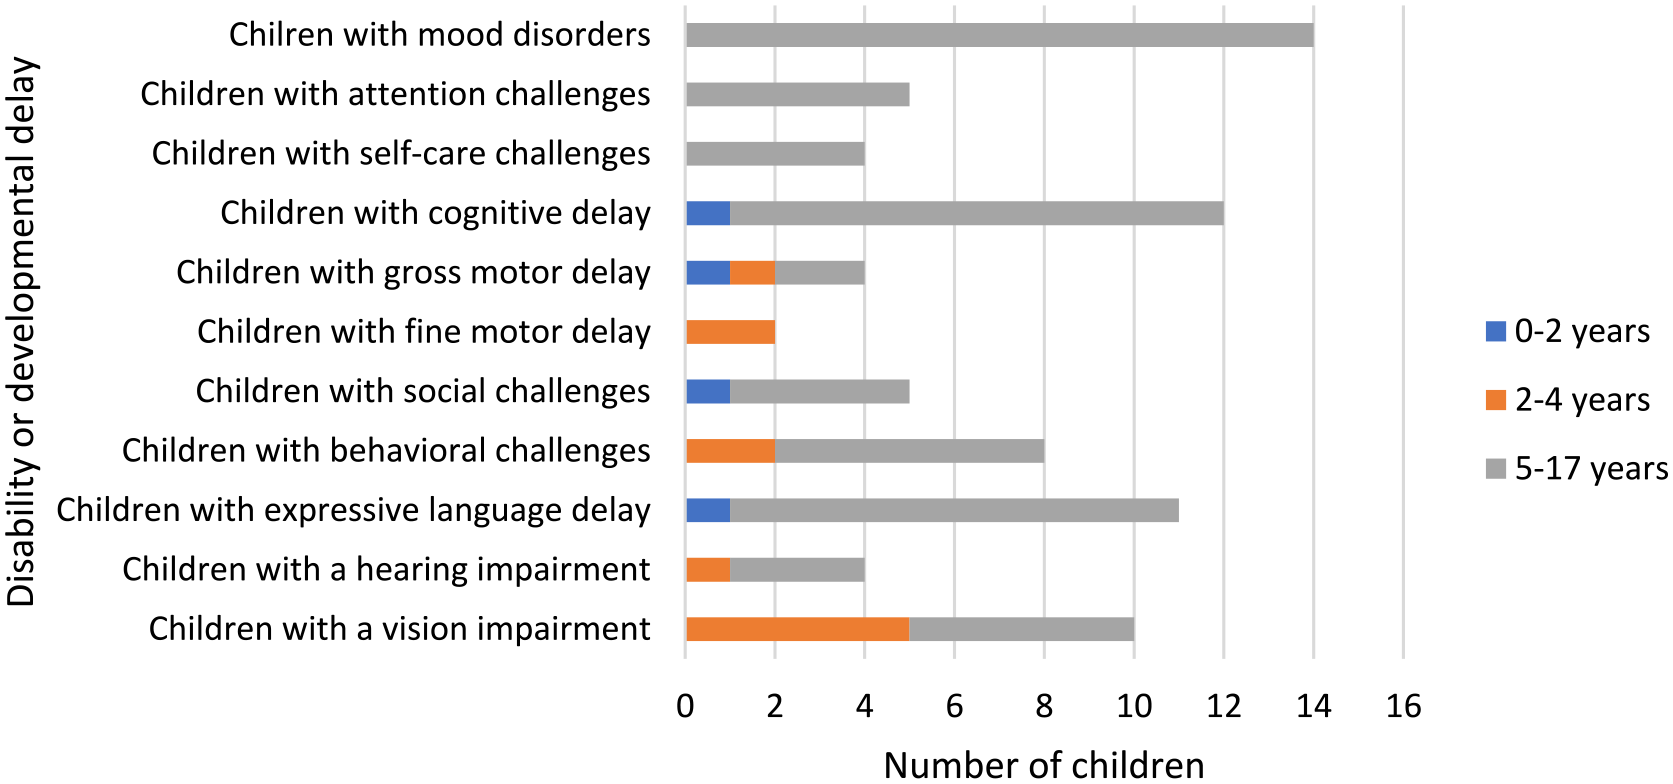
Types of pediatric disability risks among surveyed households.
Only 38% (n = 15) of children at-risk for disability had sought care for their disability. The most cited reason for not seeking care was being unsure about where to go (n = 9). The most common treatment recommended to those who sought help was medication (n = 10), and most (n = 7, 70%) accessed it. Other treatments accessed included speech therapy (n = 3), physical therapy (n = 3), and occupational therapy (n = 2). Those who did not access treatment cited financial reasons as the primary barrier, along with a lack of transportation and the need to care for other children.
When asked how much the child’s potential disability impacts the participant’s life, half said it had a moderate (n = 14, 36%) or severe (n = 5, 13%) impact and 44% (n = 17) said it had no impact at all. These impacts included additional caretaking time and responsibility, an increased financial burden, and heightened levels of stress/worry.
Discussion
Our findings suggest the rates of childhood disability in Uasin Gishu county, Kenya, are lower than previously estimated, with mood disorders being most common. Across the locations, there was variability of the rates of at-risk and community views on children with disability. This study yielded critical insights to inform future development of services for children with disabilities in western Kenya.
Of the affected domains of at-risk development, mood disorders, including anxiety and depression, were the most common. These findings are consistent with previous measures of mood disorders among children and adolescents in Kenya, which ranged from 14% in 2015 18 to 19.1%–26% during the COVID-19 pandemic. 19 Unfortunately, services to support these children are severely limited, especially in LMICs.20,21 Improved health programming is needed to meet the mental health needs of children within this setting.
Degree of urbanicity appears to drive some variability noted across sites. Kapyemit, with the highest rates of at-risk development, is a semi-urban and highly populated location. Participants in rural Sergoit reported no children with disability. These geographical differences are likely driven by differences in reported stigma against individuals with disabilities across locations. Previous research has shown that individuals with disabilities in rural areas tend to face more stigma and discrimination in rural areas of LMICs compared to urban areas. 22 This is consistent with our findings, as Sergoit reported the highest levels of stigma toward individuals with disabilities. Levels of hope similarly varied, with the rural locations Sergoit, Chuiyat, and Olare reporting very low levels of hope. We hypothesize that these differing attitudes may have influenced the willingness of participants to openly report about disability risk, resulting in low rates of detection of children at-risk for disabilities that underrepresents the size of this population. Previous studies have reported similar challenges in getting accurate reporting of disability due to stigmatized beliefs. 23 As additional efforts to reduce stigma against childhood disabilities continue in these regions, follow-up estimates of disability rates could yield critical new insights on how stigma may impact rates of disability, when determined by caregiver report.
Toilet type, a proxy measure for socioeconomic status, was the only characteristic associated with a higher odds of having a child at-risk for disability. When considered alone, this may be considered counterinitiative, as lower socioeconomic status is often associated with worse neurodevelopmental outcome. 24 However, within our sample, having an indoor flush toilet was more common in more urban locations, which tended to have increased hope for children with disabilities and less stigma toward individuals with disabilities. Thus, these complex factors perhaps increased the willingness to disclose developmental difficulties and may explain the over three times greater odds of having a child at-risk for disability.
Another limitation was the measurement of food insecurity. The screening tool used in this study was validated with a population in the United States. 12 Considering the very high number of households in our sample identified as being food insecure, further consideration should be given to the utility of these measures when used within LMICs, like Kenya. However, the rate of households identified in this study as being food insecure (89%) is comparable to other food insecurity measures in Kenya, which range from 72.3% 25 to 84% 26 being moderately or severely food insecure.
Our results may also be limited due to the use of different questionnaires to assess disability risk across different age groups. Though all of the assessments used have been validated for use in their target age groups in LMIC settings, it is conceivable the sensitivity of the tools varies. While the two age groups assessed using the Washington Group Modules (2–4 years and 5–17 years) had similar rates of disability, the less comprehensive DSQ only identified one child aged 0–2 as having a disability and thus may have underrepresented disability risk compared to the Washington Group modules. However, these limitations were unavoidable due to unavailability of a single tool valid for all children <18 years. In addition, the parent-reported nature of these data may not have reflected the functional and developmental status of the child with the same degree of accuracy as a standard clinical and psychological evaluation from a trained professional.
Our study results may have limited generalizability due to the number of villages sampled within a distinct region. However, we limited our risk of bias by randomizing selected villages within each location, and we empowered local ownership of this project by relying on the locations’ leadership to identify preferred sampling methods within each village. This is one of the few studies of disability rates at the individual level, thus providing useful and unique insights. Furthermore, neurodevelopmental services are being developed at MTRH, so region-specific data is critical.
Conclusion
This research addresses a critical lack of data about childhood disability at the local level in western Kenya. The results provide insights not only on the rates of childhood disability and developmental delay in the region but also to the experiences and challenges faced by those children and their caretakers. Results from this research will be used to inform the development of programming and infrastructure at MTRH which will provide therapies and support for children with disabilities to improve the quality of life for these children and their families.
Supplemental Material
sj-docx-1-smo-10.1177_20503121241258849 – Supplemental material for Understanding the need for pediatric neurodevelopmental services among households in western Kenya: A population-based study
Supplemental material, sj-docx-1-smo-10.1177_20503121241258849 for Understanding the need for pediatric neurodevelopmental services among households in western Kenya: A population-based study by Kaytlin Eastes, Eren Oyungu, Carolyne Jerop, Ananda Roselyne Ombitsa, Barnabas Kigen and Megan S McHenry in SAGE Open Medicine
Footnotes
Acknowledgements
We thank the late Dr Alan Kamanda and the late Dr Paula Braitstein for their fundamental contributions to this research. We also thank Aaron Cohen and JangDong Seo for their assistance with statistical analyses.
Author contributions
Author contributions are as follows: study conception and design: Eren Oyungu, Barnabas Kigen, and Megan S McHenry; data collection: Carolyne Jerop and Ananda Roselyne Ombitsa; analysis and interpretation of results: Kaytlin Eastes and Megan S McHenry; manuscript preparation: Kaytlin Eastes and Megan S McHenry. All authors reviewed the results and approved the final version of the manuscript.
Declaration of conflicting interests
The author(s) declared no potential conflicts of interest with respect to the research, authorship, and/or publication of this article.
Funding
The author(s) disclosed receipt of the following financial support for the research, authorship, and/or publication of this article: Dr. Megan S. McHenry’s salary was supported by an NIMH K23 Career Development Award (K23MH116808) during the time of this study.
Ethics approval
This study was approved as exempt by the Institutional Review Board of Indiana University (IRB# 11987) and the Institutional Research and Ethics Committee of Moi University (FAN: 0003863).
Informed consent
Written informed consent was obtained for all participants (>18 years old), or their Legally Authorized Representative (⩽18 years old), in their preferred language prior to study activities.
Trial registration
Not applicable.
Supplemental material
Supplemental material for this article is available online.
References
Supplementary Material
Please find the following supplemental material available below.
For Open Access articles published under a Creative Commons License, all supplemental material carries the same license as the article it is associated with.
For non-Open Access articles published, all supplemental material carries a non-exclusive license, and permission requests for re-use of supplemental material or any part of supplemental material shall be sent directly to the copyright owner as specified in the copyright notice associated with the article.