
Abstract
Background:
Renal cell carcinoma is the most common form of kidney cancer which is a global threat to human health, needing to explore effective therapeutic targets and treatment methods. Aurora kinase B acts as an important carcinogenic role in various kinds of tumors, while its mechanism in renal cell carcinoma is indistinct. Herein we explore the underlying mechanism of Aurora kinase B in renal cell carcinoma.
Methods and results:
Label-free quantitative proteomics analysis was employed to analyze the differentially expressed proteins in 786-O cells which were treated with si-Aurora kinase B or si-ctrl. In the current study, 169 differentially expressed proteins were identified. The top 10 upregulated proteins were MX2, IFI44L, ISG20, DDX58, F3, IFI44, ECE1, PRIC285, NIT1, and IFIT2. The top 10 downregulated proteins were FKBP9, FSTL1, DDAH1, TGFB2, HMGN3, COIL, FAM65A, PTPN14, ARFGAP2, and EIF2C2. GO enrichment analysis showed that these differentially expressed proteins participated in biological processes, including defense response to virus, response to virus, and type I interferon signaling pathway. These differentially expressed proteins participated in cellular components, including focal adhesion, cell-substrate adherens junction, cell-substrate junction, and endoplasmic reticulum lumen. These differentially expressed proteins participated in molecule functions, including guanyl nucleotide binding, nucleotidase activity, double-stranded RNA binding, 2′-5′-oligoadenylate synthetase activity, and virus receptor activity. Kyoto Encyclopedia of Genes and Genomes pathway analysis showed that the significantly changed proteins including OAS3, OAS2, JAK1, TAP1, and RAC1 were involved in Epstein-Barr virus infection.
Conclusions:
Taken together, our results demonstrate the possible mechanisms that Aurora kinase B may participate in renal cell carcinoma. These findings may provide insights into tumorigenesis and a theoretical basis for developing potential therapies of renal cell carcinoma.
Introduction
Renal cell carcinoma (RCC) accounts for more than 90% of kidney cancers which belongs to one of the most common malignancies. 1 Clear cell renal cell carcinoma (ccRCC), papillary RCC (PRCC) and chromophobe RCC are the major subtypes of RCC. Localized RCC can be managed by surgery, whereas conventional chemotherapy has limited efficacy for metastatic RCC. Therefore, there is an ongoing need to explore novel therapeutic targets or more effective treatments of RCC. Further exploring the mechanism of RCC is helpful to the potential future for RCC research and therapy. There are various abnormal expression genes found in RCC, and some of them may act as oncogenes such as MUC12, 2 ELOVL5, 3 MBD2, 4 P4HA1, 5 and some may act as tumor suppressor genes such as SIRT5, 6 OSR1, 7 HOXA11, 8 CHD5 9 during the tumorigenesis and progression of cancer. Aurora kinase B (AURKB) is a member of the aurora kinase subfamily which acts as a vital function in mitosis. Previous studies have reported that AURKB was overexpressed in ccRCC samples and its expression was increasing with the development of ccRCC. 10 ALKBH5 could regulate AURKB expression through regulating the stability of AURKB mRNA, and finally accelerating the growth of RCC cell. 11 The expression of Aurora B was differentially upregulated in ccRCC and primary tumors in patients with lymph node involvement. 12 These studies showed that AURKB may have an important role in RCC, while the mechanism of AURKB in RCC still remains unclear. It is useful to detect the change of protein to better investigate the mechanism of AURKB in RCC for the vital role of protein in determining cell fates. We employed proteomic approach to detect the changes in protein abundance between si-AURKB and si-ctrl groups to explore the possible biological process and pathway through which AURKB may participate in RCC.
Methods
Cell culture
786-O cells were incubated in RPMI-1640 medium with 10% fetal bovine serum (Invitrogen) and cultured in a humidified atmosphere with 5% CO2 at 37°C.
Quantitative real-time polymerase chain reaction (qRT-PCR)
The 786-O cells were seeded and after 24 h, cells were transfected with si-AURKB or control siRNA (si-ctrl). Si-AURKB sequences were as follows: 5′-UUU AGG UCC ACC UUG ACG AUG CGGC-3′ and 5′-GCC GCA UCG UCA AGG UGG ACC UAAA-3′. 13 Total RNA was obtained with Trizol reagent, cDNA was synthesized from total RNA by using PrimeScript RT Reagent Kit (Takara Bio). The AURKB mRNA expression was detected by SYBR Premix Ex Taq II Kit (Takara Bio) with GAPDH as control.
Protein sample preparation
786-O cells transfected with si-AURKB or si-ctrl, through sample lysis, calculation of protein concentration by BCA quantitative, acetone precipitation, re-suspend protein for tryptic digest, cleaning up of sodium deoxycholate, peptide desalting.
Nano-UPLC separation and LC–MS/MS analysis
2 µg polypeptides from each group were separated by a nano-UPLC and detected by the Q-Exactive mass spectrometry (Thermo Finnigan). Reversed-phase chromatographic column was used to analyze. The mobile phase A is H2O with 0.1% formic acid, 2% acetonitrile, and the mobile phase B is H2O with 80% acetonitrile, 0.1% formic acid. The sample was added into the chromatographic column by the automatic sampler, and then separated. A 120 min gradient at 300 nL/min flow rate. Gradient B: 8%–30% for 92 min, 30%–40% for 20 min, 40%–100% for 2 min, 100% for 2 min, 100%–2% for 2 min, 2% for 2 min. Data dependent acquisition was performed with positive mode and scanned parent ion m/z range of 350–1600. Twenty fragments were collected after each full scan. Orbitrap analyzer at a resolution of 70,000(@200 m/z) for MS1, and at a resolution of 17,500 for MS2; The automatic gain control target for MS1 was set to 3.0E + 6 with max IT 50 ms, and 5.0E + 4 with max IT 100 ms for MS2. The normalized collision energy is 27%, isolation window is 2 m/z and dynamic exclusion time was set at 30 s.
Bioinformatics analysis
Raw data is processed with MaxQuant. The protein database is from UNIPROT database. The quantitative type was label-free quantification (LFQ), trypsin was set as specific enzyme with a maximum of three missed-cleavage sites. oxidation [M] and acetyl [protein N-term] were set as variable modifications, Carbamidomethyl [C] was set as fixed modifiers (the maximum number of variable modifiers is 3). The false discovery rates of peptide and protein level was set to 0.01. Samples were standardized. The protein with ratio A/B > 1.5, p ⩽ 0.05, unique peptide ⩾ 2 was defined as those that significantly changed. Gene Ontology (GO), Kyoto Encyclopedia of Genes and Genomes (KEGG), and protein interaction analysis were performed to analyze the possible biological processes, molecular functions, cellular components, important metabolic and signaling pathways based on the differentially expressed proteins in two comparing groups.
Statistical analysis
Results are shown as means± SD. Difference analysis was assayed by Student’s t- test. p < 0.05 was considered to indicate a statistically significant difference.
Results
Si-AURKB could suppress AURKB expression
QRT-PCR was employed to determine the mRNA expression of AURKB in 786-O cells which were transfected with si-AURKB or si-ctrl. The results showed AURKB expression in 786-O cells transfected with si-AURKB was significantly decreased comparing with si-ctrl transfected cells (Figure 1).

Si-AURKB inhibited the expression of AURKB in 786-O cells.
The cluster heat map
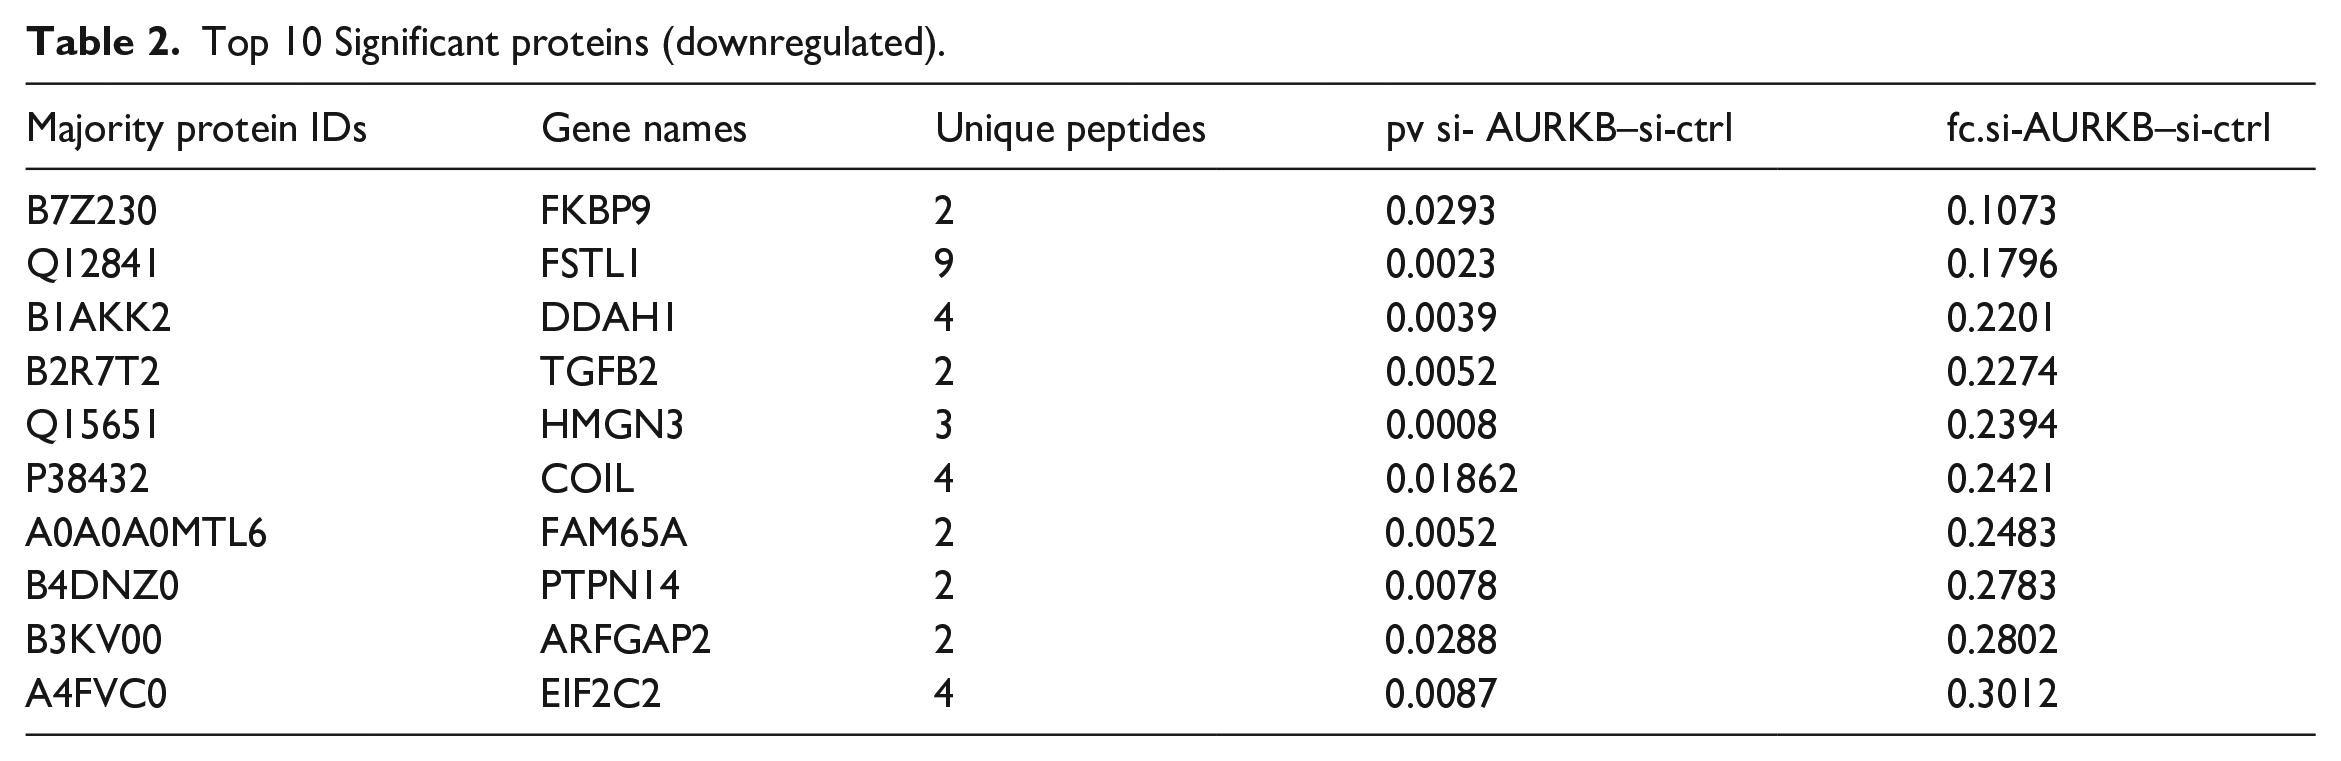
169 differentially expressed proteins were identified between si-AURKB transfected group and si-ctrl group by LFQ analysis. The heatmap grouped the similar data together by separately reorders the rows and columns. In order to determine the rationality and the accuracy of the differentially expressed proteins (DEPs), hierarchical clustering for each group of samples was performed by using the selected proteins, as shown in Figure 2, the top color bar represents the grouping of samples; The bottom is the corresponding sample name; Z-core represents the relative expression level of protein by color. Detailed information of the top 10 upregulated proteins arranged by fold change (FC) is provided in Table 1. Information of the top 10 downregulated proteins arranged by FC is listed in Table 2.

Heat map of the significant proteins in comparison of si-AURKB and psi-ctrl.
Top 10 Significant proteins (upregulated).

Top 10 Significant proteins (downregulated).
Changes of significant proteins by volcano plot
Volcano plot could be used to recognize changes in large data sets. Volcano plot was increasingly common in genomics, proteomics, and metabolomics experiments. In this study, we used volcano plot to display the significantly changed proteins. The expression of 92 proteins significantly increased such as interferon-induced GTP-binding protein Mx2 (MX2), interferon-induced protein 44-like (IFI44L), interferon-stimulated gene 20 kDa protein (ISG20), antiviral innate immune response receptor RIG-I (RIGI, also known as DDX58), tissue factor (F3), interferon-induced protein 44 (IFI44), endothelin converting enzyme 1 (ECE1), peroxisomal proliferator-activated receptor A interacting complex 285 (PRIC285), deaminated glutathione amidase (NIT1) and interferon-induced protein with tetratricopeptide repeats 2 (IFIT2), whereas that of 77 proteins such as high mobility group nucleosome-binding domain-containing protein 3 (HMGN3), transforming growth factor beta 2 (TGFB2), dimethylargininase (DDAH1), follistatin-related protein 1 (FSTL1) and FKBP prolyl isomerase 9 (FKBP9) were decreased as the volcano plot showed (Figure 3).

Different proteins shown by volcano plot. The red and green colors represent points-of-interest that show both large magnitude fold-changes and in x axis and high statistical significance in y axis.
GO analysis
GO analysis was employed to investigate more insight on the biological significance of DEPs between si-AURKB group and si-ctrl group. GO enrichment analysis showed biological processes included defense response to virus, response to virus, type I interferon signaling pathway, cellular response to type I interferon, response to type I interferon, viral life cycle, viral genome replication, negative regulation of cytokine production, negative regulation of viral life cycle and negative regulation of viral genome replication. The cellular components included focal adhesion, cell-substrate adherens junction, cell-substrate junction, endoplasmic reticulum lumen, nuclear pore, actin filament, host, host cell, other organism and other organism cell. Top 10 molecule function were guanyl nucleotide binding, nucleotidase activity, double-stranded RNA binding, 2′-5′-oligoadenylate synthetase activity, virus receptor activity, hijacked molecular function, GTP binding, purine ribonucleoside binding, purine nucleoside binding and ribonucleoside binding (Figure 4(a)).
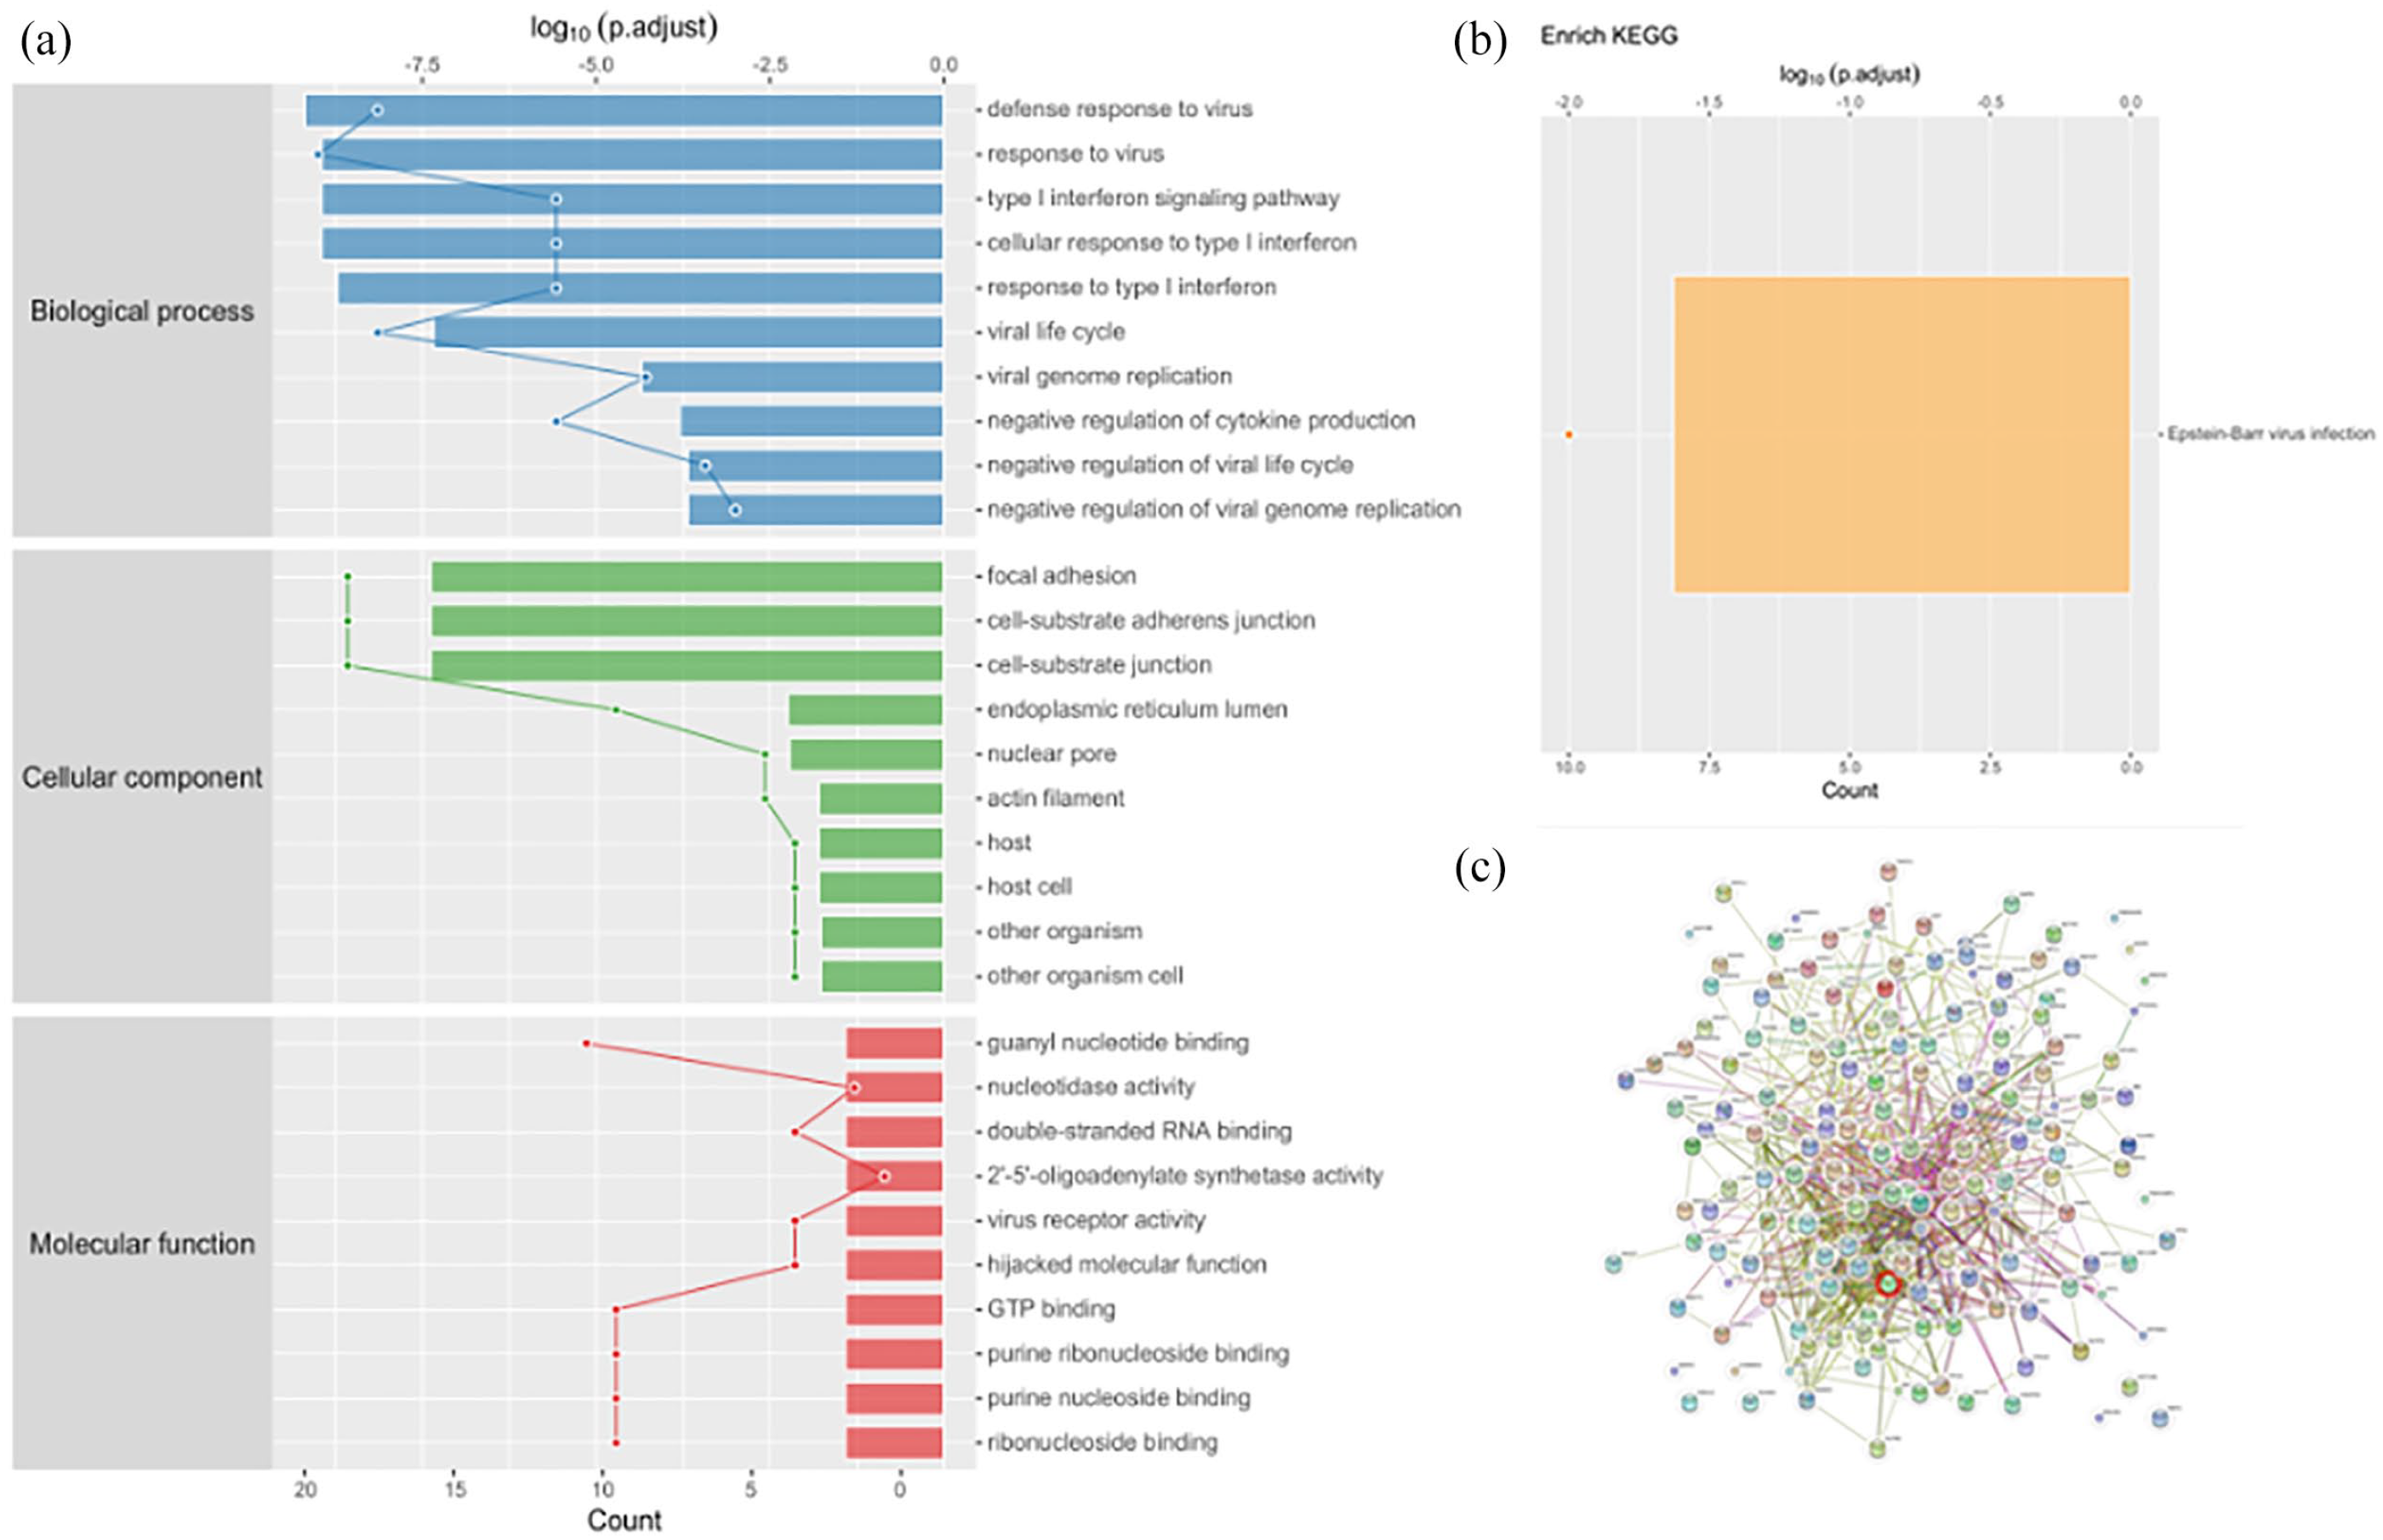
Bioinformatics results analysis. (a) Enriched GO items, the ontology covers biological process, cellular component and molecular function three domains. Top axis is log 10 (adjust p-value), bottom axis is the count of gene. (b) KEGG enrichment analysis of the alter proteins. KEGG enrichment reveals Epstein-Barr virus infection was involved. (c) Protein–protein network enrichment analysis was performed by search tool for the retrieval of interacting genes (STRING) to describe the significant proteins.
KEGG analysis
Different proteins coordinate with each other to exercise a series of biochemical reactions to perform biological functions. To examine which pathways and associated functions may be related with the expression of AURKB, KEGG enrichment analysis was performed and KEGG pathway mapping revealed Epstein-Barr virus (EBV) infection may be involved (Figure 4(b)). The significantly changed protein involved in Epstein-Barr virus infection including 2′-5′-oligoadenylate synthetase 3 (OAS3), 2′-5′-oligoadenylate synthetase 2 (OAS2), Janus kinase 1 (JAK1), transporter 1, ATP binding cassette subfamily B member (TAP1), Rac family small GTPase 1 (RAC1), and others.
Protein–protein interaction analysis
STRING 14 (https://cn.string-db.org/) could predict protein–protein interactions. Direct and indirect associations were included in the interactions. Edges represent protein–protein associations. The network of protein–protein interaction based on significance of DEPs between si-AURKB group and si-ctrl group is shown in Figure 4(c).
Discussion
AURKB plays the role of oncogene in many cancers such as gastric cancer, 15 colon cancer, 16 lung adenocarcinoma, 17 prostate cancer 18 and ccRCC. 19 Previous studies have reported that high AURKB expression indicated worse prognosis, and the expression of AURKB expression tended to rise with enhancing T stage and G grade of tumor. 20 AURKB is one of nine genes that related to poor survival of ccRCC analyzed by The Cancer Genome Atlas and Total Cancer Care data. 21 Bioinformatics analysis suggests that AURKB and KIF18B are closely related in ccRCC tissues, and when both of them are active they can accelerate the progression of ccRCC and indicate poor prognosis. 10 These studies suggested that AURKB may be a prospective target for the treatment of ccRCC patients.
Proteomics analysis was performed to explore the role of AURKB in RCC. One hundred sixty-nine significant proteins were identified between si-AURKB group and si-ctrl group. MX2, IFI44L, ISG20, DDX58, F3, IFI44, ECE1, PRIC285, NIT1, and IFIT2 are the top 10 upregulated significant proteins arranged by FC, and FKBP9, FSTL1, DDAH1, TGFB2, HMGN3, Coilin (COIL), RHO family interacting cell polarization regulator 1 (RIPOR1 also known as FAM65A), Tyrosine-protein phosphatase non-receptor type 14 (PTPN14), ADP ribosylation factor GTPase activating protein 2 (ARFGAP2) and argonaute RISC catalytic component 2 (AGO2, also known as EIF2C2) are the top 10 downregulated significant proteins. MX2, also known as MXB, the upregulation of MX2 is significantly related to the malignant phenotype of ccRCC and MX2 is a potential indicator for sunitinib resistance. 22 F3, also known as TF, postoperative serum levels of TF in patients with clear cell RCC were decreased and TF appears to be a potential marker of ccRCC. 23 IFI44 may be validated to identify high-risk patients who had worse prognosis than low-risk patients in ccRCC. 24 The expression of ECE-1 had no obvious difference between normal and tumor-affected tissue specimens from ccRCC patients, but the expression of ECE-1 was downregulated in PRCC tissues. 25 IFIT2 expression level was significantly lower in ccRCC tissues than in paracarcinoma tissues, and decreased expression of IFIT2 could predict poor survival in patients. 26 FSTL1 affects ccRCC through repressing the NF-κB and HIF-2α signaling pathways. 27 miR-200a was downregulated in renal cell carcinoma samples, and it suppressed RCC development via directly targeting TGFB2. 28 Bi-allelic loss of PTPN14 was found in parts of mucinous tubular and spindle cell carcinoma. 29
KEGG enrichment analysis was performed and revealed EBV infection may relate with the significant proteins. EBV as one of the most common viruses belongs to the Herpes family. EBV infects a large number of the population worldwide and relates to carcinogenesis with a common infection worldwide. EBV latent infection is lifelong and latently infected B cells transit the germinal center to transform resting memory cells according to germinal center model which is the model that explains EBV biology and the pathogenesis of lymphoma. Here, the virus remains stationary and occasionally reactivates to infect new B cells, finishing the infection cycle. 30 EBV lurks in lymphocytes for a long time and is separated from the cytoplasm through circular DNA, and it can integrate into the chromosome. A number of latent EBV expresses genes in the latent period and these genes may interact with oncogenes to cause host cell cycle disturbances, including G1/S transition, and suppression cell apoptosis, accelerating the advancement of EBV-related tumors. 31 Human EBNA1 binding protein 2 (hEBP2) binds to EBNA1, and hEBP2 is vital for the growth of human cells, inhibition hEBP2 could suppress the capacity of EBNA1 and EBV-based plasmids combine to mitotic chromosomes. 32 EBV is linked to various human cancers. EBV infection significantly increased the risk of breast carcinoma. 33 EBV infection decreases ferroptosis in nasopharyngeal carcinoma cells and EBV infection could activate p62-Keap1-NRF2 pathway and induce glutathione peroxidase 4 expression in nasopharyngeal carcinomacells, and GPX4 is related with chemoresistance in NPC cells infected with EB virus, and in multiple cancer patients with high expression of GPX4 is associated with poorer prognosis. 34 A high prevalence of EBV in prostate samples may indicate a possible association between EBV and the development of prostate cancers. 35 EBV affects the development of gastric cancer; EBV infection may induce the methylation of RASSF10 and promote cell growth in EBV-associated gastric cancer. 36 In EBV-associated hodgkin lymphoma patients, the EBV DNA load was related to prognosis; it may be a promising biomarker for EBV-positive Hodgkin lymphoma. 37 A subtype of intrahepatic cholangiocarcinoma was related to EBV. 38 There is increasing evidence that EBV infections may affect the risk and clinical course of malignancies; EBV infection is common in patients of RCC and it may add to the risk of high-grade RCC. 39 EBV-mediated RCC pathogenesis may have an association with the p65 NF-κB signaling pathway. 40 Previous studies showed that EBV was expressed in RCC and nephroblastoma, and the expression of EBV was related to RCC malignancy, suggesting that EBV may play an important role in RCC and nephroblastoma. 41 These reports suggested that EBV infection may represent a critical mechanism involved in the pathogenesis of RCC.
Although we have demonstrated the possible mechanisms of AURKB to the pathogenesis of RCC, this study had some limitations as well. Only one RCC cell line was used in this study; more RCC cell line and RCC tissues and their corresponding normal tissues should be used for the confirmation of the conclusion in the future. Moreover, we only performed the study in vitro; further validation of the conclusion is required through in vivo experiments.
Conclusion
By label-free quantitative proteomics, we found some differentially expressed proteins and pathway in RCC after knocking down AURKB. Collectively, this study shows the possible mechanisms of AURKB to the pathogenesis of RCC which may offer a theoretical basis for developing potential therapies of RCC.
Footnotes
Acknowledgements
Not applicable.
Author contributions
YL Li was responsible for the concept and design of the study; YL Li and Y Yang were involved with experimental and analytical aspects of the manuscript; YL Li and Y Yang undertook writing of the manuscript.
Declaration of conflicting interests
The author(s) declared no potential conflicts of interest with respect to the research, authorship, and/or publication of this article.
Funding
The author(s) disclosed receipt of the following financial support for the research, authorship, and/or publication of this article: This work was supported by Shaanxi Provincial People’s Hospital science and technology talent support program (2021JY-64).
Ethics approval
Not applicable.
Informed consent
Not applicable.
Trial registration
Not applicable.