
Abstract
Objectives:
Self-report measures of health literacy frequently encompass a group of conceptually distinct but related domains scored as either a single scale or separately for each domain. Psychometric studies of the 44-item Health Literacy Questionnaire, scored as nine separate scales, typically report the results of correlated factors confirmatory factor analyses as validity evidence. However, some scales are quite strongly correlated, raising the question of whether there is sufficient discriminant validity to warrant separate scoring. This psychometric study aims to contrast the results of fitting higher-order and bifactor models as alternative options to illuminate the issue.
Methods:
Correlated factors, higher-order and bifactor confirmatory factor analysis models were fitted to an Australian sample of responses to the Health Literacy Questionnaire (N = 813) using Bayesian confirmatory factor analysis methods.
Results:
All models representing a nine-factor structure for the Health Literacy Questionnaire fitted well. The correlated factors model replicated previous findings, showing inter-factor correlations between 0.19 and 0.93. A higher-order model showed relatively high loadings of all nine first-order factors on the second-order factor with particularly high loadings (⩾0.97) for three. Two bifactor models showed that the majority of Health Literacy Questionnaire items were multifactorial, each containing systematic variance from both a General Health Literacy factor and a domain-specific factor. Seven items from four scales were identified as strongly associated with the General Health Literacy factor, with item content suggesting that this factor indexes a broad sense of agency and efficacy in interacting with health-related information and healthcare providers.
Conclusion:
Contrasting correlated factors, higher-order and bifactor models fitted to the Health Literacy Questionnaire suggest that constituent items in self-report health literacy questionnaires might be anticipated to represent at least two sources of reliable and substantive common factor variance: variance associated with General Health Literacy and variance associated with a more specific domain, suggesting that items may be ‘irreducibly’ heterogeneous. Implications for test development and validation practice are discussed.
Keywords
Introduction
Multi-item questionnaires designed to be scored by summing or averaging across items to generate scale scores frequently encompass several distinct but related content domains. While the aim of using items from different but related domains is to ensure sufficient conceptual and situational coverage, there is ongoing debate about whether it is more appropriate to represent a multidimensional construct by creating a single score across all items of the questionnaire or by creating separate scores for each domain.1–4 Similarly, the intentions of scale developers vary: some seek to focus primarily on a single scale score using items from different domains to ensure conceptual range and avoid what R. B. Cattell called ‘bloated specifics’, 5 while others seek to represent the separate but related domains as stand-alone, albeit correlated, scales. 3
Health literacy has been theorised as both a single dimension, sometimes with items drawn from different but related content domains, and a multidimensional construct. 1 The Health Literacy Skills Instrument (HLSI) in both its long and short form6,7 is typical of the former while the Health Literacy Questionnaire (HLQ), the focus of this article, exemplifies the latter. 8 That is, the underlying conceptual model of the HLQ postulates health literacy to be a multidimensional construct, and consequently it has been developed as a multi-scale assessment. Other multidimensional HLQs have been developed including the European Health Literacy Survey (HLS-EU-Q)9,10 that is scored both as a single scale encompassing all items and as three sub-scales.
The HLQ comprises nine scales and was designed to assess a broad range of motivations and capabilities associated with the respondents’ self-perceived ability to access and understand health information and interact with the healthcare system. Since the original HLQ development article was published, 8 several studies of the English-language version and translations into European and other languages have replicated the nine-factor structure using structural equation modelling (SEM) approaches.11–17 Published analyses of the HLQ typically report results from one-factor confirmatory factor analysis (CFA) models as evidence of scale homogeneity and a nine-factor CFA model with correlated factors to support construct validity. A wide range of inter-factor correlations across the domains in the nine-factor models has been reported but with reasonably consistent estimates of equivalent correlations across studies.
The item content of the HLQ was based on clearly distinct concept clusters identified by the careful analysis/reanalysis of the results of concept mapping workshops and focus groups.8,18 However, analysis of the discriminant validity of the English-language scales using Farrell’s 19 criteria suggested that there may be insufficient discrimination between Part 2 scales 6, 7 and 8 to warrant separate scoring. 13 Similarly high inter-factor correlations have been noted in many translation studies.11–13,15,16 Elsworth et al. 13 commented that the apparent lack of discriminant validity between scales 6, 7 and 8 in their study could be indicative of a higher-order factor as all items in these scales ‘broadly connote a proactive approach to interactions with the healthcare system in relation to contact and collaboration with healthcare providers, navigating the system and obtaining information’. Furthermore, Nolte et al. 16 have suggested that ‘alternative model specifications, for example with higher-order factors or a bifactor solution, should be explored in future research’.
Alternative confirmatory factor analysis models
In psychometric studies of multi-scale assessments in fields such as health literacy, health-related quality of life (HRQoL) and other patient-reported outcomes, it is common practice to apply the correlated factors model to investigate an assessment’s factor structure. However, as suggested by Nolte et al. 16 for the HLQ, and Chen and Zhang, 20 Reise et al. 21 and Sheng and Wikle 22 among others more generally, several plausible alternatives potentially provide more nuanced and informative accounts of the associations between items and scales in these assessments. Most frequently studied is the higher-order factor model in which a smaller number of factors (typically only one) is hypothesised to account for the associations between a related group of lower-order factors which, in turn, account for the associations between the individual items. Another alternative is the bifactor model (also known as an ‘additive’, ‘direct-hierarchical’ or ‘nested factor’ model) in which a general factor that accounts for the commonality among all items is hypothesised along with two or more uncorrelated group factors that account for an additional portion of the common variance in restricted sub-sets of the items.2,3,22–24
McDonald and his colleague25,26 defined an ‘independent clusters structure’ as a ‘strong sufficient condition’ which, when taken together with establishing the scales of the exogenous variables in a measurement model, confirmed that the model was identified. An independent clusters structure is established when ‘each variable loads on only one common factor’, and is then called ‘. . . a pure indicator of the factor’ 26 (italics in original). It is important to note that, from McDonald’s 25 perspective, ‘. . . the multidimensional independent clusters model behaves just like a collection of unidimensional models, even though the traits are correlated’. In contrast, Lucke 27 discussed the idea of a ‘heterogeneous congeneric test’ in which each item might measure more than one attribute, and argued that ‘the complexity of psychosocial behaviour may require tests to be heterogeneous, perhaps irreducibly so, to maintain their reliability, validity, and predictive utility’ (emphasis added). Consideration of the typical causal representation of the correlated factors model (Figure 1(a)) suggests that the inter-factor correlations, designated by double-headed arrows, entail the likelihood that there are unmodelled common causes for each pair of congeneric item clusters in the model mediated through the latent variables identified by the clusters. (A congeneric model is one where the item true scores are linearly related but not necessarily equal, thus implying that all items load strongly on a single factor but that the factor loadings and item residual variances may vary. 28 ) In a multi-factor measurement model, each item is thus potentially associated with more than one source of systematic common factor variance: variance derived from its target construct (which may vary across items within the cluster given the definition of the congeneric model) and an unmodelled variance component derived from these common causes. The common causes might be substantive in the sense that they represent one (or more) broad-ranging or general factors as discussed in subsequent sections of this article or they might be common method biases, deriving from a wide range of potential artefactual covariances associated with item, scale, respondent and context characteristics.29,30

(a) Correlated factors model. (b) Second-order factor model. (c) Fully uncorrelated bifactor model. (d) Oblique bifactor model.
It is hypothesised that the inter-factor correlations observed in the CFA modelling of the HLQ to date result from an ‘irreducible heterogeneity’ 27 in the constituent items and that this heterogeneity arises from the presence of a substantive general factor that causally influences responses to all items, along with nine more restricted group factors that causally influence the distinct item clusters denoted by the separate HLQ scales. This article thus aims to contrast the inferences that have been drawn from the correlated factors models of the HLQ to those that can be drawn from higher-order and bifactor models to enable different perspectives on this potential heterogeneity. Does a comparison of these models clarify reasons for the high correlations among some of the latent variables in the correlated factors models and suggest possible ways forward to improve the psychometric development and evaluation of multi-construct assessments in health literacy and related fields?
Materials and methods
To test the hypothesis of the irreducible heterogeneity of the HLQ items, correlated factors, higher-order and bifactor CFA models were fitted to an Australian sample of responses to the HLQ (N = 813) using Bayesian CFA methods and an archived data set.13,31
The data
The HLQ
The HLQ contains 44 items arranged in two parts encompassing nine scales. Part 1 includes items for Domains 1. Feeling understood and supported by healthcare providers (4 items); 2. Having sufficient information to manage my health (4 items); 3. Actively managing my health (5 items); 4. Social support for health (5 items); and 5. Appraisal of health information (5 items). Part 2 comprises items for Domains 6. Ability to actively engage with healthcare providers (5 items); 7. Navigating the healthcare system (6 items); 8. Ability to find good health information (5 items); and 9. Understand health information well enough to know what to do (5 items). Items assessing Domains 1 – 5 are responded to along a 4-point ‘strongly agree – strongly disagree’ scale while items assessing Domains 6 – 9 are responded to on a 5-point scale of perceived difficulty (vs easiness) of accomplishing a specified task/activity. In the data tables to follow, items are labelled according to whether they are from Part 1 or 2 and then serially, within the separate parts, in the order they appear in the questionnaire (see, for example, Table 2). The HLQ was developed in Australia by Osborne et al. in 2013 with initial data from concept mapping, focus group discussions, expert review and CFA analysis of calibration (N = 634) and replication (N = 412) samples that supported the content and psychometric validity of the nine-factor structure. 8 Subsequent studies have corroborated various aspects of the construct validity of the English-language HLQ used in the present study for a variety of different purposes and contexts.13,31–34 See Supplemental Appendix 1 for a full list of the HLQ items; most are truncated for publication as required by the licencing agreement for use of the questionnaire.
The data set used for this study has been described extensively elsewhere.13,31,32 Briefly, responses to the HLQ and some sociodemographic questions were provided by 813 clients of eight diverse community-based agencies in Victoria, Australia between July 2013 and February 2014. Questionnaires were completed during the first phase of a project that developed and tested the Ophelia (Optimising Health Literacy and Access) process for the co-design of interventions to improve health literacy and equity of access to healthcare services. 32 Each healthcare agency selected a priority group of clients where health literacy was thought to contribute to inequitable service access or poor health outcomes. A detailed description of the priority group selected by each healthcare organisation is available in Beauchamp et al. 32 A small team of staff from each organisation collected data from a representative sample of clients within this group using consecutive sampling where feasible and employing various strategies for recruiting clients who are traditionally harder to reach and involve in research. A power analysis to determine sample size was not conducted for the study. Each of the eight participating agencies was asked to gather data on a minimum of 100 clients according to the selection criteria. 35 Further details on the participating organisations and sample are available in Beauchamp et al.31,32 Selection criteria were deliberately unrestrictive but required that participants should be cognitively able to provide informed consent to participate and be over the age of 18 years. Informal personalised training and ongoing support in recruitment strategies and selection of participants, obtaining consent, and a range of questionnaire administration options (including reading items aloud to respondents) was provided to the organisation staff by three senior members of the research team. Human Research Ethics Committee approval for the data collection for this study was obtained from Deakin University, 221 Burwood Highway, Burwood, Victoria 3125 (#2012-295); Royal District Nursing Service, Victoria (Project no. 138); Barwon Health regional health service (#2012-295 13/28); and Eastern Health regional health service (#LR84/1213). Informed written consent was obtained from each participant in this study.
Statistical analysis
Bayesian confirmatory factor analysis
All models were fitted using Bayesian structural equation modelling (BSEM) in Mplus, Version 8.5 36 following previous BSEM correlated factors modelling of these data. 13 BSEM is an application of Bayesian statistical analysis to CFA and SEM. 36 In a Bayesian analysis, the parameters of a SEM are conceived as variables, compared with the more typical ‘frequentist’ approaches where the model parameters are viewed as fixed population constants estimated from the sample under study. The distribution of the Bayesian parameters at the commencement of analysis is referred to as a ‘prior’ distribution, which can be ‘diffuse’ (non-informative) or ‘informative’. 36 Informative priors can be derived, for example, from previous studies, experience with similar data or expert judgement.
In typical applications of CFA by frequentist methods, possible correlations between item residuals and cross-loadings of items on factors not hypothesised by the model are fixed at exactly zero and subsequently estimated in a stepwise fashion if indicated by modification indices, thus allowing, post hoc, for a limited degree of item heterogeneity. In BSEM, informative priors can be used to represent, a priori, the expectation that these residual correlations and cross-loadings will be centred around zero with small variance, enabling non-hypothesised parameter estimates to have some ‘wiggle room’ 37 if theoretically appropriate while model identification is maintained. Non-informative priors are used for hypothesised parameters that will be fully estimated from the data (e.g. target factor loadings and inter-factor correlations). In the analysis, the information represented by the prior distribution is modified by the likelihood function of the data to form a ‘posterior’ distribution that contains the updated estimates of the model parameters resulting in a ‘compromise between the prior and the likelihood’. 36
Model fit is assessed by ‘posterior predictive checking’ that yields a chi-square-based fit statistic with a probability, denoted the ‘Posterior predictive p value’ (PPP), that can be assessed by the usual likelihood ratio test, and a 95% confidence interval (CI) for the difference in the chi-square fit statistics for the observed and updated (or replicated) data. A PPP of approximately 0.5 along with a CI where zero is close to the mid-point indicates excellent fit, 36 whereas a PPP of 0.05 is recommended as a reasonable lower limit. Model comparison is possible using the discrepancy information criterion (DIC), recommended by Asparouhov et al. 38 for comparison of BSEM models with informative small-variance priors instead of the more typically used Bayesian information criterion (BIC). A lower DIC indicates a better fitting model. All analyses utilised two Markov Chain Monte Carlo (MCMC) chains estimated using the Gibbs sampler and were run initially with 20,000 iterations, subsequently increased to 40,000, to check for stable convergence.36,39
Recent implementations of BSEM in Mplus also provide a ‘prior posterior p value’ (PPPP), a specific test of the hypothesis that parameters specified by a normally distributed prior (e.g. cross-loadings) are within the range of the small variance stipulated by the prior.40–42 Also, recent versions of Mplus provide validated Bayesian versions of the ‘approximate’ fit indices: root mean square error of approximation (RMSEA), comparative fit index (CFI), and Tucker–Lewis index (TLI), with 90% CIs for each and a significance test of the hypothesis that the RMSEA ⩽ 0.05. 43 The approximate fit indices are recommended for use when the sample size is large and are ‘. . . intended to circumvent a deficiency of rigorous testing procedures such as the chi-square test of fit which can reject a model even when the model misspecifications are minor, i.e., substantively insignificant’. 43 The recommended strategy is to use the CIs of these indices by inspecting their range. If the upper value of the CI of the RMSEA falls above 0.05 and the lower values of the CI for the CFI and TLI fall below 0.95 then model rejection is indicated.
The correlated factors model
As a reference point for the subsequent analyses and to replicate previous findings 13 using the most recent strategy for Bayesian SEM recommended when using Mplus,38,43 a correlated factors model was fitted to the data. The nine HLQ factors were identified by fixing the loading of the first indicator of each hypothesised item cluster to 1.0. Selection and setup of appropriate residual variances and small-variance priors for residual covariances and cross-loadings followed recent recommendations. 38 A ‘sensitivity’ analysis was conducted by systematically varying the degrees-of-freedom for the priors for the cross-loadings and item residual covariances. 36 The analysis suggested that a model with df = 200 for the Inverse-Wishart covariance priors and a variance of 0.01 for the Normal cross-loading priors provided a suitable solution with good fit across all indices.
The higher-order factor model
Higher-order factor models were used in early factor analysis research in psychology across several fields of study including the structure of intelligence, 44 personality 45 and attitudes. 46 A typical strategy employed exploratory factor analysis to extract a group of ‘first-order’ oblique factors, the correlations among which were then factored to yield one or more ‘second-order’ factors. A CFA solution to a second-order factor model was introduced by Jöreskog. 28 In the second-order model ‘. . . the first-order factors are linear combinations of the second-order factors plus a unique variable for each first-order factor. The observed variables are linear combinations of the first-order factors plus a residual variable for each observed variable’. 47 For the confirmatory model to be identified and thus yield a unique solution, the scale of each first-order factor is constrained by fixing the loading of one item in the cluster to 1.0, thus enabling estimation of the unique variances (disturbances) of the first-order factors. 48 For identification of the second-order factor, the loading of one first-order factor can be set to 1.0 or, alternatively, as in the present analysis, the variance of the second-order factor can be constrained to 1.0.
Both exploratory and confirmatory higher-order models have been used intermittently to study the factor structure of responses to health-related questionnaires across diverse fields of study. For example, Lee and Lee 49 fitted a CFA model with a single second-order and three first-order factors (representing their hypothesis distinguishing ‘functional’, ‘communicative’ and ‘critical’ aspects of health literacy) to the responses of 459 adults to the Korean version of the European Health Literacy Survey (HLS-K). The higher-order model was found to be a satisfactory fit to the data using maximum likelihood estimation in the AMOS SEM program.
To investigate further the hypothesised heterogeneity of the 44 HLQ items, a second-order factor model was fitted to the HLQ data using the same BSEM prior settings as for the correlated factors model. A single higher-order factor models the possibility that the inter-factor correlations in the correlated factors model represent a single common cause of the item clusters.
Bifactor modelling
The idea of a bifactor model was introduced by Holzinger and Swineford 50 who defined it as follows: ‘The Bi-factor pattern is . . . a theoretical frame of reference in which a general factor is assumed to run through all variables with specific factors in each variable, but in addition, a number of uncorrelated group factors, each through two or more variables, are also included. The minimum number of factors of these three types for n variables may then be briefly summarized as follows: one general factor, n specific factors, and q group factors where q is usually much smaller than n’. 50 The bifactor model thus posits that each item in a multi-item questionnaire designed to measure a group of related constructs comprises two sources of common factor variance: variance associated with a general factor that runs through all items, and variance associated with one group factor that defines the content common to a smaller cluster of items. Thus, a bifactor model may be applicable when a general factor is hypothesised (or suspected) to be present along with multiple group factors and potentially results in a theoretically stronger and more practically useful explanation of the observed relationships than a correlated factors or higher-order model.3,51
A study by Fong and Ho 52 provides an illuminating example of the Bayesian approach to both correlated factors and bifactor analysis. Using the Mplus 7 program, the authors analysed the responses of two independent samples (community adults and breast cancer patients) to the 14-item Hospital Anxiety and Depression Scale (HADS). Small variance priors were used in a series of analyses that fitted bifactor models with (a) exact zero cross-loadings and residual correlations; (b) exact zero residual correlations and small-variance priors for cross-loadings; and (c) small variance priors for both cross-loadings and residual correlations. Similar BSEM analyses were applied to both two-factor and three-factor correlated factors models. Analogous frequentist CFA analyses using maximum likelihood estimation were also conducted. The frequentist analyses (with no model modifications) showed, at best, marginally satisfactory fit when assessed by the RMSEA and CFI (chi-square indicated unsatisfactory fit for all three models). However, all three BSEM models that included small-variance priors for both cross-loadings and residual correlations fitted the data well with very similar PPP and 95% CIs for the difference in the chi-square fit statistic between the actual and replicated data. The BIC for the two-factor model was the lowest and given also that this model had the smallest number of free parameters it was preferred over the others. Notably, all estimates of residual correlations and cross-loadings were within the prespecified 95% limits of −0.20 to 0.20, which suggests that they represented ‘values that are of an ignorable effect size’ 36 and thus yielded a ‘simple and parsimonious factor-loading pattern’. 52
Two bifactor models were fitted to the HLQ data. One model constrained all inter-factor correlations to zero while the other allowed for correlated group factors. Small-variance priors for residual correlations were included in both models with the same settings as those used in the correlated factors and second-order models. Considering exploratory bifactor analysis, Jennrich and Bentler 53 demonstrated that an oblique solution (a solution with correlated group factors but one that maintains the zero correlation between the general and group factors) provided a better resolution of a bifactor structure than a fully uncorrelated solution. Rather than allow a wholly data-driven estimation of the group factor correlations in an analogous CFA solution in the present study, a sensitivity analysis was used with appropriate small-variance priors to establish a model that yielded good fit and convergence while restricting the size of the group factor correlations to approach as closely as possible the theoretically ‘ideal’ fully uncorrelated bifactor structure.53,54 Cross-loadings using Normal priors were also allowed for in this oblique bifactor model.
In summary, four contrasting CFA models were fitted to HLQ data using BSEM. They included: a model with nine correlated first-order factors corresponding to the nine HLQ scales – see Figure 1(a); a higher-order factor model in which a single second-order factor was hypothesised to account for the intercorrelations among the nine first-order factors – Figure 1(b); and two bifactor models in which a general factor was hypothesised to account for variance in all HLQ items along with nine group factors hypothesised to account for variance in sub-sets of items corresponding to the nine HLQ scales. Correlations between the general factor and the group factors in both bifactor models were constrained to zero while correlations among the group factors were also constrained to zero in one model – Figure 1(c) – and allowed to correlate modestly in the other – Figure 1(d). All models allowed for ‘wiggle room’ in item residual correlations, while the correlated factors, second-order and bifactor models with correlated group factors (the oblique bifactor model) also allowed for ‘wiggle-room’ in potential cross-loadings and (for the oblique bifactor model only) correlations between the group factors.
Results
Among the total of 813 respondents 53% were female, 77% were aged 65 or over, 54% had completed secondary education and 33% were born in a country other than Australia. See Table 1 for more detail on the demographic and other characteristics of the respondents.
Respondent characteristics (N = 813, differences from the total are due to missing data on a specific variable).

Correlated factors model
Salient results for the correlated factors model are shown in Tables 2 and 3. Model fit was good by all criteria. In particular, the PPP was close to 0.5 with the 95% CI for the difference between the observed and replicated chi-square values approximately centred on zero. Further, the upper extent of the 90% CI of the RMSEA was clearly <0.05 while the lower extent of the CI for the CFI was >0.95 (Table 2). Various additional diagnostic indicators for model fit and convergence were examined (see Supplemental Appendix 2). The posterior predictive histogram and scatterplot of the observed and replicated chi-square values show good model fit with the observed-replicated difference clearly centred around a value close to zero and the scatterplot balanced around the 45 degree axis with approximately equal numbers of data points in the upper left and lower right quadrants. Furthermore, the Potential Scale Reduction (PSR) value decreased relatively smoothly over the sequence of iterations and remained consistently ⩽1.01 for the final 20,000. Appendix 2 also presents the posterior parameter trace and autocorrelation plots for a freely estimated factor loading and one constrained by a Normal prior to be approximately zero. The trace plot shows a single horizontal band with the two chains well integrated, while the autocorrelation plots show low and decreasing (to <0.1) autocorrelation between the thinned parameter estimates. Similar results were achieved for all parameters.
Standardised factor loadings for a correlated factors model of the Health Literacy Questionnaire.

Model fit: PPP = 0.48; 95% CI for the difference between the observed and replicated chi-square values = –118.40 to 136.81; PPPP = 0.97; RMSEA = 0.000 (0.000 – 0.016); CFI = 1.000 (0.997 – 1.000); TLI = 1.000 (0.990 – 1.000); DIC = 79641.88; N of free parameters = 1466.
Statistically significant (p < 0.05) factor loadings only shown. ‘Non-target’ loadings in italics.
U’stood = Feeling understood and supported by healthcare providers; 2. Suffic’t info = Having sufficient information to manage my health; 3. Active man’t = Actively managing my health; 4. Social supp’t = Social support for health; 5. Appraisal = Appraisal of health information; 6. Active eng’t = Ability to actively engage with healthcare providers; 7. Navigate = Navigating the healthcare system; 8. Good info = Ability to find good health information; 9. U’stand info = Understand health information well enough to know what to do.
Inter-factor correlations for the correlated factors model of the Health Literacy Questionnaire.

U’stood = Feeling understood and supported by healthcare providers; 2. Suffic’t info = Having sufficient information to manage my health; 3. Active man’t = Actively managing my health; 4. Social supp’t = Social support for health; 5. Appraisal = Appraisal of health information; 6. Active eng’t = Ability to actively engage with healthcare providers; 7. Navigate = Navigating the healthcare system; 8. Good info = Ability to find good health information; 9. U’stand info = Understand health information well enough to know what to do.
All target loadings in the correlated factors model were significant (p < 0.05) and, with one exception, >0.3 while all 12 significant cross-loadings were ⩽0.21. There were only five residual correlations >0.20, the largest being 0.26. The inter-factor correlations are shown in Table 3. All were positive, ranging between 0.19 and 0.93. As anticipated from previous results, the largest were among HLQ Part 2 Domains 6, 7 and 8, ranging from 0.79 to 0.93.
Second-order factor model
Model fit was satisfactory across all fit indices (see Table 4) while good model convergence and fit were verified by inspection of the additional diagnostic indicators as for the correlated factors model. The DIC was marginally smaller than that for the correlated factors model (ΔDIC = 2.37) but below a recently recommended cut-off (ΔDIC > 3.0) that would suggest the model with the smaller DIC was a superior fit. 55
Standardised loadings on the first-order factors in the higher-order model of the Health Literacy Questionnaire.

Model fit: PPP = 0.29; 95% CI for the difference between the observed and replicated chi-square values = –95.123 to 165.757; PPPP = 0.93; RMSEA = 0.009 (0.000 – 0.019); CFI = 0.999 (0.995 – 1.000); TLI = 0.997 (0.986 – 1.000); DIC = 79639.51; N of free parameters = 1439.
Statistically significant (p < 0.05) factor loadings only shown. ‘Non-target’ loadings in italics.
U’stood = Feeling understood and supported by healthcare providers; 2. Suffic’t info = Having sufficient information to manage my health; 3. Active man’t = Actively managing my health; 4. Social supp’t = Social support for health; 5. Appraisal = Appraisal of health information; 6. Active eng’t = Ability to actively engage with healthcare providers; 7. Navigate = Navigating the healthcare system; 8. Good info = Ability to find good health information; 9. U’stand info = Understand health information well enough to know what to do.
Factor loadings from this model on the first and second-order factors are presented in Tables 4 and 5. While all item loadings on the targeted first-order factors are statistically significant (p < 0.05), a considerable majority are a little lower than the corresponding loadings in the correlated factors model. However, there are also fewer significant cross-loadings. All loadings of the first-order factors on the second-order factor are large and significant (ranging between 0.60 and 0.98). Notably, three loadings are > 0.95 and, as might be anticipated, are associated with the three constructs that are most strongly associated in the correlated factors model: 6. Ability to actively engage with healthcare providers; 7. Navigating the healthcare system; and 8. Ability to find good health information.
Standardised loadings on the second-order factor in the higher-order model of the Health Literacy Questionnaire.

Statistically significant (p < 0.05) factor loadings and disturbances in bold type.
Table 5 also shows the proportions of variance in the first-order factors not explained by the second-order factor (the disturbances). The disturbances range from approximately 64% (3. Actively managing my health) to 5% (8. Ability to find good health information). While statistically significant, the unique variance in first-order factors 6, 7 and 8 is consequently small. The first-order factor loadings in the higher-order model thus represent two sources of reliable variance: 51 variance from the second-order factor and variance unique to the first-order factor. From a causal perspective, the second-order factor varyingly determines the first-order factors, which, in turn, determine the item responses (Figure 1(b)). In that sense, the second-order factor is ‘superordinate’ to the first-order factors and their constituent items. 51 As the disturbances of the first-order factors vary considerably in magnitude, it can be expected that their constituent items will, similarly, vary in the extent to which they contain the hypothesised general and group factor components of reliable variance.
The bifactor models
Both bifactor models were a good fit to the data using all criteria (Tables 6 and 7) and good model convergence and fit were verified by inspection of the additional diagnostic indicators (selected diagnostics for the oblique bifactor model are shown in Appendix 2 in the online Supplemental Material).
Standardised factor loadings for the bifactor model of the Health Literacy Questionnaire with uncorrelated group factors.
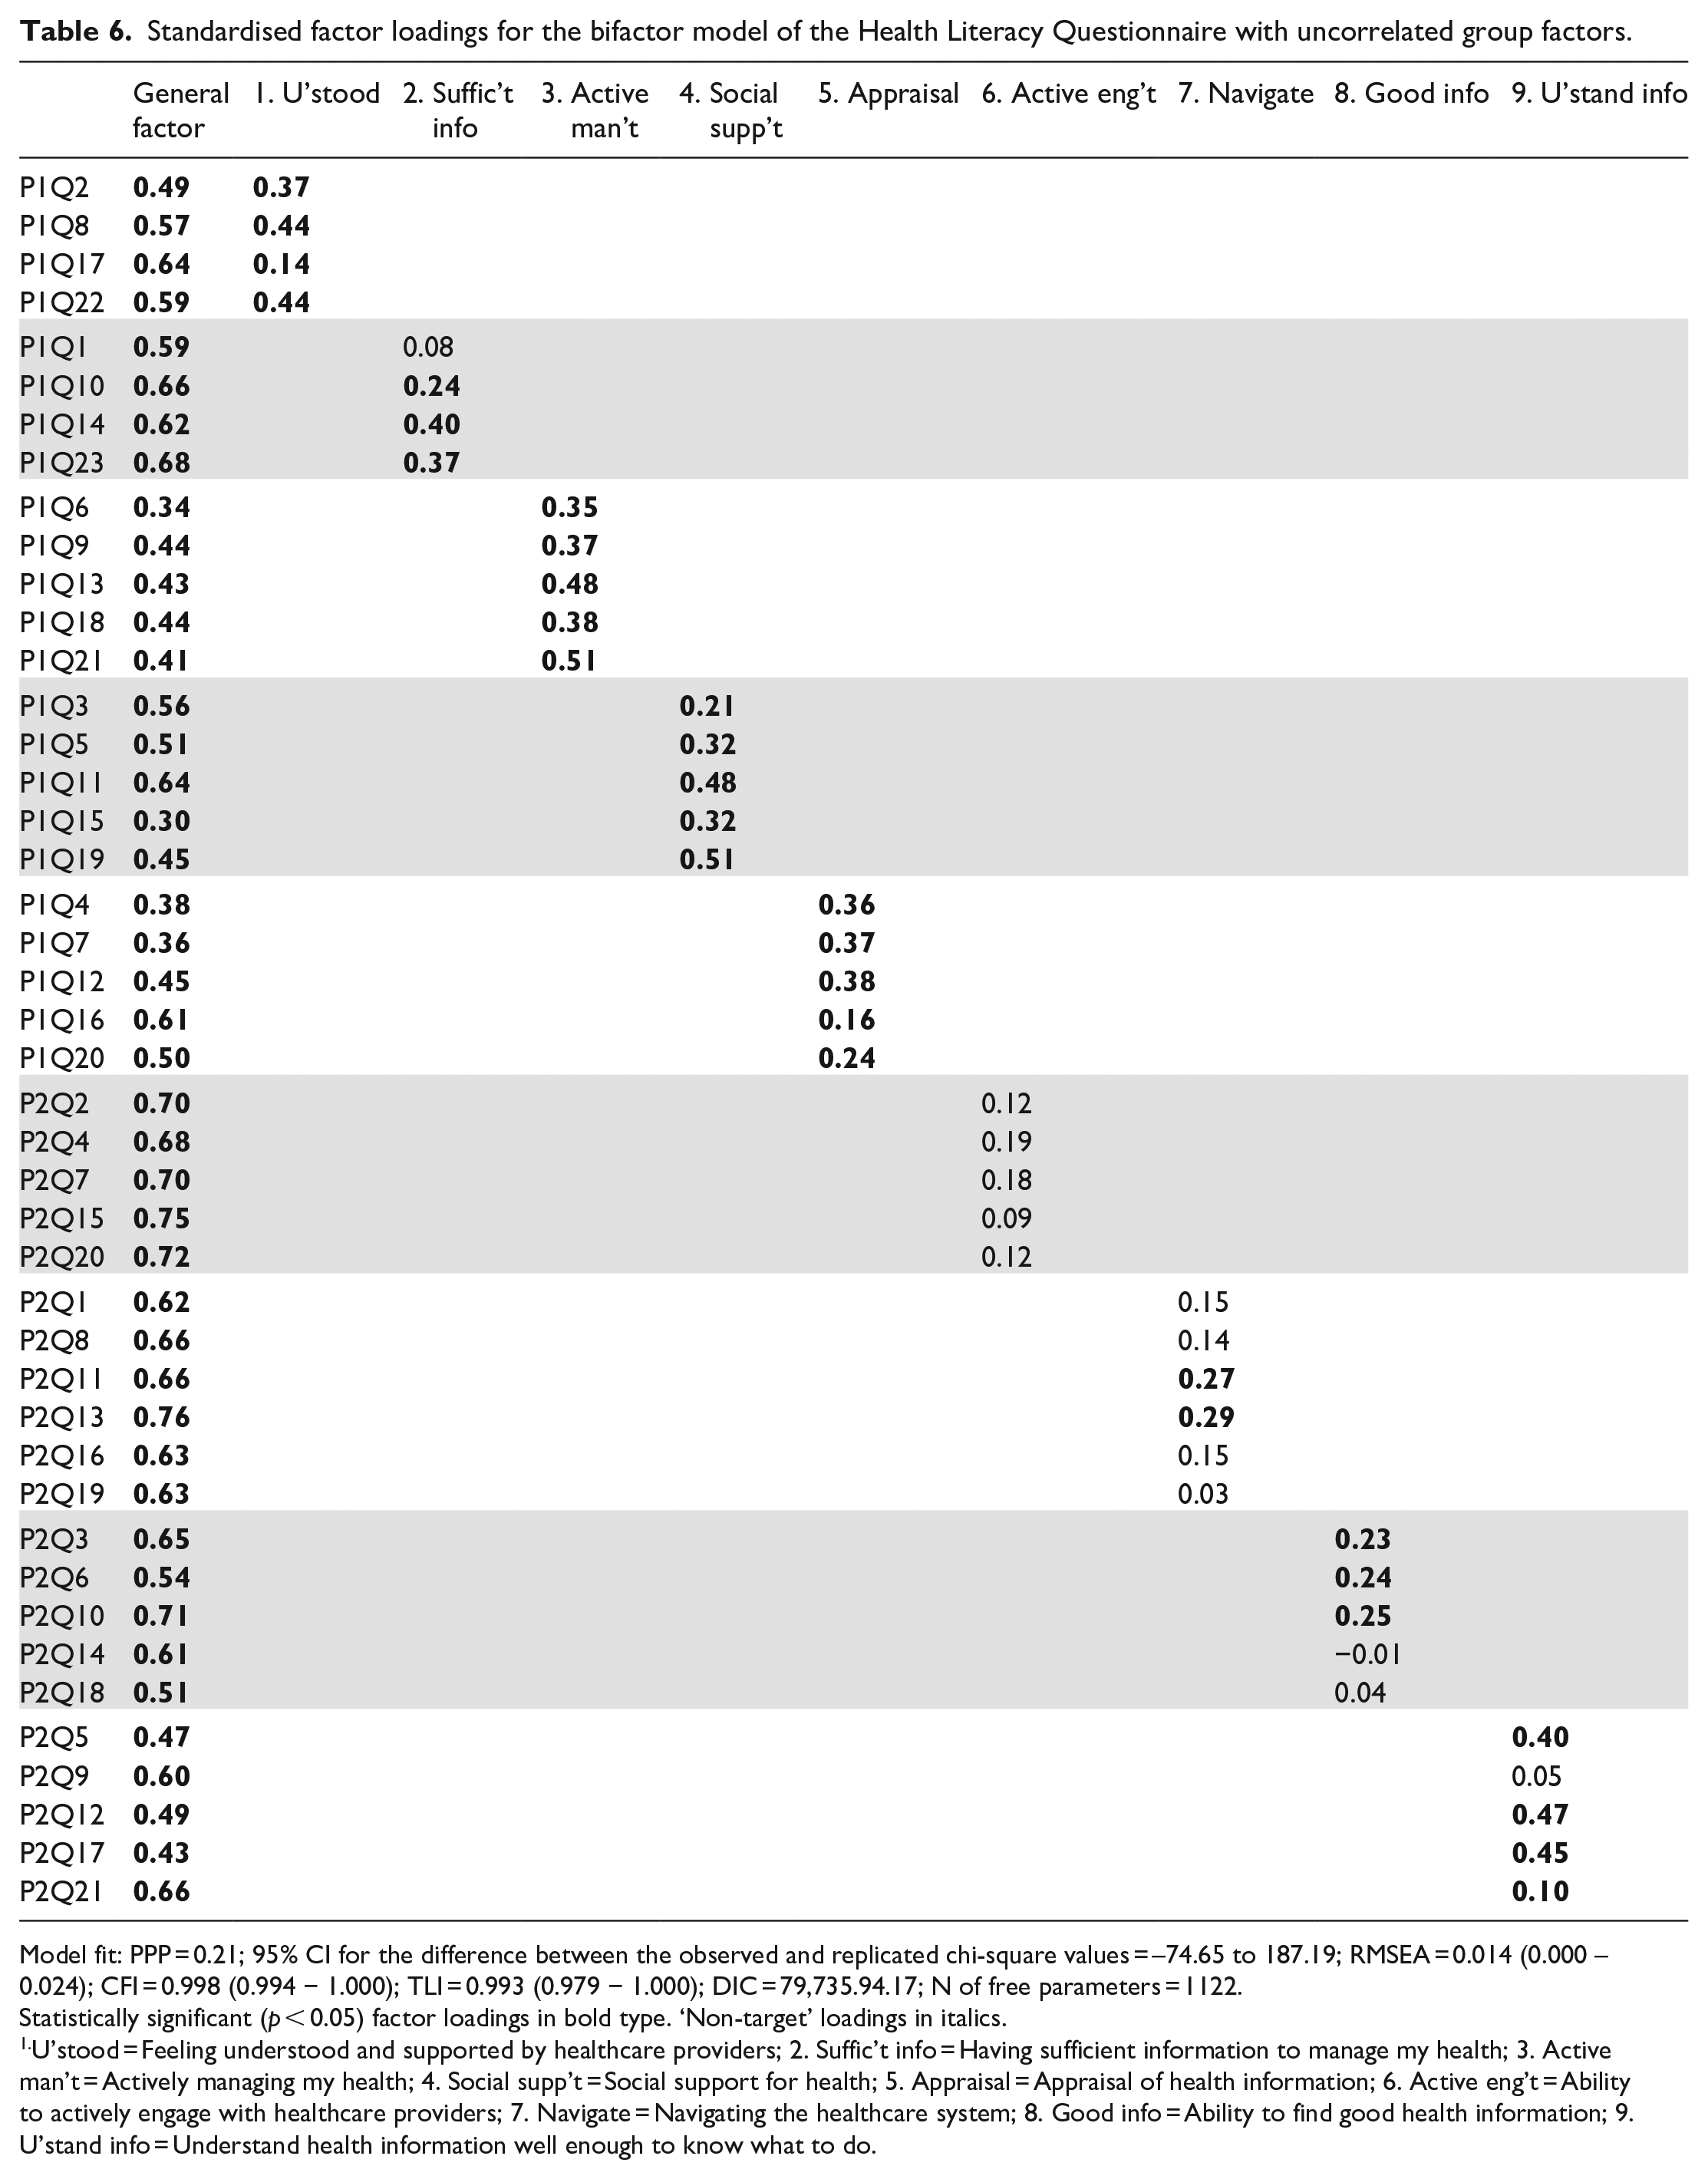
Model fit: PPP = 0.21; 95% CI for the difference between the observed and replicated chi-square values = –74.65 to 187.19; RMSEA = 0.014 (0.000 – 0.024); CFI = 0.998 (0.994 − 1.000); TLI = 0.993 (0.979 − 1.000); DIC = 79,735.94.17; N of free parameters = 1122.
Statistically significant (p < 0.05) factor loadings in bold type. ‘Non-target’ loadings in italics.
U’stood = Feeling understood and supported by healthcare providers; 2. Suffic’t info = Having sufficient information to manage my health; 3. Active man’t = Actively managing my health; 4. Social supp’t = Social support for health; 5. Appraisal = Appraisal of health information; 6. Active eng’t = Ability to actively engage with healthcare providers; 7. Navigate = Navigating the healthcare system; 8. Good info = Ability to find good health information; 9. U’stand info = Understand health information well enough to know what to do.
Standardised factor loadings for the bifactor model of the Health Literacy Questionnaire with correlated group factors.
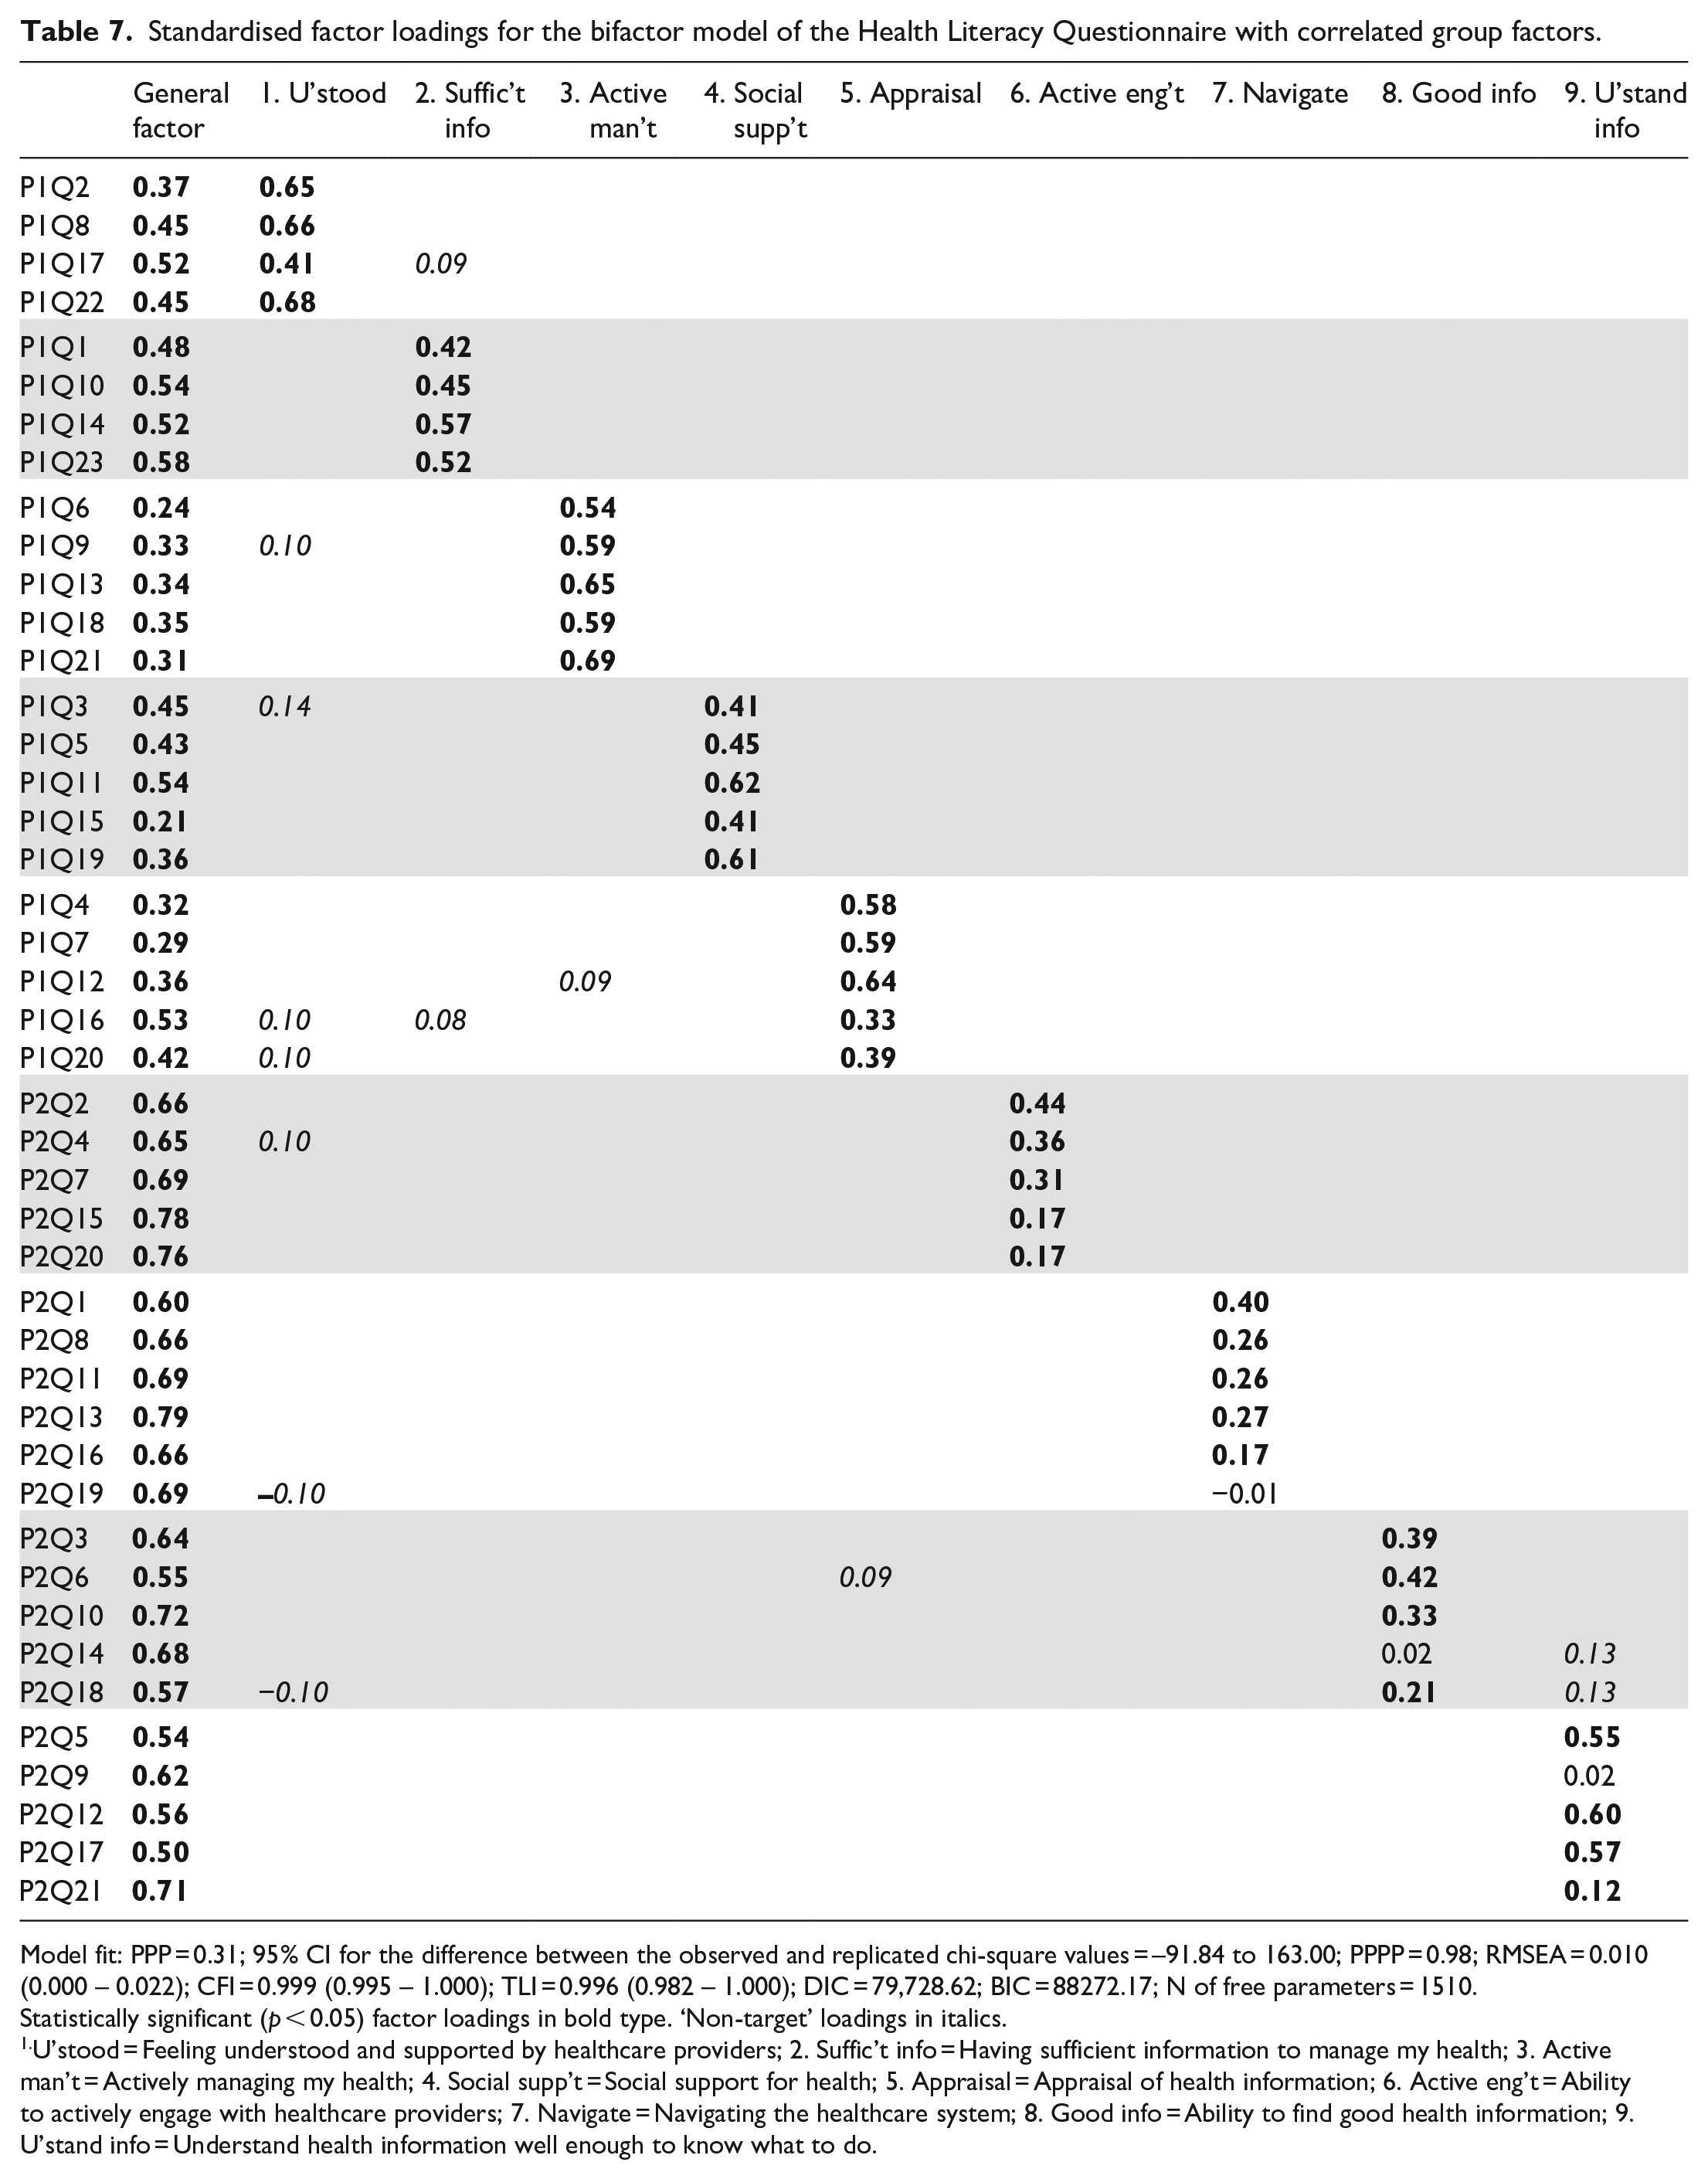
Model fit: PPP = 0.31; 95% CI for the difference between the observed and replicated chi-square values = –91.84 to 163.00; PPPP = 0.98; RMSEA = 0.010 (0.000 – 0.022); CFI = 0.999 (0.995 – 1.000); TLI = 0.996 (0.982 – 1.000); DIC = 79,728.62; BIC = 88272.17; N of free parameters = 1510.
Statistically significant (p < 0.05) factor loadings in bold type. ‘Non-target’ loadings in italics.
U’stood = Feeling understood and supported by healthcare providers; 2. Suffic’t info = Having sufficient information to manage my health; 3. Active man’t = Actively managing my health; 4. Social supp’t = Social support for health; 5. Appraisal = Appraisal of health information; 6. Active eng’t = Ability to actively engage with healthcare providers; 7. Navigate = Navigating the healthcare system; 8. Good info = Ability to find good health information; 9. U’stand info = Understand health information well enough to know what to do.
The fully uncorrelated bifactor model
While overall fit of the uncorrelated bifactor model was good according to all indices (Table 6), the DIC was noticeably higher (ΔDIC = 94.06, ΔDIC = 96.43) than for the correlated factors and second-order models, suggesting the latter were a superior fit. Factor loadings on the general factor (Table 6) were all statistically significant and ranged from 0.30 to 0.76 (average = 0.56). Items from Domain 6. Ability to actively engage with healthcare providers and Domain 7. Navigating the healthcare system had loadings on the general factor that were consistently higher than average. In contrast, loadings on the general factor were typically below average for the items that constituted Domain 3. Actively managing my health, while four items from Domain 5. Appraisal of health information had below average general factor loadings.
All but one of the target loadings on group factors 1–5 was statistically significant but all were noticeably smaller than analogous loadings in the correlated factors and higher-order models. Loadings on group factors 6–8 were relatively small and almost 70% were non-significant. Four loadings on group factor 9 were significant while two were small (one non-significant). In summary, this pattern of factor loadings suggests that the general factor was clearly associated with all HLQ items, but particularly with items associated with Domains 6, 7 and 8. The group factors representing the five scales in Part 1 of the HLQ with the ‘strongly agree’ to ‘strongly disagree’ response options were well defined by almost all their target items, although loadings were low in some instances. Except for Domain 9, however, the group factors representing the four scales in Part 2 of the HLQ with the ‘difficulty’ response options were less well-defined, with their constituent items being more strongly associated with the general factor.
The oblique bifactor model
The starting point for the analysis was the fully uncorrelated bifactor model discussed above. By varying the degrees of freedom for the inter-factor covariance priors, a satisfactory bifactor solution with good fit and rapid and satisfactory convergence was reached with df = 40 which resulted in correlations between the group factors that ranged from −0.30 to 0.46 (Tables 7 and 8). While the chi-square and approximate fit indices were comparable to those for the fully uncorrelated bifactor model, the DIC suggested a modest improvement in fit (ΔDIC = 7.32).
Correlations between the group factors from the oblique bifactor model of the Health Literacy Questionnaire.
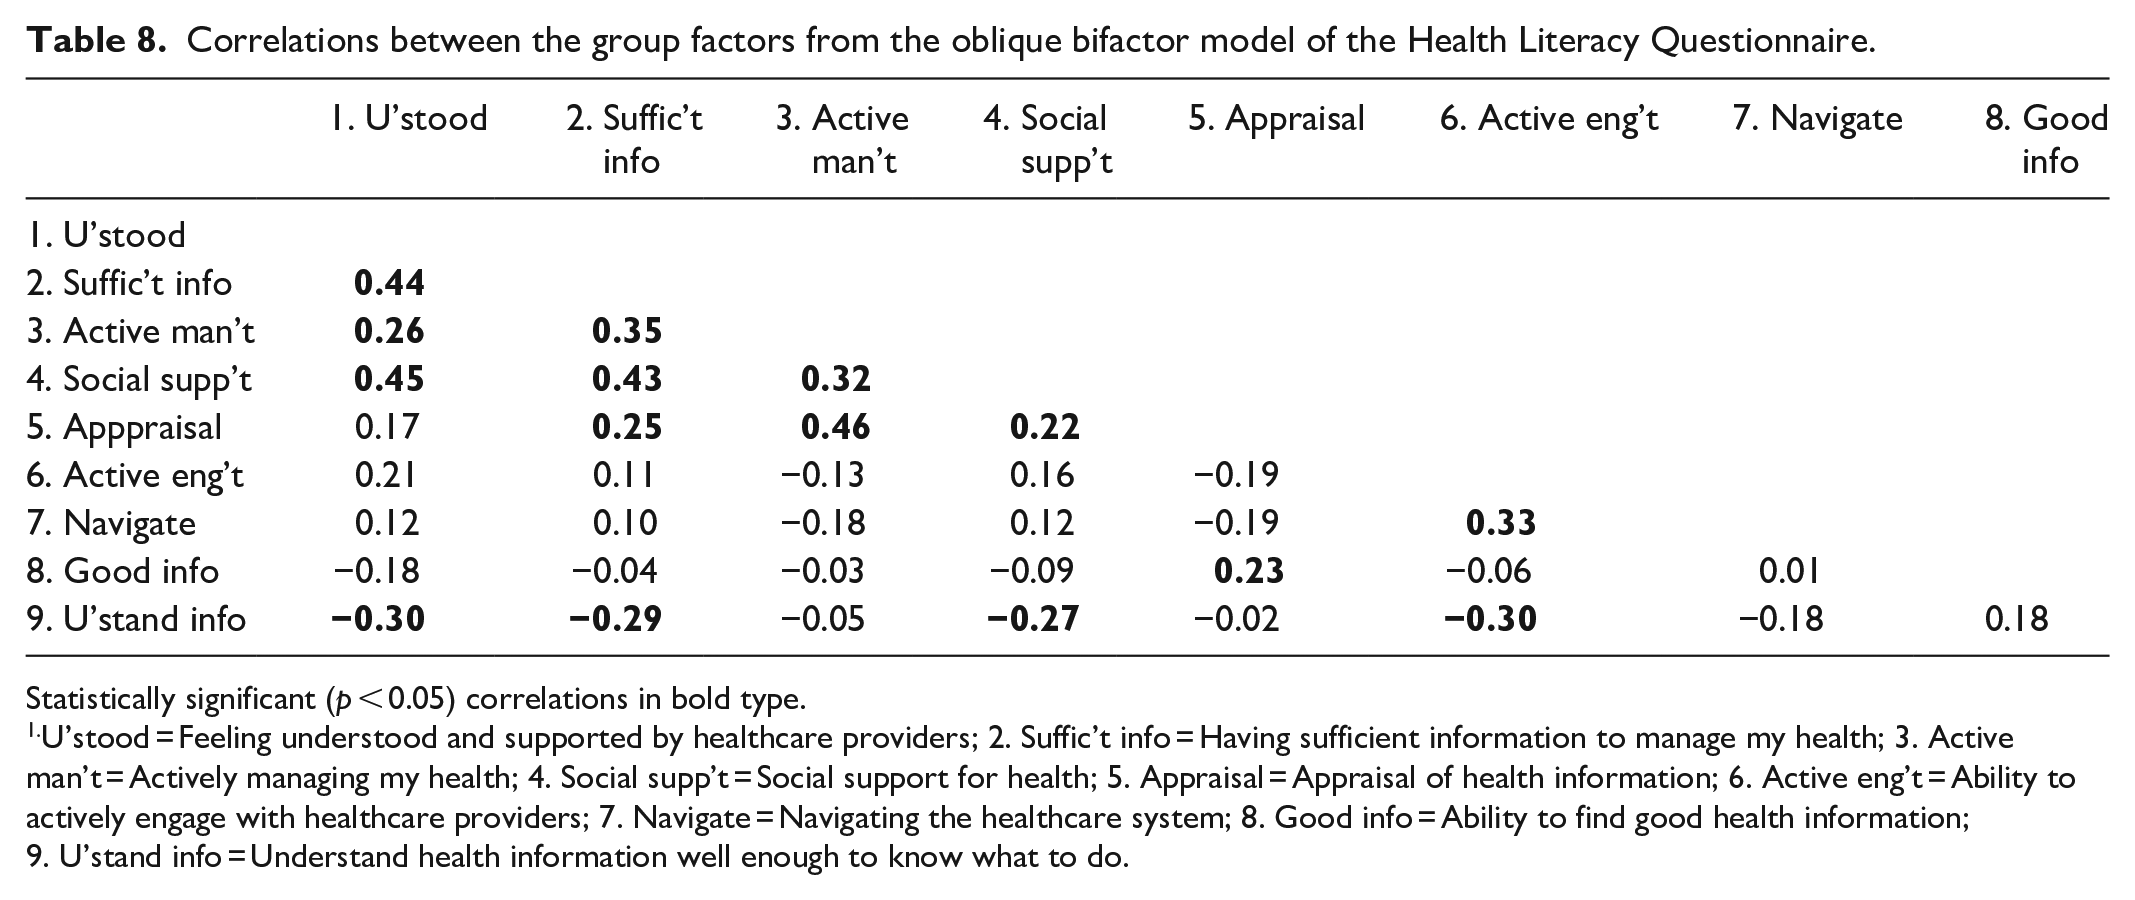
Statistically significant (p < 0.05) correlations in bold type.
U’stood = Feeling understood and supported by healthcare providers; 2. Suffic’t info = Having sufficient information to manage my health; 3. Active man’t = Actively managing my health; 4. Social supp’t = Social support for health; 5. Appraisal = Appraisal of health information; 6. Active eng’t = Ability to actively engage with healthcare providers; 7. Navigate = Navigating the healthcare system; 8. Good info = Ability to find good health information; 9. U’stand info = Understand health information well enough to know what to do.
All item loadings on the general factor and group factors 1–5, representing scales in Part 1 of the HLQ, were significant (p < 0.05), see Table 7. Group factors representing the scales in Part 2 were better defined than in the fully uncorrelated bifactor solution with generally higher loadings: all loadings on group factor 6 were significant while five of six target loadings on group factor 7, and four of five loadings on group factors 8 and 9 were significant. Most significant loadings on factors 7 and 8 were again relatively small but three of the significant loadings on factor 9 were quite substantial.
The relative strength of the item loadings on the general and group factors varied across the domains. Typically, general factor loadings from items targeted to Domains 1–5 were lower (range 0.21–0.58) than those from Domains 6–9 (range 0.50–0.79). All target group factor loadings on 3. Actively managing my health were higher than the equivalent loadings on the general factor while three of the four target loadings on 1. Feeling understood and supported by healthcare providers and four of five loadings from items targeted to Domain 4. Social support for health were higher than equivalent loadings on the general factor. For Domain 5. Appraisal of health information, three group factor loadings were higher than the equivalent general factor loadings while for 2. Having sufficient information to manage my health, one group factor loading was higher than the general factor loading and three were lower but none-the-less reasonably substantial. For Domains 6–8, all loadings on the general factor were higher than equivalent loadings on the relevant group factors while, in contrast, three of the five target group factor loadings on 9. Understand health information well enough to know what to do were higher than on the general factor. There was also a small number of significant cross-loadings, but the highest was 0.14 and so could be regarded as substantively trivial. There were three items where the loading on the target group factor was negligible while the equivalent loading on the general factor was substantial, and a further four where the target group factor loading was <0.20, again with substantial loadings on the general factor. All these items were in Domains 6–9 but spread across different domains. There were 55 significant correlated residuals (approx. 5.8%) however only 3 were >0.1, the largest being 0.34. Hence, with a very small number of exceptions, the correlated residuals can be regarded as substantively trivial.
Correlations between the group factors in the oblique bifactor model ranged from −0.30 to 0.46 (Table 8). All correlations between the group factors representing Domains 1–5 were positive with all but one statistically significant. Six of these Domain 1–5 correlations were >0.32, representing >10% of shared variance. This manifold of positive correlations suggests an additional common source of shared variance, possibly a method factor representing the ‘strongly agree’ to ‘strongly disagree’ response options of the Part 1 scales as distinct from the ‘task difficulty’ response options used for the Part 2 scales. Notably also, all but one of the correlations with the group factor representing Domain 9. Understand health information well enough to know what to do were negative suggesting that this central aspect of so-called ‘functional health literacy’ 50 may, to a certain extent, be independent of the other health literacy constructs measured by the HLQ.
In summary, correlated factors, second-order, and two bifactor models were fitted to responses to the HLQ using BSEM with each model representing a different perspective on the hypothesised initial nine-factor structure. All models fitted the data very well across multiple criteria. The correlated factors model replicated previous findings, showing inter-factor correlations ranging between 0.19 and 0.93. The second-order model showed relatively high loadings of all nine first-order factors on the second-order factor with particularly high loadings (⩾0.97) for three HLQ domains: 6. Ability to actively engage with healthcare providers; 7. Navigating the healthcare system; and 8. Ability to find good health information. A fully orthogonal bifactor model and one that allowed for modestly correlated group factors showed that the majority of HLQ items were multifactorial in that each contained systematic variance representing both the general factor and a domain-specific (group) factor. However, seven items from across Domains 6–8 were identified as strongly associated with the general factor with little or no association with a group factor.
Discussion
The primary aim of this article was to contrast higher-order and bifactor CFA models of responses to the HLQ to the typically studied correlated factors model to inform the issue of possible insufficient discriminant validity among some of the nine scales. If discriminant validity is threatened, observed relationships between measured constructs and both explanatory and outcome variables are potentially confounded, compromising the validity of both descriptive and causal inferences in policy-relevant and theory testing studies. ‘For example, the strength of a relationship could be overestimated, or a relationship may be confirmed when in fact there is no real relationship’. 19
Bayesian analysis of the factor structure of the HLQ has highlighted the complementary interpretations afforded by this model comparison. While all models fitted the data well across multiple criteria, the correlated factors and second-order models were preferred according to the DIC, the recommended index for BSEM comparison. However, as the aim of this study was to explore the theoretical and practical implications afforded by the comparison of alternative well-fitting models and not to locate a preferred factor model for the HLQ, all four models are respected in the following discussion. While each model gives a different perspective on the psychometric properties of the HLQ, the oblique bifactor model provides the strongest evidence for the hypothesised irreducible heterogeneity of HLQ items.
The correlated factors model, using the most recent recommendations for fitting Bayesian CFA models in Mplus, replicates previous findings that a nine-factor model is a good fit to the 44-item HLQ and that each construct is well represented by the target items. Also, in accordance with previous studies, the nine factors are variously (sometimes quite strongly) correlated, with the latent variable correlations in the present study ranging between 0.19 and 0.93.
The higher-order model shows a pattern of relatively high loadings of the nine first-order factors on the second-order factor, ranging from 0.60 and 0.98, with a consequently varying range of disturbances that represent the unique variances in the first-order domains. The item loadings on the first-order factors thus represent two sources of reliable variance: (a) variance determined by the second-order factor mediated through the first-order factors and (b) variance associated with other systematic influences on the first-order factors. 51 The HLQ domains that are typically the most strongly correlated in correlated factors models show the strongest loadings on the second-order factor and the smallest disturbances. From a causal perspective (Figure 1(b)) the second-order factor exerts the strongest influence on HLQ Domains 6. Ability to actively engage with healthcare providers, 7. Navigating the healthcare system, and 8. Ability to find good health information. In contrast, as indicated by its lower loading and higher disturbance, Domain 3. Actively managing my health is the least strongly influenced by the second-order factor. While the relative importance of these two sources of influence on the first-order factors can be determined from their loadings and disturbances, the second-order model does not afford the opportunity to directly partition the first-order loadings of the item responses in a similar manner. However, this partitioning can be achieved by a bifactor model as the influence of a general factor on the items is ‘partialled out’ from the influence of the group factor. 51
In the bifactor models (Figure 1(c) and (d)) the general and group factor constructs together directly determine variance in the questionnaire items. Both models, but the oblique bifactor model in particular, show that most of the HLQ items are ‘bifactorial’ in the sense that they contain two predominant sources of systematic variance: variance shared with all other items in the questionnaire and variance associated with a more specific health-related capability. Three features characterise the general factor in the oblique bifactor model: first, all HLQ items have statistically significant and generally substantial loadings on it; second, items associated with the Part 2 scales, where the response options range from ‘cannot do’ to ‘very easy’ rather than ‘strongly agree’ to ‘strongly disagree’, have generally higher loadings on it; third, the three items that lose virtually all their systematic variance to the general factor (P2Q19, P2Q14, P2Q9) together with the four items that have group factor loadings <0.2 (P2Q15, P2Q20, P2Q16, P2Q21) suggest a general underlying theme of agency and efficacy in relation to health-related challenges. (In truncated form, the seven items are: Work out what is the best care . . .; Get health information in words . . .; Accurately follow the instructions from . . .; Discuss things with healthcare providers . . .; Ask healthcare providers questions . . .; Find out what healthcare services . . .; Understand what healthcare providers . . ..)
This perspective clarifies the factorial complexity of the HLQ items, showing that nearly all share two principal sources of common factor variance: one from the general factor and another from one group factor. The ratio of the extent of saturation of each item by these two sources of common factor variance differs across item clusters, clearly favouring the general factor in most items and clusters associated with Part 2 of the questionnaire (i.e. those items responded to along a ‘task difficulty’ continuum). This explicit association of item meaning with task difficulty (or success) taken together with the specific items that load uniquely or strongly on the general factor in the oblique bifactor model supports the conclusion that the general factor could be assessing an overall sense of ‘agency and efficacy’ concerning the challenges posed by addressing one’s health concerns and interacting with the healthcare system.
The pattern of loadings on the second-order factor in the higher-order model supports a similar interpretation of the general factor with higher loadings from first-order factors 6. Ability to actively engage with healthcare providers; 7. Navigating the healthcare system and 8. Ability to find good health information. A very similar ‘sub-theme’, labelled ‘Self-efficacy in processing and using health information’ was recently identified in a comprehensive literature review of the evolving meaning of health literacy, but was viewed as a component or ‘element’ of health literacy and not, as here, as a potentially broad explanatory concept. 56 But this general sense of agency and efficacy may not necessarily translate into the perception of successful day-to-day action to self-manage health, nor to understand health information sufficiently well to take this action (the first-order factors representing Domain 3. Actively managing my health and Domain 9. Understand health information well enough to know what to do had the highest disturbances in the higher-order model, suggesting there are important causal influences on these domains that are independent of the second-order factor).
Recent theory arising from a renewed interest in CFA models that incorporate a general factor suggests that potential issues with discriminant validity frequently observed in correlated factors modelling of multi-construct questionnaires is indicative of a possible irreducible heterogeneity in individual items and item clusters.27,57 The designation ‘General Health Literacy’ seems appropriate to describe the general factor in both the higher-order and bifactor models studied here (see, for example, Byrne and colleagues’ use of ‘general factor of Depression’ or, more simply, ‘general Depression’ in their work on the higher-order factor structure of responses to the Beck Depression Inventory58,59).
Acceptance of an essentially irreducible heterogeneity in self-report questionnaire items in health raises challenging questions for scale construction, data analysis and valid interpretation of observed relationships. While many self-report questionnaires contain items that range across different but related domains to achieve conceptual and situational coverage in the measurement of a single extensive construct, others aim to develop a set of measures of separate components of this general domain, accepting that the resulting scales may be correlated. The results of this study have demonstrated that these inter-scale correlations may obscure the presence of a substantive general factor that could arguably compromise both the validity of inferences drawn from observed associations with external variables and policy decisions based on the interpretation of population or group scores on a scale purporting to measure a more focussed health literacy construct. In a heterogeneous scale, is it the variance from the general factor, the group factor, or a combination of both that is underpinning an observed association or inference about practice? In scale development, fitting higher-order and bifactor models, in addition to the typically used correlated factors model, would assist researchers to understand the nature of any embedded heterogeneity in the items. At the least, this would alert potential scale users to the issue of possible confounding that may arise from use of the developed scales and, during scale development, may facilitate the selection of items and response options that maximise group factor variance and thus reduce variance associated with a general factor as well as the correlations between scales based on the group factors.
Concerning the HLQ specifically, the question remains whether there is sufficient discriminant validity among the nine scales to warrant separate scoring. Results of the oblique bifactor model suggest clearly that items associated with all nine constructs contain reliable variance that is uniquely associated with the more focused (i.e. the hypothesised scale specific) construct independent of General Health Literacy. Overall, the HLQ items contain a balance of common factor variance associated with General Health Literacy and one domain-specific group factor, but this balance varies across content domains. When the group factors are allowed to correlate in the oblique bifactor model, loadings of the Part 1 items on the group factors are higher for approximately 70% of the items. In addition, three of the five items constituting Scale 9 load more strongly on the relevant group factor and at least three items in scales 6–8 show statistically significant and meaningful group factor loadings. It is currently recommended that the HLQ is scored as nine separate constructs rather than as a single total scale score and, despite concern that there may not be unambiguous discrimination between some HLQ scales in some specific contexts, we believe the results of the present study support this practice. However, users should keep in mind that separate scale scores will contain variance associated with the general factor along with the specific domain of interest. This will particularly be the case for the scales in Part 2 of the questionnaire and users should analyse and interpret their results accordingly. In one common application, the HLQ is recommended as a needs assessment in the Ophelia process of collaborative intervention development. 35 Cluster analyses of HLQ responses are used to develop health literacy profiles of contrasting groups of clients from participating healthcare organisations. Published cluster analyses in practical applications such as Ophelia show quite diverse profiles of health literacy strengths and weaknesses across very different communities, indicating that valuable discrimination is achieved between the nine HLQ constructs and suggesting that further research on the discriminant validity of the scales is warranted.60–62
Limitations and future directions
The present study investigated whether alternative CFA model specifications for the HLQ would enhance understanding and offer a possible explanation for the inter-factor correlations typically observed in validity studies of the scales in correlated factors analyses. The study, however, was limited to data gathered using the English-language version in one Australian state. The HLQ has been translated into more than thirty languages and used with very different population groups including: patients with chronic conditions in a range of European countries contributing to World Health Organisation sponsored Health Literacy Demonstration Projects, rural fishing communities in Egypt, health science students in Nepal, Urdu-speaking Pakistani migrants living predominantly in the eastern states of Australia, and Aboriginal and Torres Strait Islander peoples with chronic disease in a remote city in northern Australia.63–67 Future studies should be conducted to replicate the present CFA modelling (in particular to replicate the structure of the second-order and bifactor models) in the widely varying contexts in which the questionnaire is used.
As mentioned above, a power analysis was not conducted for this study. However, in a comprehensive study of the power of BSEM in samples of 100, 200 and 500 where informative small-variance priors are used for residual correlations and cross-loadings, Muthén and Asparouhov 36 showed that the power of the BSEM approach to detect model misspecifications is excellent at a sample size of 500. Further, the PPP index of model fit was found to have sufficient power to detect important model misspecifications at small sample sizes. The sample size of the present study is 813, hence we argue it has sufficient power to accurately estimate model fit using the PPP and provide plausible estimates of all model parameters.
In addition, the present study did not investigate other quantitative aspects of validity evidence for the use of the HLQ in diverse contexts such as relationships with other relevant variables (e.g. explanatory sociodemographic factors and anticipated outcomes). The carefully justified choice of appropriate statistical approaches and models for studies of this kind appears to be critically important for self-report data in health where a general factor in addition to two or more group factors is suspected and should be incorporated into further research programmes on the development and use of multidimensional health literacy assessments.
Conclusion
Constituent items in HLQs might be anticipated to represent at least two sources of reliable and substantive common factor variance: variance associated with General Health Literacy and variance associated with a more restricted response domain. Evidence of insufficient discriminant validity is consequently best evaluated within a broader psychometric framework, problematising whether the development of ‘pure’ homogeneous questionnaire items in the psychosocial field is indeed achievable, and thus accepting the possibility that items will inevitably be conceptually heterogeneous. It is argued that this understanding should be incorporated into test development and validation practice, particularly when questionnaires are planned that target separate but related domains as potentially stand-alone, albeit correlated, scales.
Supplemental Material
sj-docx-1-smo-10.1177_20503121221124771 – Supplemental material for Modelling variance in the multidimensional Health Literacy Questionnaire: Does a General Health Literacy factor account for observed interscale correlations?
Supplemental material, sj-docx-1-smo-10.1177_20503121221124771 for Modelling variance in the multidimensional Health Literacy Questionnaire: Does a General Health Literacy factor account for observed interscale correlations? by Gerald R Elsworth, Sandra Nolte, Christina Cheng, Melanie Hawkins and Richard H Osborne in SAGE Open Medicine
Supplemental Material
sj-docx-2-smo-10.1177_20503121221124771 – Supplemental material for Modelling variance in the multidimensional Health Literacy Questionnaire: Does a General Health Literacy factor account for observed interscale correlations?
Supplemental material, sj-docx-2-smo-10.1177_20503121221124771 for Modelling variance in the multidimensional Health Literacy Questionnaire: Does a General Health Literacy factor account for observed interscale correlations? by Gerald R Elsworth, Sandra Nolte, Christina Cheng, Melanie Hawkins and Richard H Osborne in SAGE Open Medicine
Footnotes
Acknowledgements
The authors thank the Victorian Department of Health and Human Services and the participating healthcare organisations for their commitment and support for the study.
Declaration of conflicting interests
The author(s) declared no potential conflicts of interest with respect to the research, authorship, and/or publication of this article.
Ethical approval
Ethical approval for this study was obtained from Deakin University, 221 Burwood Highway, Burwood, Victoria 3125 (#2012-295); Royal District Nursing Service, Victoria (Project no. 138); Barwon Health (#2012-295 13/28); and Eastern Health (#LR84/1213).
Funding
The author(s) disclosed receipt of the following financial support for the research, authorship, and/or publication of this article: The project was funded by a peer-reviewed nationally competitive Australian Research Council (ARC) Linkage Project grant, with partnership funding from the Victorian Department of Health and Human Services (DHHS), Deakin University and Monash University. RHO was funded in part through a National Health and Medical Research Council (NHMRC) of Australia Principal Research Fellowship (grant no. APP1155125).
Informed consent
Informed written consent was obtained from each participant in this study.
Supplemental material
Supplemental material for this article is available online.
References
Supplementary Material
Please find the following supplemental material available below.
For Open Access articles published under a Creative Commons License, all supplemental material carries the same license as the article it is associated with.
For non-Open Access articles published, all supplemental material carries a non-exclusive license, and permission requests for re-use of supplemental material or any part of supplemental material shall be sent directly to the copyright owner as specified in the copyright notice associated with the article.