
Abstract
Objectives:
The purpose of conducting this study was to assess fatty liver disease and its correlation with glycemic control in type 2 diabetes mellitus patients. In addition, evaluation of associated factors and correlation analysis between the fatty liver index and hemoglobin A1C level in patients with type 2 diabetes mellitus was another aim of this study.
Methods:
A hospital-based cross-sectional study was conducted among type 2 diabetes mellitus patients attending at diabetes clinic of Dessie Comprehensive Specialized Hospital located in south Wollo, Ethiopia. It was conducted from July to August 2021. The fatty liver index was calculated to assess fatty liver disease. Simple descriptive statistics, multivariate analysis, and an independent sample t-test were utilized for statistical analysis. Multiple logistic regression analysis was used to determine the associated factors of fatty liver. The p value < 0.05 was considered as statistically significant.
Results:
In this study, the mean ± standard deviation values of body mass index among type 2 diabetes mellitus patients were 25.82 ± 3.64, 28.04 ± 2.43, and 22.70 ± 2.62 in both fatty and non-fatty liver cases, respectively. In this study, the prevalence of fatty liver among type 2 diabetes mellitus patients was 58.4%. There was a significant positive correlation between the level of Hemoglobin A1C or glycated hemoglobin and fatty liver index (p value = 0.008, r = 0.35). The development of fatty liver was 4.6 times more likely among patients with type 2 diabetes mellitus who had insufficient physical exercise than sufficient exercise. Patients with insulin and oral hypoglycemic drugs were 0.8 folds less likely to have a fatty liver as compared to oral hypoglycemic drug treatment.
Conclusion:
The results of this study showed that the prevalence of non-alcoholic fatty liver disease was elevated among patients with type 2 diabetes mellitus who had higher levels of body mass index, waist circumference, triglycerides, glycated hemoglobin, and gamma-glutamyltransferase. Therefore, glycemic control, sufficient physical exercise, and insulin treatment may reduce the risk of fatty liver disease in patients with type 2 diabetes mellitus.
Introduction
Type 2 diabetes mellitus (T2DM) is a chronic metabolic disease characterized by combinations of insulin resistance and insulin deficiency. 1 It continues with high prevalence, incidence, and public health burden issues in low-income countries. 2 In 2045, more than 693 million individuals are expected to be affected by T2DM. 3 In addition to this, it is also expected to be the leading cause of death in low-income countries. 4 The complication of T2DM is associated with the development of non-alcoholic fatty liver disease (NAFLD), which also leads to liver damage, chronic renal disease, and cardiovascular diseases (CVDs). 5 Similarly, insulin resistance, T2DM, and obesity are correlated with complications of NAFLD. 6
T2DM patients develop NAFLD, which is considered as one of the most significant causes of chronic liver disorders. 7 Fatty liver disease (FLD) affects approximately 15%–30% of the general population, and its prevalence is expected to be 70% among people with T2DM in high-income countries. 8 According to the International Diabetes Federation (IDF) report, more than one million individuals are affected by T2DM in Ethiopia. Although the burden of T2DM is estimated in the country, the prevalence of NAFLD is not clearly defined among the disease. However, the study conducted in Southwest Ethiopia showed that the prevalence of NAFLD is estimated to be 73%. 9 It is characterized by the accumulation of fat in the liver, which is commonly associated with metabolic syndromes. 10 However, lower levels of lipid are stored in the liver during metabolically healthy obesity individual. 11 The accumulation of fat within hepatocytes occurs when the amount of fatty acids entering the liver is greater than the amount of oxidized fatty acids and triglyceride (TG)-bound fatty acid secretion. 12 The pathogenesis of FLD can be associated with different factors, including chemotherapy drugs, steroid drugs, chronic hepatitis C virus infection, and autoimmune hepatitis. 13 In addition, the pathogenesis of NAFLD is highly associated with mitochondrial dysfunction, lipid peroxidation, oxidative stress, and insulin resistance. However, the complications and pathogenesis of NAFLD and T2DM are mainly correlated to the effect of insulin resistance. 14
NAFLD leads to adverse cardio-metabolic outcomes through numerous pathophysiology mechanisms, including abnormal metabolisms of glucose, fatty acids, lipoproteins, adipokines derangement, hypercoagulability, and progression of atherosclerosis.15,16 The risk of CVDs is elevated in patients with NAFLD with T2DM, insulin resistance, hypertension, and other associated factors. 17 The most common cardiovascular risk factors, including T2DM, insulin resistance, and obesity have a strong correlation with the complication of NAFLD. 18 The majority of the patients with NAFLD did not show any clinical manifestations, thus severe FLD may progress to liver failure. 19 Although fatty liver mainly affects the liver, the major causes of death are associated with CVDs followed by extra-hepatic malignancies.20,21 In this regard, glycemic control indicates the severity of FLD, and it is good to monitor the risk of T2DM. 22 On the contrary, lifestyle modification is mainly targeted for the treatment of T2DM and NAFLD to reduce obesity. Even though approval of the drug is not well-defined, anti-hyperglycemic drugs have efficacy for NAFLD. 23
The gold standard method to assess FLD is liver biopsy. However, the invasive nature, discomfort, risks, ethical considerations, and high cost are the major challenges to screen the FLD. 24 Abdominal ultrasonography is another commonly used method. However, it is expensive, subjective, and inaccessible to all environmental settings. Therefore, the fatty liver index (FLI) is utilized to identify and screen FLD in patients with T2DM. 25 It is a reliable and non-invasive accurate predictor for liver steatosis based on biochemical and anthropometric measurements such as serum TGs, body mass index (BMI), waist circumference, and gamma-glutamyltransferase (GGT).26,27 The complication of fatty liver is common in developing countries due to elevated levels of metabolic syndromes, including T2DM. Ethiopia is one of the sub-Saharan African countries with the highest diabetes cases. 28 In Ethiopia, there are no adequate data on the prevalence of the FLD among T2DM patients. However, a single study tried to show the prevalence of FLD using ultrasonography. 9 The correlation analysis between fatty liver and glycemic control was not evaluated in the previous investigation. Therefore, the purpose of conducting this study was to assess fatty liver using the FLI and its correlation with glycemic control in patients with T2DM.
Methods and materials
Study design
A hospital-based cross-sectional study was conducted among patients with T2DM attending the diabetes clinic of Dessie Comprehensive Specialized Hospital (DCSH) from July to August 2021. The hospital provides many health care services, such as medical, surgical, obstetric, antenatal, chronic follow-up, pediatric, orthopedic center, diabetes mellitus, anti-retroviral treatment, and other follow-up services.
Source and study population
All T2DM patients attending the diabetes clinic of DCSH act as a source population. On the contrary, all T2DM patients who had follow-up at the diabetes clinic of DCSH for at least 6 months and those who were available during the study period were considered as a study population. In this study, a convenient sampling technique was utilized to recruit the study participants.
Eligibility parameters of study participants
Study participants who were volunteered to participate, 18 years old and above, and those who were available during the data collection period included in the study. All T2DM patients having a follow-up at least for 6 months were included in the study. Consequently, patients who fulfilled the inclusion criteria were selected for data collection during the study period. In contrast to this, T2DM patients with significant alcohol intake, smokers, Khat chewers, patients on chemotherapy, glucocorticoids, steroid therapy, hepatotoxic drugs, with known chronic liver diseases, cognitive impairment, immediate intensive care, pregnant, and breastfeeding women were excluded from the study. In addition, patients who did not provide complete information or data were excluded.
Sample size determination
The sample size was determined using G*Power version 3.1 software by selecting the exact test, and the bivariate normal correlation model. The sample size was calculated by considering alpha (α) = 0.05, power (1-Beta) = 0.85 (85%), and Cohen’s medium effect size for Pearson’s r = 0.3. Thus, the calculated sample size was 96. By considering a 5% non-response rate, the contingency was computed as 96 × 5/100 = 5. Therefore, the final total sample size was estimated to be 101 study participants.
Blood sample collection and process
After the study participants were asked for their consent to be interviewed and to give a blood sample, 5 mL of venous blood was collected. The sample was collected after an overnight fasting state. The standard serum separator ethylenediaminetetraacetic acid (EDTA)-coated test tube was utilized to draw the blood by a trained laboratory technologist using aseptic/sterile techniques. During the sample collection period, 70% alcohol was used as a disinfectant for venous blood collection. The serum was separated from the whole blood through a centrifugation process. It was isolated by centrifugation at 3000 r/min for 5 min. After separation, the serum was stored at –20°. The serum biochemical parameters were measured by a calibrated fully automated mind array, and a clinical chemistry analyzer according to the manufacturer’s instructions in DCSH.
Statistical analysis
Data were transcribed into computer information from the completed questionnaire, then edited, cleaned, coded, and analyzed using SPSS version 20 software for analysis method. The socio-demographic characteristics of study participants were analyzed using simple descriptive statistics. A comparison of continuous variables was performed using an independent t-test analysis. Descriptive analysis was performed, and the results were presented in the form of tables, figures, and multivariable logistic regression. Regarding the confounding effect of risk factors, bivariate logistic regression was computed first, then variables having a p value ⩽ 0.2 were evaluated for multiple logistic regression. The bivariate and multivariate logistic regression analysis were utilized to determine the factors associated with fatty liver in patients with T2DM. In addition, the correlation between the FLI and HbA1c was evaluated using Spearman’s correlation coefficient. The strength of association was measured using an odds ratio (OR) and 95% confidence interval (CI). Finally, the p value < 0.05 was considered as statistically significant.
Evaluation of FLD
The FLD status was calculated using a mathematical formula of FLI based on measurements of waist circumference (cm), BMI (kg/m2), GGT (U/l), and TG (mg/dL). FLI
Data quality control and management
Data quality control techniques were applied for each phase of the study. The questionnaire was prepared in English version and translated into the local language. The data collectors were professional laboratory technologists and nurses. The training was given to data collectors and supervisors before the data and sample collection process. A pretest for questionnaire format was conducted on 10% of the total actual sample size of volunteer participants at Boru-Meda hospital before the data collection period. Then, the data were reviewed and checked for completeness. Standardized operating procedures and appropriate instructions were followed for all laboratory procedures.
Results
Socio-demographic characteristics of study participants
In this study, a total of 101 patients with T2DM were involved. Of the total enrolled study participants, 61 (60.4%) and 40 (39.4%) were males and females, respectively. In this study, 47 (46.53%) of study participants were categorized under the age group of >60 years old. Among all respondents, 73 (72.28%) were live in urban areas. Concerning the fruit and vegetable intake, 52.48% of them took fruit and vegetables less than 3 days per week. On the contrary, 59 (58.42%) study participants had less than five servings per typical day. Regarding the level of physical exercise, 48.51% of the study participants performed sufficient physical exercise as shown in Table 1.
Socio-demographic characteristics of study participants among type 2 DM patients attending at DCSH.

DCSH: Dessie Comprehensive Specialized Hospital; DM: diabetes mellitus.
Clinical and anthropometric characteristics of the study participants
The duration of T2DM patients ranged from 6 months to 20 years. Regarding the co-morbidities, nearly half (48.51%) of the participants had co-morbidity with hypertension. Of the total enrolled study participants, 53 (52.48%), 39 (38.61%), and 9 (8.91%) patients were under oral hypoglycemic drugs, insulin, and combined drugs, respectively. Of the study participants, 36 (35.64%) patients were under statin treatment. On the contrary, only 25 (24.75%) patients monitor their blood glucose levels. Thus, 61 (60.4%) patients had poor glycemic control activity. Regarding the evaluation of BMI, 42 (41.58%) study participants were overweight, whereas 14 (13.86%) patients were categorized as obese. Among the participants, 58.42% of them had ⩾60 FLI scores as shown in Table 2 below.
Clinical and anthropometric characteristics of study participants among type 2 DM patients attending at DCSH.
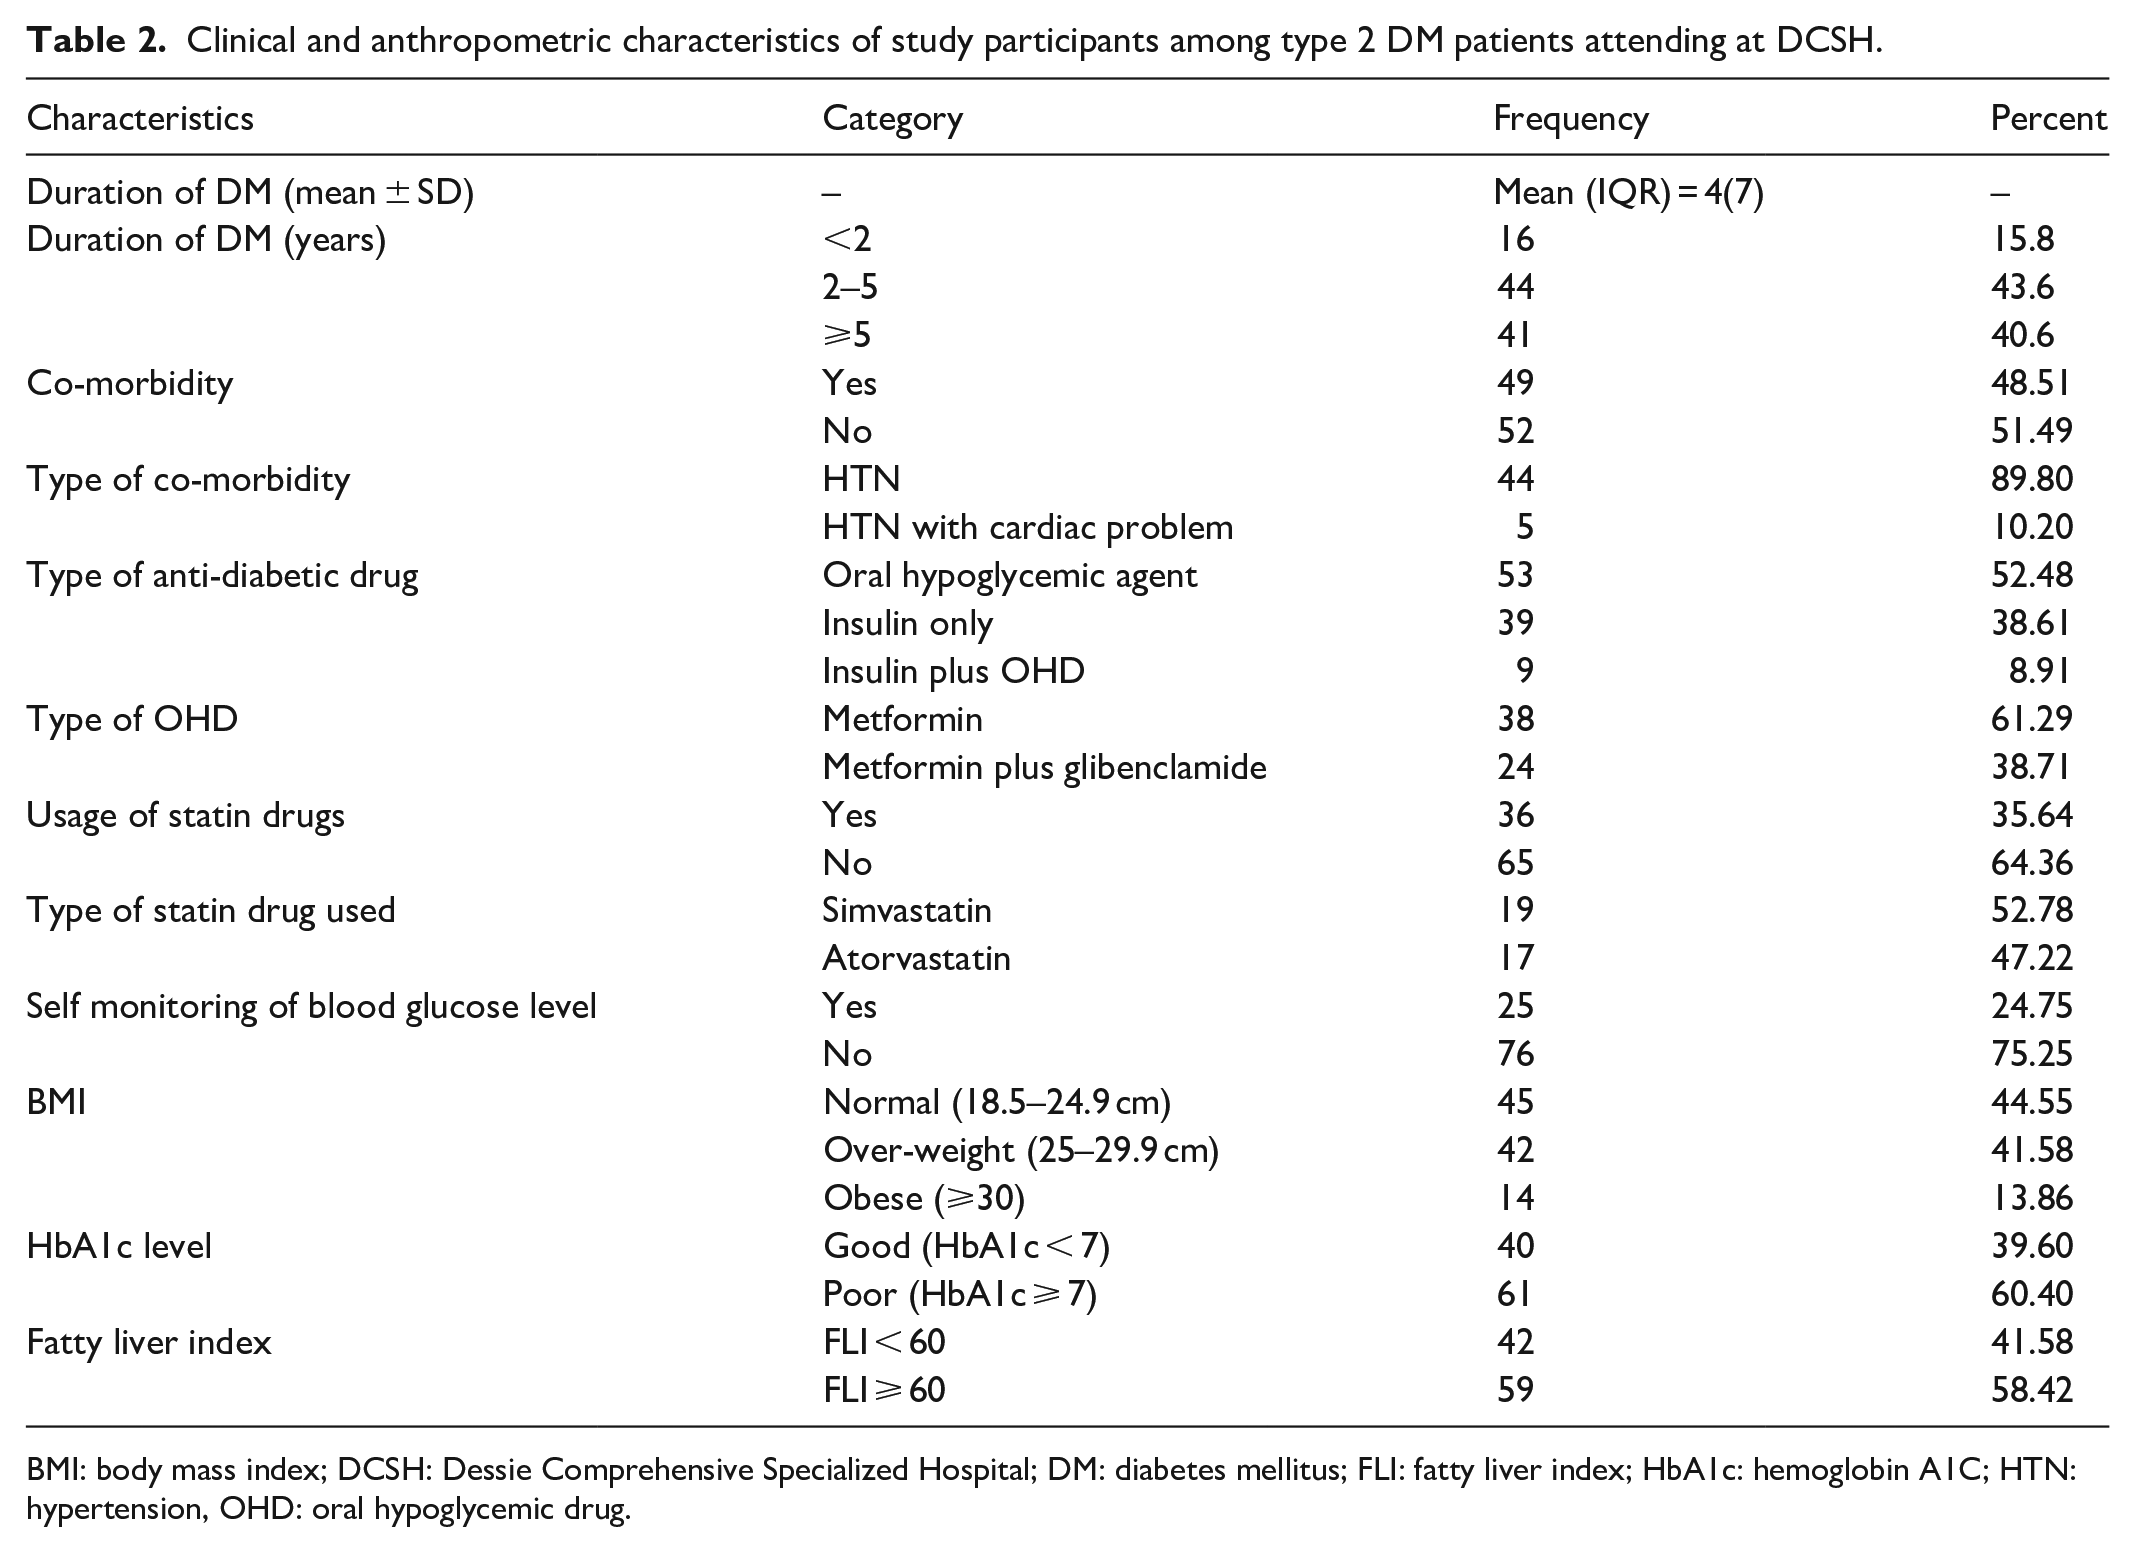
BMI: body mass index; DCSH: Dessie Comprehensive Specialized Hospital; DM: diabetes mellitus; FLI: fatty liver index; HbA1c: hemoglobin A1C; HTN: hypertension, OHD: oral hypoglycemic drug.
Evaluation of various clinical and biochemical parameters of the study participants
In this study, the mean ± standard deviation BMI values of patients with T2DM were 25.82 ± 3.64, 28.04, and 22.70 ± 2.62 among fatty liver and non-fatty liver patients, respectively. The median waist circumference 26 was 98 and 16 cm values of interquartile range (IQR) in all patients. There was a significant difference in waist circumference (WC) among NAFLD patients. It was 103 cm in fatty liver, and 82 cm in non-fatty liver. The average level of HbA1c for all patients was 8%. In this regard, the levels of HbA1c were 8.4% and 6.85% among fatty liver and non-fatty liver, respectively. Thus, there was a statistically significant difference between fatty liver and non-fatty liver study participants. The FLI score was 60.53 for overall patients, whereas 63.66 and 15.81 for fatty liver and non-fatty liver, respectively.
Magnitude of FLD in T2DM patients
According to Bedogni`s FLI category, 58.42% of the study participants had ⩾60 FLI values. The prevalence of NAFLD was elevated among patients who had co-morbidity conditions with hypertension than patients with non-comorbidity. Among the fatty liver cases, 39 (66.1%) and 20 (33.9%) were males and females, respectively as shown in Figure 1.

The fatty liver status was categorized according to sex of participants. Thus, majority of patients with T2DM having high fatty liver status were males. From the total enrolled study participants, majority of non-fatty liver diabetes patients were males. Consequently, male patients with T2DM were develop fatty liver during the assessment of this study.
Of the total fatty liver patients, 42 (71.2%) had poor glycemic control, whereas 39 (28.8%) had good glycemic control as shown in Figure 2.

Patients with T2DM with fatty liver had poor glycemic control. On the contrary, patients with T2DM having non-fatty liver status had good glycemic control. Therefore, glycemic control had a correlation with development of fatty liver disease.
Fatty liver status of study participants by treatment types
There was no significant correlation (r = –0.038, p = 0.71) between the FLI and treatment types among the study subjects. Of patients with T2DM under oral hypoglycemic drug (OHD) therapy only, 34 (64.15 %) had NAFLD, whereas 52.1% of patients with insulin ± OHD treatment had fatty liver.
Correlation analysis between the fatty liver and level of HbA1c among study participants
A correlation analysis was computed to assess the association between the level of HbA1c and the calculated FLI. Due to the non-normal distribution of the variables, Spearman’s correlation analysis was evaluated. Thus, there was a statistically significant positive association between those parameters. In contrast to this, there was no statistically significant association between fasting blood sugar (FBS) level and HbA1c as shown in Table 4.
Factors associated with FLD among patients with T2DM
By computing bivariable binary logistic regression, variables with a p value of ⩽0.25 were selected. Hence, variables like sex, age, residence, physical exercise, number of days of fruit, and vegetable intake per week, number of servings of fruit and vegetable intake per day, duration of DM, type of DM medication, usage of statin drugs, hypertension, and glycemic control were selected and fitted to multiple logistic regression. Variables such as physical activity level, anti-diabetic medications type, and glycemic control were found to have a significant association with FLD in T2DM patients. According to the findings of this study, the odds of having fatty liver were 4.6 times more likely among patients with T2DM with insufficient physical exercise than those who had sufficient exercise (adjusted odds ratio (AOR) = 4.6; CI: 1.45–14.65). Besides, study participants with poor glycemic control had almost four times more likely to have NAFLD as compared to those who had good glycemic control (AOR = 4.36; CI: 1.31–14.5). In addition to this, patients who were under insulin medication were 0.8 folds less likely to have fatty liver than those who took oral hypoglycemic agents (AOR = 0.2; CI: 0.058–0.73) as shown in Table 5.
Discussion
The result of this study showed that the prevalence of NAFLD was elevated among patients with T2DM having higher levels of BMI, waist circumference, TG, HbA1c, and GGT. A total of 101 patients with T2DM who fulfilled the inclusion criteria were involved during the study period. Of the total enrolled patients with T2DM, the majorities of them were men and had poor glycemic control (Tables 1 and 2). The assessment of our study showed that fatty liver had a higher frequency among men as compared to women (Figure 1). The study conducted by Hossain et al. 30 reported in line with the results of our study. Some data showed that women are more affected, whereas others also mentioned fatty liver is more prevalent among men. 31 On the contrary, the prevalence of NAFLD increases with age.32,33 However, there was no significant association between age and fatty liver in our study.
Of the total enrolled patients with T2DM, 58.4% of them had NAFLD by computing FLI estimation (Table 2). It was in line with a cross-sectional study conducted in the Jazan region of Saudi Arabia, where the prevalence of fatty liver was 47.8%. 34 Similarly, it was agreed with other previous studies.35,36 However, the results of our study showed a decrease in the prevalence of NAFLD as compared to previously conducted studies in Ethiopia, Nigeria, and Romania.9,25,37 In contrast, an elevated value of NAFLD was seen as compared to other similar studies conducted in the South Gujarat region. 38 The possible reason for this discrepancy might be due to a difference in diagnostic techniques, sample size, and treatment of combined drugs. The previous study conducted in Ethiopia utilized the ultrasound method to evaluate fatty liver status. 9 Thus, the high prevalence of NAFLD in patients with T2DM is mainly associated with hyperinsulinaemia, insulin resistance, and lipid metabolism derangement. 35
The assessment of this study showed that study participants with NAFLD had higher levels of BMI and WC as compared to non-NAFLD patients (Table 3). It was agreed with another similar study. 39 In this regard, it is well-established that increased adiposity is correlated with NAFLD and T2DM, which may be associated with adipocyte insulin resistance. 40 The result of our study revealed that a statistically significant elevation of dyslipidemia (triglyceridemia) occurred among T2DM patients with NAFLD as compared to non-fatty liver one (Table 3). Thus, it was agreed with the study conducted in India. 41 In this study, the levels of HbA1c were positively correlated with the calculated FLI (Table 4). It was agreed with a previous study conducted in Nigeria. 37 In line with our findings, it has been reported that patients with T2DM who have higher HbA1c levels have a higher FLI status. 35 In this study, the majority of fatty liver patients had poor glycemic control (Figure 2). Our study showed that poor glycemic control was significantly associated with NAFLD as compared to those who had good glycemic control. The significant association between poor glycemic control and fatty liver was also reported in different studies.37,42,43 It could be due to poor glycemic control and massive lipolysis, which results in significant mobilization of free fatty acid and hepatic TG accumulation. 44 The result of our study showed that the levels of FBS had no significant association with fatty liver status (Table 4). It was consistent with previous studies.30,39
Evaluation of various biochemical and clinical parameters by fatty liver status among type 2 DM patients attending at DCSH.

Mean ± SD is used for normally distributed data and Median, IQR: interquartile range for non-normally distributed data. P value < 0.05: significant difference by fatty liver status.
BMI: body mass index; DCSH: Dessie Comprehensive Specialized Hospital; DM: diabetes mellitus; FBS: fasting blood sugar; GGT: gamma-glutamyltransferase; FLI: fatty liver index; HbA1c: hemoglobin A1C; HTN: hypertension, OHD: oral hypoglycemic drug; WC: waist circumference.
Correlation analysis of fatty liver index with HbA1c and FBS among type 2 DM patients attending at DCSH.

DCSH; Dessie Comprehensive Specialized Hospital; DM: diabetes mellitus; FBS: fasting blood sugar; HbA1c: hemoglobin A1C; Sp. R: Spearman’s correlation coefficient.
Correlation is significant at p value of 0.05 (two-tailed).
On the contrary, the assessment of this study revealed that study participants with insufficient physical exercise were more likely to have FLD as compared to patients with competent physical exercise (Table 5). A similar association was reported in the previous conducted study. 43 It is due to the fact that physical exercise improves insulin resistance, hepatic fatty acid metabolism, and liver mitochondrial function.45–47 On the contrary, patients who took insulin with or without OHD were at a lower risk of NAFLD than those treated with oral hypoglycemic drugs only (Figure 3). The result of our findings agreed with the study conducted by Hoza et al. 48 In a similar context, previous investigations revealed that insulin therapy or its combination with metformin decreased liver fat content, increased hepatic insulin sensitivity, and improved levels of HbA1c, TG, and free fatty acids.49,50 In this study, the use of statins in patients with T2DM was not a significant factor in the development of NAFLD. In contrast, patients without statin had more likely to develop NAFLD as compared to patients with statin treatment (Table 5). It agreed with the previous investigation, which recommended statin for NAFLD patients to reduce cardiovascular risk. 51 The result of our study was in line with other studies conducted by Herath et al. 36 It may be due to the administration of statins for study participants who had fatty liver and early treatment of those drugs. The result of our study showed that patients with combined treatment (Insulin and OHD) had less likely to develop NAFLD as compared to patients with OHD treatment (Table 5). On the contrary, the duration of T2DM was not significantly associated with NAFLD. Hence, it was agreed with other studies performed by Hossain et al. 30 In contrast to this, hypertension is a metabolic syndrome that has a significant association with the development of NAFLD. 52 In this study, T2DM patients with hypertension disease had more likely to develop the risk of NAFLD as compared to patients without hypertension (Table 5). Thus, it agreed with the previous conducted study. 41
Multiple logistic regression analysis for factors associated with fatty liver disease among T2DM patients attending DCSH.

1
AOR: adjusted odds ratio; CI: confidence interval; COR: crude odd ratio; DCSH: Dessie Comprehensive Specialized Hospital; DM: diabetes mellitus; OHD: oral hypoglycaemic drug; T2DM: type-2 diabetes mellitus.
p < 0.05.
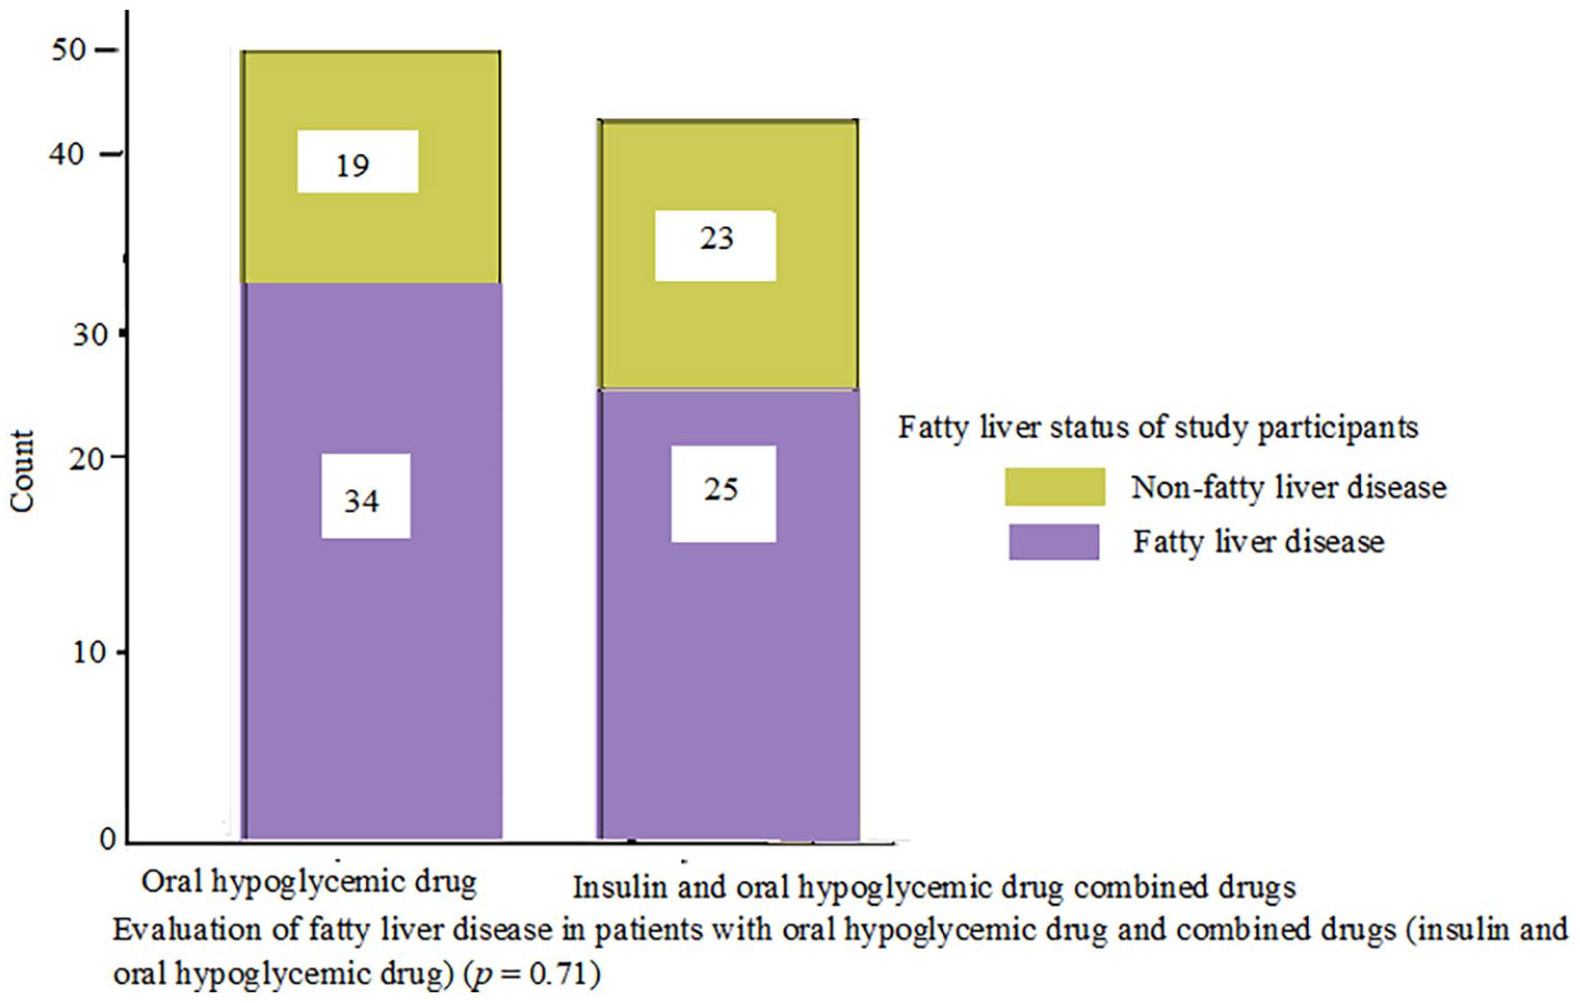
The patients who had fatty liver complication were treated with OHD only. The patients who were under the treatment of combined insulin and OHD had less fatty liver complication.
As a limitation of this study, it was unable to identify the other forms of NAFLD like fibrosis and cirrhosis. Due to financial constraints, preferable diagnostic methods for fatty liver, including liver biopsy and ultrasound were not assessed. The other limitation of this study was the cross-sectional study design, which might not describe the cause and effect relationship between some exposure factors and the outcomes.
Conclusion
The result of this study showed that T2DM patients with NAFLD had elevated levels of BMI, waist circumference, TG, and GGT as compared to non-fatty liver one. The level of HbA1c also had a statistically significant elevation among T2DM patients with NAFLD. Therefore, there was an elevation of those measurements among T2DM patients with FLD. Similarly, T2DM patients with comorbid conditions, including obesity, dyslipidemia, and hypertension had more likely to develop NAFLD. In this regard, T2DM patients with hypertension disease were more likely to develop NAFLD as compared to patients without hypertension disease. In contrast, patients with T2DM with insulin treatment had a lower risk of NAFLD as compared to patients with oral hypoglycemic agents. Generally, good glycemic control, adequate physical exercise, and insulin medication may decrease the risk of NAFLD among patients with T2DM. Consequently, T2DM patients with poor glycemic control should also undergo screening for steatosis with FLI before they develop other severe forms of NAFLD.
Footnotes
Acknowledgements
The authors sincerely acknowledge the University of Gondar, Wollo University, and Dessie Comprehensive Specialized Hospital for their support during the research work. They thank all the participants who were enrolled in this study.
Availability of data and materials
Data are available from the corresponding author on a reasonable request.
Declaration of conflicting interests
The author(s) declared no potential conflicts of interest with respect to the research, authorship, and/or publication of this article.
Funding
The author(s) received no financial support for the research, authorship, and/or publication of this article.
Ethical approval
Ethical approval was obtained from the University of Gondar, School of Medicine institutional ethical review committee Ref No. of 477/6/2021 dated 18 June 2021. Confidentiality and privacy were maintained, and data collection was conducted using codes or without personal identifiers.
Informed consent
Consent forms are available from the corresponding author on a reasonable request. Written informed consent was obtained from all subjects before the study. The study was conducted in accordance with the Declaration of Helsinki.