
Abstract
Objectives:
The aim of this study was to compare the cost-effectiveness of in vitro fertilization and intrauterine insemination for the management of unexplained, mild male and mild female factor infertility in Saudi Arabia.
Methods:
A cost-effectiveness analysis from a societal perspective was conducted for couples seeking assisted reproductive technology services between January and December 2016 in one of the largest private hospitals in Saudi Arabia. Activity-Based Costing and Step-Down Costing methodologies with expert interviews were used to compute the costs of in vitro fertilization and intrauterine insemination. A total of 710 assisted reproductive technology procedures were observed by the embryologist in charge. The costs calculated included direct and indirect costs. A cost-effectiveness analysis and a Monte Carlo simulation probabilistic sensitivity analysis were conducted.
Results:
The average cost per in vitro fertilization and intrauterine insemination cycle was SR 27,360 (range: SR 19,541–29,618) and SR 10,143 (range: SR 7568–11,976), respectively, and the live birth rate per initiated in vitro fertilization and intrauterine insemination cycle was 20.7% and 7.9%, respectively, resulting in an average cost per live birth per in vitro fertilization and intrauterine insemination treatment cycle of SR 132,174 (95% confidence interval: 120,802–143,546) and SR 128,392 (95% confidence interval: 124,468–132,316), respectively. The incremental cost-effectiveness ratio was SR 134,508 per extra live birth implicit in a decision to treat with in vitro fertilization. Probabilistic sensitivity analysis confirms the robustness of the cost-effectiveness results.
Conclusion:
This study found that from a societal perspective, one in vitro fertilization treatment cycle was more cost-effective than intrauterine insemination in Saudi Arabia.
Keywords
Background
Economic evaluation has been defined as ‘the comparative analysis of alternative courses of action in terms of both their costs and consequence’. 1 The cost included in economic analysis may adopt the viewpoint of patients, health care providers, or insurance companies, or may present the societal perspective. 2 Some of the common generic approaches to costing include Step-Down Costing method which is often used when fine detail is not available, and the Bottom-Up method, which is usually employed when fine detail is available. 1 Activity-Based Costing (ABC) is one of the new methods developed in 1980s as a costing methodology; it calculates cost price by determining the usage of resources. 3
The cost of assisted reproductive technologies (ART) treatment exhibits striking differences worldwide affecting both the affordability and the clinical practice. 4 The majority of ART cost reports are cost descriptions that do not include comparison with alternative strategies or assessment of outcome. 5 Cost-outcome descriptions estimate the cost per live birth achieved by ART procedures by calculating the cost of an ART cycle divided by success rate per cycle. 2
ART treatment costs could be direct costs, attributed to providing ART treatment itself and its downstream cost of complication and multiple birth delivery, and indirect costs, attributed to the lost productivity time during the ART treatment cycle. Direct ART cost components include capital cost, recurrent cost of medical procedures and services, cost of complications, patient travel costs and the downstream costs of multiple birth care. Indirect costs include the cost of lost productivity time of both partners during the whole ART treatment cycle.
Assisted reproduction service was started in the Kingdom of Saudi Arabia (KSA) in 1986; the service is practised in a strictly religious manner and certain aspects of the technology such as donation are completely prohibited. 6 More than 20,000 in vitro fertilization (IVF) treatment cycles are currently conducted annually in 35 ART centre in the Kingdom. 7 There is no accurate number of intrauterine insemination (IUI) cycles performed in the Kingdom because IUI service is also offered in many clinics other than IVF centres, but it is estimated that more than 6,000 IUI treatment cycles are conducted annually in the Kingdom. Unfortunately, despite the large number of IVF and IUI cycles conducted annually, professional guidelines are not fully developed and management options are usually offered and decided during clinical consultation.
This study is proposed to fill the gaps in the literature on the health economics of ART in Saudi Arabia, especially with the current tight economic situation and tendency to privatize health care services that requires value for money prediction and quality monitoring strategies.
The aim of this present study was to compare the cost-effectiveness from societal perspective over a 1-year time horizon of two modalities of ART treatment, namely, IVF and intrauterine insemination (IUI), for couples seeking ART treatment in a private hospital in Buraidah, Al Qassim district, Saudi Arabia. This is the first study on the cost-effectiveness of IVF versus IUI in Saudi Arabia. Result of this analysis helps inform whether IVF compared with IUI represents value for money for the different stakeholders, which is important in guiding clinical practice and informing policy decisions.
Methods
A retrospective cross-sectional study of clinical outcome of ART treatment followed by a cost-effectiveness analysis (CEA) was conducted from January to December 2016 at one private hospital in Saudi Arabia; ABC and Step-Down Costing methodologies with expert interviews were used to impute the cost of IVF and IUI. A checklist covering the different cost items for both procedures was developed by the researcher and validated by experts in the field of ART based on their daily practice and experience in the management of infertile couple by using IVF and IUI strategies. A total of 405 completed IVF procedures and 305 completed IUI procedures were observed by the embryologist in charge. The capital and recurrent costs were calculated from the societal perspective. Costs were standardized to US dollars and inflated to 2016 dollars using the Organisation for Economic Co-operation and Development gross domestic purchasing power parities (PPP) conversion rates. 8
The inclusion criteria were as follows: first cycle of IUI or IVF treatment, female age less than 40 years with at least one patent tube, a diagnosis of unexplained infertility, mild male factor infertility or female factor infertility. A diagnosis of unexplained infertility was made if no abnormality was found in medical history, semen analysis, tubal and ovulatory function. 9 A diagnosis of female factor infertility was made if the female partner was diagnosed by the attending physician as having endometriosis, unilateral tubal block or poly cystic ovary syndrome as defined by Rotterdam criteria. 10 A diagnosis of mild male factor was made if the first recorded ejaculated sperm concentration was <15 × 106/mL or as specified in the notes of the attending physician. Cryopreserved, incomplete and lost follow-up cycles were excluded from the study. All couples meeting inclusion criteria were offered both treatment options. Clinical pregnancy had been confirmed by visualization of foetal cardiac activity on ultrasound 5–6 weeks following embryo transfer (ET) or intrauterine insemination. A live birth was defined as the delivery of at least one live born infant, with the birth of a singleton, twin or triplets being counted as one live birth. Probabilistic sensitivity analysis (PSA) was conducted to assess the uncertainty of the results. Parameter uncertainty related to costs and outcomes was explored using TreeAge Pro software (TreeAge Pro 2018, R2.1, Tree Age Software, Inc. Williamstown, MA). A decision analytic model was constructed to undertake the CEA and Monte Carlo simulation PSA. Clinical outcome data were extracted from the hospital electronic database and IVF unit medical records.
Sample size calculation
Assuming a live birth rate of 15% after IUI cycles and 25% after IVF cycle, a sample size for a two-sided test for differences in proportions of live births per couple yielded 250 couples for each treatment group with 80% power and alpha of 0.05 (Lwanga & Lemeshow 1991) according to the following formula:

Where n is the sample size required for each group; P1 and P2 are the anticipated success rates of IVF and IUI of 25% and 15%, respectively. Level of significance 5%; power of the study 80%; alternative hypothesis P1 –P2≠0; Z at confidence level of 95% = 1.960.
Statistical analyses
Statistical analyses were performed using SPSS software (version 21.0 for Windows®; IBM SPSS, Armonk, NY: IBM Corp, USA). Student’s t-test was used for continuous variables and chi-square tests for categorical variables. Two tailed tests were employed, and P < 0.05 was considered to indicate statistical significance. CEA was done using TreeAge Pro software (TreeAge Pro 2018. R2.1, TreeAge Software Inc, Williamstown, MA).
Results
Table 1 details the baseline characteristic and outcomes of all participants in each treatment group. There were significant differences in female mean age, mean duration of infertility and cause of infertility between the two groups. Female partners were, on average, 1.1 years younger in the IUI group than in the IVF group, with a shorter infertility duration and slightly more common primary than secondary infertility (51.1% vs 46.9%), which was not significant (P = 0.288). The mean age ± standard deviation (SD) of females was 32.16 ± 4.834 and 31.09 ± 4.682 years (P value 0.016) in the IVF and IUI groups, respectively. The mean infertility duration ± SD was 3.34 ± 2.627 and 2.85 ± 2.20 (P < 0.001) in the IVF and IUI groups, respectively. The cause of infertility was unexplained, mild male, mild female and combined factor in 44.4%, 15.3%, 27.7% and 12.6% of the IVF group and 38%, 25.2%, 22.3% and 14.4% of the IUI group, respectively. The clinical pregnancy rate per started cycle was significantly higher in the IVF group than in the IUI group (44.7% and 13.1%, respectively, P value < 0.001), with a significantly higher live birth rate per started treatment cycle resulting from IVF than that resulting from IUI treatment (20.7% and 7.9%, respectively, P value < 0.001).
Participant baseline characteristics and outcome according to treatment groups.

IUI: intrauterine insemination, IVF: in vitro fertilization.
The chi-square test statistic was used to test for the difference in proportions, and Student’s t-test was used to test for equality of means.
Number of clinical pregnancies diagnosed by ultrasonography or clinical documentation per 100 ET procedure.
Cost of the ART cycle
The costs calculated were the capital and recurrent costs of the medical procedures and services, the downstream cost of multiple birth admission and delivery, the cost of treatment complications, the patient travel costs and the indirect costs of lost productivity time. Capital cost was the cost of building and equipment; recurrent costs were staff, consumable, drug and overhead cost. Costing was done from the societal perspective based on 2016 data on resource use and unit prices. The ABC method or Step-Down Costing method was used based on the availability of sources. In the Step-Down method, cost data obtained from hospital financial department were allocated to all services conducted in the IVF unit based on the number of inpatient days for each procedure. The unit conducted a total of 1035 IVF and 356 IUI cycles during the study period. The IVF procedure required 2 days of admission to the IVF unit for oocyte retrieval and ET, whereas IUI required only one day for the insemination procedure. The total inpatient day per year for all ART cycles in 2016 was (1035 IVF×2 days) + (356 IUI×1 day) = 2070 + 356 = 2426 inpatient days. For the ABC method, the time consumed by the staff/activity was calculated based on actual salary scales. Consumables and drugs used for each procedure were assessed based on hospital financial records and the pharmacy purchase price of drugs.
Cost of equipment
Equipment was valued according to the actual purchase prices in Saudi riyals (SR), and the cost of equipment per year was calculated based on a life span of 5 years with an annual depreciation of 5%. The cost for equipment used was SR 100.6 and SR 376 per cycle in the IUI and IVF procedures, respectively. An additional cost of SR 45.1 and SR 175.5 per cycle for maintenance and depreciation in the IUI and IVF cycles, respectively, made the total equipment cost per IVF and IUI cycle equal to SR 551.5 and SR 145.7, respectively.
Building cost
The annual building cost, including depreciation allocated by clinic area (70 sqm), was SR 102,698.5, and the cost of building repair and maintenance was SR 1554. The area was equally utilized for both procedures; therefore, the building cost per IVF and IUI cycle was SR 74.9 per cycle.
Overhead cost
This cost includes utility costs (water, electricity, telephone), housekeeping service charges, housekeeping material, insurance (fire), consultancy fees, visa fees, clothing/uniform expenses, hospitality, recreation, business promotions, discounts and printing and stationery. The overhead cost was calculated according to the number of inpatient days for each procedure. The total allocated overhead cost for the IVF unit was SR 421,225. The cost per inpatient day was SR 173.6. The cost per IVF cycle (2 inpatient days) was 347.3, and the cost per IUI cycle (1 day) was 173.6.
Calculation of staff cost using ABC
To calculate staff cost by ABC, we first define all the activities and activity pools involved in the ART treatment cycle and the time consumed by staff/activities in each treatment group. There are sex activity pools for rendering the IVF and IUI treatment cycles as follows:
A1. Informational meeting with the couples and billing service
A2. Consultations and follow-up
A3. Oocyte pick-up and ET
A4. Semen preparation, including freezing and thawing
A5. Embryology procedures including intracytoplasmic sperm injection (ICSI), embryo culture and freezing
A6. Pre- and post-operative nursing preparations and monitoring
The cost centres were the patient service office, IVF clinic, andrology laboratory, embryology laboratory, theatre and recovery rooms.
Following this determination of activities, activity pools and appropriate cost drivers, costs are allocated to activity pools/cost centres, and finally, costs are allocated to the IVF and IUI procedures. The average staff cost for the IVF and IUI cycles based on ABC was SR 1204.15 and SR 515, respectively.
Cost of consumables
The average cost of consumables used for clinical and embryological procedures and services for complete IVF and IUI cycles was SR 1475.39 and SR 215.95, respectively.
Cost of drugs for IVF and IUI cycle
The actual amount of each drug used for all ART cycles during the study period was taken from the IVF unit database. An expert interview with the head of the IVF Department was undertaken to estimate the range and types of medication required for both procedures. In general, the agonist protocol was used in 42% of cases, whereas the antagonist protocol was used in 58% of cases. Recombinant human follicle stimulating hormone (rFSH) was used in 22.9% of cases, while human menopausal gonadotropin (HMG) was used in 77.1% of cases. Human chorionic gonadotropin (hCG) triggering was fixed at 10,000 IU as the standard procedure for all cycles.
Overall, the mean and SD of the drug cost per stimulation cycle (down-regulation, ovarian stimulation and luteal support) for the IVF and IUI cycles based on the actual amount of each drug used for all ART cycles during the study period was SR 3867 ± 2354 and SR 575 ± 310, respectively. The cost range was SR 1513–6221 for IVF and SR 265–885 for IUI, depending on the age and response of individual patients, the down-regulation protocol and the ovarian stimulation regimen (whether rFSH or HMG was used for ovarian stimulation).
Downstream cost associated with multiple birth delivery and complications
This cost includes the cost of complication admission due to severe ovarian hyper-stimulation syndrome (OHSS) and the cost of admission for multiple live birth delivery. The incidence rate of complications and the multiple-delivery rates in the study group were used to estimate these costs, and the average hospital charges for these admissions were assigned.
Complication admission cost
One (0.33%) of the 305 patients in the IUI group and 3 (0.74%) of the 405 patients in the IVF group were reported to have severe OHSS requiring hospitalization, with an average inpatient admission cost of SR 50,000 per case. The additional cost was (0.0074 × 50,000) = SR 370 per IVF cycle and (0.0033 × 50,000) = SR 165 per IUI cycle.
Multiple birth delivery admission cost
The average cost of multiple birth delivery was SR 14,525, adding an additional cost of SR 5,868.1 per case in the IVF cycle and SR 1,205.6 per case in the IUI cycle according to the incidence of multiple births in each group; however, since the probability of live birth delivery is only 20.7% in IVF and 7.9% in IUI, SR 1,214.7 per case in IVF and SR 95 per case in IUI will be added. The average inpatient neonatal admission cost was SR 300,000 in the lowest birth weight category of premature infants and occurred in 20% of multiple births in the study group. This cost adds (0.2 × 300,000) = SR 60,000 per case, but since the LBR is 20.7% and 7.9% in IVF and IUI, respectively, the cost will add only SR 12,420 and SR 4740 in the IVF and IUI groups, respectively.
Adding these amounts together, the estimated total cost of mother and infant inpatient admission for the delivery of multiple births is SR 13,634.7 per case for IVF and SR 4,835 per case for IUI.
Patient travel cost
Assuming an average transportation cost of SR 700 per month (SR 23 per day), the average travel cost during the entire ART cycle given that the average lost time during the IVF and IUI cycles is 6 and 4 days, respectively, will be SR 138 and SR 92 per IVF and IUI cycle, respectively. Considering the possible complications of ART treatment and the time spent during hospitalization and delivery, this cost will add another 1-month travel cost on average, but since only 20.7% and 7.9% of IVF and IUI pregnancies reach live birth, this cost will add only (700 × .207) = SR 144.9 per IVF cycle and (700 × .079) = SR 55.3 per IUI cycle. The estimated total patient travel cost will be SR 282.9 per IVF cycle and SR 147.3 per IUI cycle.
Indirect cost of the ART cycle
The indirect cost of lost productivity time during the whole ART treatment cycle was estimated by assuming that both partners missed 6 days per IVF cycle and 4 days per IUI cycle and that if we value the time at SR 43 per hour as an average hourly earnings in 2016 in Saudi Arabia, the estimated lost productivity cost will be: 2 × (6 days per cycle) × (SR 43/hour) × (8 hours/day) = SR 4,128 per cycle for couples in IVF and SR 2,752 per cycle for couples in IUI. If we further assume that multiple pregnancies of ART treatment delivered prematurely and required an average of 1 month leave from work, this will add (SR 43/hour × 8 hours × 5 days/week × 4 weeks) = SR 6,880. However, since only 20.7% and 7.9% of IVF and IUI cycles, respectively, that are initiated result in a successful live birth, this factor will add 0.207 × 6,880 = SR 1,424.16 for IVF and 0.079 × 6,880 = SR 543.52 for IUI.
Thus, the estimated total lost productivity cost is SR 5,552.16 and SR 3,295.52 per IVF and IUI cycle, respectively.
Total direct and indirect costs of a complete ART cycle
The total direct costs of complete IVF and IUI cycles were SR 21,807.84 and 6,847.45, respectively, and the total indirect costs of complete IVF and IUI cycles were SR 5,552.16 and 3,295.52, respectively. The total direct and indirect costs of complete IVF and IUI were SR 27,360 and 10,142.97, as shown in Table 2.
Total direct and indirect costs for an ART cycle (SR).

IUI: intrauterine insemination; IVF: in vitro fertilization.
CEA
A CEA was conducted to calculate the cost-effectiveness ratio and incremental cost-effectiveness ratio (ICER) incorporating both the direct and indirect treatment costs (direct costs relate to the provision of ART treatment until a pregnancy is confirmed, costs of treatment complication, downstream costs of multiple birth delivery and patient travel costs). Indirect costs include the cost of lost productivity time. The uncertainty of the results was explored by conducting a PSA.
CEA of IUI versus IVF treatment – direct and indirect costs
Table 3 shows the baseline CEA incorporating the direct and indirect treatment costs and ICER including 95% confidence level from the bootstrap results for IVF versus IUI . The total cost of the IVF and IUI cycles was SR 27,360 ($7296) and SR 10,143 ($2704.8), respectively, and the live birth rate (LBR) per initiated IVF and IUI cycle was 20.7% and 7.9%, respectively, resulting in cost per live birth for the IVF and IUI treatment cycles of SR 132,174 ($35,246.4) and 128,392 ($34,237.8), respectively. The ICER was SR134,508 ($35,868.8) (95% confidence interval (CI): 94,08–159,426 ($25,090–42,514)) per extra live birth implicit in a decision to treat with IVF. CEA results showed that no strategies were clearly dominated by any other; no strategies were eliminated by extended dominance. IVF was the most expensive option but was also the most effective. This finding is presented by the cost-effectiveness plane in Figure 1. Note that results in parenthesis are the cost in US dollars.
Baseline cost–effectiveness analysis of IUI versus IVF treatment cycle.
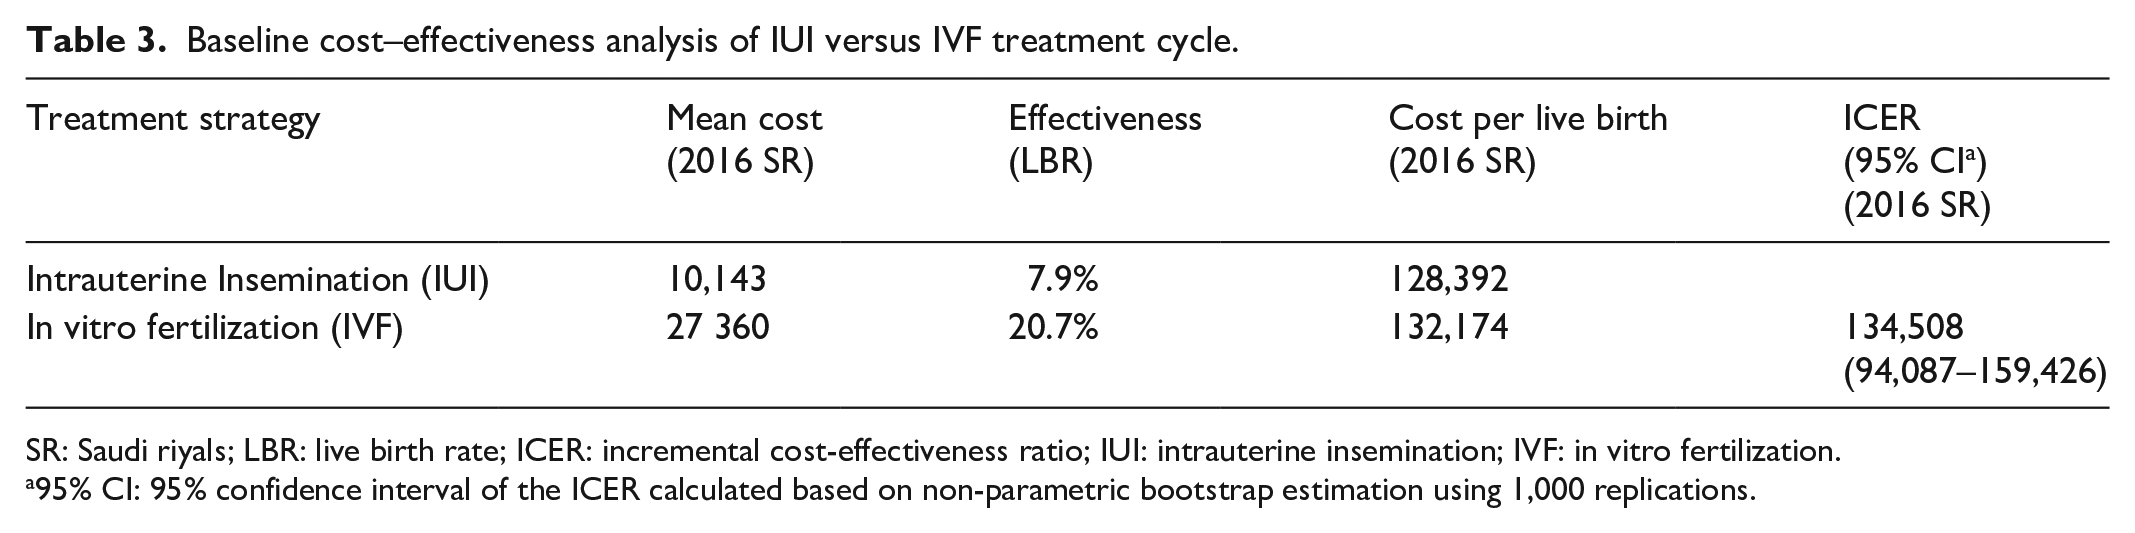
SR: Saudi riyals; LBR: live birth rate; ICER: incremental cost-effectiveness ratio; IUI: intrauterine insemination; IVF: in vitro fertilization.
95% CI: 95% confidence interval of the ICER calculated based on non-parametric bootstrap estimation using 1,000 replications.
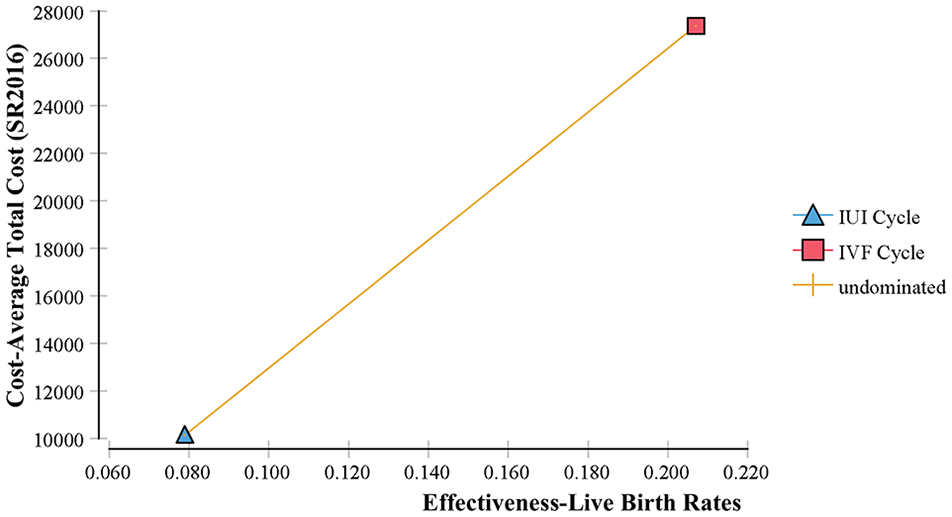
Cost-effectiveness plan of IVF versus IUI treatment cycles.
Sensitivity analyses
A decision analytic model was constructed to undertake the CEA and Monte Carlo simulation PSA. A simplified decision tree is presented in Figure 2.
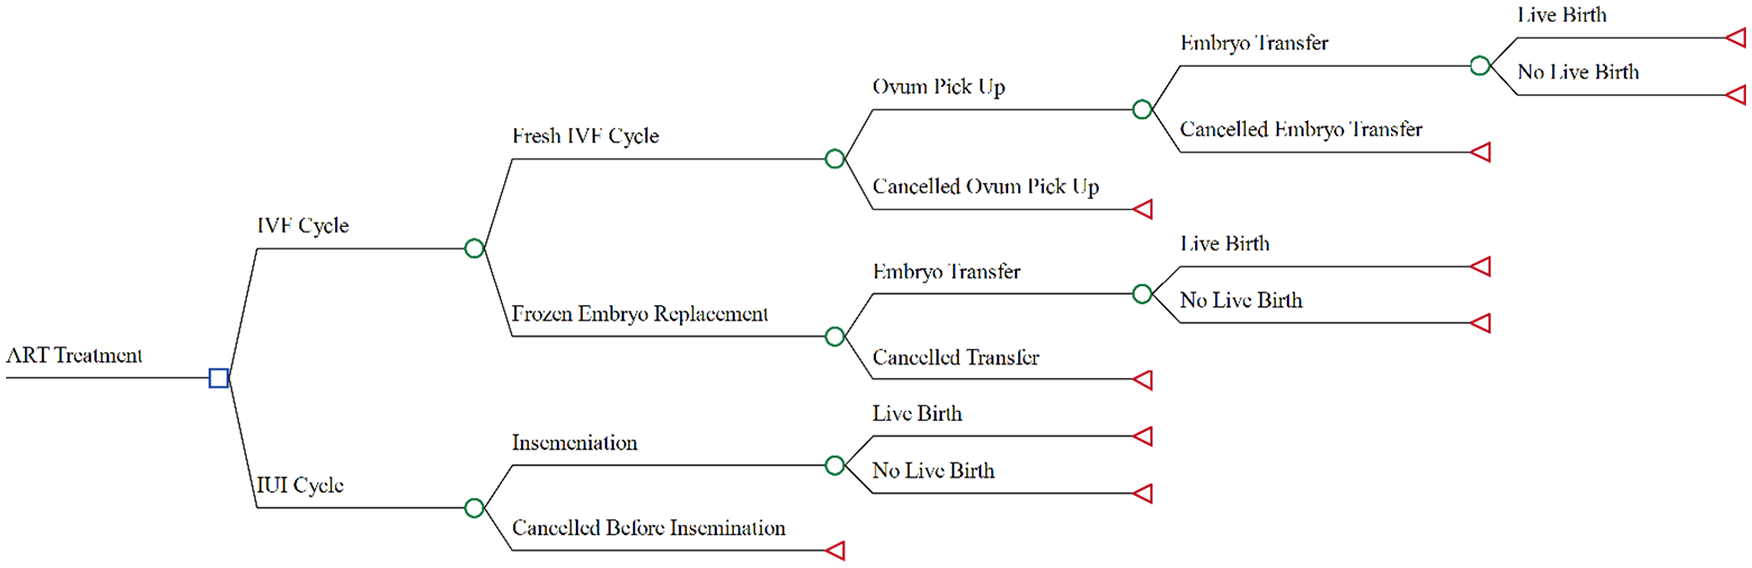
Decision analytic model for the calculation of the expected cost and outcome from IVF and IUI treatment.
Six possible treatment scenarios were undertaken: four treatment types for patients in the IVF treatment group and two for patients in the IUI group based on the cancellation stage of treatment cycle and whether fresh or frozen embryo replacement cycle was undertaken (cancelled IVF before the oocyte pick-up stage, cancelled IVF before the ET stage, complete IVF cycle, complete frozen embryo replacement cycles, cancelled IUI cycle before insemination and complete IUI cycle). The costs and outcomes associated with undertaking each treatment pathway were used with the conditional probabilities of progressing through the models to calculate the expected costs and expected outcomes for each strategy and to estimate the ICER implicit in a decision to treat with IVF. A successful treatment outcome was defined as the delivery of at least one live born infant of at least 20 weeks gestation. Because of concerns over the skewed nature of cost, the gamma distribution was employed for cost parameters; however, live birth probabilities are bounded on the 0–1 interval, and this parameter was assumed to have a beta distribution. One thousand samples were drawn from the distributions to construct cost-effectiveness acceptability curves and to determine the 95% CIs of the ICERs. The cost-effectiveness acceptability curve reflects the probability that IVF treatment is cost-effective compared with IUI for an additional live birth from ART at a range of willingness-to-pay (WTP) values. The tornado diagram in Figure 3 shows that the effectiveness of the IVF treatment cycle has the greatest impact on the ICER.

Tornado diagram – ICER of IVF versus IUI treatment.
Figure 4 shows a scatterplot of the incremental cost-effectiveness of the IVF cycle versus the IUI, illustrating the cost-effectiveness quadrants.

PSA cost-effectiveness quadrants of IVF versus IUI treatment in Saudi Arabia.
The acceptability curve corresponding to the results of PSA at a range of WTP values for live birth from ART is presented in Figure 5; this curve shows the probability of IVF treatment being more cost-effective at different valuations placed for live birth. For example, at a value of SR 135,193 for an additional live birth, there is a 56% probability that the IVF treatment strategy is more cost-effective than IUI. If the ceiling cost-effectiveness ratio appropriate for decision-making purposes is SR 225,322 (3× Saudi gross domestic product (GDP) per capita, 2016) per extra live birth, there is a 79% chance that IVF is cost-effective.

Cost-effectiveness acceptability curves for a live birth from ART in Saudi Arabia.
Discussion
The aim of this cost-effectiveness study was to assess the cost-effectiveness of IVF and IUI treatment strategies from societal perspective to provide an assessment of the best first-line treatment option for the management of infertile couples with unexplained, mild male and mild female infertility.
The clinical outcome of this study revealed that treating unexplained infertility and mild male and female infertility with IVF as a first-line treatment resulted in a significantly higher clinical pregnancy rate (44.7%) and live birth rate (20.7%) than those of IUI.
Cost analysis showed that the average cost of the IVF and IUI cycles was SR 27,360 and SR 10,143, respectively, and the LBR per started IVF and IUI cycle was 20.7% and 7.9%, resulting in an average cost per live birth for the IVF and IUI treatment cycles of SR 132,174 and 128,392, respectively. The ICER was 134,508 SR per extra live birth implicit in a decision to treat with IVF.
The World Health Organization (WHO) proposed a threshold value bellow three times the country’s (GDP) per capita per QALY for interventions, which represents good value for money spent. 11
In SR, three times Saudi Arabia-GDP per capita for 2016 is equal to approximately SR 225,322. Therefore, using IVF as a first-line therapy for couples with unexplained, mild male and female factor infertility is valuable for money. In countries where IVF treatments are financially subsidized, IVF may be the patient-preferred first-line choice. 12 Recent update to the UK National Institute for Health and Care Excellence (NICE) guideline on fertility (2013) recommend stopping IUI through the National Health Service (NHS) and offering the IVF cycle for couples with unexplained or mild male factor infertility of more than 2 years in duration. 13
In Saudi Arabia, IVF treatment is provided in some public hospitals; the government provide full subsidy of ART services for nationals meeting eligibility criteria of primary infertility or secondary infertility with only one child and female age less than 43. Most of the service is provided by private clinics and is not covered by insurance, which requires both cost and clinical efficacy to be considered for decision-making.
To the best of our knowledge, this study provides the first comprehensive cost analysis study of ART in Saudi Arabia with a head-to-head comparison of two commonly practiced treatment modalities in the management of infertile couples by using actual cost data.
The limitation of this study includes possible bias because only one private centre was involved. Nevertheless, the sample size was large, and the medical group where this study was conducted is the largest service provider in Saudi Arabia. In addition, the heterogeneity of the sample examined, mainly due to the retrospective nature of the study, may introduce a bias that should be taken into consideration. This study did not include the analysis of cumulative live births from frozen cycles and did not include a time-to-pregnancy analysis for the two treatment strategies because only a few frozen-ET-cycle outcome data were available at the time of the study and because of the retrospective design of the study.
Conclusion
In conclusion, this study found that from a societal perspective, one cycle of IVF treatment was more costly but more effective than one IUI cycle, with an ICER for an additional live birth below three times the country’s GDP per capita per QALY threshold value for interventions, which represents good value for money spent.
Footnotes
Declaration of conflicting interests
The author(s) declared no potential conflicts of interest with respect to the research, authorship, and/or publication of this article.
Funding
The author(s) received no financial support for the research, authorship, and/or publication of this article.
Ethics approval
Ethical approval for this study was obtained from Ethics Committee of the University Kebangsaan Malaysia (Code: FF-18 2017-062) and Dr. Sulaiman Al Habib Medical Group (Code: 2016-002).
Informed consent
The requirement to obtain written informed consent was waived by the Institutional Review Board because this was a retrospective analysis of data and so written informed consent from participants was not required.