
Abstract
Aim:
To investigate the effects of fructose consumption on the antioxidant capacity in heart and kidney, cardiovascular disease risk factors, and evaluation of these variables after its removal.
Methods:
Male Wistar rats (n = 36) were divided into control group (n = 12): standard chow + water or F group: standard chow + fructose in drinking water (30%) for 15 weeks. After, F group was divided to continue receiving standard chow + fructose in drinking water (30%) (n = 12) or standard chow + water (Ex group, n = 12) for 9 weeks. Water, chow and caloric diaries intake, final body weight, adiposity index, plasma glucose and triacylglycerol, systolic blood pressure, and cardiac and renal hydrophilic antioxidant capacity were analyzed.
Results:
Control and Ex groups consumed less chow and water compared to F group. Caloric intake was higher in control group. There was no difference in final body weight and adiposity index. Systolic blood pressure and cardiac and renal hydrophilic antioxidant capacity were worst in F group.
Conclusion:
Prolonged exposure to fructose induces oxidative stress, systolic blood pressure, and increase in triacylglycerol. When stopped fructose consumption, Ex group presented improvement in these variables, suggesting the toxicity effect of fructose when consumed in high amounts and prolonged exposure.
Introduction
Fructose, commonly known as fruit sugar, is also a major component of sweeteners such as table sugar, honey, and high-fructose corn syrup (HFCS). The consumption of this type of sugar has significantly increased in the last years, partly because of the introduction of HFCS in the food industry. 1 Increased fructose consumption can lead to increase in blood lipids, 2 development of insulin resistance, 3 increase in inflammatory biomarkers and oxidative stress, risk on development of obesity, and comorbidities such as hypertension and diabetes mellitus type II, 4 all risk factors for kidney and cardiac dysfunction. Experimental studies suggest the toxic effect of fructose in these two organs.5–8 Kidney dysfunction is characterized by albuminuria, elevated serum creatinine, renal hypertrophy, and progressive renal disease. Heart disease is characterized by impaired left ventricular relaxation and diastolic dysfunction. 9
The oxidative stress has been described to be a key factor involved in the pathogenesis and progression of several diseases, mainly cardiovascular and renal diseases (chronic kidney disease (CKD)) by causing cellular damage and organ dysfunction.10–15 Studies show that 3 weeks of fructose intake to normal rats is associated with a state of oxidative stress due to an imbalance between reactive oxygen species (ROS) production and antioxidant capacity,12,13 while others showed that chronic consumption of fructose may lead to an overwhelmed of endogenous antioxidants and, consequently, promoting change in redox state by increasing ROS production, promoting oxidative stress. 14
However, studies evaluating the effects of the disruption of fructose consumption on the recovery of the redox state in the organs and under the risk factors for cardiovascular disease (CVD) are scarce and necessary for better understanding and to empathize the changing eating habits. Thus, the aim of this study was to investigate the effects of fructose consumption on the antioxidant capacity in heart and kidney, CVD risk factors, and evaluation of these variables after the removal of fructose intake.
Methods
Animals and experimental groups
For this study, the sample size calculation was based on previously published studies involving diet-induced obesity.16–19 A total of 36 male Wistar rats, 60 days of age, ±250 g/body weight, were maintained in an environmentally controlled room (22°C ± 3°C; 12-h light/dark cycle, and relative humidity of 60 ± 5%) and were fed with a standard rat pellet diet (Purina Ltd, Campinas, SP, Brazil) and water ad libitum. The diet consisted of soybean meal, ground whole corn, dextrin, rice husks, wheat bran, rice bran, soy oil, meat and bone meal, fish meal, vitamins, and minerals. The experimental protocol was approved by the Ethics Committee on the Use of Animals (CEUA) at the Botucatu Medical School, São Paulo State University (UNESP), under number 1065/2013. The animals were allocated into three groups (n = 12): C (control group): received standard chow + water; F (fructose group): received standard chow + fructose in drinking water (30%), both kept the consumption for 24 weeks; and Ex (ex-fructose group): received standard chow + fructose in drinking water (30%) for 15 weeks, then only standard chow + water for 9 weeks. Food and water intake were measured daily and body weights were determined once a week. The energy intake was calculated according to the formula: Energy intake (kcal/day) = food consumption (g) × dietary energy (3.81 kcal/g). For the animals that received fructose in drinking water (30%), the energy intake was calculated according to the formula: volume consumed (mL) × 0.3 (equivalent to 30% fructose) × 4 (calories per gram of carbohydrate) + caloric values offered by feeding (food consumption (g) × dietary energy (3.81 kcal/g)). 16
Body composition
A criteria based on the adiposity index (AI) was used to determine obesity according to several studies.20,21 After 24 weeks, animals were anesthetized by ketamine injection (50 mg/kg) and xylazine (0.5 mg/kg), decapitated, and thoracotomized, and the fat pads of adipose tissue were dissected and weighed. The AI was calculated using the following formula: AI = (total body fat (BF)/final body weight (FBW)) × 100. BF was measured from the sum of the individual fat pad weights: BF = epididymal fat + retroperitoneal fat + visceral fat.16,17,20 –22 Plasma was also collected for analysis.
Preparation of the tissues for analysis
Left ventricle and renal tissue were weighed (150 mg), then homogenized in 1.0 mL of phosphate-buffered saline (PBS) pH 7.4 cold solution (ULTRA-TURRAX® T25 basic, IKA® Werke Staufen/Germany), and centrifuged at 800g at 4°C for 10 min. In all, 200 µL of the supernatant was used to evaluate hydrophilic antioxidant capacity (HAC).
Biochemical measurements in plasma
An enzymatic colorimetric kit was used to measure glucose and triacylglycerol (Bioclin®, Belo Horizonte, Minas Gerais, Brazil).
Systolic blood pressure
Systolic blood pressure (SBP) evaluation was assessed in conscious rats by the non-invasive tail-cuff method with a NarcoBioSystems® Electro-Sphygmomanometer (International Biomedical, Austin, TX, USA). The animals were warmed in a wooden box (50 cm × 40 cm) between 38°C and 40°C with heat generated by two incandescent lamps for 4–5 min to cause vasodilation artery tail and were then transferred to an iron cylindrical support that was specially designed to allow total exposure of the animal’s tail. 23 After this procedure, a cuff with a pneumatic pulse sensor was attached to the tail of each animal. The cuff was inflated to 200 mmHg pressure and subsequently deflated. The blood pressure values were recorded on a Gould RS 3200 polygraph (Gould Instrumental Valley View, OH, USA). The average of two pressure readings was recorded for each animal.
Measurement of the HAC
The HAC was determined fluorometrically, as described by Beretta et al. 24 using VICTOR X2 reader (Perkin Elmer, Boston, MA, USA). The antioxidant activity was quantitated by comparing the area under the curve relating to the oxidation kinetics of the suspension phosphatidylcholine (PC), which was used as reference biological matrix. The 2′,2′-azobis-(2-amidinopropane)dihydrochloride (AAPH) was used as a peroxyl radical initiator. The results represent the percent inhibition (4,4 difluoro-5-(4-phenyl 1-3 butadiene)-4-bora-3,4-diaza-s-indacene) (BODIPY) 581/591 plasma with respect to what occurred in the control sample of BODIPY 581/591 PC liposome. All analyses were performed in triplicate. The results are reported in percentage of protection.
Statistical analysis
Results are expressed as mean ± standard deviation (median) for water, chow, caloric intake, glucose, and triglycerides (TGs). FBW, AI, and kidney antioxidant capacity are expressed as mean ± standard deviation. SBP and cardiac antioxidant capacity are presented as median (grading range). Data were compared using one-way analysis of variance (ANOVA), post hoc followed by Home-Sidak. Data with non-normal distribution were tested by non-parametric test (Kruskal–Wallis). All data were analyzed using SigmaStat version 3.5 for Windows (Systat Software, Inc., San Jose, CA, USA). Differences were considered significant at p < 0.05.
Results
Feed data are presented in Table 1. The group F presented higher consumption of water and lower feed intake compared to C and Ex groups. About the calories, the mean was higher in C group compared to F and Ex groups.
Dietary intake of of animals control (C), fructose (F), and ex-fructose (Ex) groups after 24 weeks.
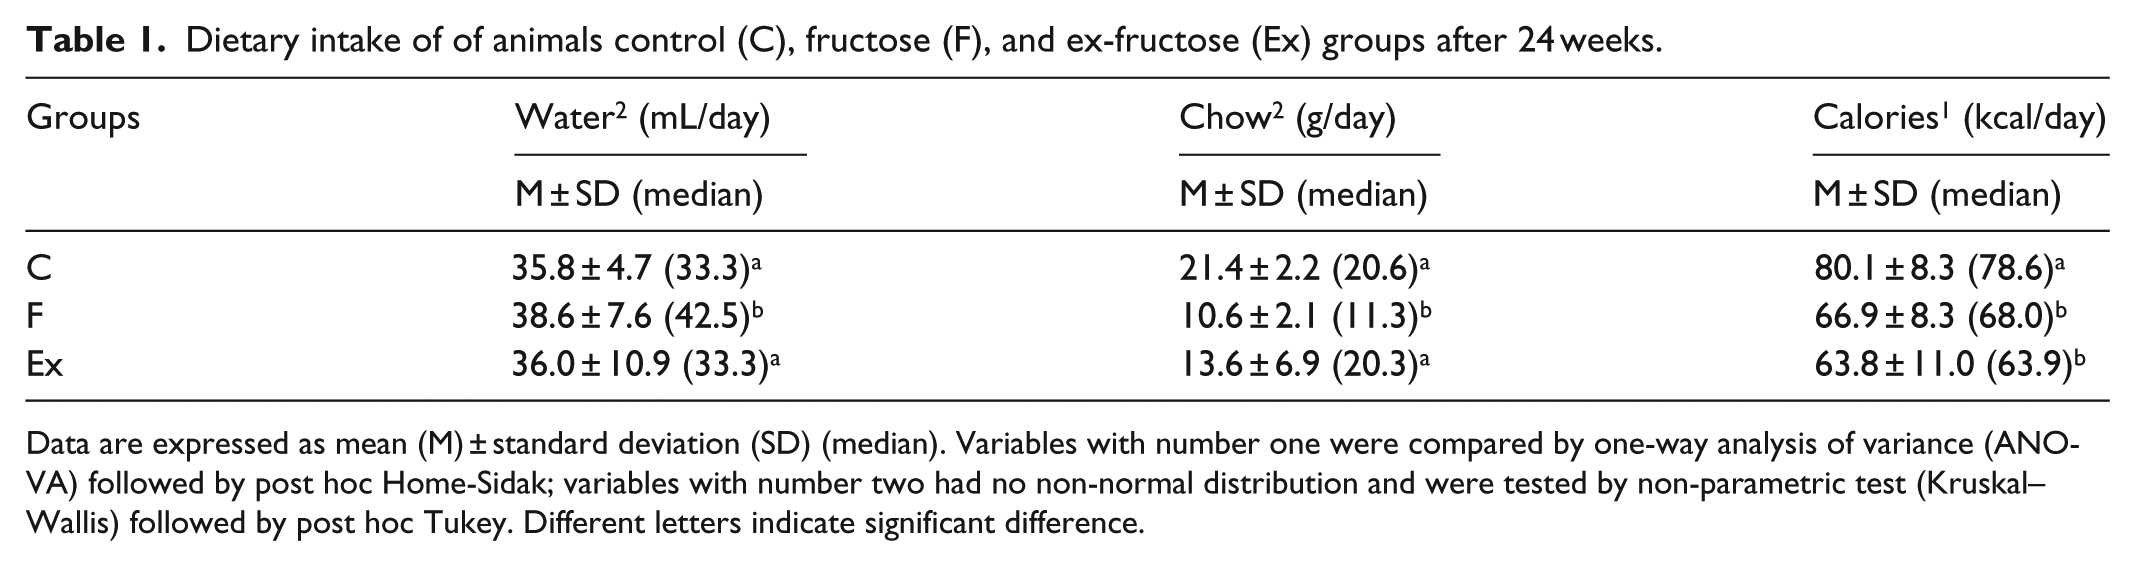
Data are expressed as mean (M) ± standard deviation (SD) (median). Variables with number one were compared by one-way analysis of variance (ANOVA) followed by post hoc Home-Sidak; variables with number two had no non-normal distribution and were tested by non-parametric test (Kruskal–Wallis) followed by post hoc Tukey. Different letters indicate significant difference.
Figure 1 presents the data of body composition of C, F, and Ex groups. There was no difference between the groups for FBW and AI.
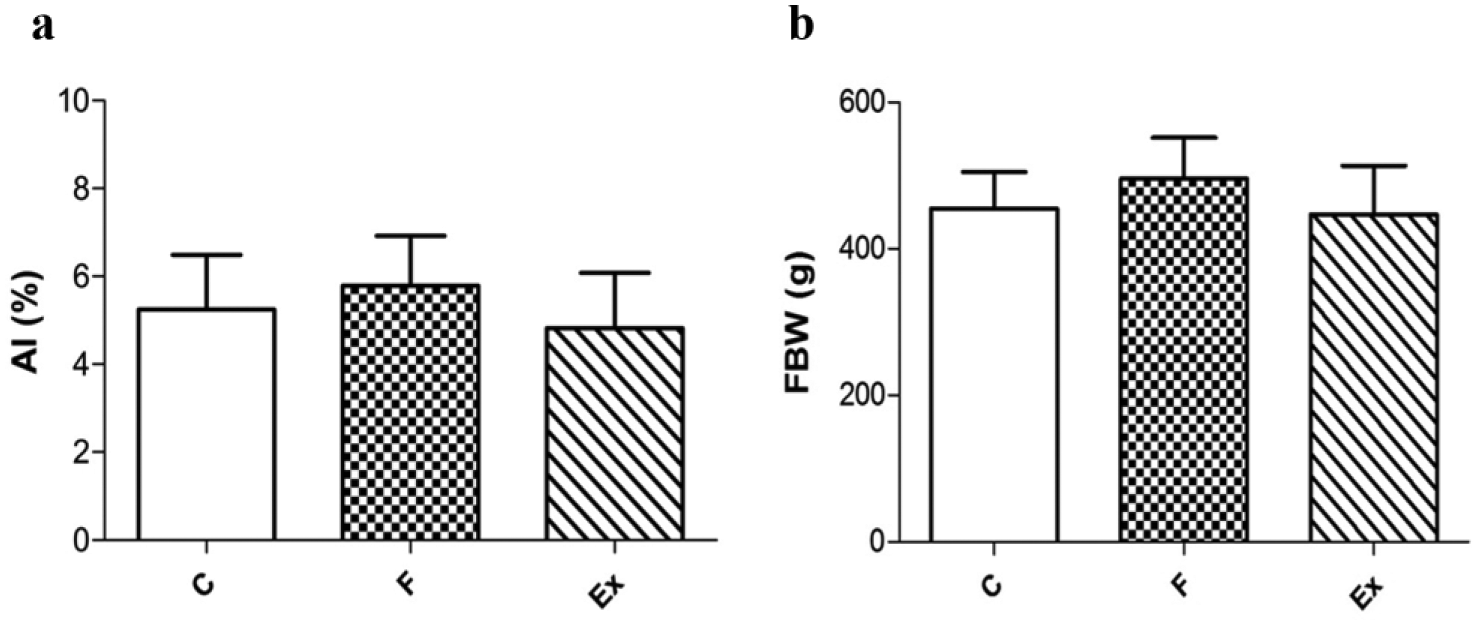
(a) Final body weight and (b) adiposity index of control (C), fructose (F), and ex-fructose group (Ex) in 24th week. Data are expressed as mean ± standard deviation. Comparison among groups by one-way ANOVA followed by post hoc Home-Sidak.
Table 2 shows the values of plasma TG and glucose (Glu) for the groups. The values of TG were higher in F group and there was a reduction in Ex group. There was no difference for glucose values among the groups.
Plasma values of triacylglycerol and glucose of control (C), fructose (F), and ex-fructose (Ex) groups after 24 weeks.

Data are expressed as mean (M) ± standard deviation (SD) (median). Variables with number one were compared by one-way analysis of variance (ANOVA) followed by post hoc Home-Sidak; variables with number two had non-normal distribution and were tested by non-parametric test (Kruskal–Wallis) followed by post hoc Tukey. Different letters indicate significant difference.
Figure 2 shows the values of SBP for the groups. The levels were higher in F group compared to C and Ex groups.

Data are expressed as median ± semi range. SBP: systolic blood pressure. Control (C), fructose (F), and ex-fructose group (Ex) in 24th week. Non-normal distribution was tested by non-parametric test (Kruskal–Wallis) followed by post hoc Tukey. Different letters indicate significant difference.
Figure 3 shows the % of HAC in kidney (a) and heart (b). There was a reduction in both tissues in the F group compared to C group. However, after fructose output, the values increased in Ex group for the same of C group.

(a) Kidney antioxidant capacity and (b) cardiac antioxidant capacity of control (C), fructose (F), and ex-fructose group (Ex) in 24th week. (a) Data are expressed as median ± semi range. Non-normal distribution was tested by non-parametric test (Kruskal–Wallis) followed by post hoc Tukey. (b) Data are expressed as mean ± standard deviation and compared by one-way ANOVA followed by post hoc Home-Sidak. ( Different letters indicate significant difference.
Discussion
The main objective of this study was to investigate the effects of fructose consumption via nutritional parameters, serum glucose and triacylglycerol, HAC in the heart and kidney tissues, SBP, and evaluation of these variables after the removal of fructose intake.
Consumption of sugar-sweetened beverages is the major source of fructose in the diet. 25 Although excessive fructose intake is epidemiologically linked with dyslipidemia, obesity, and diabetes, the mechanisms regulating plasma fructose are not well known. 26
In this study, after 24 weeks of fructose consumption, the F group presented decrease of chow and calories intake. There was also no difference between groups in the amount of solid food calories consumed. Apparently, sugar-sweetened beverages intake promote weight gain by decreasing satiety and promoting an incomplete compensatory reduction in energy intake of liquid calories. 25 Some limited evidence supporting incomplete compensation for liquid calories has also been provided by studies showing greater energy intake after isocaloric consumption of beverages compared with solid food. 27 On the other hand, we showed (Table 1) that animals who received fructose in diet presented a decrease in chow and calories consumption, whereas the liquid consumption was higher in these animals (F and Ex). These results indicate that fructose intake could suppress intake of solid food to the levels needed to maintain energy balance since there were no difference for body weight and AI among the groups (Figure 1(a) and (b)).
Supplementation with fructose for 24 weeks was not sufficient to induce an increase in fasting glycemia (Table 2), but were sufficient to induce an increase in triacylglycerol level. Dyslipidemia does not appear to be constantly induced by fructose supplementation in Wistar rats, while well documented in Sprague Dawley rats. Verily, several studies demonstrated variations in lipid levels. Some indicated a higher cholesterol and no variation in TG level, 28 while others showed the opposite,29,30 and some observed no changes in lipid levels. 31 However, as pointed out by Malik and Hu, 25 unlike glucose, fructose can bypass the step of glycolysis, allowing it to act as a substrate for hepatic de novo lipogenesis and production of lipids. Thus, intake of fructose in high amounts can promote TG synthesis.
SBP is also higher in fructose supplementation group (Figure 2). A progressive increase in fructose intake led to high risk for the blood pressure. 32 According to Elliott et al., 33 high-fructose consumption increases blood pressure. Additionally, excessive uptake and phosphorylation of fructose in the liver can also deplete intracellular adenosine triphosphate (ADP), leading to an increase in uric acid production, which has been shown to induce metabolic complications. Hyperuricemia has been associated with hypertension, diabetes, metabolic syndrome, kidney disease, and CVD. 34
As mentioned before, the fructose-fed animals presented bigger TGs content. In liver, high concentrations of TGs lead to an increase in beta-oxidation. Excessive fatty oxidation releases high amounts of ROS, producing lipid peroxidation metabolites. 35 The chronic imbalance of ROS production can impair the ability of the antioxidant system to reduce the levels of these radicals. The imbalance between the production and the removal of free radicals is intimately linked to a structural damage and cellular injury, also known as oxidative stress.
Fructose-enriched diet has been shown to promote oxidative stress in rodents. 36 In this study, we showed that 24 weeks of fructose consumption decreased the HAC in heart and kidney tissues, which can promote oxidative stress and inflammation process in these tissues. 37 Interestingly, we showed in this study that after stopping fructose consumption, Ex group presented an improvement in these parameters, demonstrating that it is possible to reverse tissue-induced fructose damages.
In conclusion, data from this study demonstrate that prolonged exposure to fructose induces oxidative stress via decrease of HAC in heart and kidney tissues. Additionally, prolonged exposure to fructose promotes SBP and increase in triacylglycerol content. Interestedly, when fructose consumption is stopped, animals belonging to Ex group presented decrease in triacylglycerol content and improvement in tissue HAC. These findings suggest the toxicity effect of fructose when consumed in high amounts and prolonged exposure.
Study limitations
This study aimed to analyze the effect of fructose in renal and cardiac redox state. With that, we did some biochemical, molecular, and histological analyses, which may be a limitation of the study.
Footnotes
Acknowledgements
The authors thank Paulo Cesar Georgete and Corina J. Corrêa Tomasetti for their technical support.
Declaration of conflicting interests
The author(s) declared no potential conflicts of interest with respect to the research, authorship, and/or publication of this article.
Ethical approval
The experimental protocol was approved by the Ethics Committee on the Use of Animals (CEUA) at the Botucatu Medical School, São Paulo State University (UNESP), under number 1065/2013.
Funding
The author(s) disclosed receipt of the following financial support for the research, authorship, and/or publication of this article: The authors thank Fundação de Amparo a Pesquisa do Estado de São Paulo, Brasil (FAPESP, proc.