
Abstract
Objective:
To assess the internal consistency and factorial validity of the adapted French 8-item Morisky Medication Adherence Scale in assessing adherence to noninsulin antidiabetic drug treatment.
Study Design and Setting:
In a cross-sectional web survey of individuals with type 2 diabetes of the Canadian province of Quebec, self-reported adherence to the antidiabetes drug treatment was measured using the Morisky Medication Adherence Scale-8. We assessed the internal consistency of the Morisky Medication Adherence Scale-8 with Cronbach’s alpha, and factorial validity was assessed by identifying the underlying factors using exploratory factor analyses.
Results:
A total of 901 individuals completed the survey. Cronbach’s alpha was 0.60. Two factors were identified. One factor comprised five items: stopping medication when diabetes is under control, stopping when feeling worse, feeling hassled about sticking to the prescription, reasons other than forgetting and a cross-loading item (i.e. taking drugs the day before). The second factor comprised three other items that were all related to forgetfulness in addition to the cross-loading item.
Conclusion:
Cronbach’s alpha of the adapted French Morisky Medication Adherence Scale-8 was below the acceptable value of 0.70. This observed low internal consistency of the scale is probably related to the causal nature of the items of the scale but not necessarily a lack of reliability. The results suggest that the adapted French Morisky Medication Adherence Scale-8 is a two-factor scale assessing intentional (first factor) and unintentional (second factor) non-adherence to the noninsulin antidiabetes drug treatment. The scale could be used to separately identify these outcomes using scores obtained on each of the sub-scales.
Keywords
Introduction
Medication adherence—the extent to which patients take medication according to the prescription of their health care provider—is important for patients to fully benefit from their drug treatment. The lack of medication adherence is frequent among people suffering from chronic diseases and particularly type 2 diabetes. 1 Poor adherence to antidiabetic drug treatment has a negative impact on diabetes control 2 and has been associated with an increased risk of hospitalization 3 and other complications of diabetes. 4 To efficiently intervene to improve adherence, health care providers must be able to accurately assess both patients’ adherence and the reasons that lead to non-adherence.
Of the various methods available for measuring medication adherence, only some self-reported measures can provide information on both patient adherence and reasons for not taking their medications as prescribed. 5
Adherence is then conceptualized as a latent variable (i.e. a combination of items that contribute together to characterize the adherence behavior), and an adherence score is derived from the scores of each item composing the measurement scale. 6
A key prerequisite to using a self-reported measure is to ensure it is reliable and valid, that is, it is really measuring what it is intended to measure.6,7 Reliability refers to the degree of stability (a person completing twice the instrument should respond the same way) and coherence (a person should provide similar answers to different questions measuring the same construct).6,7 Validity is used to specify the degree to which the measure really evaluates the construct.6,7 Factorial validity (or construct validity) is one of the components of validity that allows assessing whether the items composing a measure all contribute to exclusively assess the construct of interest.6,7 Some constructs may be made of different sub-constructs representing specific aspects of the whole construct. For this situation, factorial validity allows to identify the items of a given scale that specifically assess the sub-constructs.
Among the self-reported measures that are available to assess both adherence and reasons contributing to non-adherence, the 8-item Morisky Medication Adherence Scale (MMAS-8) 8 is frequently used. Clinicians can use this scale to easily identify causes of non-adherence and counsel patients on the cause specifically identified. 9 In the original validation study in hypertension, the MMAS-8 showed good psychometric properties (i.e. high internal consistency (Cronbach’s alpha of 0.83) and identification of only one underlying factor) in measuring medication adherence. 8 In a recent validation study conducted in patients with hypertension, the MMAS-8 was also observed to be a one-factor scale. 10 In contrast, when used among individuals with type 2 diabetes to assess adherence to antidiabetes drug treatment, studies have suggested that the MMAS-8 could be made of two 11 or three12,13 factors. A recent validation study of a German version of the scale conducted among patients with cardiovascular disease showed that the MMAS-8 is made of four sub-scales. 14 Currently, it is difficult to conclude on the dimensionality of the MMAS-8 because the analytical methods used in some studies to determine its factorial structure may have been sub-optimal. For example, because seven of the eight MMAS-8 items are dichotomous variables, factor analysis should be based on the tetrachoric/polychoric correlation among items rather than on Pearson correlation.15,16 However, the type of correlation used for the analysis was not indicated in any of the previous studies mentioned above.8,10,11,13,17 Additionally, the methods used to extract the possible underlying factors and/or retain the number of factors may not have been adequate.15,18–20 For example, in the three studies that were conducted among individuals with type 2 diabetes,11–13 eigenvalues were used to retain the number of underlying factors, whereas it is recommended to use the scree plot test or parallel analysis for this purpose.18–20 These issues could explain why the authors have obtained two or three underlying factors.
We thus assessed the internal consistency and factorial validity of the MMAS-8 in a sample of individuals with type 2 diabetes and attempted to avoid the limitations of previous validation studies.
Methods
Study population
The study population was drawn from the membership file of the Quebec provincial diabetic patients’ advocacy association (Diabète Québec). Diabète Québec is a non-profit association including more than 40 affiliated associations throughout the Canadian Province of Quebec. The association advocates for patients with diabetes and provides services and diabetes education to its members. Membership is open to individuals suffering from diabetes and their relatives. 21
A staff member of the association e-mailed all members (n = 6258) who met the following criteria: aged 18 years or older with a valid e-mail address and notification that they were suffering from type 2 diabetes. They were asked for their participation in a cross-sectional web survey that was conducted to assess the factors associated with the use of noninsulin antidiabetic drugs.
Data collection
Consenting participants were sent by e-mail a personalized secure link to reach the questionnaire. Medication adherence, participants’ socio-demographics and diabetes-related variables were self-reported through the above-mentioned questionnaire. The survey took place between 5 December 2012 and 24 February 2013.
Variables
MMAS-8
The MMAS-8 was originally developed from a previous 4-item scale (the MMAS-4) by adding “items addressing the circumstances surrounding adherence behavior.” 8 For the first seven items, the response categories are yes/no and are scored 1 for adherent or 0 for non-adherent. The last item uses a 5-point Likert scale that can take one of 5 values: 1, 0.75, 0.5, 0.25 or 0. Scores obtained from the MMAS-8 range from 0 to 8, with scores of <6, 6 to <8, and 8 indicating low, medium and high adherence, respectively. 8 We used a French (France) version of the MMAS-8 10 that we adapted to refer to the use of noninsulin antidiabetic drugs (Supplemental Table S1). 22 The reference period to assess adherence included the 30 days preceding questionnaire completion.
Other variables
The following self-reported participants’ characteristics were considered: sex, age, education, type of drug insurance (private or public), body mass index (based on weight and height), cigarette smoking and main occupation during the 12 months preceding the survey. Self-reported diabetes-related variables included diabetes duration (time since diagnosis until the questionnaire completion) and antidiabetic drugs reported by patients as being prescribed to them at the time they completed the questionnaire. A list of all antidiabetic drugs that were available when the survey was conducted was provided to participants to facilitate this task.
Statistical analyses
We analyzed the characteristics of the study population using descriptive statistics. We assessed the internal consistency of the MMAS-8 using Cronbach’s alpha. Internal consistency was considered satisfactory if the coefficient alpha was 0.7 or higher. 6
The MMAS-8 factorial validity was evaluated through an exploratory factor analysis using principal factor extraction method and oblique rotation. 18 Factor analysis was performed using the tetrachoric/polychoric correlation matrix which has been recommended for factor analysis of scales with dichotomous/ordinal variables.15,16 We used two recommended methods, that is, the scree plot test 18 and Velicer’s minimum average partial (MAP) test18,23 to determine the number of factors to retain. Items with a loading at 0.32 or higher on a factor were considered to pertain to this factor. 18
Sample size consideration
Sample size for factor analysis is influenced by the ratio of number of individuals who completed the questionnaire to the number of items in the questionnaire. Costello and Osborne 18 have empirically tested the effect of sample size on the results of factor analyses and observed that for a ratio of 20:1, 70% of the samples produced a correct factor structure. In this study, 901 individuals completed the MMAS-8 during the web survey and were all included in the analyses. This sample corresponds to an individual to item ratio of 112:1 (901/8). We performed analyses using SAS version 9.4 (SAS Institute, Cary, NC, USA).
This study was approved by the CHU de Québec – University ethics in research committee.
Results
Table 1 displays characteristics of the 901 participants who completed the study. Most participants were male and retired, with at least a college education.
Characteristics of the 901 participants.

Unless otherwise indicated, values are numbers and percentages.
Q1 = 25th percentile, Q3 = 75th percentile.
“Other” includes students, individuals receiving guaranteed income supplement, unemployed and housekeepers.
Based on the MMAS-8 scores, the proportion of participants with low, medium or high adherence was 14.5%, 40.6% and 44.9%, respectively. The MMAS-8 Cronbach’s alpha was 0.60. In terms of its factorial validity, based on the scree plot (Figure 1) and Velicer’s MAP test (Table 2), two factors were retained after exploratory factor analysis. The eigenvalues of the two factors were 3.55 and 0.99, respectively. The five following items loaded above 0.32 on the first factor: “stopping medication when feeling worse,” “stopping medication when diabetes is under control,” “other reasons than forgetting,” “feeling hassled about sticking to the prescription” and a cross-loading item (“did you take your antidiabetic medicine yesterday”). The three items related to forgetfulness and the cross-loading item had a loading above 0.32 on the second factor (Table 3).
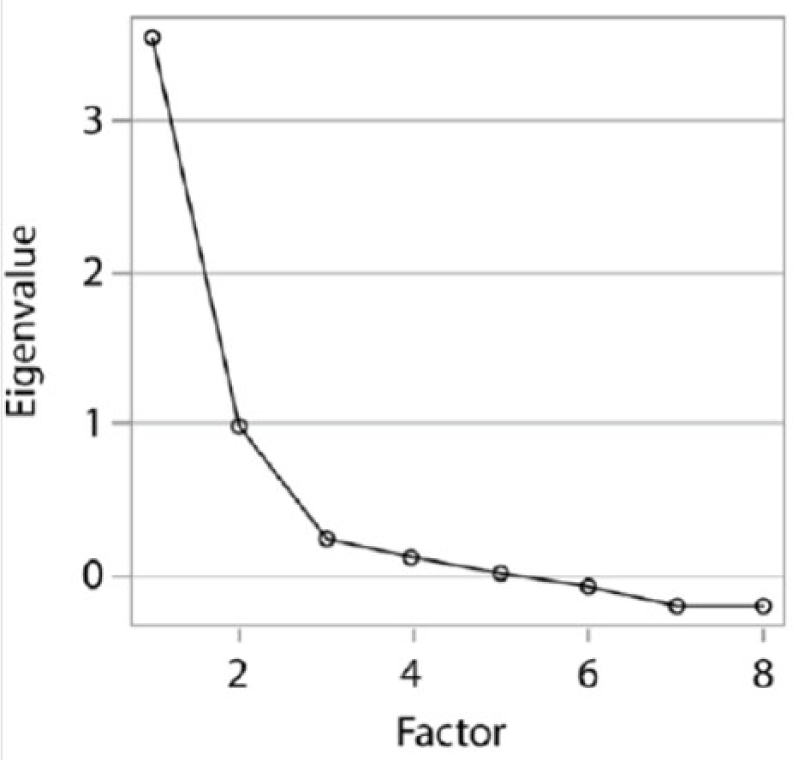
Scree plot of exploratory factor analysis of the adapted Morisky Medication Adherence Scale (MMAS-8) using tetrachoric/polychoric correlation between items of the scale.
Velicer’s minimum average partial (MAP) test results for determining the number of underlying factors of the adapted French MMAS-8 in exploratory factor analysis (tetrachoric/polychoric correlations between items of the scale are used for analysis).

MMAS: Morisky Medication Adherence Scale.
The average squared partial correlation and the average 4th power partial correlation are smallest (values in bold) when the number of factors is two, thus suggesting that the number of factors of the MMAS-8 according to Velicer’s MAP test is two.
Factor loading patterns of the adapted French MMAS-8 in exploratory factor analysis with oblique rotation, using tetrachoric/polychoric correlation between items of the scale (n = 901).

MMAS: Morisky Medication Adherence Scale.
Values in bold are those with a loading at 0.32 or higher on a factor which means they pertain to this factor.
Discussion
Two main results emerged from this study. First, the internal consistency of the MMAS-8 to assess noninsulin antidiabetic adherence was less than satisfactory, as Cronbach’s alpha observed was below the a priori value set at 0.70. Next, factor analyses revealed that the scale has two underlying factors.
Cronbach’s alpha we obtained is not consistent with the 0.83 Cronbach’s alpha observed in the original MMAS-8 validity study in hypertensive patients. 8 In contrast, our result is consistent with Cronbach’s alpha values ranging from 0.61 to 0.67 observed in recent studies conducted in type 2 diabetes11–13,17 and from 0.54 and 0.68 observed in studies among hypertensive patients.10,24 The higher Cronbach’s alpha observed in the original MMAS-8 validity study 8 might have occurred because the coefficient alpha is sample specific; in other words, it is a measure of the internal consistency for the test responses in a specific set of participants.6,25 Some of our participants’ characteristics may differ from those of participants in the original study, which may therefore explain the difference in magnitude. However, the lower internal consistency we observed may also be due to the nature of the items composing the scale. According to Voils et al., 5 most of the MMAS-8 items could be considered causal indicators (i.e. indicators that contribute together to explain the underlying factor in contrast to effect indicators, which are the manifestation of the underlying factor). Except the item “Did you take your medicine yesterday?”, all the items of the MMAS-8 can be classified as causes of non-adherence.
Internal consistency may not be an optimal method to assess the reliability of a scale made with causal indicators.5,26 Indeed, for a scale made with items that are the causes of the underlying variable, each item should capture distinct aspects of the latent variable (here, the reasons contributing to non-adherence), and therefore, sizable correlation between items is not necessarily expected.5,26 Consequently, because high internal consistency depends on high inter-item correlations,5,26 the observed less than satisfactory internal consistency of the MMAS-8 does not necessarily indicate that it is an unreliable scale. Other methods such as test–retest reliability 5 could provide a better assessment of the MMAS-8 reliability.
The results of our factor analyses show that the MMAS-8 has two underlying factors. Non-adherence has been described to be either non-intentional or intentional. 27 Our results suggest that the MMAS-8 could be measuring those two components. For example, all of the items that load on the first factor except the cross-loading one can be classified as causes of intentional non-adherence (see Table 3). However, all items loading on the second factor (except the cross-loading item) are all related to forgetfulness, which is a cause of unintentional non-adherence. In regard to the cross-loading item—“Did you take your diabetes medicine yesterday?”—it is rather a measure of the outcome behavior (intentional or non-intentional non-adherence) than one of its causes. This may therefore explain why it is cross-loading on both factors.
Because health care providers cannot anticipate whether non-adherence, if present, would be intentional or unintentional, and because targeted adherence-enhancing interventions are more likely to succeed, a two-step assessment approach could be used. First, adherence could be assessed with the full MMAS-8. Next, the health care provider could focus on each sub-scale score to determine the presence of intentional or unintentional non-adherence. Accordingly, the unintentional non-adherence score should be based on the sum of scores for the three items related to forgetfulness (i.e. range of 0–3), whereas the intentional non-adherence score should be based on the sum of scores for all other items but the cross-loading one (i.e. range of 0–4). Consequently, if a score on a sub-scale is inferior to the maximum, the item(s) in cause should be identified and addressed by the care provider.
Because MMAS-8 items assessing unintentional non-adherence are all related to forgetfulness, future research should explore supplementing the scale with other unintentional reasons to make it more comprehensive. For example, potential supplemental items could be related to the quality of the patient–care provider relationship or to drug affordability.
Our identification of two underlying factors is consistent with what was observed by Wang et al. 11 in a sample of individuals with type 2 diabetes. In this latter study, all three items related to forgetfulness loaded on the same factor, whereas two other items (“stopping to take medication when diabetes is under control” and “stopping when feeling worse”) loaded on a different factor, as they did in our study. However, for the three remaining items, Wang et al. observed an item-factor relationship that differed from the one we observed. Indeed, the items “stopping medication for other reason than forgetting” and “feeling hassled about sticking to the prescription” were loading on the same factor than the three items related to forgetfulness. Finally, the item “did you take your medicine yesterday” loaded on a single factor, 11 whereas in our study, it cross-loaded on both factors. In two other studies conducted among type 2 diabetes patients, the MMAS-8 was found to be a three-factor scale.12,13 In these latter studies, although there were three underlying factors as opposed to the two we observed, at least two of the three items related to forgetfulness were loading on the same factor as in our study.12,13 The items “stopping medication when diabetes is under control” and “stopping medication when feeling worse” were also loading on the same factor as in our study.12,13 Differences in the number of factors or in the item–factor relationship between our results and those of previous studies could be due to the different methods used to analyze the data. For example, in the three previous studies,11–13 a principal component analysis was used to identify the possible underlying factors, whereas we used factor analysis. Principal component analysis is a data reduction method (i.e. a reduction of a set of variables without the aim of interpreting the resulting variables in terms of latent constructs).18–20 Principal component analysis does not differentiate between shared and unique variance of the items and may therefore lead to inflated factor loading.18,19 However, because the purpose of assessing the factorial validity of the MMAS-8 is to understand the latent structure of the set of items composing it, the use of a factor analysis represents a high-quality decision.19,20 The use of factors’ eigenvalues (i.e. eigenvalue ⩾1) by previous authors to retain the number of underlying factors11–13 may also explain the between-studies’ differences in terms of the number of factors retained. Using Monte Carlo analyses, Costello and Osborne 18 observed that 36% of samples retained too many factors when using the eigenvalue as a criterion as opposed to using the scree test as we did. Note that, although it is indicated to use tetrachoric correlation between items to assess the factorial structure of scales made with dichotomous items, the type of correlation (either Pearson’s correlation or tetrachoric correlation) used to analyze the data was not mentioned in the three previous studies.11,13,17
The results of our factor analysis are different from those observed in the original MMAS-8 validation study 8 and in a more recent validation study; 10 both were performed with hypertensive patients. In these validation studies, the MMAS-8 had only one underlying factor.8,10 This difference could be due to differences in the factor extraction methods used and/or in the methods used to retain the number of factors. However, in the original validity study, 8 those methods were not reported. In the more recent study, 10 although parallel analysis (i.e. one of the recommended methods) was used to retain the number of underlying factors, the authors used a principal component analysis as opposed to a factor analysis to extract the possible underlying factors. This approach could then explain the difference between our results and those observed in this latter study. Additionally, in these two studies, the type of the correlation between items used in the analysis was not provided.
Our study has limitations. First, because we only assessed the internal consistency of the MMAS-8, we cannot draw any conclusions concerning its reliability. Second, because the population in a web survey is restricted to those who have access to Internet and are computer literate, our study sample may not be representative of the general population with type 2 diabetes. Because Cronbach’s alpha is sample specific, 6 the observed MMAS-8 internal consistency could have been different if we had access to a more representative sample. However, some characteristics (sex, age, body mass index and diabetes duration) of the participants are similar to those observed in a population of patients with type 2 diabetes managed by Canadian primary care physicians. 28 In addition, in a recent study, we asked 221 individuals randomly selected from the current study population to provide measures of glycated hemoglobin (A1C). 22 In all, 43% of the 153 individuals who provided A1C values had optimal glycemic control (A1C ⩽ 7%). This proportion is in line with the 50% observed in a large Canadian survey of individuals with type 2 diabetes conducted in 2012. 28 Next, as they are often more homogeneous than random samples, convenience samples such as ours tend to attenuate correlations among variables. This attenuation can result in underestimating item loadings. 19 Thus, if tested in a random sample of type 2 diabetes patients, the MMAS-8 item loadings would likely be higher than those we observed.
Conclusion
Cronbach’s alpha of the adapted French MMAS-8 was lower than the acceptable value of 0.70. However, this observed low internal consistency of the scale could be explained by the causal nature of the items of the scale. Therefore, this should not necessarily be interpreted as a lack of reliability of the scale.
We observed that the MMAS-8 comprises two sub-scales. One sub-scale is composed of items related to intentional non-adherence, and the other sub-scale comprises items that measure unintentional non-adherence. Consequently, our results suggest that the MMAS-8 can help identify both intentional and unintentional non-adherence to noninsulin antidiabetic drug treatment and may therefore be useful to conduct targeted interventions. This measurement can be performed using scores provided by each of the two MMAS-8 sub-scales.
Given the importance of accurately detecting medication non-adherence in clinical practice, future research should look at ways to improve this process. For example, studying the psychometric properties of a modified MMAS-8 that would incorporate additional items addressing the quality of the patient–care provider relationship, drug affordability (run out of drug) and patients’ beliefs on the use of drugs would be a valuable contribution.
Footnotes
Declaration of conflicting interests
The author(s) declared no potential conflicts of interest with respect to the research, authorship and/or publication of this article.
Ethical approval
Ethical approval for this study was obtained from the CHU de Québec ethics in research committee (approval number/ID: DR-002-1369).
Funding
The author(s) disclosed receipt of the following financial support for the research, authorship, and/or publication of this article: This study was funded by Diabète Québec and the Laval University Chair on adherence to treatments. The Chair is supported by the Fondation de l’Université Laval and was supported by unrestricted grants from AstraZeneca Canada, Merck Canada, Pfizer Canada, Sanofi Canada and the Prends soin de toi program.
Informed consent
Written informed consent was obtained from all subjects before the study.
References
Supplementary Material
Please find the following supplemental material available below.
For Open Access articles published under a Creative Commons License, all supplemental material carries the same license as the article it is associated with.
For non-Open Access articles published, all supplemental material carries a non-exclusive license, and permission requests for re-use of supplemental material or any part of supplemental material shall be sent directly to the copyright owner as specified in the copyright notice associated with the article.