
Abstract
Mobile apps are very popular. However, this is not true for every app, with some apps receiving millions of downloads, while other apps are mostly ignored. We investigate the popularity of apps in terms of downloads by focusing on two salient cues: (a) online recommendations (e.g., presence and valence of online reviews) and (b) visual characteristics of app icons (e.g., use of visual metaphors and anthropomorphism). Study 1 was a field study in which we content-analyzed 500 apps from the “transportation” subcategory of the Google Play Store. We found that the presence and valence of online reviews, as well as the presence of visual metaphors in app icons were positively related to the number of app downloads. Study 2 was an experiment in which we presented participants with different app icons containing different types of visual metaphors. We again found that app icons with visual metaphors led to more positive attitudes towards the apps and behavioral intentions. Combined, our studies show that both online consumers (through online reviews) and app designers (through visual design) impact an app’s popularity.
The popularity of mobile apps—small computer programs designed to run primarily on smartphones and tablet computers—is soaring. In June 2014, Google’s Play Store contained over 1.5 million apps, which were downloaded more than 40 billion times, marking an increase of 60% in the number of apps compared to June, 2013 (“The State of Play,” 2014). However, app downloads are not evenly distributed, because a relatively small percentage of apps is responsible for a relatively large chunk of downloads (Petsas, Papadogiannakis, Polychronakis, Markatos, & Karagiannis, 2013; Zhong & Michahelles, 2013). An important question is thus why some apps in the app store succeed in attracting the attention of smartphone and tablet users, while other apps do not. The current paper examines the role of two of the most prominent cues in an online app store—online reviews and visual icons—in terms of their ability to promote app downloads.
To answer these questions, we depart from the theoretical perspective of the MAIN model (Sundar, 2008), which proposes that, when assessing information in online environments like app stores, users typically rely on four types of cues: (a) navigability, (b) interactivity, (c) agency, and (d) modality. Furthermore, the more commercial online information—also in a mobile context—meets these criteria, the likelier online consumers report a favorable purchase intention (K. J. Kim & Sundar, 2016). Because, at least at the time on which data were collected in 2014, different types of apps are presented in a similar format in app stores like Google Play and Apple’s App Store, the navigability and interactivity of the website on which app information is located (the app store) are likely similar for all apps. Yet, app stores can present different cues related to agency and modality which may sway potential users (or not).
First, agency refers to elements related to the source of information. In app stores, information about specific apps is typically provided by at least two sources: (a) the app developers (e.g., in the app description) and (b) online reviews of other users. Presence of reviews and review valence can act as cues to products’ desirability or quality (Lim & van der Heide, 2015; Sundar, Oeldorf-Hirsch, & Xu, 2008). On product websites, such online consumer recommendations can predict new consumers’ considerations (Fagerstrøm, 2011). We study whether these findings can be further generalized to apps in app stores.
Second, modality refers to the way in which information is presented (e.g., via text, images, video, etc.; Sundar, 2008). On this dimension, app developers can make various design choices aimed at attracting favorable attention from potential consumers. Furthermore, users trying to navigate an information-rich environment may be particularly swayed by cues containing visual information (Pirolli, Card, & van der Wege, 2001; Sundar, Jia, Waddell, & Huang, 2015). Indeed, a prominent design characteristic of apps in app stores is relatively large visual icons. While modality studies based on the MAIN model have typically compared information presented in various modalities (e.g., text vs. video; K. J. Kim & Sundar, 2016; K. J. Kim, Sundar, & Park, 2011), presentation differences within one modality can also impact the reception of visual cues. According to scholars of visual rhetoric (e.g., Delbaere, McQuarrie, & Phillips, 2011; Forceville, 1996; van Mulken, le Pair, & Forceville, 2010), various visual-rhetorical devices can be used to draw consumers’ attention. Two prominent devices used are visual metaphor (cross-domain mappings, e.g., a pin on a map indicating a person’s location) and visual anthropomorphism (objects or animals are presented as human beings, e.g., Mickey Mouse; Hosany, Prayag, Martin, & Lee, 2013). We study whether such differential visual-rhetorical devices can predict app downloads.
In the following sections, we first review the relevant literature on both online reviews and visual rhetoric in relation to apps and app downloads. Subsequently, we report on two studies. Study 1 is a field study of 500 apps from the Google Play Store in which we study how online reviews and visual rhetoric in app logos are related to app success. To further specify the role of visual rhetoric, which has been relatively neglected in the study of online cues, Study 2 is an online experiment that aims to replicate the results of Study 1 alone for visual metaphors.
Online reviews
Consumers having to make a risky purchase decision often seek out information to make informed decisions (Reinstein & Snyder, 2005). An important cue for making such an informed decision can be found in past experiences. First, users typically rely on their own past experiences (Fondevila Gascón, Carreras Alcalde, Seebach, & Pesqueira Zamora, 2015). However, when users themselves do not have experiences with a specific product or service themselves, they often rely on past social experiences, or the experiences of other users of similar products or services, as expressed through online reviews (Dou, Walden, Lee, & Lee, 2012; Lee & Shin, 2014; Vermeulen & Seegers, 2009). In the context of product web sites, for instance, online reviews were found to be the most important cue predicting whether or not consumers purchase a product (Fagerstrøm, 2011).
In evaluating online reviews, consumers not only focus on the argumentation in the review (e.g., Zhang, Zhao, Cheung, & Lee, 2014), but also on heuristic cues. One of these heuristic cues is related to the number of reviews an app receives (Sundar et al., 2008; Zhang et al., 2014). The quantity of reviews (“volume”) can be an indicator of the trustworthiness of the general opinion on the product. The idea is that if many online consumers share a certain product evaluation, this presents more credible information compared to opinions shared by a relatively low number of consumers (Flanagin & Metzger, 2013). In this way, the volume of online reviews can serve as a bandwagon cue indicating whether consumers have reached consensus (or not) on the general evaluation of a certain product.
A second important cue as to how online reviews are processed lies in the valence of the online reviews. Online reviews can either present a positive, negative, or neutral image of the described product or service. Various studies have shown that if the overall valence of online reviews is positive (vs. negative), consumer attitude towards the evaluated product or service is also more positive (e.g., Chevalier & Mayzlin, 2006; Lim & van der Heide, 2015; van der Heide & Lim, 2015; Vermeulen & Seegers, 2009; Ye, Law, Gu, & Chen, 2011). In other words, if other users previously had positive experiences with the product or service, this may lead new users to expect that they will also have a positive experience.
While such effects of heuristic cues (volume, valence) in online reviews have been shown for a variety of products and services such as books (Chevalier & Mayzlin, 2006) and hotels (Vermeulen & Seegers, 2009; Ye et al., 2011), it has not yet been established whether they also hold true for the choices of apps in app stores. One difference between such products and apps is that the decision to install an app is less risky. This may imply that consumers want to invest less time in deciding to install the app (or not), making them more open to suboptimal decisions (Lunn, 2013). For instance, one heuristic that consumers use to make decisions in app stores is “take the first” (Dogruel, Joeckel, & Bowman, 2015). This means that consumers pay little attention to information provided by the app store, but rather simply take the first app that comes up after their search. This “take the first” heuristic suggests that consumers spend very little time on the decision to install an app (or not). However, despite this potentially low risk, we expect that previous findings for online reviews will also translate to apps in app stores; we expect that consumers behave in app stores in a relatively similar way as in other online stores. We thus expect that:
H1. Apps that receive (a) online reviews and (b) more positive online reviews are downloaded more often.
Visual rhetoric
Next to information provided by online reviews, visual information may also be used as a cue in online environments (e.g., Chittaro & Sioni, 2014; Dou et al., 2012; Lee & Shin, 2014). For instance, in the context of apps, Chittaro and Sioni (2014) found that using visualization in breathing-training apps led to greater improvements compared to apps containing only audio instructions. One type of visual that stands out in app stores is the logo of the app used as an icon in the app store.
After a careful review of the literature, the role of visuals of logos in online environments seems to be understudied. However, the persuasive effects of visuals in traditional print advertising have received ample empirical attention. In such studies, researchers have looked at the effects of different types of visual rhetoric like visual metaphor (e.g., Forceville, 1996; Lagerwerf, van Hooijdonk, & Korenberg, 2012; van Mulken et al., 2010; van Mulken, van Hooft, & Nederstigt, 2014) and visual anthropomorphism (e.g., Delbaere et al., 2011; Hart, Jones, & Royne, 2013; Patterson, Khogeer, & Hodgson, 2013). The current study extends these contributions by examining the role of metaphor and anthropomorphism in app logos.
Metaphors are cross-domain mappings (Lakoff & Johnson, 1980), which means that some elements of a source are transferred onto a target. For instance, a familiar conventional visual metaphor is to present a new idea by a light bulb that is activated. In this metaphor, elements from the source domain of light bulbs (e.g., radiant, bright) are transferred onto the target domain of ideas. The use of visual metaphors in print advertising has steadily increased between 1954 and 1999 (Phillips & McQuarrie, 2002). Furthermore, visual metaphors can be effective rhetorical devices in advertising that positively impact consumers’ ad perceptions (e.g., Lagerwerf et al., 2012; McQuarrie & Phillips, 2005; van Mulken et al., 2010; van Mulken et al., 2014). Visual metaphors do so by presenting their recipients with a small puzzle (cf. McQuarrie & Phillips, 2005; van Mulken et al., 2010; van Mulken et al., 2014), the solving of which takes cognitive elaboration (J. Kim, Baek, & Choi, 2012). Upon having successfully solved the puzzle, this elaboration can lead to pleasure, which may subsequently transfer to the ad and product. We thus expect that:
H2. Apps with visual metaphors in the app logo are more persuasive than apps without visual metaphors in the app logo.
In commercial advertising, visual metaphors are found to be most effective at medium levels of complexity, where they present their readers with a cognitive challenge that is still solved relatively easily (cf. van Mulken et al., 2010; van Mulken et al., 2014). Studies that model the complexity of visual metaphors do so by considering the visual structure of the metaphors, which focuses on the ways in which source and target are visually presented. Four types of visual metaphors are defined (see Figure 1, for examples). The easiest type of visual metaphors is supposed to be a visual simile (Forceville, 1996; van Mulken et al., 2010; van Mulken et al., 2014). In a simile, both the source and the target domain are presented as two separate entities that are somehow aligned. A hybrid metaphor is supposed to be more complex than a visual simile (Forceville, 1996; van Mulken et al., 2010; van Mulken et al., 2014): in a hybrid, the source and target elements are fused into one object. The most complex type of visual metaphor is a contextual metaphor, in which either the source or target concept is absent from the image and needs to be inferred by the recipient (Forceville, 1996; van Mulken et al., 2010; van Mulken et al., 2014). A fourth and special type of visual metaphor is a verbo-pictorial metaphor in which verbal and pictorial elements are fused into one gestalt (Forceville, 1996). It is unclear how verbo-pictorial metaphors hold up against the other metaphor types, as they are the only ones to also include verbal text.
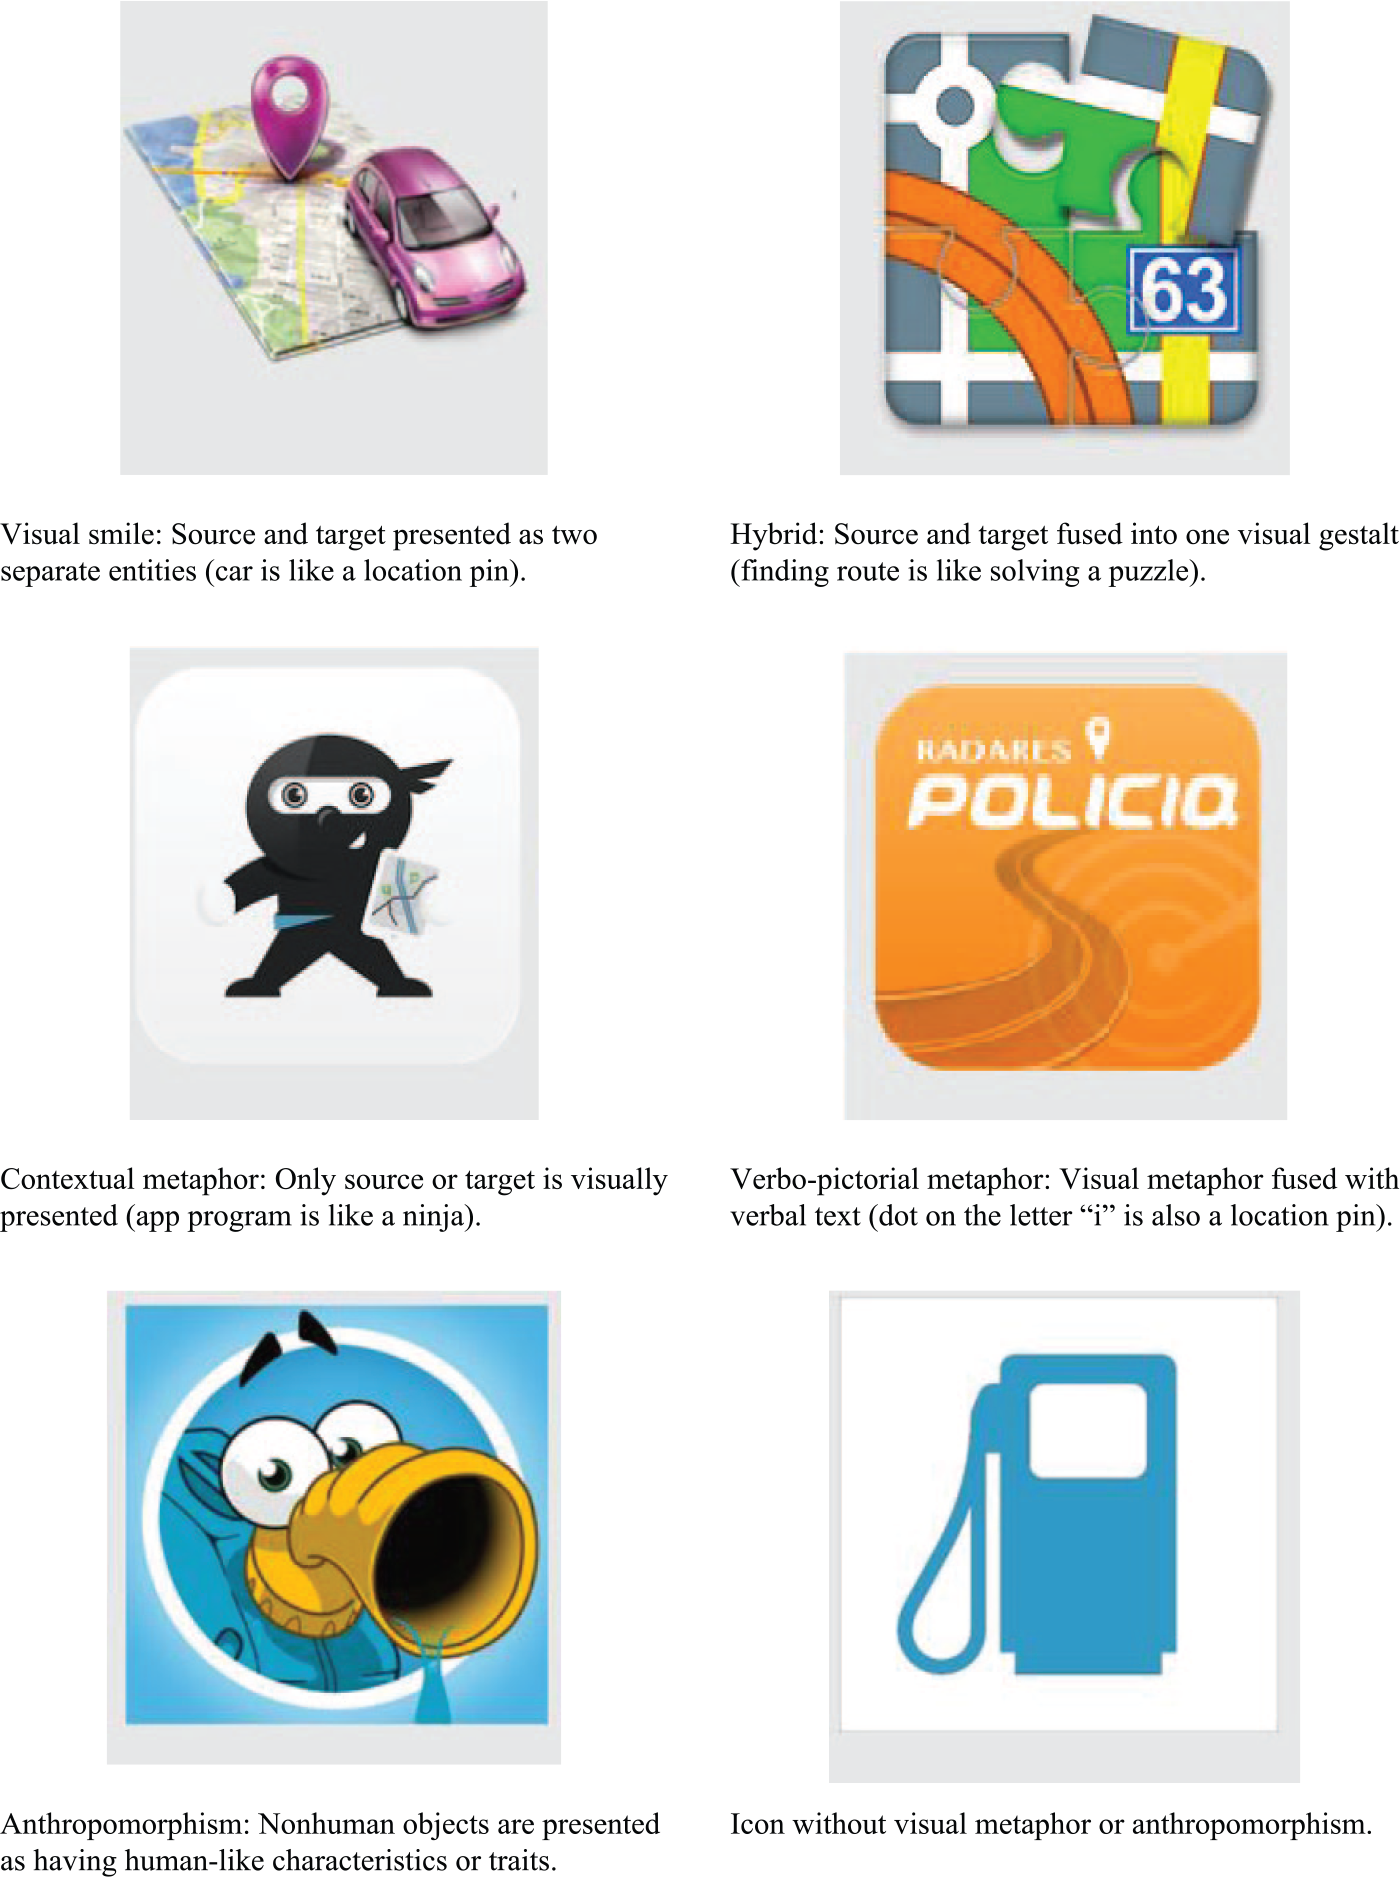
Examples of visual metaphor types and anthropomorphism in app icons.
Based on these previous studies from the commercial advertising field, we expect a similar relation between visual-metaphor type and complexity in the area of app icons. We thus expect that:
H3. Apps with icons containing contextual metaphors are perceived as more complex than icons with hybrids and similes, which, in turn, are perceived as more complex than nonmetaphorical app icons.
Because previous research on commercial advertising has shown that visual metaphors are most persuasive at medium levels of complexity (e.g., van Mulken et al., 2010; van Mulken et al., 2014), we expect hybrids to outperform similes and contextual metaphors in terms of persuasiveness:
H4. Apps with icons containing hybrids are more persuasive compared to apps with icons containing similes or contextual metaphors.
Next to visual metaphors, anthropomorphism is proposed as an effective visual rhetorical strategy (e.g., Delbaere et al., 2011; Hart et al., 2013; Patterson et al., 2013). Anthropomorphism means that human-like qualities are transferred to objects, animals, or plants that typically do not have such qualities. Famous examples of anthropomorphism include animated Disney characters like Donald Duck or Mickey Mouse in which human-like qualities are transferred onto animals (ducks, mice). Similarly, anthropomorphism is often used in brand characters in advertising (e.g., Michelin Man; Delbaere et al., 2011; see Figure 1, for an example of anthropomorphism in an app icon).
One of the reasons why anthropomorphism is found to be an effective (visual) rhetorical device is that it can be described as a particular type of metaphor (e.g., Delbaere et al., 2011; Lakoff & Johnson, 1980). After all, anthropomorphism also involves a cross-domain mapping, in this case from the domain of humans to another domain, elements from which typically do not have human-like characteristics. In this way, anthropomorphism also presents its readers with a small puzzle. Furthermore, when the puzzle is solved, readers typically attribute more human-like characteristics to the anthropomorphized object, animal, or plant, which (in the field of print advertising) led to more positive attributions of brand personality and more brand liking (Delbaere et al., 2011).
These positive effects of anthropomorphism are amplified when the human characteristics attributed to the object, animal, or plant are highly desirable in the given situation. One such example is the “labor illusion” heuristic of websites, which presupposes that, when conducting an online search, online consumers prefer websites that signal that they are exerting effort to those producing instantaneous results (Buell & Norton, 2011). In this heuristic, the perception of human qualities (“exerting effort”) in computerized systems outweighs the rationally better option of instantaneous results.
For app icons, we expect similar positive effects of anthropomorphism (as compared to visual metaphors), because anthropomorphism can make the app (or specific elements in the app) seem to be more human-like, which could lead to an initially favorable response, leading to more downloads. Thus, we expect that:
H5. Apps with anthropomorphic app logos are downloaded more often than apps without anthropomorphic app logos.
We conducted two studies to test our hypothesis. Study 1 was a field study in which we investigated how online reviews and visual rhetoric in app icons are connected to app downloads (H1–2, H4–5). Study 2 was an experiment in which we tested the connection between visual metaphor type, complexity, and persuasiveness (H3–4).
Method
Study 1
Selection of apps
Study 1 was a field study of apps downloaded from the Google Play Store. We retrieved 500 apps from one specific category (transportation apps) to control for influences of content. All apps provided navigational information (e.g., route to desired destination), could help users localize a desired location or object (e.g., parking space, gas station), or help users while driving (e.g., provide information about current speed or location of speed cameras). For potential inclusion, the app description needed to be written in one of the languages with which at least one of the authors was familiar (English, Dutch, French, German, Spanish, or Portuguese), so that we could verify the app was indeed a transportation app. When an app was available both in free format (with limited options, a “freemium” app) and paid format (with all options), we included the latter over the former (following e.g., West et al., 2011).
Coding procedure
We coded the apps for two online recommendation features: (a) the number of review stars, (b) presence of online review. The number of review stars reflects the average valence of user experiences and could range from 1 (most negative) to 5 (most positive). For written reviews, the Google Play Store only gave some examples, but did not list the total number of reviews an app received. Therefore, we coded this variable as binary with 0 = written reviews absent and 1 = written reviews present.
Next, we coded for the presence of two visual rhetorical devices: (a) visual metaphor and (b) visual anthropomorphism. We used a double coding procedure (Spooren & Degand, 2010), which means that the entire corpus was coded manually on the two variables by two independent coders. Differences were resolved after discussion. Regarding visual metaphors, coders first indicated whether the icon contained a visual metaphor or not (i.e., a visual cross-domain mapping). Cohen’s kappa was .65, indicating “substantial agreement” (Landis & Koch, 1977, p. 165). In case this question was answered affirmatively, the different types of visual metaphor were coded (see Figure 1 for examples of each type). When both source and target were presented as two separate objects, the metaphor was coded as a simile. When source and target were fused into one object, the metaphor was coded as a hybrid. When only the source (but not the target) was presented, the metaphor was coded as contextual (based on van Mulken et al., 2010). Finally, when visual and verbal elements were metaphorically presented as one visual gestalt, the metaphor was coded as verbo-pictorial (Forceville, 1996; Cohen’s κ = .85, indicating “almost perfect agreement,” Landis & Koch, 1977, p. 165).
Whether an icon contained anthropomorphism was coded in three distinct steps. First, coders had to indicate whether the icon contained one or more elements that were living. Living beings included humans, animals, and plants, as well as anthropomorphized characters (Cohen’s κ = .73, “substantial agreement,” Landis & Koch, 1977, p. 165). In case the first question was answered affirmatively, coders had to indicate whether the living being (the character) was presented as human-like. Assigning human-like qualities for instance means that the character has a human facial expression, moves like a human (e.g., an animal that normally walks on four paws now walks on two feet), wears clothing, and/or has human accessories (e.g., glasses, briefcases, etc.); Cohen’s κ = .77; “substantial agreement,” Landis & Koch, 1977, p. 165). Finally, coders indicated whether the character was anthropomorphic, which means that it was a nonhuman character with human-like qualities (Cohen’s κ = .87, “almost perfect agreement,” Landis & Koch, 1977, p. 165). In all cases, disagreements were resolved after discussion following the procedure in case of double coding as described by Spooren and Degand (2010).
We also coded the apps for one control variable: we checked whether the app was free or paid, as online consumers typically prefer free over paid information (e.g., Smit, van Noort, & Voorveld, 2014). Thus, we coded app price as a binary control variable with 0 = free app and 1 = paid app. Finally, we coded the number of downloads an app received, which was provided by Google Play Store. 1
Study 2
Participants and design
Because Study 1 yielded unexpected results with respect to the different types of visual metaphors, we conducted a second study to further explore the role of visual-metaphor types. Study 2 was an experiment with a 4 (type of visual metaphor: simile, hybrid, contextual, none) x 2 (stimulus set) within-participants design. Participants were recruited through social media (e.g., Facebook, Twitter). A total of 122 participants started filling out the questionnaire, which was completed by 98 participants (completion rate: 80.3%). To control for individual differences in participants, we constrained our sample to Dutch nationals, who spoke Dutch as their native language, and who owned at least one smartphone or tablet computer (so that they would be familiar with downloading apps). Based on these criteria, six participants were removed from the dataset, leaving 92 participants. Their average age was 28.21 years (SD = 8.68, range = 18–59 years). A majority of 64.1% of participants were female. A majority of 66.3% of participants had completed a form of Dutch higher education. Other participants had completed at least a form of secondary education (18.5%) or vocational training (15.2%).
A majority of 52.2% of participants owned both a smartphone and a tablet. A total of 46.7% of participants only owned a smartphone (but no tablet), and 1.1% of participants only owned a tablet (but no smartphone). Most participants owned a smartphone or tablet of the brands Apple (57.8% of smartphone owners; 69.4% of tablet owners) and Samsung (31.1% of smartphone owners; 26.5% of tablet owners). On average, participants had installed 31.93 apps (SD = 26.46) on their smartphone or tablet. A total of 95.5% of smartphone owners used apps on their smartphone on a daily basis. Most tablet owners used apps on their tablet on a daily (44.9% of tablet owners) or weekly basis (40.8% of tablet owners).
Procedure, materials, and instrumentation
In an online questionnaire programmed in Qualtrics (www.qualtrics.com), participants were first told that they would participate in a study on mobile applications for smartphones and tablets, and were asked to give their informed consent indicating that they voluntarily gave us permission to use their responses for our research. Then, participants filled in the demographic questions about their ownership and usage of smartphone and/or tablet. After doing so, participants were asked to imagine that they owned an Android smartphone or tablet and that they were looking for a mobility app to physically navigate from A to B. Participants were subsequently presented with eight (fictitious) apps from the Google Play Store, presented in a randomized order.
To filter out the influence of online reviews, every app was evaluated with an average of four (out of five) stars by 12,857 consumers and was shared 9,411 times on Google+. We included no information about app price. To give participants the impression that all apps were different, each app was given a slightly different name that was a variation on the letters Nav (for navigate, e.g., Naviga, ARnav, NAV+). Unknown to participants, the main difference between the eight apps was the use of visual metaphor in the app icon, in that the app icon contained a simile, hybrid, contextual metaphor, or nonmetaphorical control. Following recommendations by Kreuz and Roberts (1993) to use ecologically valid materials to study metaphor, all icons were taken from the corpus collected in Study 1.
For each app, participants answered questions about the perceived complexity of the icon, their attitude towards the icon, and persuasiveness. All dependent measures were answered on 7-point Likert scales ranging from 1 = completely disagree to 7 = completely agree. Because we had a repeated-measures design in which every participant saw every app icon, we calculated Cronbach’s alpha both per individual app icon and per group (i.e., the two app icons in the same experimental condition, e.g., both similes together), and report the mean scores and the range.
For perceived complexity, we asked participants whether they found the app icon easy to understand and straightforward (both recoded, based on van Mulken et al., 2010; individual app icons: αaverage = .96, range = .92–.98; groups: αaverage = .78, range = .72–.87). For attitude towards the icon, participants indicated whether they thought the icon succeeded well, was well made and appealing (individual app icons: αaverage = .95, range = .93–.97; groups: αaverage = .83, range = .78–.89). Persuasiveness was measured through two indicators: attitude towards the app and behavioral intentions. To measure attitude towards the app, participants rated their agreement with the statements that they believed that the app succeeded well, was well made and appealing (individual app icons: αaverage = .96, range = .95–.99; groups: αaverage = .84, range = .79–.91). Finally, as a measure of behavioral intentions, participants indicated whether they would want to look into the app description in more detail and install the app on their mobile device (individual app icons: αaverage = .93, range = .87–.97; groups: αaverage = .77, range = .72–.87).
After filling out these items for each app icon, participants answered demographic questions about their gender, age, education level, nationality, and native language. Finally, participants were asked to guess the topic under investigation. None of the participants guessed that we were interested in visual metaphors. No further items were included.
Results
We have made all data and data-analytic procedures for both studies available on the Open Science Framework (OSF). They can be accessed and downloaded using the following link https://osf.io/pc9ui/
Study 1
Descriptive statistics
Descriptive statistics (see Table 1) revealed that the apps were generally positively reviewed, with an average rating of 3.79 (SD = 0.88). Similarly, a large minority of apps in the corpus contained online reviews (42.2%) and was paid (45.8%). We found that almost half of all app icons (i.e., 249 icons, 49.8% of the total corpus) contained a visual metaphor. Out of these 249 icons, most were contextual metaphors (181 icons; 36.2% of the total corpus). Of the remaining metaphor icons, 11 were a simile (2.2% of the total corpus), 44 were a hybrid metaphor (8.8% of the total corpus), and 13 were a verbo-pictorial metaphor (2.6% of the total corpus).
Means, standard deviations, and intercorrelations of the measures.
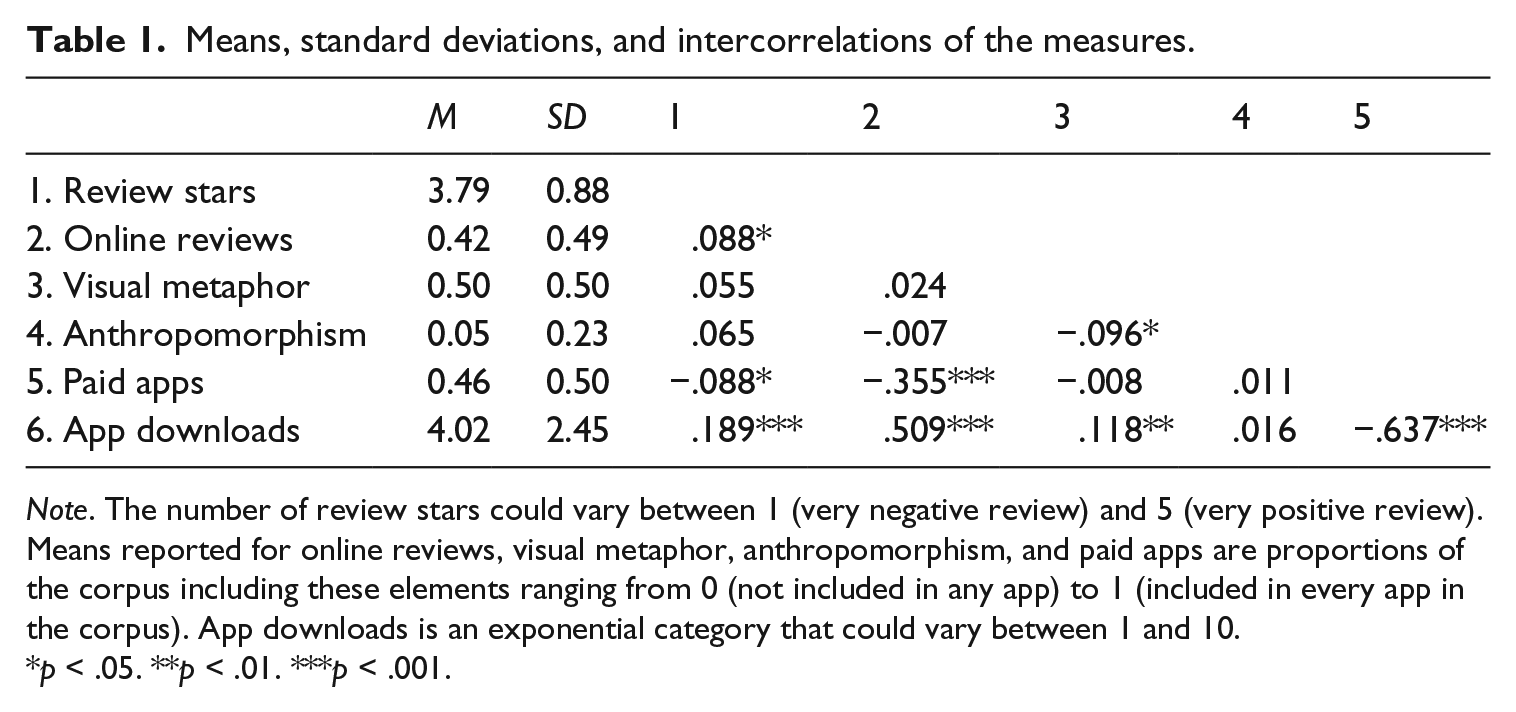
Note. The number of review stars could vary between 1 (very negative review) and 5 (very positive review). Means reported for online reviews, visual metaphor, anthropomorphism, and paid apps are proportions of the corpus including these elements ranging from 0 (not included in any app) to 1 (included in every app in the corpus). App downloads is an exponential category that could vary between 1 and 10.
p < .05. **p < .01. ***p < .001.
In contrast to visual metaphors, we found that the app icons hardly contained any anthropomorphic icons, as only 27 icons (5.4% of the total corpus) contained icons with anthropomorphic elements. Anthropomorphism was also the only variable not correlated with the number of app downloads. The superordinate elements of anthropomorphism (i.e., presence of a living being, 62 icons, 12.4% of the total corpus, r = .014, p = .76; and living being with human-like traits, 57 icons, 11.4% of the total corpus, r = .015, p = .75) were unrelated to the number of app downloads as well. Therefore, only anthropomorphism was used in the hypothesis testing (and the superordinate elements were excluded).
Hypothesis testing
Next, we ran two linear regression analyses to test our hypotheses that both elements of online recommendations and app icons predicted app downloads. In each regression analysis, we included our predictors in three blocks (see Table 2). In Block 1, we included our control variable of price. In Block 2, we included the two elements from online reviews (number of review stars, presence of online reviews). In Block 3, we included the visual elements of app icons. In our first regression analysis, we included visual metaphor (present vs. absent) and anthropomorphism. In the second regression analysis, we replaced the presence of the visual metaphor variable with variables referring to each metaphor subtype. We did so by including dummy variables for the four visual metaphor subtypes, using the absence of visual metaphor as our comparison condition.
Linear regression model of B values and 95% confidence intervals of number of app downloads.
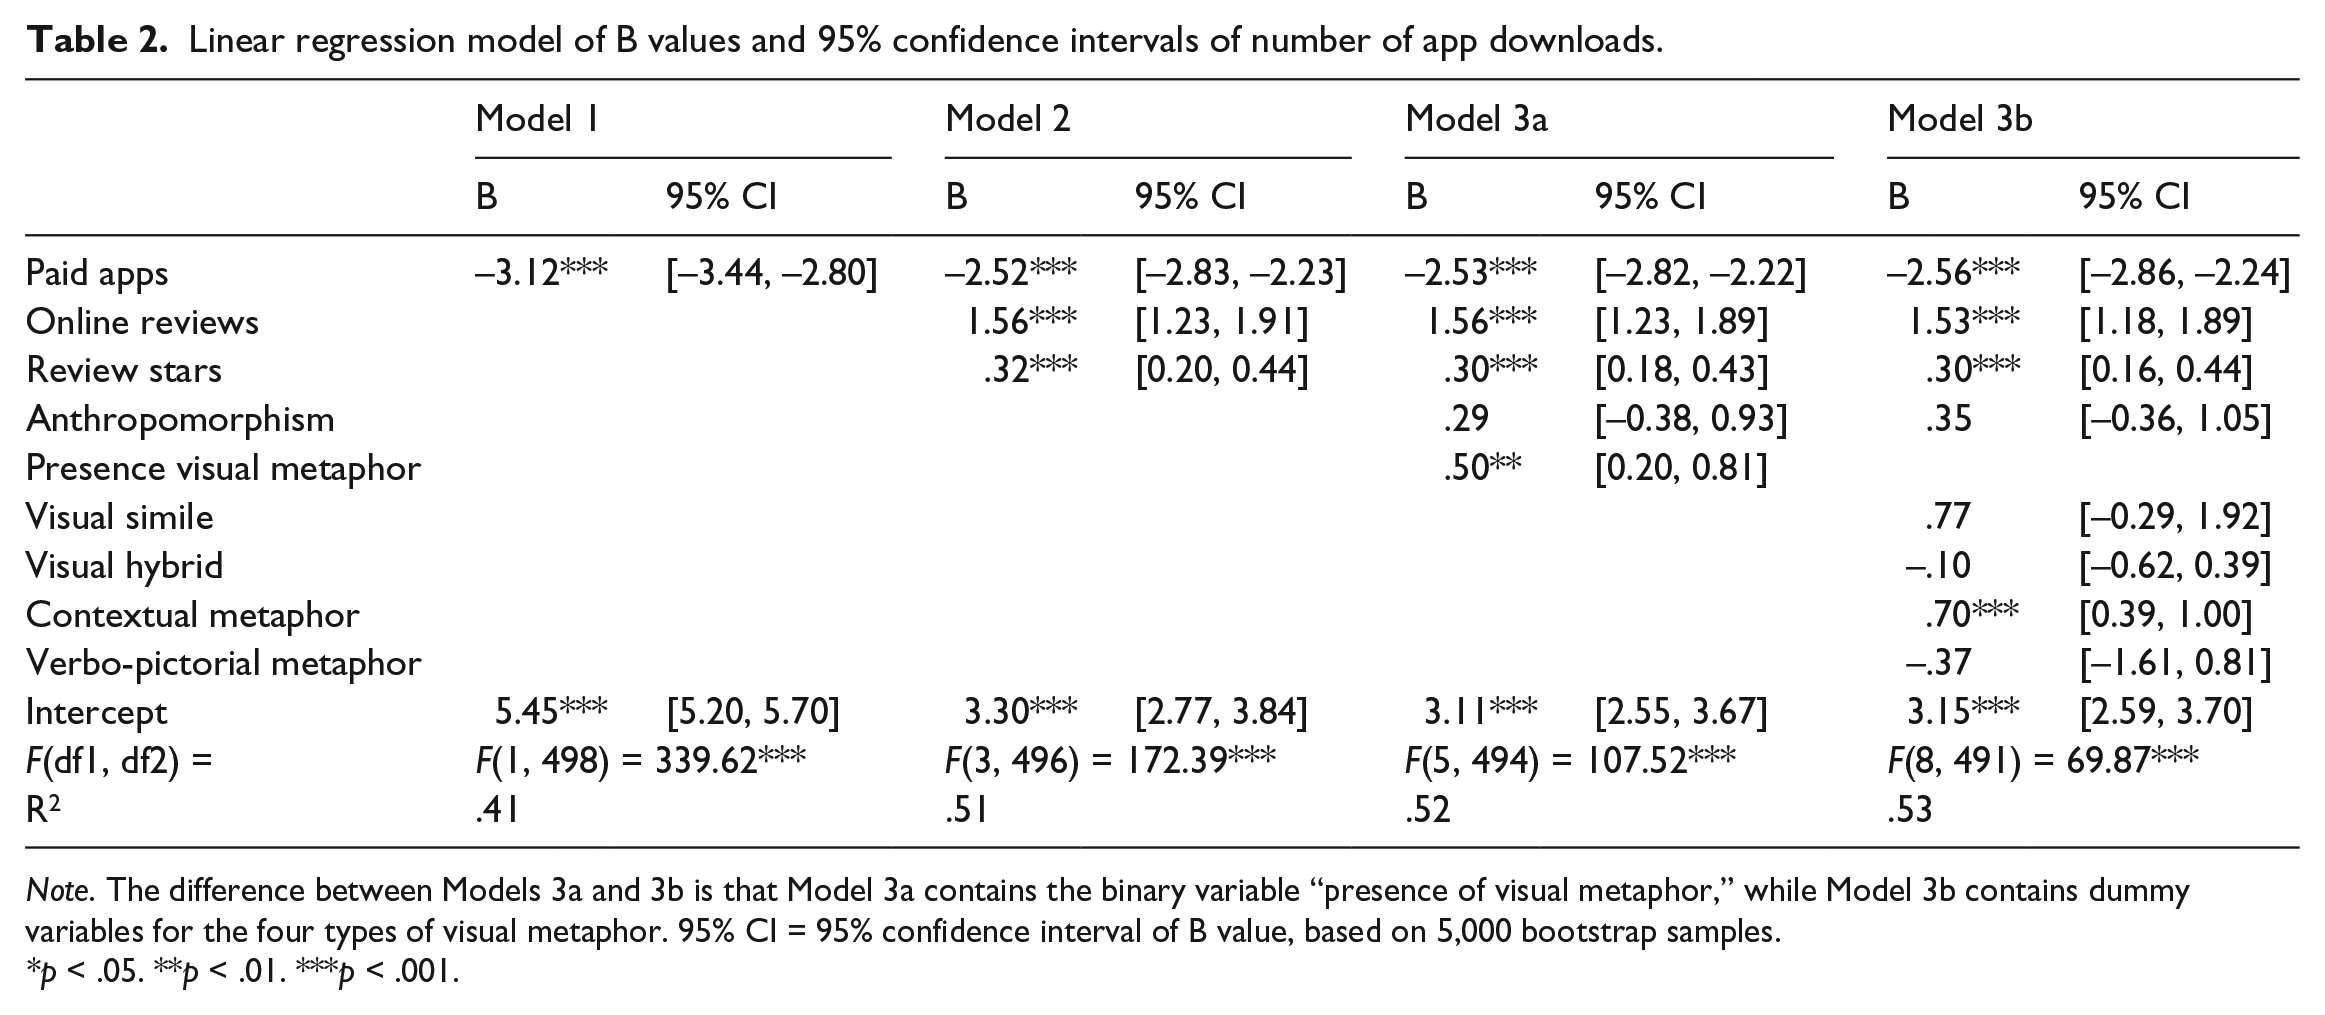
Note. The difference between Models 3a and 3b is that Model 3a contains the binary variable “presence of visual metaphor,” while Model 3b contains dummy variables for the four types of visual metaphor. 95% CI = 95% confidence interval of B value, based on 5,000 bootstrap samples.
*p < .05. **p < .01. ***p < .001.
Table 2 shows that app price was related to the number of downloads, in that free apps were downloaded more often than paid apps. Furthermore, both the presence of online reviews and the number of review stars are positively related to the number of app downloads. This suggests that H1a, stating that apps that have received at least one written review are downloaded more often than apps without written reviews, is supported. Furthermore, we also found that, the more review stars apps receive, the more they are downloaded, in support of H1b. These results demonstrate that online reviews are important predictors of app success in terms of downloads.
For the visual elements, we found mixed results. First, we found that visual metaphors were positively related to the number of downloads, which supports H2 (see Model 3a in Table 2). When looking at the types of visual metaphor, we found that only contextual metaphors were positively related to the number of app downloads. In contrast, we found no association between similes, hybrids, or verbo-pictorial metaphors and app downloads. This means that H4 which predicted that apps with hybrids would be downloaded more often than apps with similes or contextual metaphors is not supported by the data. Finally, we found no evidence that anthropomorphic elements in app icons are related to the number of downloads. Thus, H5, which predicted that apps with (vs. without) anthropomorphic app icons would be downloaded more often, is also not supported by the data. 2
Study 2
To test whether perceived complexity of and attitude towards the app icon, as well as attitude towards the app and behavioral intent differed depending on the visual metaphor in the app icon, we conducted a series of repeated-measures ANOVAs. Table 3 shows descriptive information. Our analyses show effects of visual metaphors on perceived complexity of the icon, F(3, 89) = 66.47, p < .001, ηp2 = .69; the attitude towards the icon, F(3, 89) = 87.35, p < .001, ηp2 = .75; the attitude towards the app, F(3, 89) = 66.55, p < .001, ηp2 = .69; and behavioral intentions, F(3, 89) = 66.77, p < .001, ηp2 = .69.
Mean scores (and standard deviations) of perceived complexity of the app, attitude towards the icon, attitude towards the app, and behavioral intention, as a function of visual metaphor types.
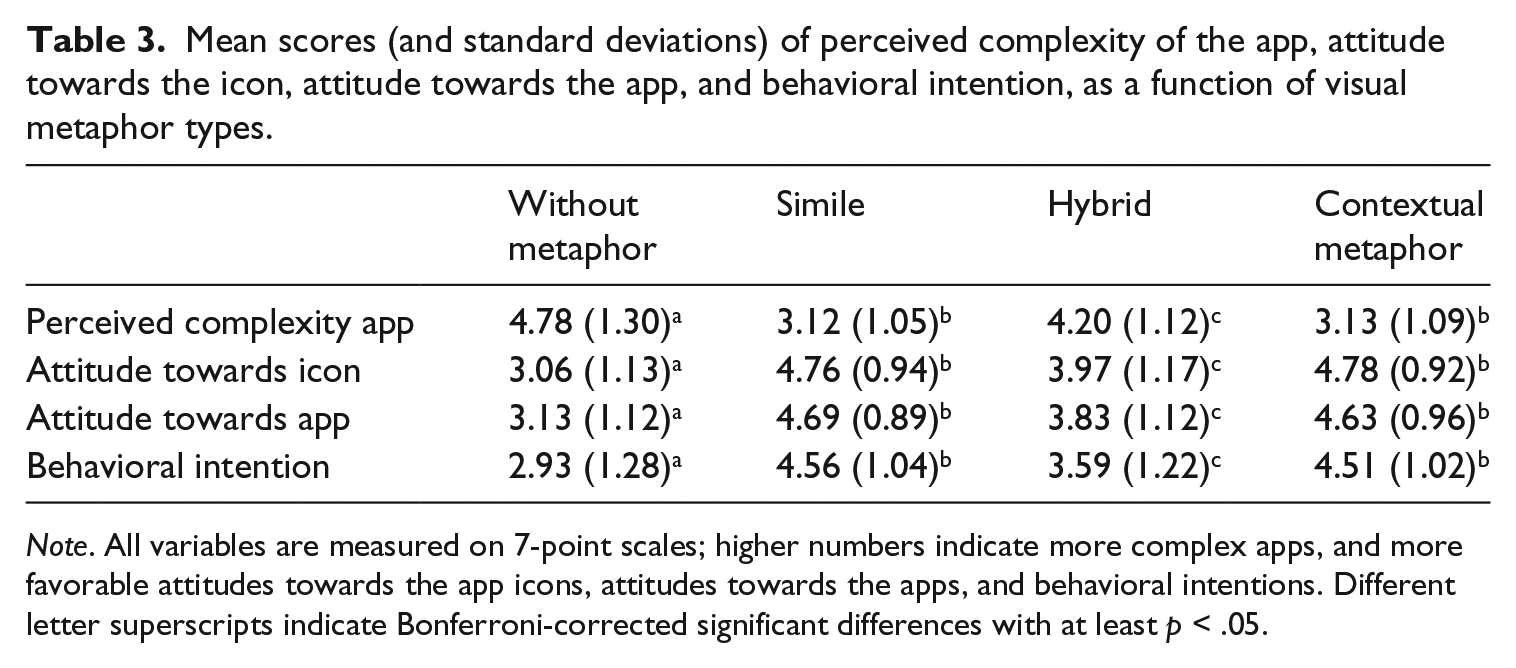
Note. All variables are measured on 7-point scales; higher numbers indicate more complex apps, and more favorable attitudes towards the app icons, attitudes towards the apps, and behavioral intentions. Different letter superscripts indicate Bonferroni-corrected significant differences with at least p < .05.
Pairwise comparisons with Bonferroni corrections show that icons with similes and contextual metaphors are perceived as less complex than hybrids, which, in turn, are perceived as less complex than nonmetaphorical icons. This disconfirms H3, which predicted that contextual metaphors would be most complex. Our analyses on persuasiveness show similar results. We find that the attitudes towards both the icon and the app are more favorable for app icons with similes and contextual metaphors, compared to hybrids, which, in turn, are more favorable than nonmetaphorical app icons. Finally, we find that app icons with similes and contextual metaphors lead to more favorable behavioral intentions than hybrids, which, in turn, lead to more favorable behavioral intentions than nonmetaphorical icons. These results disconfirm H4 which predicted that apps with hybrids lead to the most positive app attitude and behavioral intentions.
Discussion and conclusion
The aim of our studies was to understand why certain apps are downloaded more often in app stores than others. Two types of cues were identified that could potentially predict app downloads: Online reviews and visual characteristics of app icons. A field study of 500 apps from the Google Play Store confirmed our expectations for online reviews. In support of H1, we found that both the presence and the valence of online reviews are associated with an increased number of app downloads. Thus consumers behave in similar ways in app stores compared to other kinds of online arenas (e.g., Chevalier & Mayzlin, 2006; Lim & van der Heide, 2015; Sundar et al., 2008; Vermeulen & Seegers, 2009) in that they rely on online reviews as cues to the apps’ desirability and/or quality—jumping on the bandwagon of already popular apps. For mobile communications, our results thereby support the MAIN model’s prediction that the bandwagon heuristic is a powerful heuristic in swaying users of online information.
In contrast to online reviews, the results for the visual design characteristics were mixed. In support of H2, we found that apps with icons containing visual metaphors were found more persuasive compared to apps with icons containing no visual metaphors. In Study 1, apps with icons containing visual metaphors were downloaded more often than apps with icons containing no visual metaphors. In Study 2, visual metaphors in app icons (vs. no metaphors in app icons) led to a more positive attitude towards the app and more positive behavioral intentions. These results also support previous research indicating that visual metaphors can serve as persuasive devices (e.g., J. Kim et al., 2012; McQuarrie & Phillips, 2005; van Mulken et al., 2010). This means that the MAIN model’s prediction that modality is important in evaluating online information (Sundar, 2008) may need to be amended for the context of mobile communication. Not only the modality used (e.g., K. J. Kim & Sundar, 2016; K. J. Kim et al., 2011) impacts how information is received, but design choices within one modality (e.g., images) do as well. Insights from the field of visual rhetoric (e.g., Delbaere et al., 2011; Forceville, 1996; van Mulken et al., 2010) may thus serve to complement the insights derived from the MAIN model.
At the same time, however, the processing of visual information in online contexts may also work differently from offline contexts. After all, our other three hypotheses about the effects of different types of visual metaphors and of anthropomorphism, derived from previous studies on visual rhetoric in print contexts, were not confirmed. First, in disconfirmation of H3, we found that using visual metaphors in app icons actually reduces the perceived complexity of the icons compared to nonmetaphorical icons. When comparing the different types of visual metaphors, we found that both similes and contextual metaphors are perceived as less complex than hybrids (Study 2). Similarly, H4, predicting that hybrids would be the most persuasive type of visual metaphors in app icons, is not confirmed. First, we found that only contextual metaphors (but not similes, hybrids, or verbo-pictorial metaphors) were related to an increased number of downloads (Study 1). Second, we also found that participants in our experiment rated similes and contextual metaphors as more persuasive than hybrids.
Our results thus show that the different types of visual metaphors have differential effects when they are used in an online context of app stores (this study) compared to an offline context of print ads (e.g., van Mulken et al., 2010; van Mulken et al., 2014). In order to more thoroughly explain the patterns we found in our studies, we need to turn to studies of verbal metaphor from the field of linguistics. In linguistics, verbal metaphors can be studied at three levels of analysis: (a) in language, (b) in communication, and (c) in cognition (Steen, 2008, 2011). Recently, it has been argued that visual metaphors can be studied at these three levels as well (e.g., Bolognesi, van den Heerik, & van der Berg, 2016). Studying metaphors in language suggests looking at the linguistic (or in the case of visual metaphors: visual) expression of the metaphor. Our focus on the different types of visual metaphors (simile, hybrid, contextual) did just that, in that we focused on the types of visual cues that were employed in establishing the visual metaphor. The communicative dimension refers to the deliberateness of the metaphor, which means asking whether the use of the metaphor is intentional (Steen, 2008, 2011). Following Bolognesi et al. (2016), it can be assumed that all visual metaphors in app icons are intentionally constructed by their visual designers. This takes us to the level of cognition, which focuses on the conceptualization of the metaphor (Steen, 2008, 2011). Focusing on the conceptualization implies indicating whether the metaphor is novel or conventional.
The underlying assumption of most of the advertising work into metaphor seems to be that advertising metaphors are novel, in that they present their readers with a small puzzle to solve. In contrast, conventional metaphors are typically recognized immediately and do not require additional cognitive effort (Bowdle & Gentner, 2005). An example of a conventional visual metaphor is a light bulb to indicate an idea. Conventional metaphors can be persuasive in different ways than novel metaphors: the former can help readers understanding abstract and technical topics by presenting a familiar concrete image as an explanation. A recent study showed that conventional (verbal) metaphors can be persuasive in advertising when they explain abstract, technical product qualities (Burgers, Konijn, Steen, & Iepsma, 2015). In these cases, conventional metaphors are perceived as less complex than their literal equivalents, which in turn increased the advertisements’ persuasiveness.
It is likely that many of the metaphors in our field study (and subsequently in our experiment) also functioned in this way, in that they made abstract elements of the informational mobility apps more concrete. For instance, a relatively large percentage of app icons use a visual metaphor of an analog device with similar functions as the app (e.g., a compass for apps providing routes to a destination, push pins to indicate locations on a map, a speedometer for apps indicating driving speed). It could thus be possible that visual metaphors in app icons are mostly conventional and work via the persuasive mechanism of reducing complexity (rather than of presenting a small puzzle as most metaphors in advertising do). Future research could further investigate the conventionality of visual metaphors in app icons.
Finally, we found that anthropomorphism in app icons was not related to the number of downloads, which disconfirms H5. At the same time, we also noted that the number of anthropomorphic app icons was relatively low in our corpus, as only 5.4% of app icons were anthropomorphic. This means that the lack of effects of anthropomorphic app icons may also be due to the relatively low number of anthropomorphic icons in the corpus. Future research should further explore this question to determine if and when anthropomorphic app icons impact app success.
A few caveats can be mentioned about our studies. First, we focused our two studies on informational apps dealing with one topic (mobility and transportation). Future research could explore if and how results are similar or different when studying apps that are more entertainment-based (e.g., games) or when looking at informational apps on other topics (e.g., finance, health). For instance, entertainment-based apps may be less abstract than informational apps, as they (often) contain a protagonist or an avatar from the entertainment or game. Therefore, it could be the case that icons for entertainment apps feature less (conventional) visual metaphors compared to informational apps, and greater use of anthropomorphized characters.
Second, both studies used offline measures as indicators of app success (e.g., Study 1: number of downloads; Study 2: attitude towards the app, behavioral intention). An avenue for future research is to closely monitor the ways in which online consumers choose to download an app (or not) in real time using online processing measures. Lab experiments using eye-tracking measures can for instance establish which elements of app stores generate visual attention and which do not. If such studies show that differential app icons or changes in online reviews also impact information processing, such studies would offer converging evidence with our study on the role of such cues in app stores.
Another fruitful direction for future research would be the role of heuristics other than online reviews and visual design characteristics in online decision-making in app stores. For instance, the MAIN model suggests heuristics influencing the perceived authority of the app source (the authority heuristic) may be another relevant cue in predicting app downloads (Sundar, 2008). Finally, our studies considered specific cues (e.g., reviews, visual metaphors) in isolation. Future studies could focus on the interaction of several of these heuristics (e.g., the roles of visual metaphors under positive or negative reviews, or if and when review valence and volume trump the “take the first” heuristic). Such studies could further help to unravel under which conditions consumers rely on which kind of heuristics.
While mobile apps are very popular, little is known about the factors predicting download popularity. We took on that question by studying the relation of online reviews and app design characteristics with app downloads, and conducted a field study and an experiment. We corroborated research in other domains finding that the presence and valence of online reviews could be positively related to download rates. We additionally found that the presence of metaphor in the app icon could be used as a heuristic influencing app downloads. These results reflect that both online consumers (through reviews) and app designers (through visual design of app icons) have the ability to steer the popularity of an app. It also suggests that users are looking for ways to navigate in an information-rich environment by relying on heuristic cues, as illustrated by the MAIN model (Sundar, 2008). App designers should thus heed the opinion of their target group (e.g., by using formative evaluation before releasing the app) as well as carefully tweak their design (e.g., by using appropriate visual metaphors in the app icon) to help users locate the app they need.
In sum, our research shows that both online reviews and metaphor use in app icons are salient cues for app downloads. Online reviews function similarly to reviews in other sources: as a bandwagon heuristic indicating greater app popularity. However, visual metaphors in app icons seem to function differently from visual metaphors in print advertisements—reducing complexity for the user rather than posing a puzzle for them to solve, and with a reliance on contextual and simile (X is like Y) metaphor types. Thus, visual metaphor in app icons seems to serve a primarily informative, rather than a primarily affective purpose.
Footnotes
Declaration of Conflicting Interests
The author(s) declared no potential conflicts of interest with respect to the research, authorship, and/or publication of this article.
Funding
The author(s) disclosed receipt of the following financial support for the research, authorship, and/or publication of this article: The contributions of Christian Burgers and Allison Eden were supported by the Netherlands Organisation for Scientific Research (Creative Industries/KIEM Grant 314-98-002, ![]() ).
).