
Abstract
Objectives
A significant driver of low back pain (LBP) is adaptations to endogenous pain modulation (EPM). Exercise modulates pain through various mechanisms, however, there is a lack of information on its relation to EPM. The objective of this study was to evaluate the feasibility of a protocol investigating if changes in EPM occurs after exercise therapy.
Methods
Participants were recruited from an ongoing randomized controlled trial comparing graded activity to motor control exercises. Participants attended 2 in person sessions pre and post intervention to assess pain pressure threshold (PPT), temporal summation (TS), conditioned pain modulation (CPM) and exercise induced hypoalgesia (EIH). Feasibility outcomes included attrition, recruitment rate, exercise adherence, protocol burden and consistency. In total, 36 (53%) eligible participants enrolled and completed baseline assessments.
Results
A-priori thresholds for feasibility were met for attrition 32/36 (89%), recruitment rate (53% of eligible participant enrolled and 36 recruited in 6 months), exercise adherence (93.8%) and satisfaction with assessment protocols (bothersome 88.9%, future participation 97.2%), apart from discomfort with assessment (58.3%). Participants reported that the CPM caused the most discomfort. There was a trend for an increase in low back PPT, no change in TS, and a decrease in CPM and thumbnail PPT at follow up. The results demonstrated that the protocol is feasible for all pre-specified outcomes.
Discussion
This article presents a protocol for EPM using PPT, TS, CPM and EIH that is feasible in a clinical trial for LBP. A future study is needed to further investigate EPM changes after exercise therapy in this population.
Keywords
Introduction
It is widely accepted that people with chronic non-specific LBP have nociplastic pain, which is pain that results from altered nociception, with no clear evidence of tissue damage causing peripheral nociceptor activation. 1 A significant driver of nociplastic pain is adaptations in the central nervous system (CNS). 2 Normally the CNS can take a wide range of actions to reduce or augment pain, through inhibitory or facilitatory mechanisms known as endogenous pain modulation (EPM). 3 Adaptations in the CNS can contribute to impaired EPM through the amplifications of neural signalling that results in hypersensitivity to nociceptive signals, known as central sensitization (CS). 2
Exercise therapy is often the first line of care for chronic non-specific LBP, 4 however, the effect of exercise is small to moderate. 5 There is evidence, primarily in pain free populations, that exercise may modulate pain through various systems such as activation of the endogenous opioid system or changes in the immune system.6,7 However, there is a scarcity of information on the effects of exercise in relation to EPM as most studies have been conducted in pain free populations. In individuals without pain, there is evidence to suggest that higher levels of physical activity is correlated with better EPM. 8 Additionally, moderate aerobic training has been shown to increase pain pressure threshold (PPT) in individuals without pain. 9 There is also evidence to suggest that psychosocial factors such as catastrophizing and fear of movement may modify the response to exercise, 10 and thus an exercise program that includes a psychosocial component may better address alterations to EPM. Understanding the mechanisms underlying EPM, and if or how exercise can play a role in improving EPM, is an important next step in finding more effective treatments for LBP.
There is also conflicting evidence on which type of exercise produces the strongest exercise induced hypoalgesia (EIH) response. In the few studies focussing on individuals with LBP, EIH was not observed or was impaired following a bout of functional training and core stabilization exercises, 11 6-min walk test, 12 and lifting tasks.13,14 In pain free populations, EIH has been demonstrated following aerobic and resistance exercises, 7 with conflicting evidence on the required exercise intensity.15–19 Identifying the best exercise program that leads to the best EPM improvements for patients with LBP could potentially improve patient outcomes.
A widely recognized method to assess the effect of exercise on EPM is through EIH, defined as a reduction in pain sensitivity after an acute bout of exercise. 20 EIH is known to occur in pain-free populations, but in chronic pain conditions, the response to acute exercise is variable, with observed decreases, increases or even no change to pain sensitivity. 7 It has been suggested that in order to observe a hypoalgesic response to exercise in individuals with chronic pain, repeated bouts of exercise (long-term exercise) may be needed. 6 To our knowledge, no studies have evaluated the long-term effect of exercise on EPM in people with LBP, which can be measured through quantitative sensory tests (QST) and EIH.
The purpose of this pilot study was to evaluate (1) the feasibility (primary outcome of attrition) and consistency of a study protocol to investigate if changes in EPM is associated with exercise therapy, (2) the trend in EPM change as a results of exercise and, (3) whether this response is different between graded activity (a functionally based exercise program that uses cognitive behavioural principles to address psychosocial factors), and motor control exercises (a more localized exercise programs that targets contraction and coordinator of spine muscles). 21 A pilot study is needed to evaluate the EPM protocol as well as its acceptability, consistency and safety before conducting a larger powered study.
Methods
Study design
This pilot study was embedded within a randomized controlled trial (RCT) aimed to identify effect modifiers of exercise treatments for patients with LBP (WELBack). The WELBack trial is a multi-site two arm parallel RCT where participants are randomized 1:1 to receive an 8-weeks treatment of either graded activity or motor control exercises delivered by physiotherapists. Assessments for the main trial were conducted at baseline (T0), 2 months (T1), 6 months (T2) and 12 months (T3). In the main trial, assessors were not blinded to patient-reported outcomes given that these are self-reported by the patients. However, in this sub-study, assessors were blinded to group allocation at baseline and follow up when evaluating QST and EIH outcomes measures.
Participants and setting
This study was conducted in Hamilton, Ontario, Canada. Participants were recruited from the WELBack trial to participate in this sub-study. During the initial WELBack recruitment call, if the participant was eligible and consented for the main trial, the research assistants asked if the participant was interested in another study. Once participants signed the consent form and completed baseline questionnaires, they were book for the first in-person visit prior to randomization. During the initial physiotherapy assessment for the WELBack main trial, eligibility was confirmed, and participants were randomized to treatment groups. A timeline for the study can be found in Figure 1. Study timeline.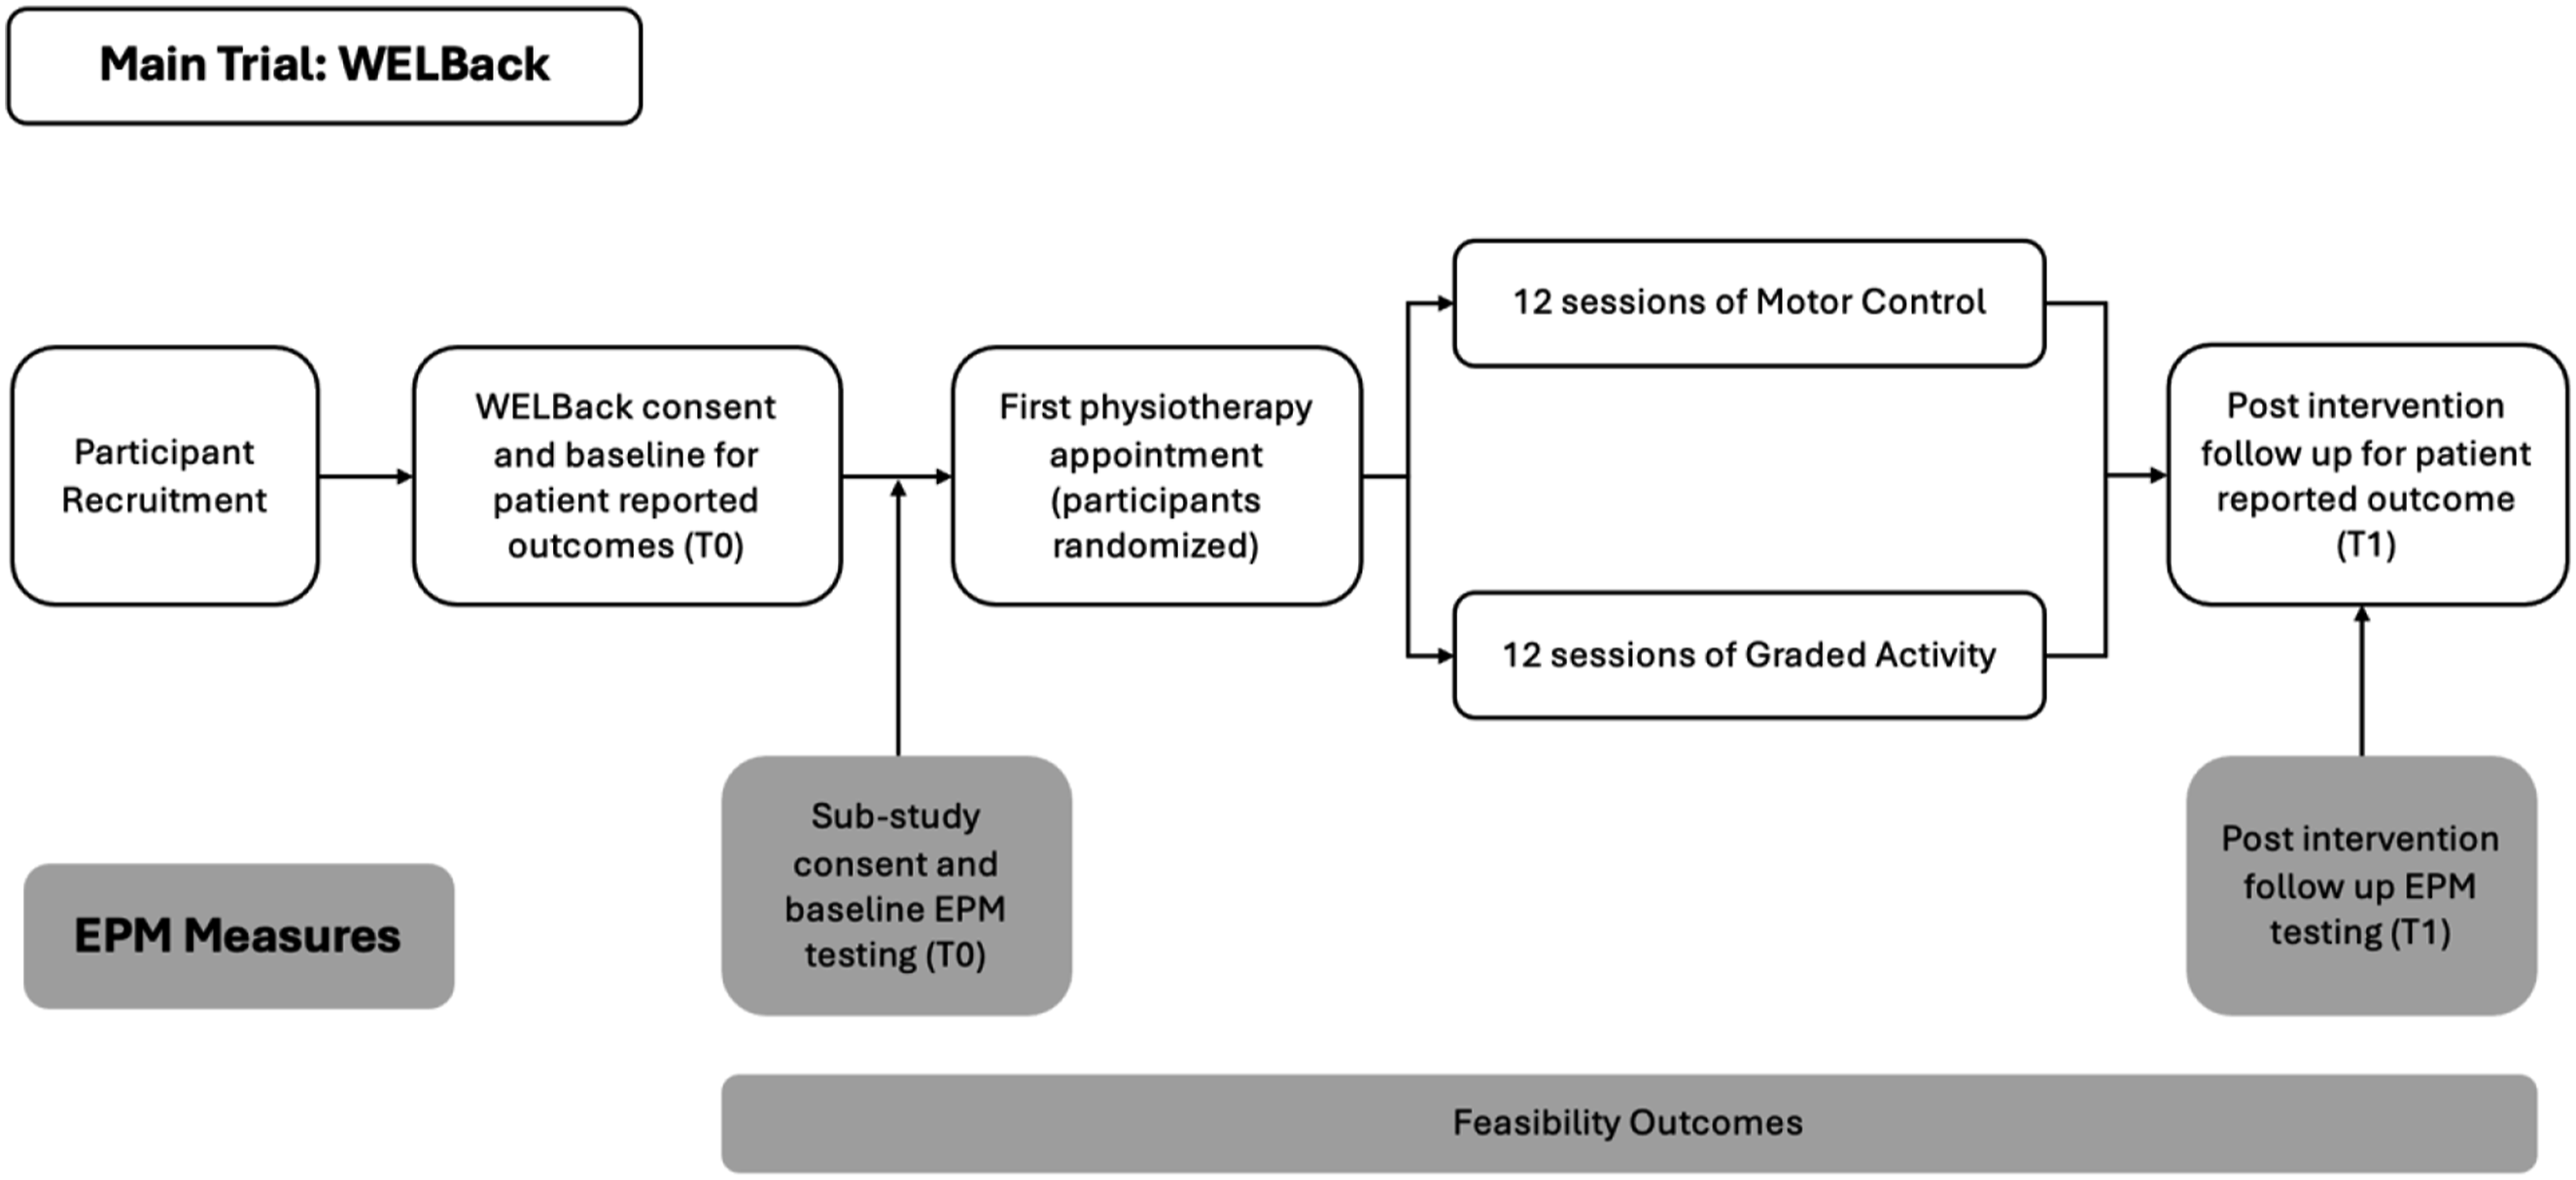
Inclusion and exclusion criteria
The eligibility criteria for the WELBack trial and this study included: (1) chronic non-specific LBP (>3 months), (2) back pain being the primary complaint, (3) moderate or greater pain or disability measured using questions seven and eight of the 36-Item Short Form Survey, 22 (4) moderate to high risk classification on the STarT Back Tool, 23 (5) between the ages of 18–80 years and (6) adequate English necessary for completion of questionnaires and communication with the physiotherapist. 24 This includes screening for safety to exercise using the PARQ+ 25 and or medical clearance. Participants were excluded if they have a specific condition such as disc herniation or spinal stenosis, are on the wait list for surgery, have cognitive impairments, severe neuromuscular conditions or if clinical assessment by a physician has indicated that the participant is not suitable for active exercise. 24
Procedures
All participants enrolled in the sub-study attended two visits to McMaster University, which took place immediately before and after the intervention (T0 and T1, Figure 1) to complete EPM assessments. Participants also completed WELBack surveys at the same time points as per the main trial protocol. 24
Study interventions
As part of the main trial (WELBack), participants were randomized to receive either motor control or graded activity. Participants received 12 individually supervised sessions by a registered physiotherapist, lasting 30 min each, over an 8-week period (two sessions per week in the first 4 weeks and one session per week in the last 4 weeks). 24 Detailed treatment description and randomization procedures can be found in our published protocol. 24
Motor control exercise
The motor control (MC) exercise program is based on the treatment program reported by Hodges et al. 21 and similar to the protocol used by Costa et al. 26 and Macedo et al. 27 The primary goal of motor control exercises is to retrain optimal control and coordination of the spine and limbs. 21
Graded activity
The graded activity (GA) exercise program is based on the treatment program reported by Lindström et al. 28 and similar to the protocol previously used by Smeets et al. 29 and Macedo et al. 27 and is based on the biopsychosocial model. 30 The primary goal of graded activity is to address individual modifiable contextual factors associated with the activity related pain experience such as self-efficacy and fear of movement, 31 while also addressing physical impairments such as endurance, muscle strength and balance. 32
Primary feasibility outcomes
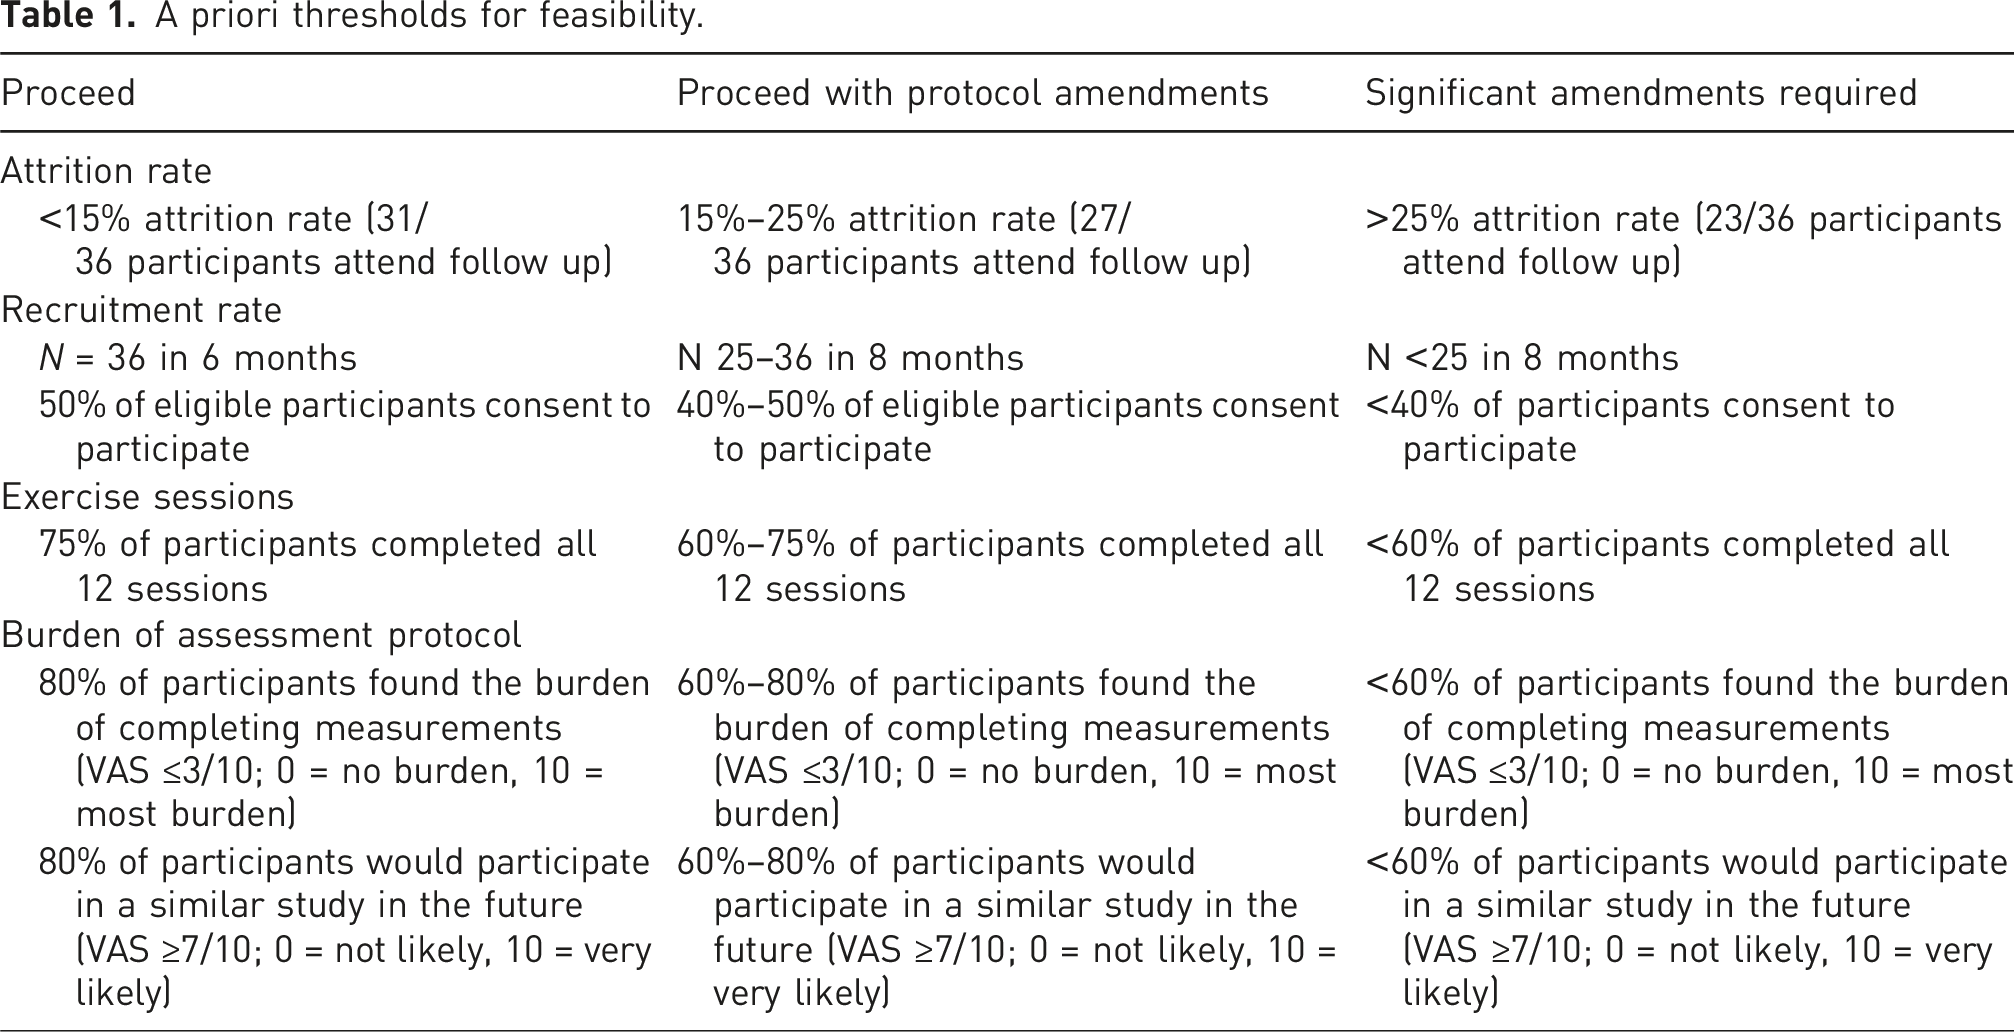
A priori thresholds for feasibility.
Assessment consistency
We evaluated assessment consistency including the consistency of the water temperature, how many participants were able to complete the full duration of the conditioning stimulus, how many participants were able to meet the 60%–80% heart rate reserve (HRR) for aerobic exercise, if participants were able to complete all trials, if participants required any additional rest time between trials and overall, how long the protocol took.
Patient-reported outcomes
Patient reported outcomes were assessed at baseline (before the first treatment session) and post-intervention (at 8-weeks). This included pain intensity (11-point Pain Numeric Rating Scale (NRS)), 33 disability (Oswestry Disability Index (ODI)), 34 catastrophizing (Pain Catastrophizing Scale (PCS)), 35 fear of movement (Tampa Scale of Kinesiophobia), 36 and depressive symptoms (CES-D). 37
Endogenous pain modulation measures
The assessment protocol for EPM included the following QST: pain pressure threshold (PPT), temporal summation (TS), and conditioned pain modulation (CPM) as well as testing for exercise induced hypoalgesia (EIH). At baseline, the assessor was blinded to group allocation.
Pain pressure threshold
PPT was measured with an electronic pressure algometer (Wagner Instruments Greenwich, CT, USA) with a stimulation surface area of 1 cm2 at the lumbar spine (the most painful point indicated by the participant at the lumbar spine—indicative of local hyperalgesia) and at a distant site (thumbnail on the opposite side of the body—indicative of generalized hyperalgesia). 24 The lumbar spine measure was performed with the participant lying comfortably in prone, with the option to place a pillow under their stomach. Thumbnail measures were performed with the participant sitting in a chair and hand resting comfortably on a table. PPT was recorded as the moment when the sensation of pressure changes to a sensation of pain. Pressure was increased from 0 N at 5 N/s until the participant indicated that they have reached their PPT. Three consecutive measurements were performed at each site, with a 30-s recovery between repeated applications. The average of the 3 PPTs at each point was recorded.
Temporal summation
Mechanical TS was assessed using a 256 mN weighted pinprick stimulator (MRC Systems GmbH, Heidelberg Germany) at the point on the lumbar spine indicated by the participant to have the most pain. 38 Participants were subjected to a single contact from the pinprick and asked to rate the pain intensity from a scale of 0–10 where 0 is no pain and 10 is the most intense pain imaginable. After 10 s, the pinprick stimulator was applied 10 consecutive times at a rate of 1 contact per second within an area of 1 cm2. Participants were again prompted to provide a single 0–10 rating for the greatest intensity of pain they experienced during the 10 repeated contacts.39,40 The TS effect was calculated by subtracting the pain intensity following the single contact from the pain rating by the series of contacts. This procedure was repeated 3 times with a 1-min rest in between trials, and the average of the 3 TS effects was recorded. 39
Conditioned pain modulation
CPM was tested at the point with the most pain at the lumbar spine as previously indicated by the participant using algometry as the test stimulus and a cold pressor test with hand immersion as the conditioning stimulus (CS). First, participants’ baseline PPT was assessed. Then participants underwent cold water immersion (circulating cold water (IGLOO 5-gallon water cooler with aquarium circulation pump kept at 4°C). Participants placed the hand contralateral to the side of back pain into the cooler for a maximum of 2 min, or until the participant could no longer tolerate the pain. If the participant was able to keep their hand in the water, 30 s before the end of the 2 min while the participant’s hand was still immersed in the cold water, the algometer was used again on the lumbar spine to assess PPT, representing their conditioned PPT. If participants were unable to keep their hand in the water for the duration of the 2 min, PPT was assessed immediately after they removed their hand. 41 Participants underwent baseline PPT, cold pressor test and conditioned PPT assessment 2 times with a 2-min rest in between CPM trials. CPM effect was calculated as a percent change from baseline using the equation: CPM = [(PPTpost–PPTpre)/ PPTpre]∗100, where PPTpost was the PPT value after CS and PPTpre was the PPT value before CS.39,42 Positive numbers represented an inhibitory effect, while negative numbers represented a facilitatory effect.
Exercise induced hypoalgesia
EIH was assessed after a 15-min bout of aerobic exercise with a warmup and cool down period performed on a stationary bicycle (Spirit CU800 Bike, Dyaco Canada Inc 2020) at the heart rate (HR) (monitored using the Polar H10 monitor, Polar Electro, Kempele Finland) corresponding to 70% of their heart rate reserve (HRR). To calculate the target HR, we used the Karvonen formula (Target HR = [(maximum HR – resting HR) × %intensity] + resting HR). Participants were asked to keep their heart rate within 60%–80% HRR and remain around a 5/6 out of 10 on the rating of perceived exertion (RPE) scale. 43 These targets were used as this is considered moderate exercise. 44 PPT was measured before the exercise session using the protocol indicated above, again immediately after the exercise session, and at 10-min intervals post-exercise until PPT returned to within 2N of baseline PPT since this is around the SEM, 45 or up to 40 min after, as EIH is thought to only last for about 30 min after an exercise session.7,19 A 5-min rests between PPT, TS and CPM, and a 10-min rest before EIH was provided to ensure that subsequent measures were not being influenced by previous measures.
Heart rate was continually monitored throughout the bout of exercise using a Polar H10 monitor. If the participants were unable to maintain the target heart rate of 60% of HRR, we asked them to maintain their intensity of 5/6 based on the RPE scale. If the participants heart rate increased above moderate threshold (80% HRR) or RPE was above 7, we asked them to reduce the revolutions per minute of the bicycle, or resistance until their heart rate returned to within the 60%–80% range. If the participant’s heart rate was too high and unable to return to a moderate level, the participant stopped cycling until their heart rate reduced and we assessed if they could continue. If the participant was unable to continue or had to stop prior to the 15 min being complete, the time was noted, and the participant did not continue cycling.
Statistical analysis
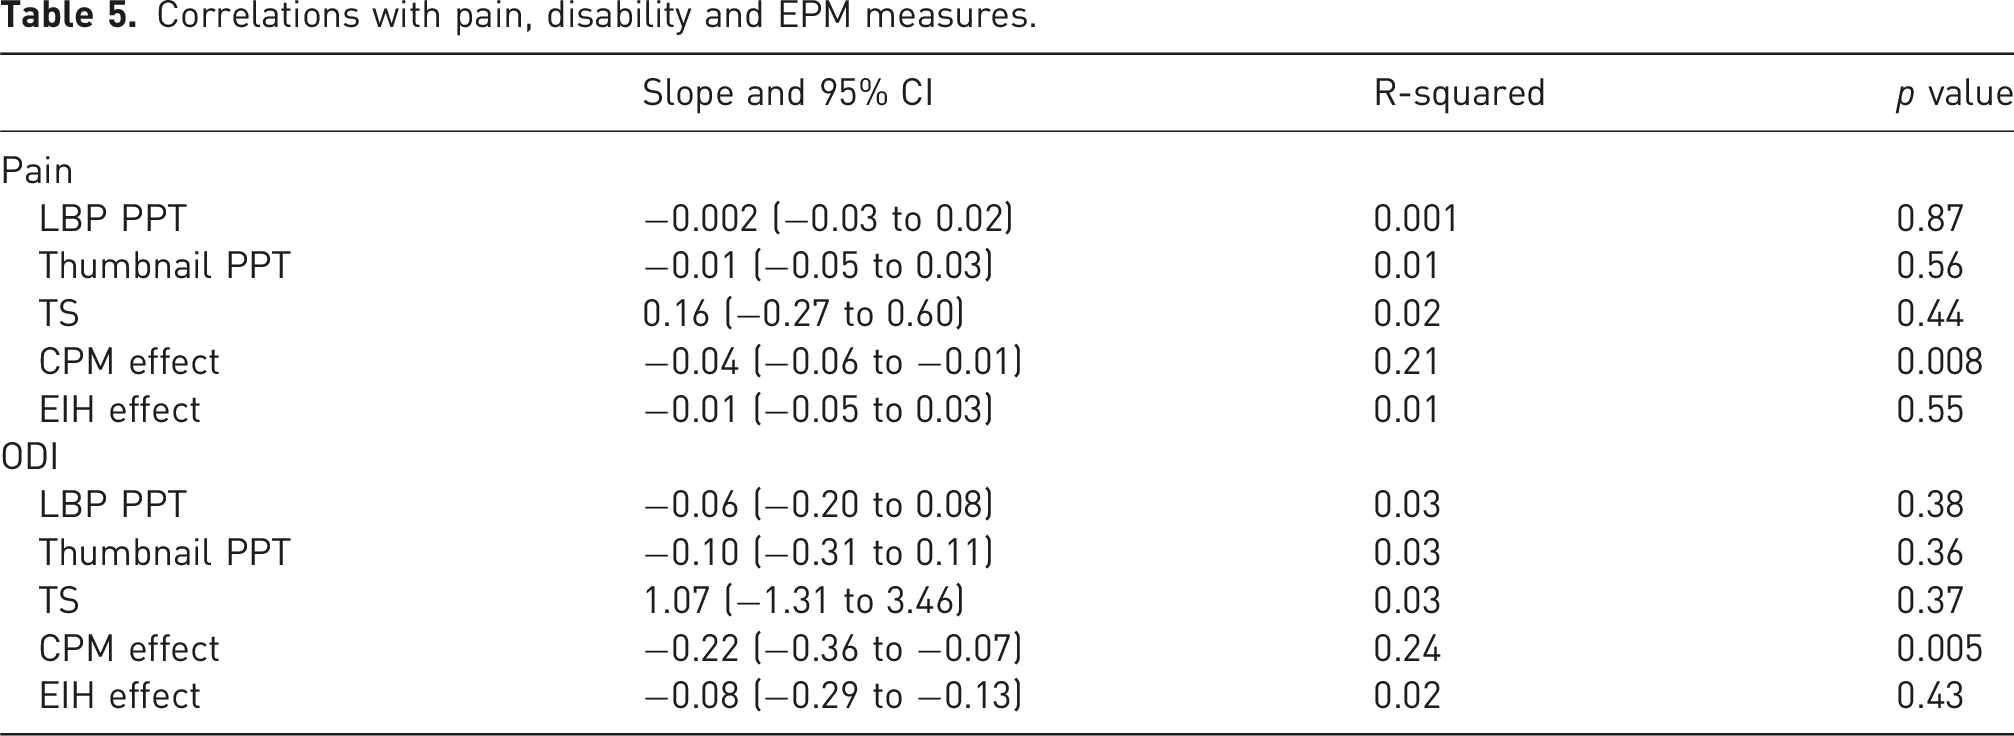
Descriptive statistics were used to report demographic characteristics of the participants as mean and confidence intervals or absolute and relative frequencies. For the outcomes of feasibility, we used descriptive statistics and reported our results based on the a priori thresholds (Table 1). To observe the trends in changes in EPM after exercise therapy, and whether this response is different between graded activity and motor control, we observed if there were any correlation between patient reported outcomes of pain and disability, and EPM measures using linear regression. To calculate total scores for questionnaires with missing item responses, the individual score from a specific questionnaire was averaged by the number of questions that were completed, and this average was used in place of the missing data to allow for total scores to be calculated. 46
Sample size calculation
We calculated the sample size using the 95% Confidence Interval method, as suggested by Thabane et al., 2010. 47 We required a total sample size of n = 36 (n = 18 from each group) to answer our feasibility questions (primary outcome of attrition, secondary outcomes of recruitment, completion, burden of assessment and consistency). Using a margin of error, no greater than 10%, a sample size of 36 participants allowed for a lower boundary of the 95% CI to be above 80% retention, which is in line with the expected range for clinical trials.
Results
Between 9 November 2023 and 3 April 2024, 104 participants were recruited into the WELBack Study, of which 68 participants were asked if they were interested in participating in this sub-study. Not all participants were invited to this study due to a lack of proximity to McMaster or time constraints during calls. In total, 58 were interested in hearing more about this study for a total of 36 consenting to participate and completing baseline assessments. Of the 36 participants that completed baseline assessments, 2 were not randomized into the WELBack. One participant at initial physiotherapy assessment was deemed ineligible for the WELBack study due to not having non-specific LBP and a second participant never attended their initial physiotherapy assessment. In addition, two participants were lost to follow up; one withdrew from the WELBack and this study for personal reasons, and one was unreachable at follow-up, leaving 32 participants who attended the post intervention follow up. See Figure 2 for study flow diagram. Participant flow diagram.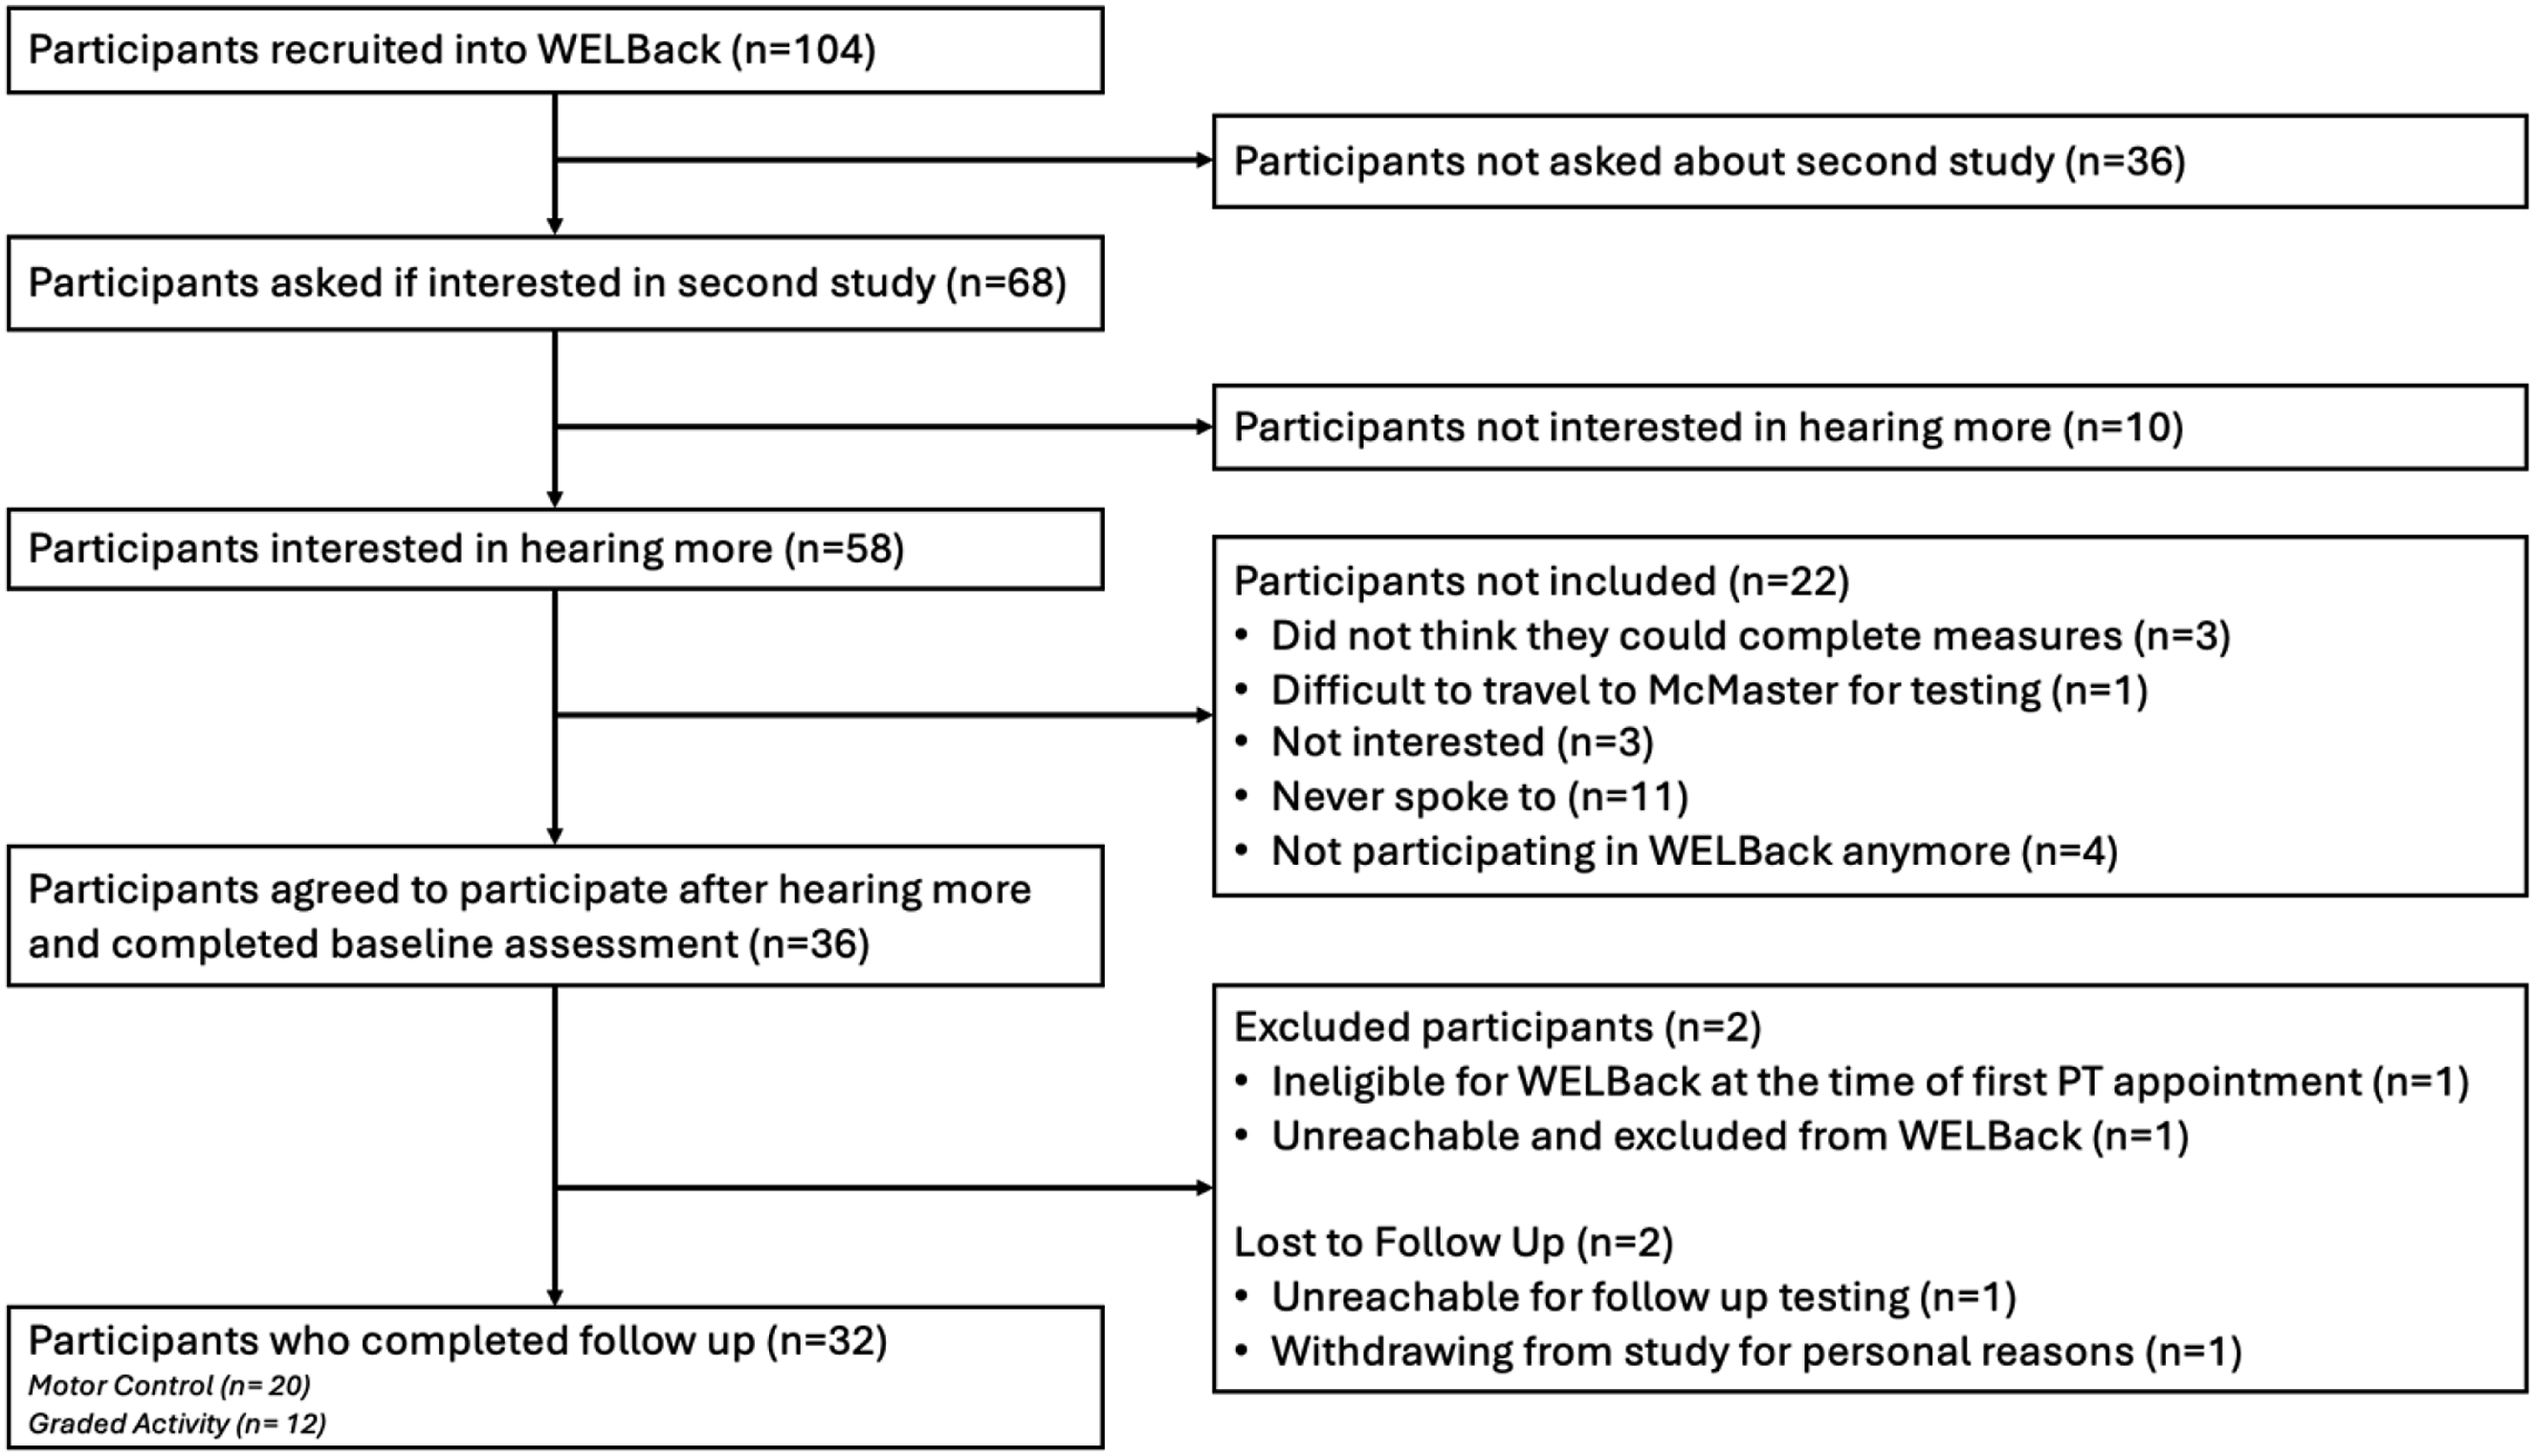
Demographic characteristics
Participant characteristics as mean and 95% confidence interval or absolute and relative frequencies.
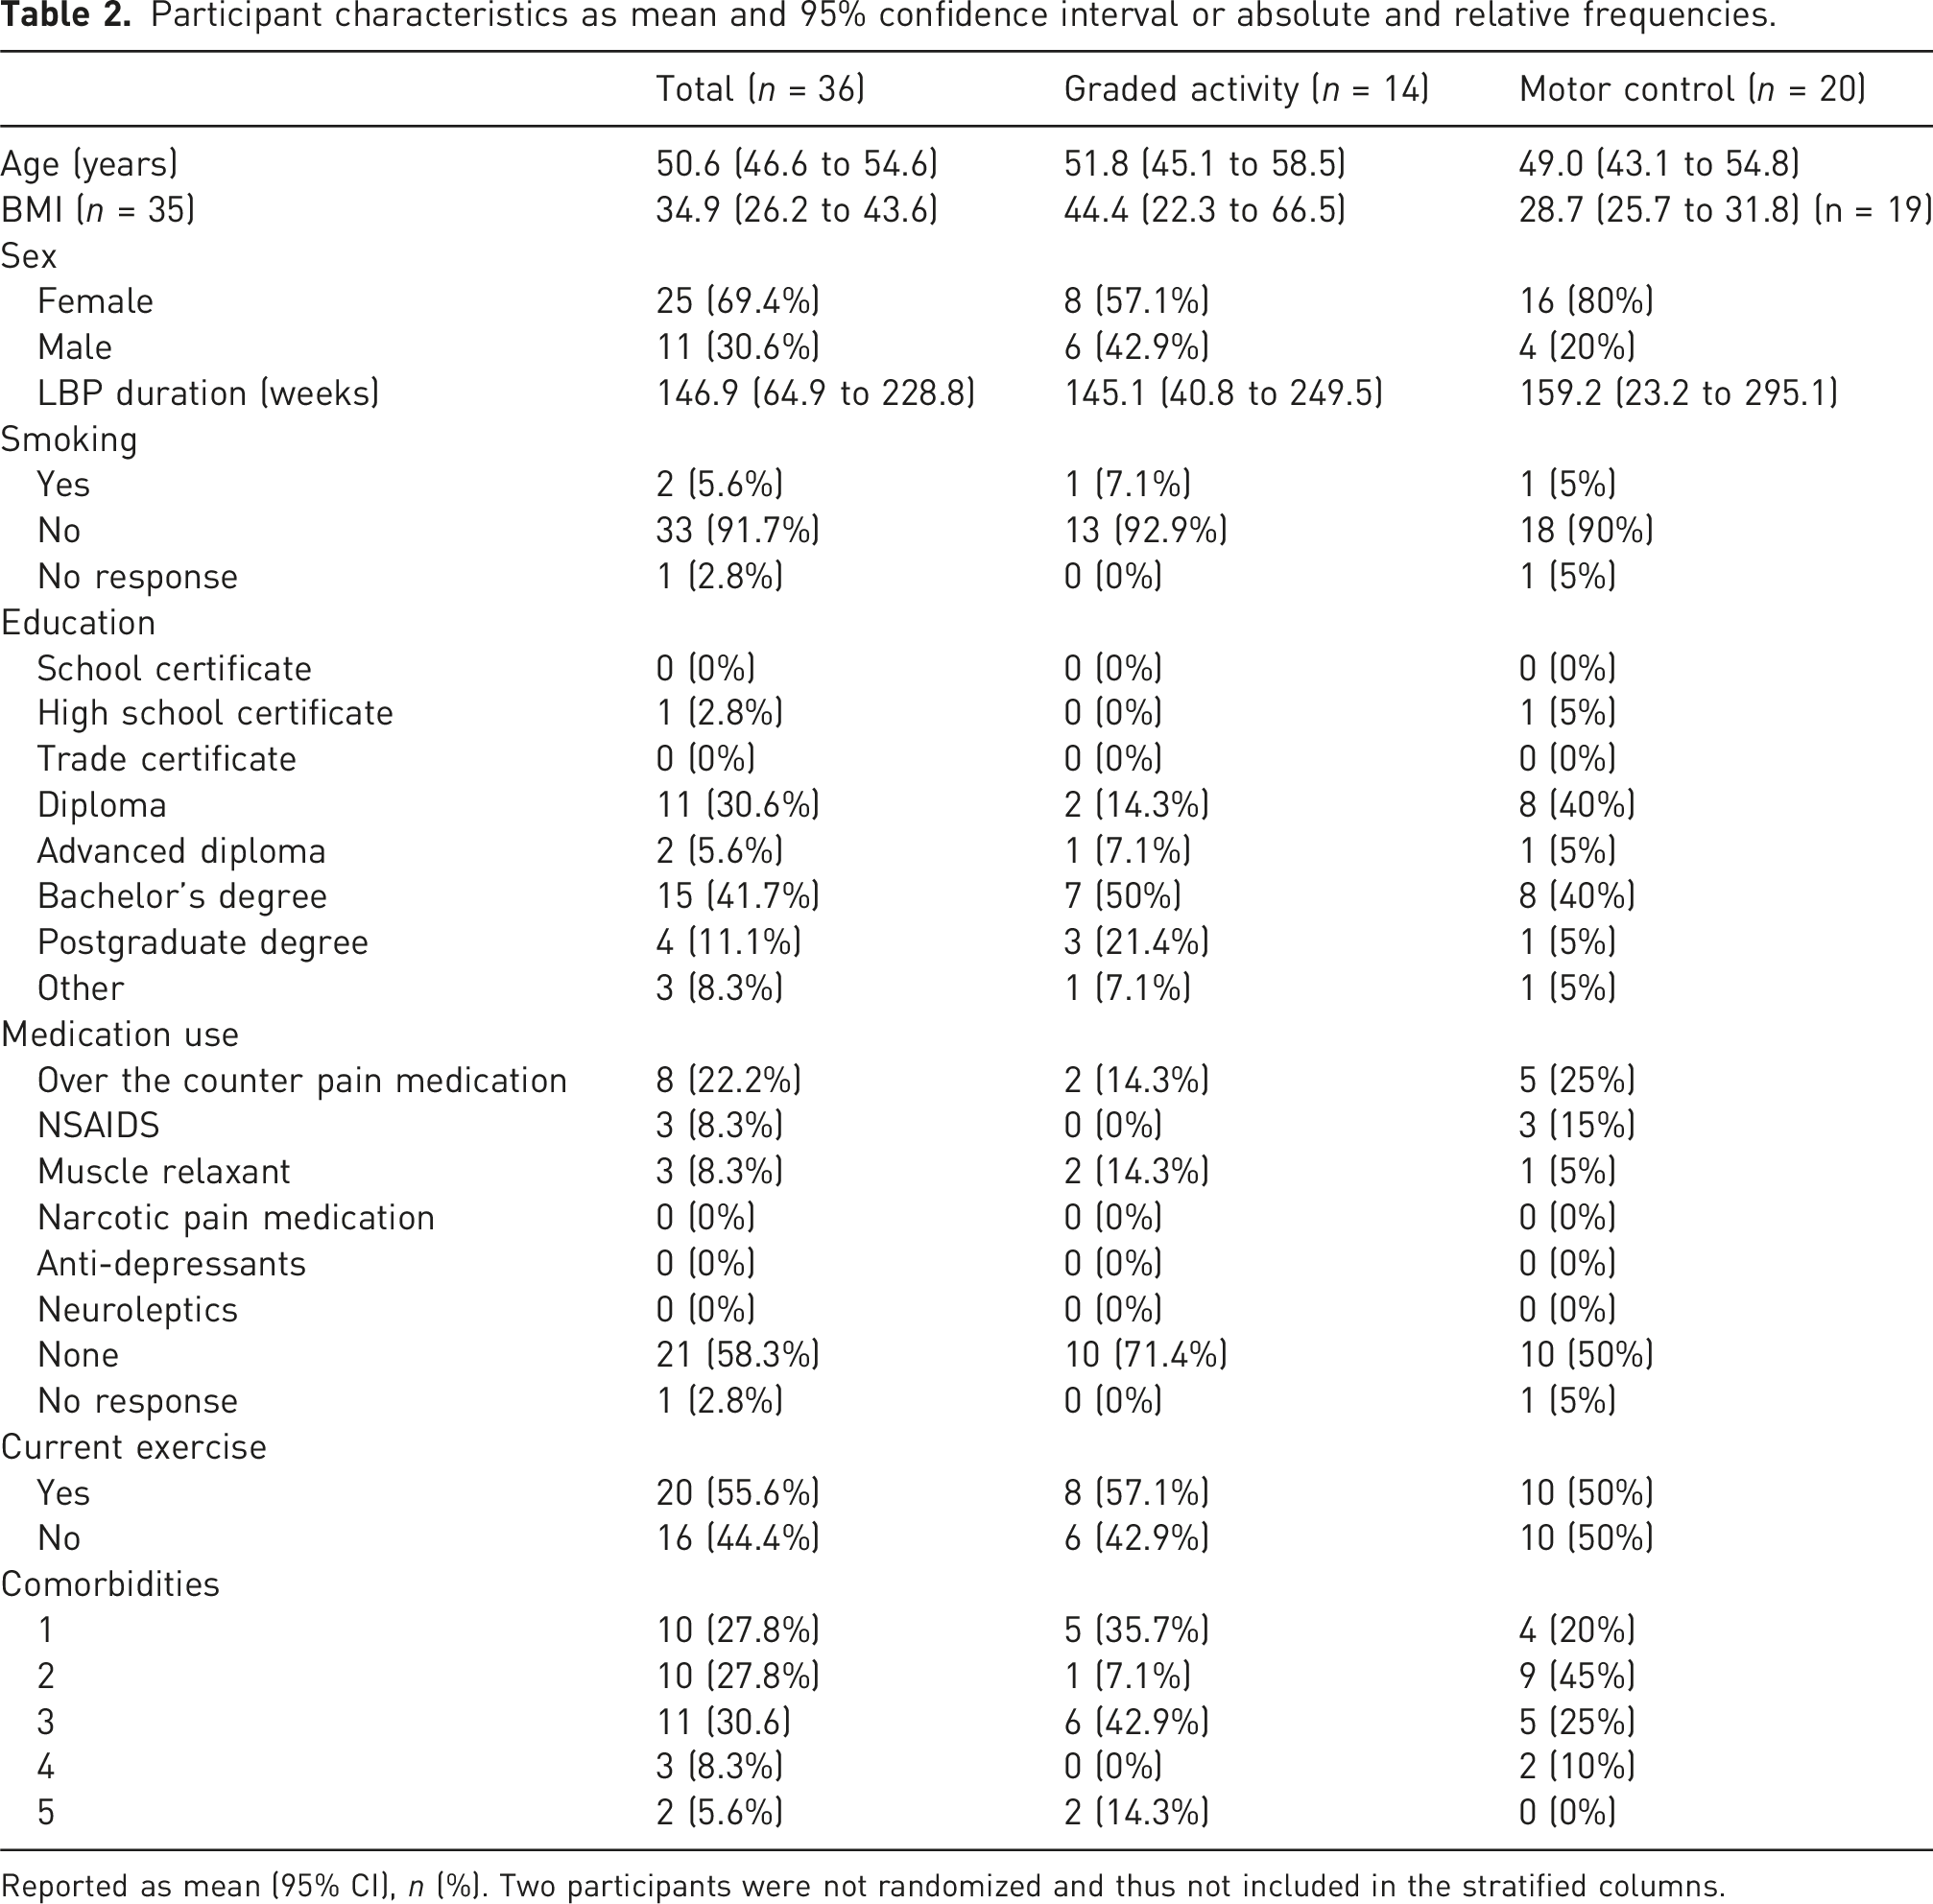
Reported as mean (95% CI), n (%). Two participants were not randomized and thus not included in the stratified columns.
Feasibility outcomes
Attrition rate
Of the 36 participants recruited into this study, all completed baseline assessment, and 32 (88.9%) completed the follow up assessment, meeting our cut-off for <15% attrition rate. Only one participant could not complete EIH at follow up due to a knee injury obtained from activity outside of the study treatment. The average amount of time that passed between participants last physiotherapy appointment and their follow up visit was 13.3 ± 13.4 days, with a minimum of 1 day and a maximum of 54 days after the last treatment.
Recruitment rate
We were able to recruit our sample size within 5 months (7.2 participants per month), which meets the feasibility criterion for recruitment rate (n = 36 in 6 months). In total, 52.9% (36 out of 68) of eligible participants that were invited to partake in the sub-study were included. Unfortunately, not all participants that were eligible for the WELBack study were invited, meaning that only 34.6% (36 out of 104) of those recruited to the WELBack within the time frame were included in this study. The enrolment rate of 52.9% met our feasibility criterion, however; this only accounts for those that were invited to hear more about this study.
Exercise adherence
Participants in this study generally had good adherence to the exercise sessions with 30/36 participants (83.3%) completing all 12 sessions, meeting our a priori threshold of 75%. There was one participant who completed 7/12 sessions due to time constraint and one participant who completed 6/12 sessions as they withdrew from the intervention due to a pain flare. The 2 participants who did not complete follow up assessments completed 12 and 7 physiotherapy sessions.
Burden of assessment protocol
The burden of the assessment protocol was assessed at baseline. In total, 32 (88.9%) participants rated the protocol to be equal or less than 3 on a 0 to 10 scale for burdensomeness, with an average response of 1.2 (0.6 to 1.8), meeting our feasibility threshold of 80%. However, 21 (58.3%) of participants rated the discomfort with the assessments to be equal to or less than 3, with an average response of 3.3 (2.6 to 4.0), not meeting our feasibility threshold of 80% meaning that some modifications are needed. Finally, 35 (97.2%) rated that they were likely to participate in a similar study as greater or equal to 7, with an average response of 9.2 (8.8 to 9.6) meeting our feasibility threshold of 80%.
Qualitative description of written feedback of the protocols was conducted. Twenty-three patients responded to the feedback question. The primary feedback was that the ice bath was the most uncomfortable part of the protocol follow by challenges in completing biking. Many participants described that they had a good experience, were happy to participate and would be open to participating again.
Assessment consistency
The assessment consistency was evaluated at baseline and at follow up. The average temperature of the water was 4.4 ± 0.6°C. The number of participants that were able to keep their hand in the water for the 1 min and 30 s target time for at least one of the trials was 21 (58.3%). The remaining 41.6% of participants removed their hand before this time. For EIH, all the participants were able to cycle for the 15 min, but only 25 (69.4%) participants were able to meet their 60%–80% HRR threshold. The remainder of participants cycled between a 5 and 6 out of 10 on the RPE scale. No participants needed to stop cycling due to a HR that was over 80% and could not return to the 60%–80% range. Finally, all participants were able to complete all trials for all tests, with no requirements for skipping trials.
On average, the full protocol took 1 h and 39 min ±13 min to complete. This included rest times and instructions. No participants required any additional rest than allotted in between tests. The longer rest times usually occurred before CPM when the water needed to be brought to the correct temperature, or before EIH if the participant required a washroom break, to ensure they rested for at least 5 min to get a resting HR and resting blood pressure value.
Patient reported outcomes
Patient reported outcomes.
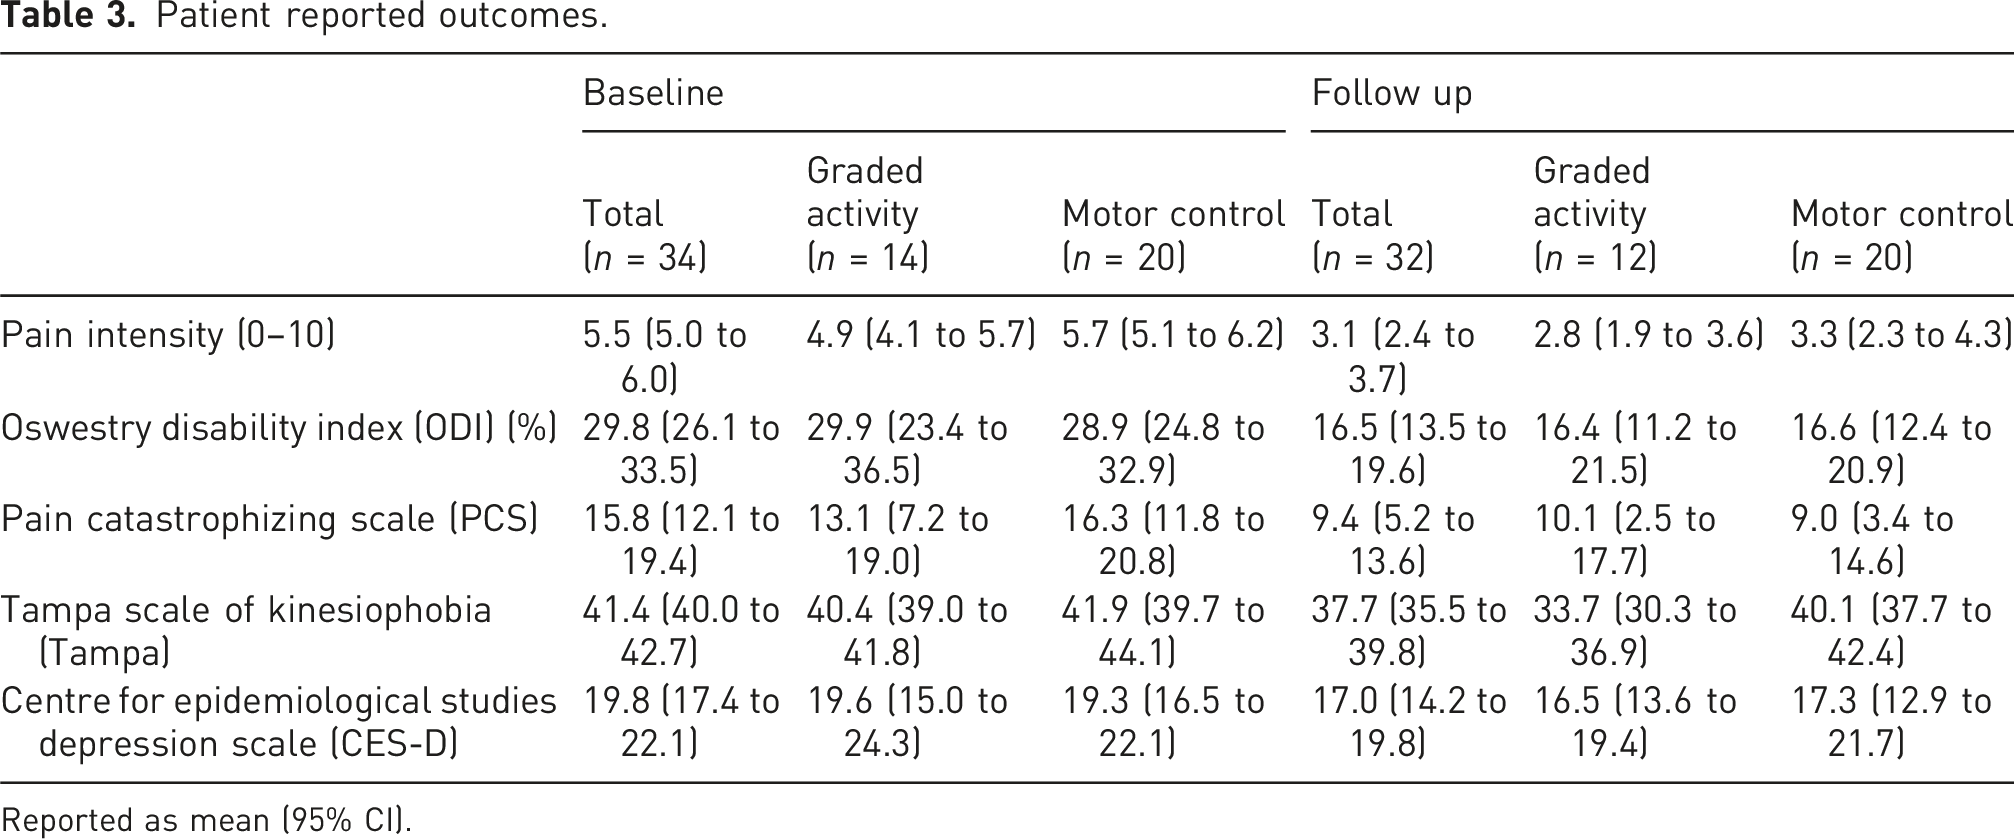
Reported as mean (95% CI).
Endogenous pain modulation measures
Quantitative sensory testing measures.
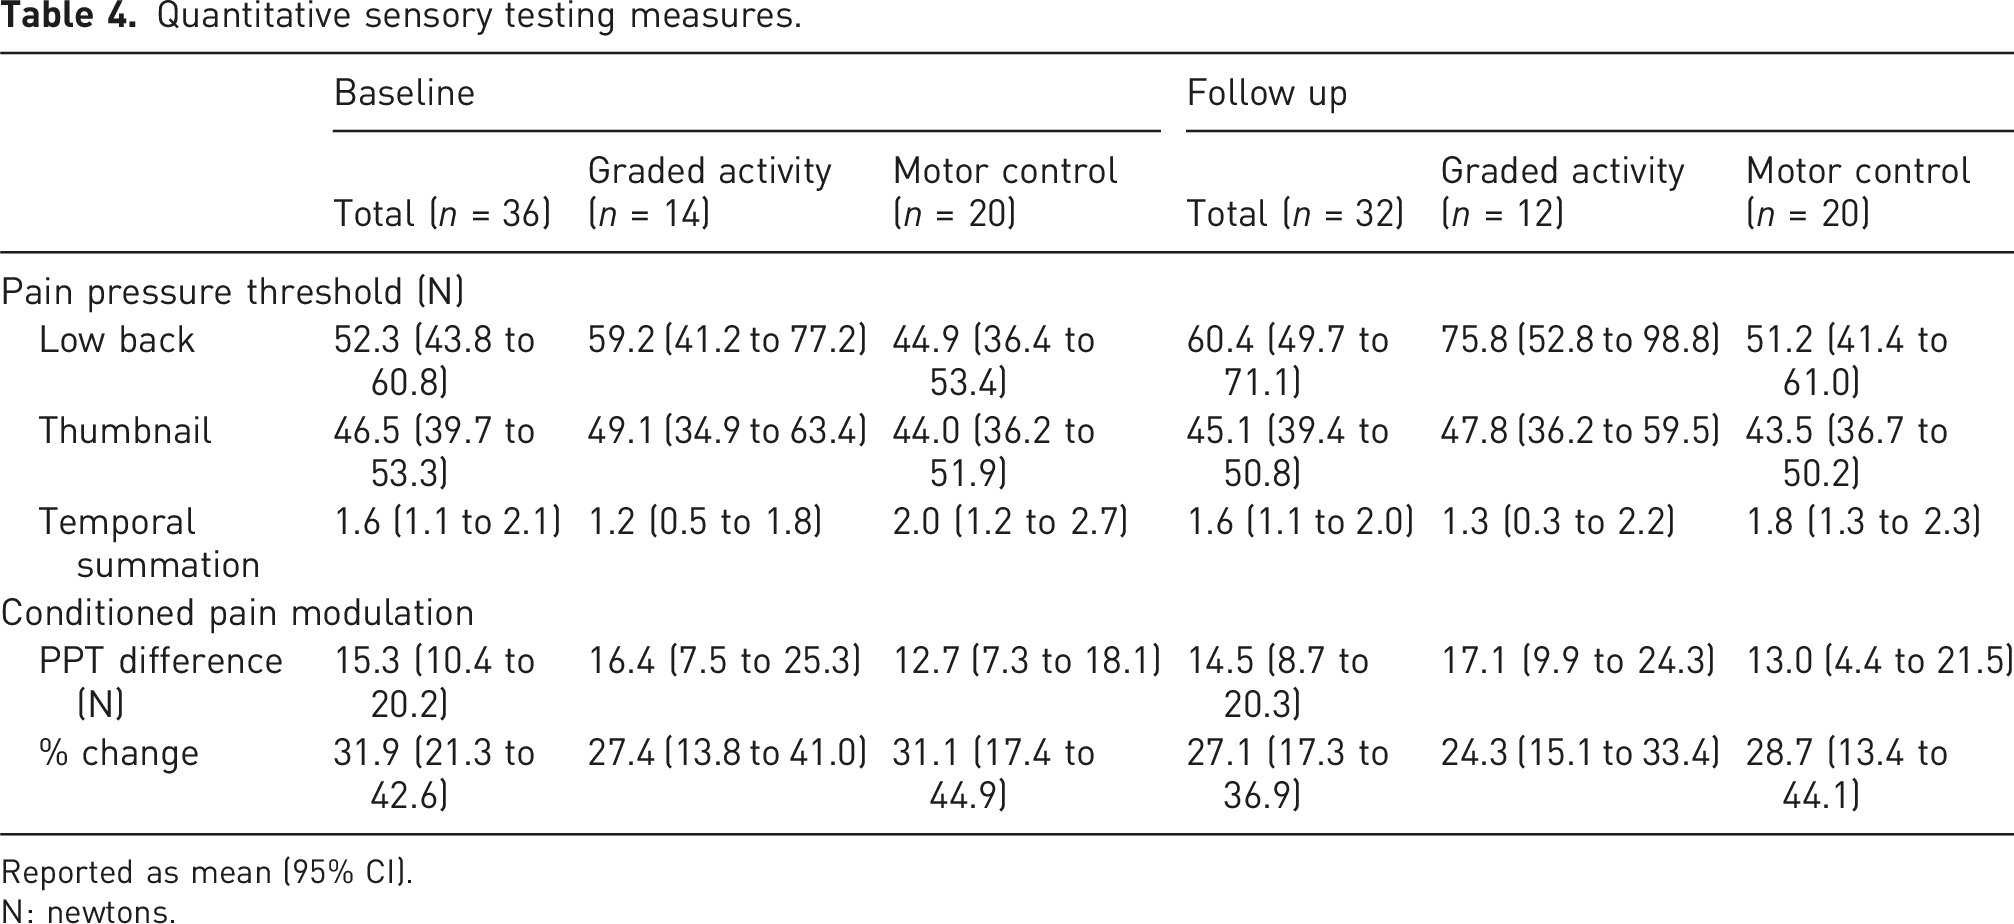
Reported as mean (95% CI).
N: newtons.
The EIH effect (change in PPT from baseline) for both groups immediately after the exercise was 7.6 (2.5 to 12.7) at baseline and 4.7 (−1.1 to 10.5) at follow-up (n = 31). The EIH effect varied in length from 20 min to greater than 40 min. Participants had different responses after exercise, with some PPTs not changing and others increasing or decreasing throughout the 40 min at both baseline and at follow up.
Correlations with EPM measures
Correlations with pain, disability and EPM measures.
Discussion
The study results show that the protocol is feasible in terms of attrition, recruitment rate, burden of assessment protocol and exercise adherence. In terms of recruitment and retention, we were able to recruit our sample within the expected time frame, with minimal drop out and adequate completion of exercise sessions. The assessment of protocol discomfort was adequate with cold-water immersion being the most unpleasant test. The QST and EIH protocol were highly feasible with all participants that attended the sessions completing all tests. The water temperature stayed consistent at approximately 4.4°C and over half of the participants were able to keep their hand in the water for the duration of the test. Similarly, all participants completed the EIH tests with around 70% of participants being able to reach and maintain their target 60%–80% HRR during the 15 min of cycling. A trend was observed with a slight decrease in pain and disability with small potential decreases in catastrophizing, kinesiophobia and depressive symptoms.
Participants had PPT values at baseline that were comparable to previous literature.48–51 These PPT values were slightly higher at follow up for all participants and CPM was slightly lower at follow-up. The higher PPT values at follow up were in line with our expectations. The lower CPM suggests that participants had less inhibition at follow up, which was opposite to our expectations. The slight decrease in the average effect of CPM at follow up may be because PPTs at the low back were slightly higher at follow up indicating that individuals had less peripheral pain sensitivity, which may indicate the need for less pain inhibition, and thus less change seen with CPM. There was a slight but likely not important decrease in PPT at the thumbnail at follow up, suggesting a potential increase in central sensitivity. However, TS change scores were similar at baseline and at follow up, suggesting that the trend in individuals central pain facilitation did not change after exercise therapy. At both baseline and follow-up, the EIH response was variable with some participants PPT increasing immediately after exercise and staying elevated or decreasing after a certain point, while others decreased after exercise and had a delayed increase effect or just stayed around their pre-PPT value. Previous literature investigating EIH in LBP has shown impairments or no EIH effect,11,13 however, none of these studies did 15 min of moderate aerobic exercise.
An important finding of this study was the high feasibility of our protocol with participants experiencing the most discomfort with the cold-water immersion as part of the CPM test. However, it is important to note that a CPM effect is only experienced when a noxious stimulus is applied, and thus, some level of discomfort is always expected when testing CPM. Cold water immersion was used in this study as it was the most commonly used in this population based on the results from a scoping review conducted by Goodman et al., 2024. 52 There is evidence in healthy individuals that suggests that different conditioned stimuli (cuff pressure pain stimulation, cold pressor test and thermode-based cold painful stimulation) may produce significantly different CPM effect 53 while other studies have found no difference between hot water immersion, cold pressor test and ischemic occlusion CPM effects. 54 A systematic review that looked at the reliability of CPM concluded that cold pressor tests and ischemic tests had the highest reliability in healthy participants, and cold pressor test had the highest reliability in individuals with chronic pain. 55 Thus, future studies should compare different conditioning stimuli, such as investigating whether ischemic might be more accepted by patients in comparison to cold water immersion, to find the optimal modality, with minimal discomfort, for use in LBP.
In this study, we aimed to be consistent with the rest times between trials and between different tests. There is currently no information on how long it may take for the nervous system to return to baseline between these tests. In our study, PPT was relatively stable throughout the protocol, but for some participants, PPT seemed to increase as we performed each consecutive tests. This may suggest that our rest times between tests may not have been long enough for PPT to return to baseline and questions the appropriateness of collecting multiple EPM measures in the same assessment. Similarly, with CPM, some individuals seemed to have a delayed effect, where during the second CPM trial, the first PPT measurement was still elevated compared to the previous trial. This may have occurred due to too short rest time between trials, not allowing the nervous system enough time to settle. Previous research in healthy participants has suggested that the CPM effect can last up to 32 min, 56 however, it is unclear how long it may last in individuals with chronic pain. Future recommendations should consider providing longer rest times between CPM trials, and investigating how different timing and consecutive measures may impact the results.
A challenge in conducting CPM is the conduction of parallel versus sequential test stimuli assessment.3,42 In our study, when participants removed their hand before the 1 min 30 s duration, we performed the test sequentially, rather than in parallel when they kept their hand in the water. It has been suggested that CPM responses may be stronger for parallel assessments as compared to sequential, 3 but sequential assessments may be more accurate as there are less distractions. 42 It is unclear how much the use of parallel or sequential assessments, depending of participant’s response to the CS, impacted our results. To control for these differences, some studies suggest the use of an individualized threshold for the conditioning stimulus (e.g. pain rating of 50/100)57–59 which allows for the consistent assessment of parallel test stimulus. Future research is needed to compare methods of sequential and parallel CPM, and how much this might change the CPM response.
This study is the first to investigate EPM changes after a longitudinal exercise therapy intervention in LBP population. One strength of this study is that we used the traffic light method for evaluating the feasibility criteria, demonstrating that our results support the progression to a future trial with minimal to no modifications. Revisions on the CPM protocol is needed to ensure that the discomfort experienced by participants is reduced. This may include altering the temperature or selecting a different modality for the conditioning stimulus, which may also allow for the consistent parallel assessment of CPM. Additionally, we used a standardized protocol developed based on the most used protocols for QST in LBP. Despite this strength, because there is no standardized QST protocol for use in LBP, the psychometric properties of this specific protocol are not known. However, in general we know that PPT, TS, and CPM have acceptable reliability in LBP. 60 Data on the validity and responsiveness of these measures are unknown as they are highly dependent on the protocols that are used, which is a limitation of these measures. Although we considered rest times between trials and measurements, these may not have been enough time to allow the nervous system to settle. A significant challenge that presented itself during the follow up data collection was getting participants to do the testing session close to their last physiotherapy date. On average, this was 13 days past their last appointment, with the minimum being 1 day and the maximum being almost 2 months, which did not really capture the exact change immediately after treatment. Future studies should consider adding the in-person assessment at the physiotherapy clinic or set schedules to improve assessment timeframes. Additionally, we did not have an equal split of participants between the groups, because this study was embedded within a larger trial. The same issue is unlikely to occur in a study when QST and EIH responses are the primary objective of the study.
Conclusion
In conclusion, this study investigated EPM changes after an exercise therapy intervention in individuals with LBP. The results of this study demonstrate that the protocol is feasible, and that it is feasible to collect additional data within a larger trial. Trends with patient reported outcomes seemed to decrease at follow up indicating some improvements in pain and disability, while improvements in EPM measures of TS and CPM were seen locally. A future trial should consider different methods of recruitment and follow up testing, as well as some changes to the conditioning stimulus used for CPM.
Footnotes
Ethical considerations
This study received ethics approval from the Hamilton Integrated Research Ethics Board (HiREB #7986).
Consent to participate
All participants provided written informed consent prior to enrolment in the study.
Author contributions
LG and LM conceived the study, were involved with protocol development, gaining ethical approval and data analysis. LG was involved with patient recruitment and writing the first draft of the manuscript. All authors reviewed and edited the manuscript and approved the final version of the manuscript.
Funding
The authors disclosed receipt of the following financial support for the research, authorship, and/or publication of this article: This work was supported by the Physiotherapy Foundation of Canada Awards Program: OrthoCanada Award for Research in Neck, Back and Core Stability. The WELBack trial is supported by the Canadian Institutes for Health Research. LG is supported by an Ontario Graduate Scholarship and LC is supported by the Arthritis Society.
Declaration of conflicting interests
The authors declared no potential conflicts of interest with respect to the research, authorship, and/or publication of this article.
Clinical trial registration
This pilot study was embedded within a randomized controlled clinical trial ‘Which Exercise for Low Back Pain? Predicting Response to Exercise for Patients With Low Back Pain’ (NCT04283409).
Appendix
The burden of assessment protocol consisted of asking participants four questions. The first three were rated on a 0–10 VAS (where 0 was not at all and 10 was extremely) and were as follows: (1) Overall, how bothersome did you find the assessment process? (2) Overall, how much discomfort did you experience during the assessment process? (3) How likely are you to participate in a similar project in the future? The fourth question was open-ended and participants were provided space to write any feedback they had about the procedure.