
Abstract
Background
Complex regional pain syndrome (CRPS) can be a debilitating pain condition with enduring physical, psychological and social impacts. CRPS is often poorly understood by healthcare professionals and management needs to be tailored to each individual’s presentation. People with lived experience express difficulty in accessing reliable and meaningful information about the condition. This study aimed to co-create a trustworthy infographic to share information about the lived experience of CRPS.
Methods
We adopted a seven-phase, iterative, participatory methodology to co-create the infographic. Potential infographic content was obtained from qualitative work investigating the lived experience of CRPS. Online consumer engagement (people with doctor diagnosed CRPS/their family, n=20) was used to prioritise content to be included in the infographic and then potential designs were sourced. The research team narrowed the selections down to two designs which were presented to consumers online for final selection (n=25) and refinement (n=34).
Results
An infographic for understanding the lived experience of CRPS was completed using participatory design, providing a resource aligned to the needs of people with this condition. Using the Patient Education Materials Assessment Tool, the final infographic rated highly for understandability (92%) and participants indicated significant willingness to share this infographic with others (93%).
Conclusion
A process of participatory design was an effective and efficient process for translation of evidence gathered from qualitative research into a trustworthy resource for people with CRPS and their support people.
Keywords
Introduction
Complex regional pain syndrome (CRPS) is a condition where people typically present with severe pain that is disproportionate to the inciting event with variable signs and symptoms of inflammatory, sensory, autonomic, trophic and/or motor involvement.1–4 For 51%–89% of people with CRPS there will be persistent pain and motor dysfunction greater than 1 year post onset 5 and this can be associated with ongoing personal, financial and social burden. Clinical practice guidelines identify the need for appropriate information and education to support people living with CRPS. 2 However, evidence suggests that people with lived CRPS experience often have limited knowledge of their condition, 6 and readily accessible information may not be trustworthy.7,8
Exploration of the lived experience of people with CRPS has shown the condition can cause considerable physical and emotional distress.9–13 People report feeling isolated, experiencing a loss of self-identity and struggle to be understood by their loved ones or healthcare professionals.9–14 There is report of lament and frustration at the difficulty in finding trustworthy information on CRPS, with information shared not addressing their concerns or in direct conflict with their own lived experiences.11,12,14 Dissemination of information gathered on the lived experience of CRPS could potentially help people better understand their condition.
There is increasing recognition of the benefits of genuine engagement of consumers in health research, in the development of Models of Care and in resource co-creation.15–18 Participatory design of educational resources to support people with health conditions gives consumers an active voice to positively influence care models, including elements such as the suitability and useability of educational material.19–21 A participatory design process has previously been trialled for co-design of a Wiki page to provide an educational resource on the lived experience of CRPS, to complement material generated by health professionals. 22 Engagement of consumers in the Wiki was unsuccessful, but consumer engagement did assist with the co-creation of educational leaflets. This may suggest that the mode of engagement is important.
The aim of this study was to use a participatory design approach to co-create an infographic that conveys the lived experience of people with CRPS. We focused on the lived experience leveraging translation of our prior qualitative work on this aspect of CRPS11,14 and reflecting an evidence gap in provision of targeted CRPS educational material. This had been identified as an area need in the development of educational concepts for CRPS. 23 We did not intend to include information on other aspects of CRPS such as signs and symptoms and specific treatments. We chose an infographic as the preferred educational resource format with the potential advantages of improved attention, comprehension and recall of health education information when compared to traditional education materials. 24 Also, participatory design methodology has been used successfully for co-creation of infographics in other areas of health.25–28
Methods
Study design
A seven-phased iterative participatory design 21 methodology was adopted to inform the co-creation of a trustworthy infographic on the lived experience of CRPS, informed by e-Delphi principles. 29 Ethical approved was granted by the Curtin University Human Research Ethics Committee (Approval Number HRE2021-0300). In carrying out this work we referred to guidelines related to participatory design, 30 Delphi studies 31 and consumer engagement. 32
Participants
Participants involved in the consumer engagement phases of the project were eligible if they were 18 years or older, able to read English and, (i) had been diagnosed with CRPS by a medical doctor, or (ii) were family or friends of people living with CRPS. A sample size of at least 15 for each consumer engagement phase of the iterative process (Phase 2, 4 and 6) was deemed appropriate based on prior consumer engagement studies.26,33 Recruitment consisted of a sample of convenience drawn from community sources, including CRPS support groups aided by www.burningnightscrps.org, and private healthcare practices. Recruitment was carried out via social media and electronic newsletters. Participants could take part from anywhere globally if they met the inclusion criteria. All participant
Consultation process for infographic co-creation
An overview of the seven-phased employed in the participatory de Seven phases of the participatory design process.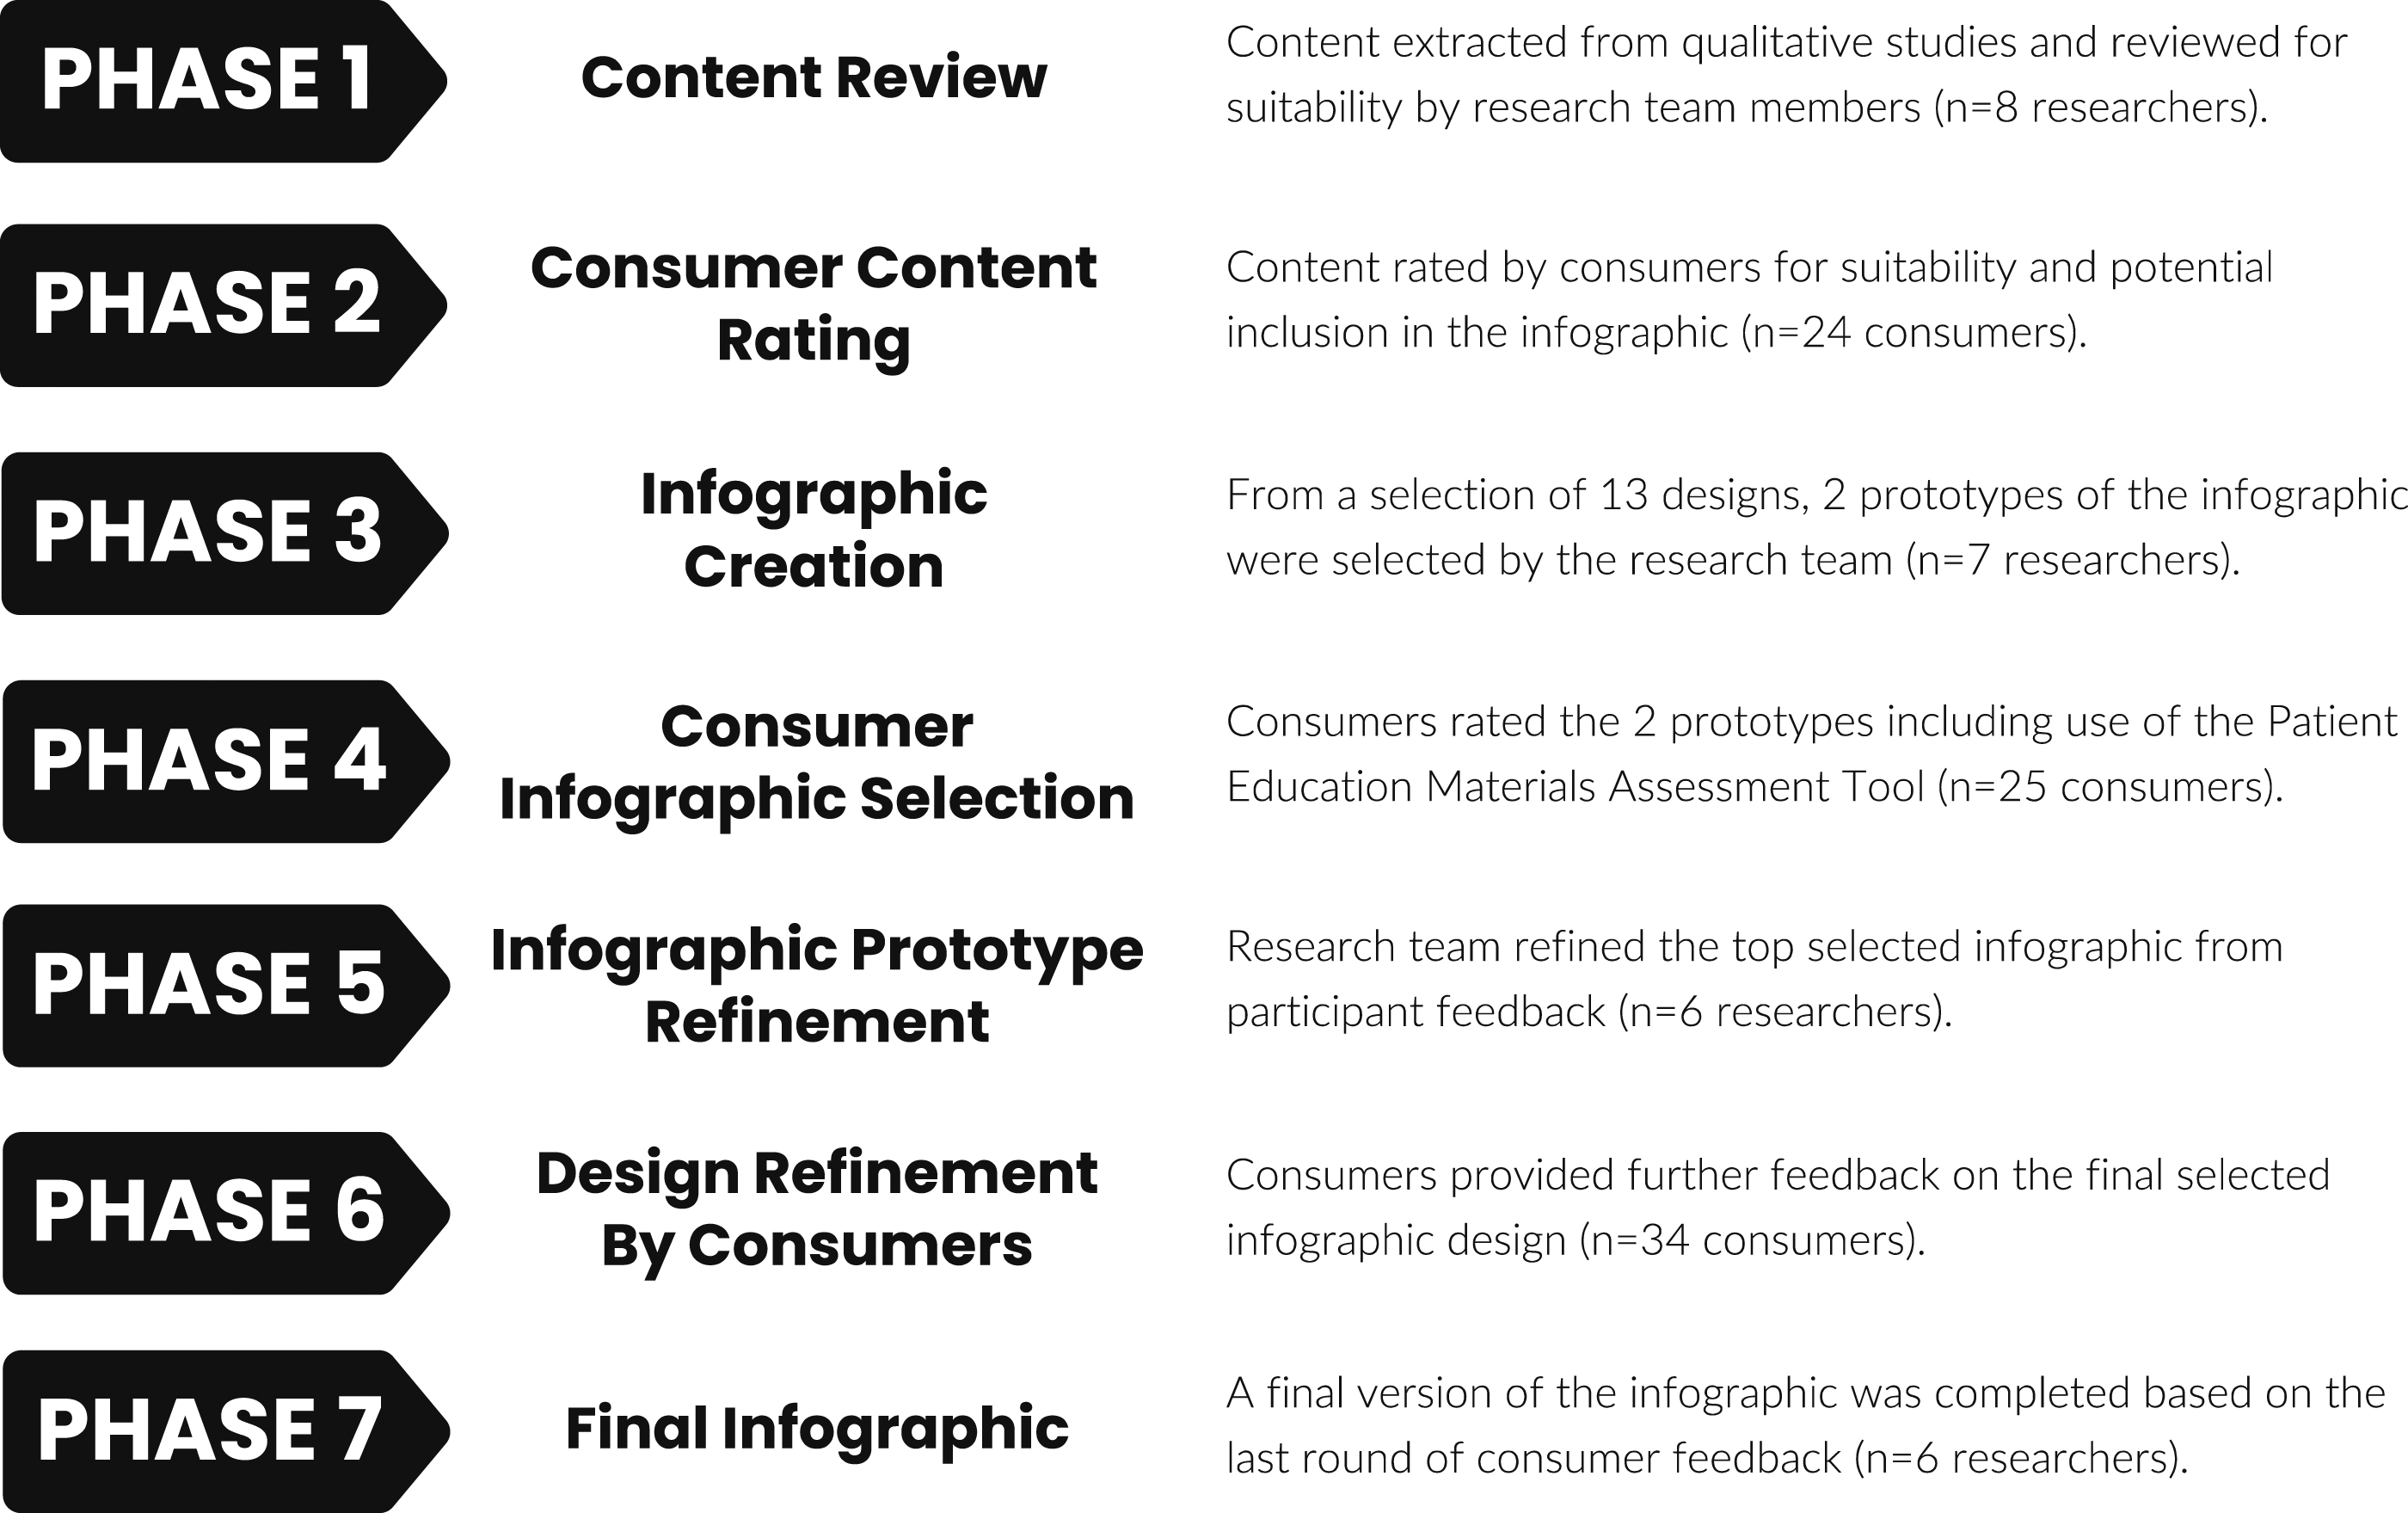
Phase 1: Content review of the lived experiences of CRPS
This phase involved a review of published qualitative studies undertaken by members of the research team which explored the lived experience for people with CRPS (DB, SR, DH, TM, HS 11 and SG 14 ). A list was systematically extracted and collated from these papers, reflecting common themes/subthemes expressed. Supporting quotes for these themes were added and rephrased (DB, YH, JL, BL, AY, HS) providing context for each theme. Seven members of the research team (DB, YH, JL, BL, AY, SG, HS) independently rated the suitability of these identified themes and the associated extracted quotes to be included in the initial draft infographic using a 5-point Likert scale (1=Unnecessary, 2=Not very important, 3=Neutral, 4=Somewhat important, 5=Vitally important). A priori cut-off of ≥70% of panel agreement for each theme and associated quote was set in accordance with RAND Corporation/University of California, Los Angeles guidance on agreement, 34 with inclusion of items rated as 4=Somewhat important or 5=Vitally important. The RAND methodology provides a robust framework for analysing data proved by a panel of ‘experts’. Themes and associated quotes that did not achieve ≥70% agreement were removed from the list. For external validation of the rating of items, this final list was reviewed by one member of the team (SR), who was independent of the preceding review process.
Phase 2: Consumer rating of level of importance of content
An online survey powered by QualtricsTM was developed for the purpose of attaining consumer input into the suitability of the list of themes and associated quotes from Phase 1, and to further prioritise these for potential inclusion on the infographic. The survey screened participant inclusion criteria and included a request for consent prior to participants being provided access to the broader survey. Demographic information was collected including age, gender, residing country, year of CRPS diagnosis and the duration of symptoms. Participants were asked to rate the importance of each proposed theme or quote on a 9-point Likert scale (1=Less important to 9=Most important). 34 Themes and quotes were retained if ≥ 80% of the participants rated the respective theme or quote at a level of importance ≥ 7. 34 In addition participants were asked about their willingness to use an infographic on a 5-point scale (Extremely unlikely, Somewhat unlikely, Neither likely or unlikely, Somewhat likely, Extremely likely). Confidence in their knowledge of CRPS on a 9-point Likert scale (1=Not confident at all to 9=Completely confident) was collected at the start and the end of the survey. This was included because it was considered a useful demographic variable to describe the consumer group and to see if engagement in the participatory design process influenced their confidence of their own knowledge about CRPS. At the end of the survey, a free text section was provided for participants to provide any additional feedback. The survey was kept open for 2 weeks. Themes and quotes retained were then ranked according to participants' ratings for use in Phase 3.
Phase 3: Infographic creation
Designers were invited to participate in the infographic development through the Crowdspring platform (www.crowdspring.com). Crowdspring is a platform that aims to democratise graphic design from designers around the world. A project brief detailing the intent of the infographic, target audience and themes and quotes derived from Phase 2 was uploaded onto the platform. The project proposal was open for submission from designers for 7 days. Participating designers were provided interim feedback by the research team on any submitted draft content over this period and invited to iterate their designs. At the close of the 7-day window, seven members of the research team (DB, YH, JL, BL, AY, TM, HS) independently ranked their top five preferred infographics (5=Top rank, 1=5th rank). A member of the team collated these scores (DB) and the two highest scoring infographics were selected. Further feedback was provided to the designers of these two infographics to guide design iteration by research team members (YH, JL, BL). In Crowdspring, we a priori allowed for commissions to be awarded to the top two designs, as per Crowdsping procedures.
Phase 4: Consumer infographic selection
Participants were asked to review the two preferred infographics created in Phase 3 via an online survey (QualtricsTM platform). The online survey review process included items based on the Patient Education Materials Assessment Tool (PEMAT). 35 The PEMAT was designed to guide the development and selection of patient education materials in the constructs of patients understandability (how easy is it for the participant to understand the material) and actionability (how easy is it for the participant to act on the information). Items for printable materials including questions related to the educational materials content, word choice, organisation and design. Each item is rated either Disagree (scored 0) or Agree (scored 1). As per the PEMAT guidance, two scores for each infographic were then calculated, one for understandability and another for actionability. Each score was calculated by summing the total points allocated and dividing the sum by the total possible points and multiplying the result by a 100. The higher the PEMAT score, the more understandable or actionable the material is; there is no cut-off score. Participants were also asked to choose their preferred design (Infographic A or Infographic B). Confidence in their knowledge of CRPS was collected as per Stage 2. Participants were then invited to include any other feedback in a free text field. The survey was kept open for 2 weeks.
Phase 5: Refining the prototype
Based on PEMAT scores and participant rating on their preferred design, one design was selected as the infographic prototype. Following a consensus discussion with the research team (DB, YH, JL, BL, AY, HS), iteration of content and design of the preferred graphic was undertaken by the same designer from Phase 3.
Phase 6: Consumer refinement of the final design
A final online survey (QualtricsTM platform) based on the PEMAT tool from Phase 4, and using the same questions, was adopted to obtain PEMAT scores and feedback for the final design prototype. Three additional questions were asked of participants in this phase:
(i) Would you use this infographic to share with others what it's like to live with CRPS? (yes/no), (ii) If you had this infographic earlier in your journey, do you think this would have helped you understand your/your friend or family's condition better? (yes/no) and (iii) whether they participated in the Phase 2 and/or Phase 4 surveys? (yes/no). Confidence in their knowledge of CRPS was collected as per Stage 2. Participants were again invited to include any other feedback in a free text field. Recruitment ceased after 2 weeks.
Phase 7: Final infographic
The PEMAT scores and free text participant comments from Phase 6 were reviewed by the research team (DB, YH, JL, BL, AY, HS). Following a consensus discussion, the design was finalised. Design changes were implemented by the same designer involved in Phases 3 and 5.
Data analysis
Survey responses were included if the participant completed more than 80% of the survey. Descriptive statistics were utilised to profile the participants in Phase 2, 4 and 6. For Phase 2, ratings for each proposed infographic content were tabulated and presented graphically in a heat map format. 36 Data on participants’ willingness to use an infographic was presented in percentages. For Phase 4, the PEMAT scores (understandability and actionability) were tabulated for the two draft infographics. Participants’ ratings of their preferred infographic were presented as percentages. Free text feedback gathered from the participants was recorded. For Phase 6, the PEMAT and free text feedback were analysed as per Phase 4. Data from the additional questions were presented as percentages. Statistical analysis was carried out using the Jamovi software (Version 1.6.15). All statistical tests were carried out with p value <0.05 considered as significant. Paired sample t-tests were conducted to compare participants’ confidence levels on their knowledge of CRPS pre- and post-survey in Phase 2, 4 and 6.
Results
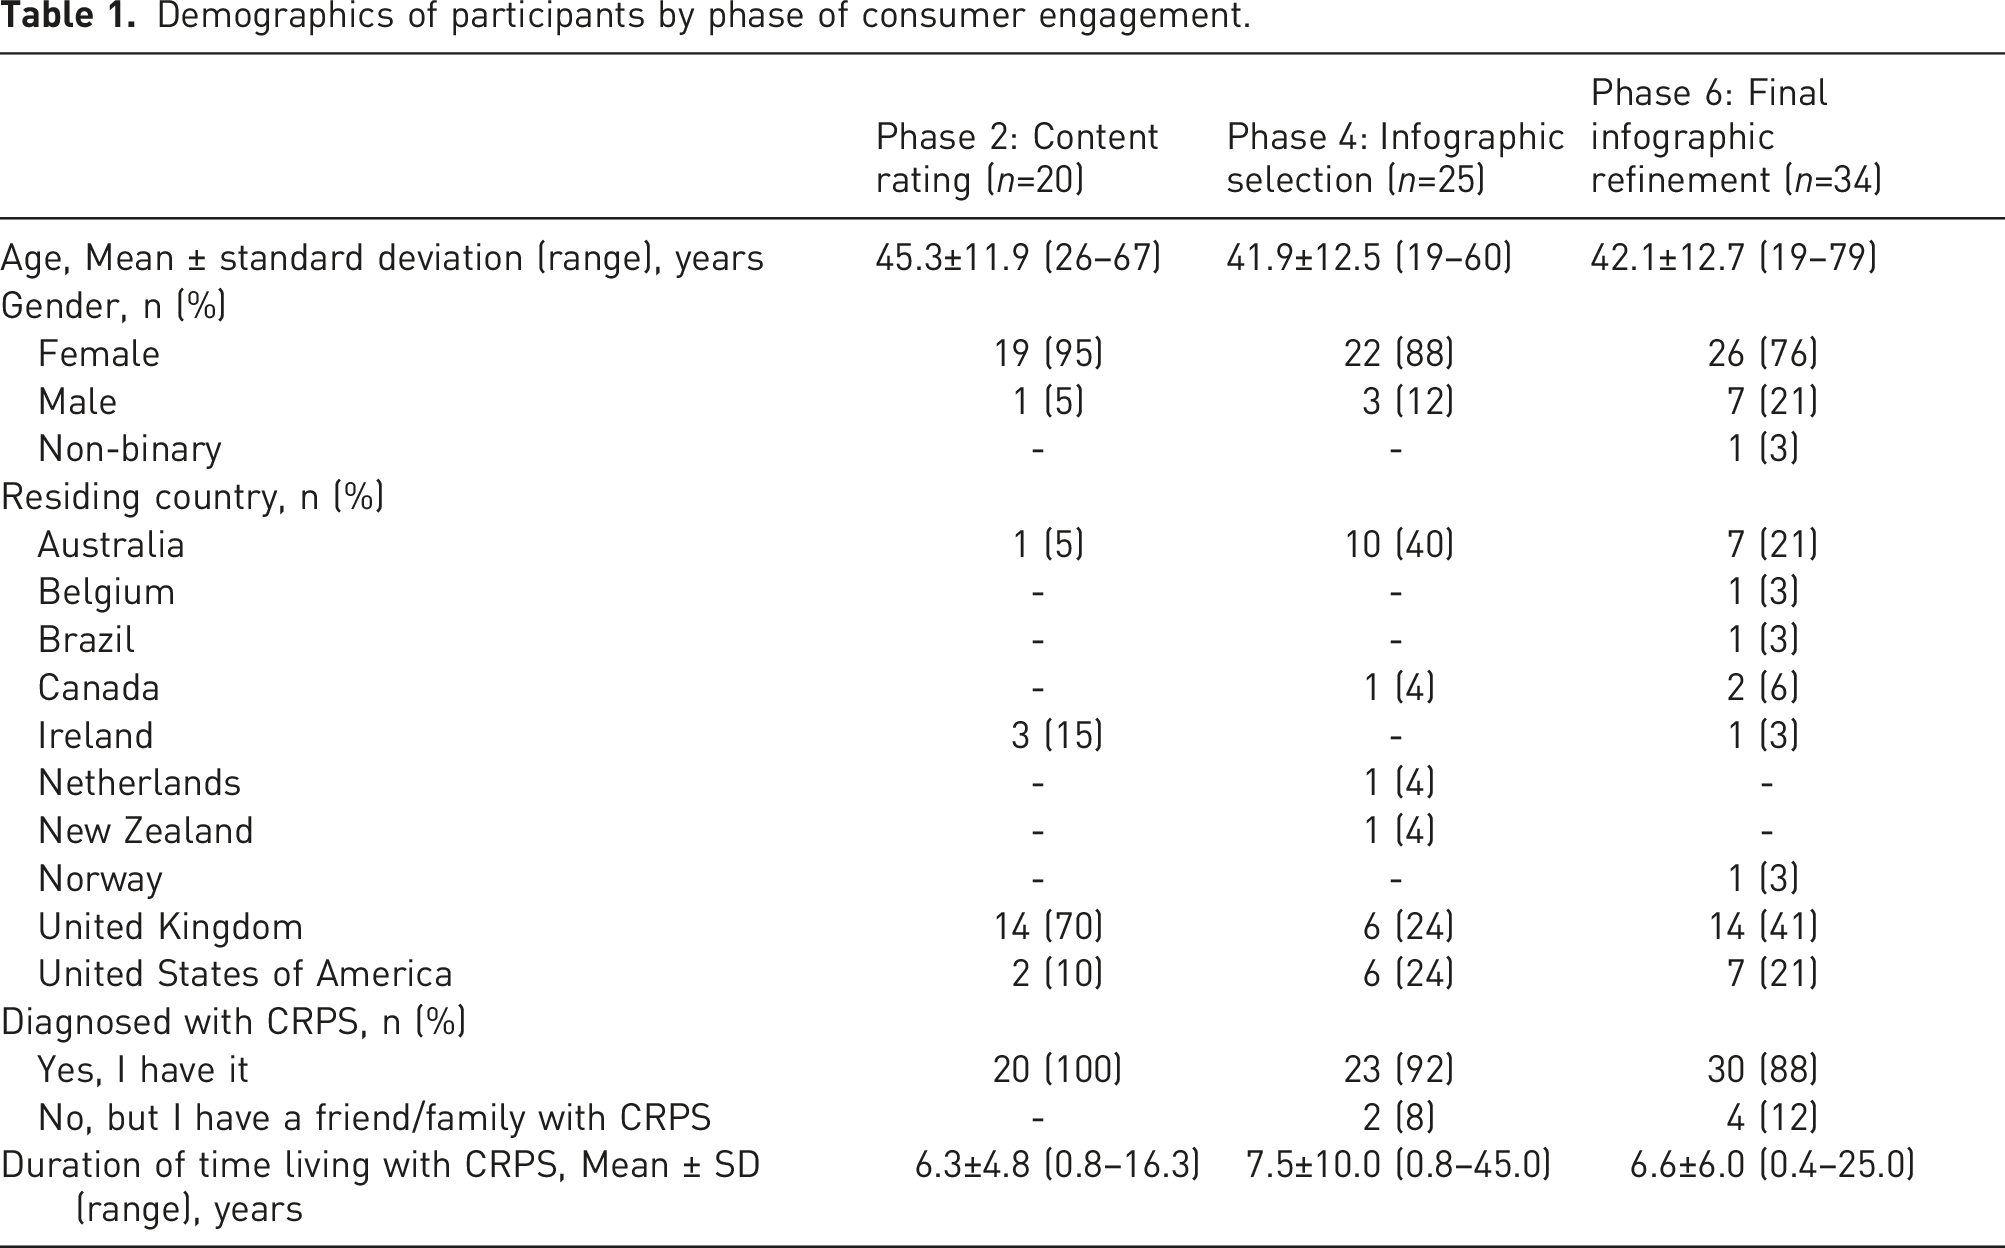
Demographics of participants by phase of consumer engagement.
Phase 1: Content review of the lived experience of CRPS
Participant rating of themes, subthemes and quotes for potential content inclusion.
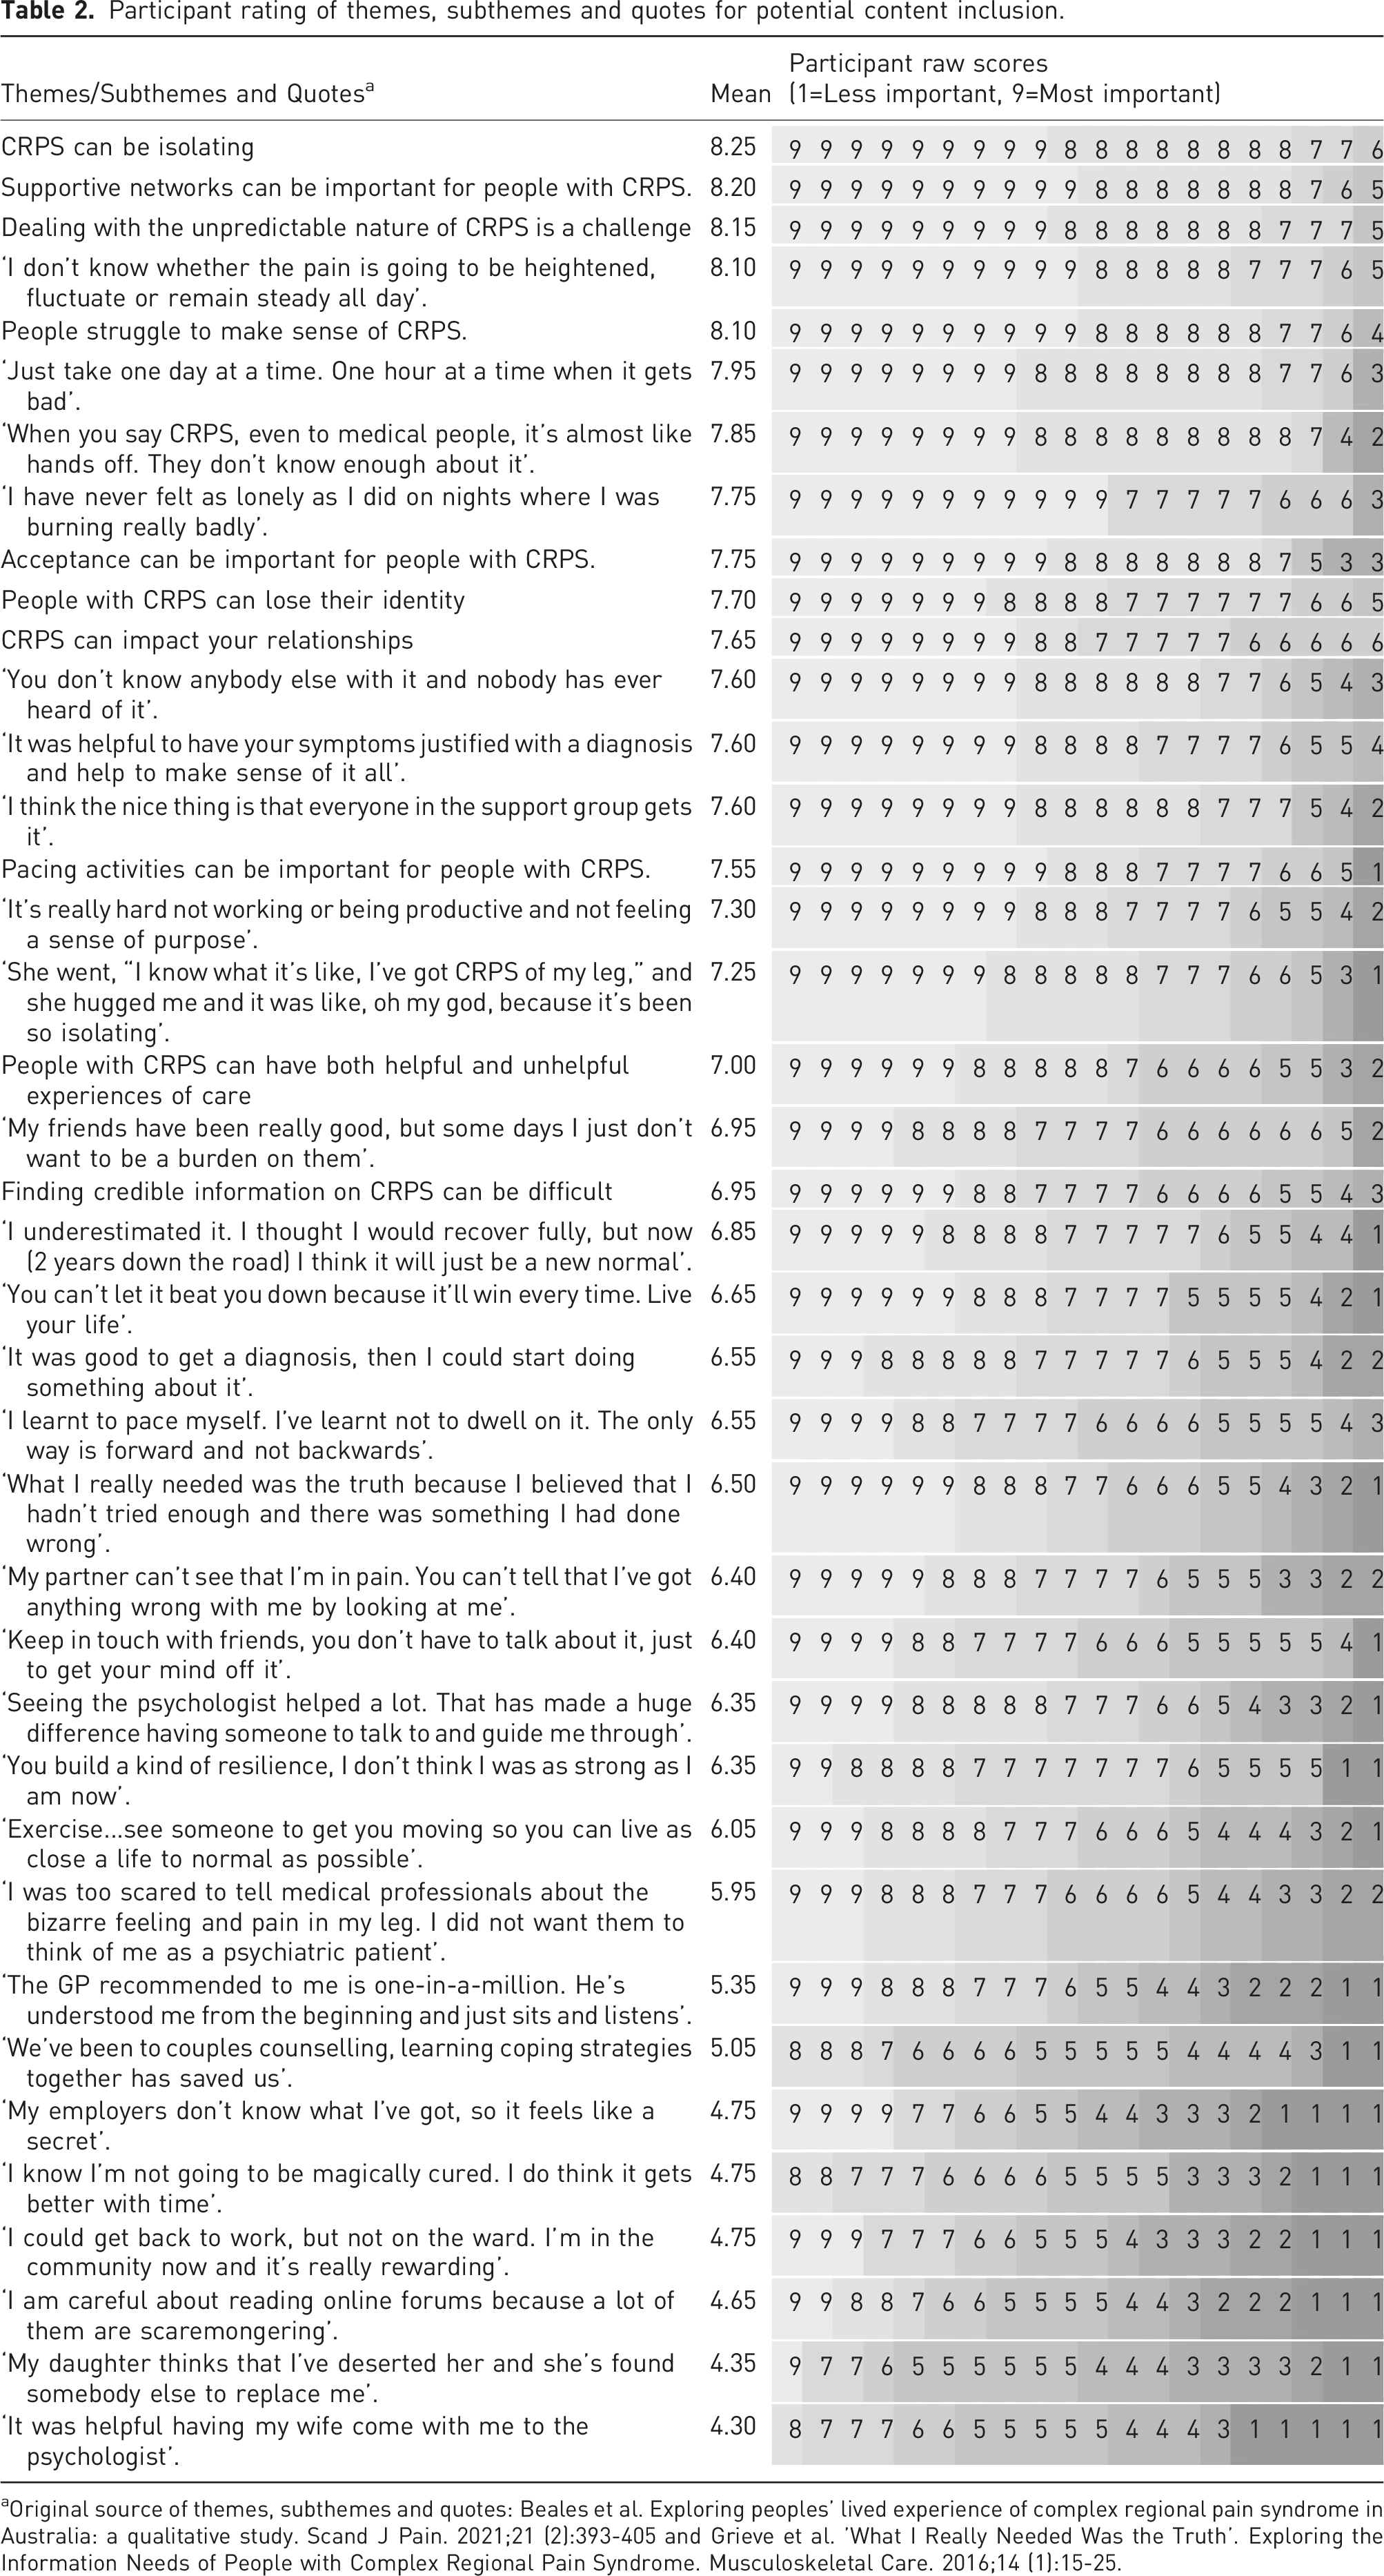
aOriginal source of themes, subthemes and quotes: Beales et al. Exploring peoples' lived experience of complex regional pain syndrome in Australia: a qualitative study. Scand J Pain. 2021;21 (2):393-405 and Grieve et al. 'What I Really Needed Was the Truth’. Exploring the Information Needs of People with Complex Regional Pain Syndrome. Musculoskeletal Care. 2016;14 (1):15-25.
Phase 2: Consumer rating of level of importance of content
Responses from the 20 participants who rated the importance of potential content for the infographic are provided in Table 2. The top 14 items met the criteria for inclusion in Phase 3 (≥80% of the participants rated the respective theme or quote at a level of importance ≥7). Participants indicated they were either extremely likely (12/20, 60%) or somewhat likely (8/20, 40%) to use an infographic on the experience of living with CRPS. There was no statistically significant difference in participants’ ratings of their confidence in knowledge of CRPS pre- (mean 7.15 (standard deviation (SD) 1.4)) and post- (mean 7.2 (SD 1.3)) survey completion (p = 0.58).
Phase 3: Infographic development
A total of 43 infographic designs were submitted by designers on Crowdspring, though many were slight variances on a central design by the same designer. Thus, 13 unique designs were considered. Using the five to one voting scheme, the highest rank design received 26 points and the second highest 20 points. These two designs were used in Phase 4. The third highest rated design received 16 points, with the rest receiving seven or less points.
Phase 4: Consumer infographic selection
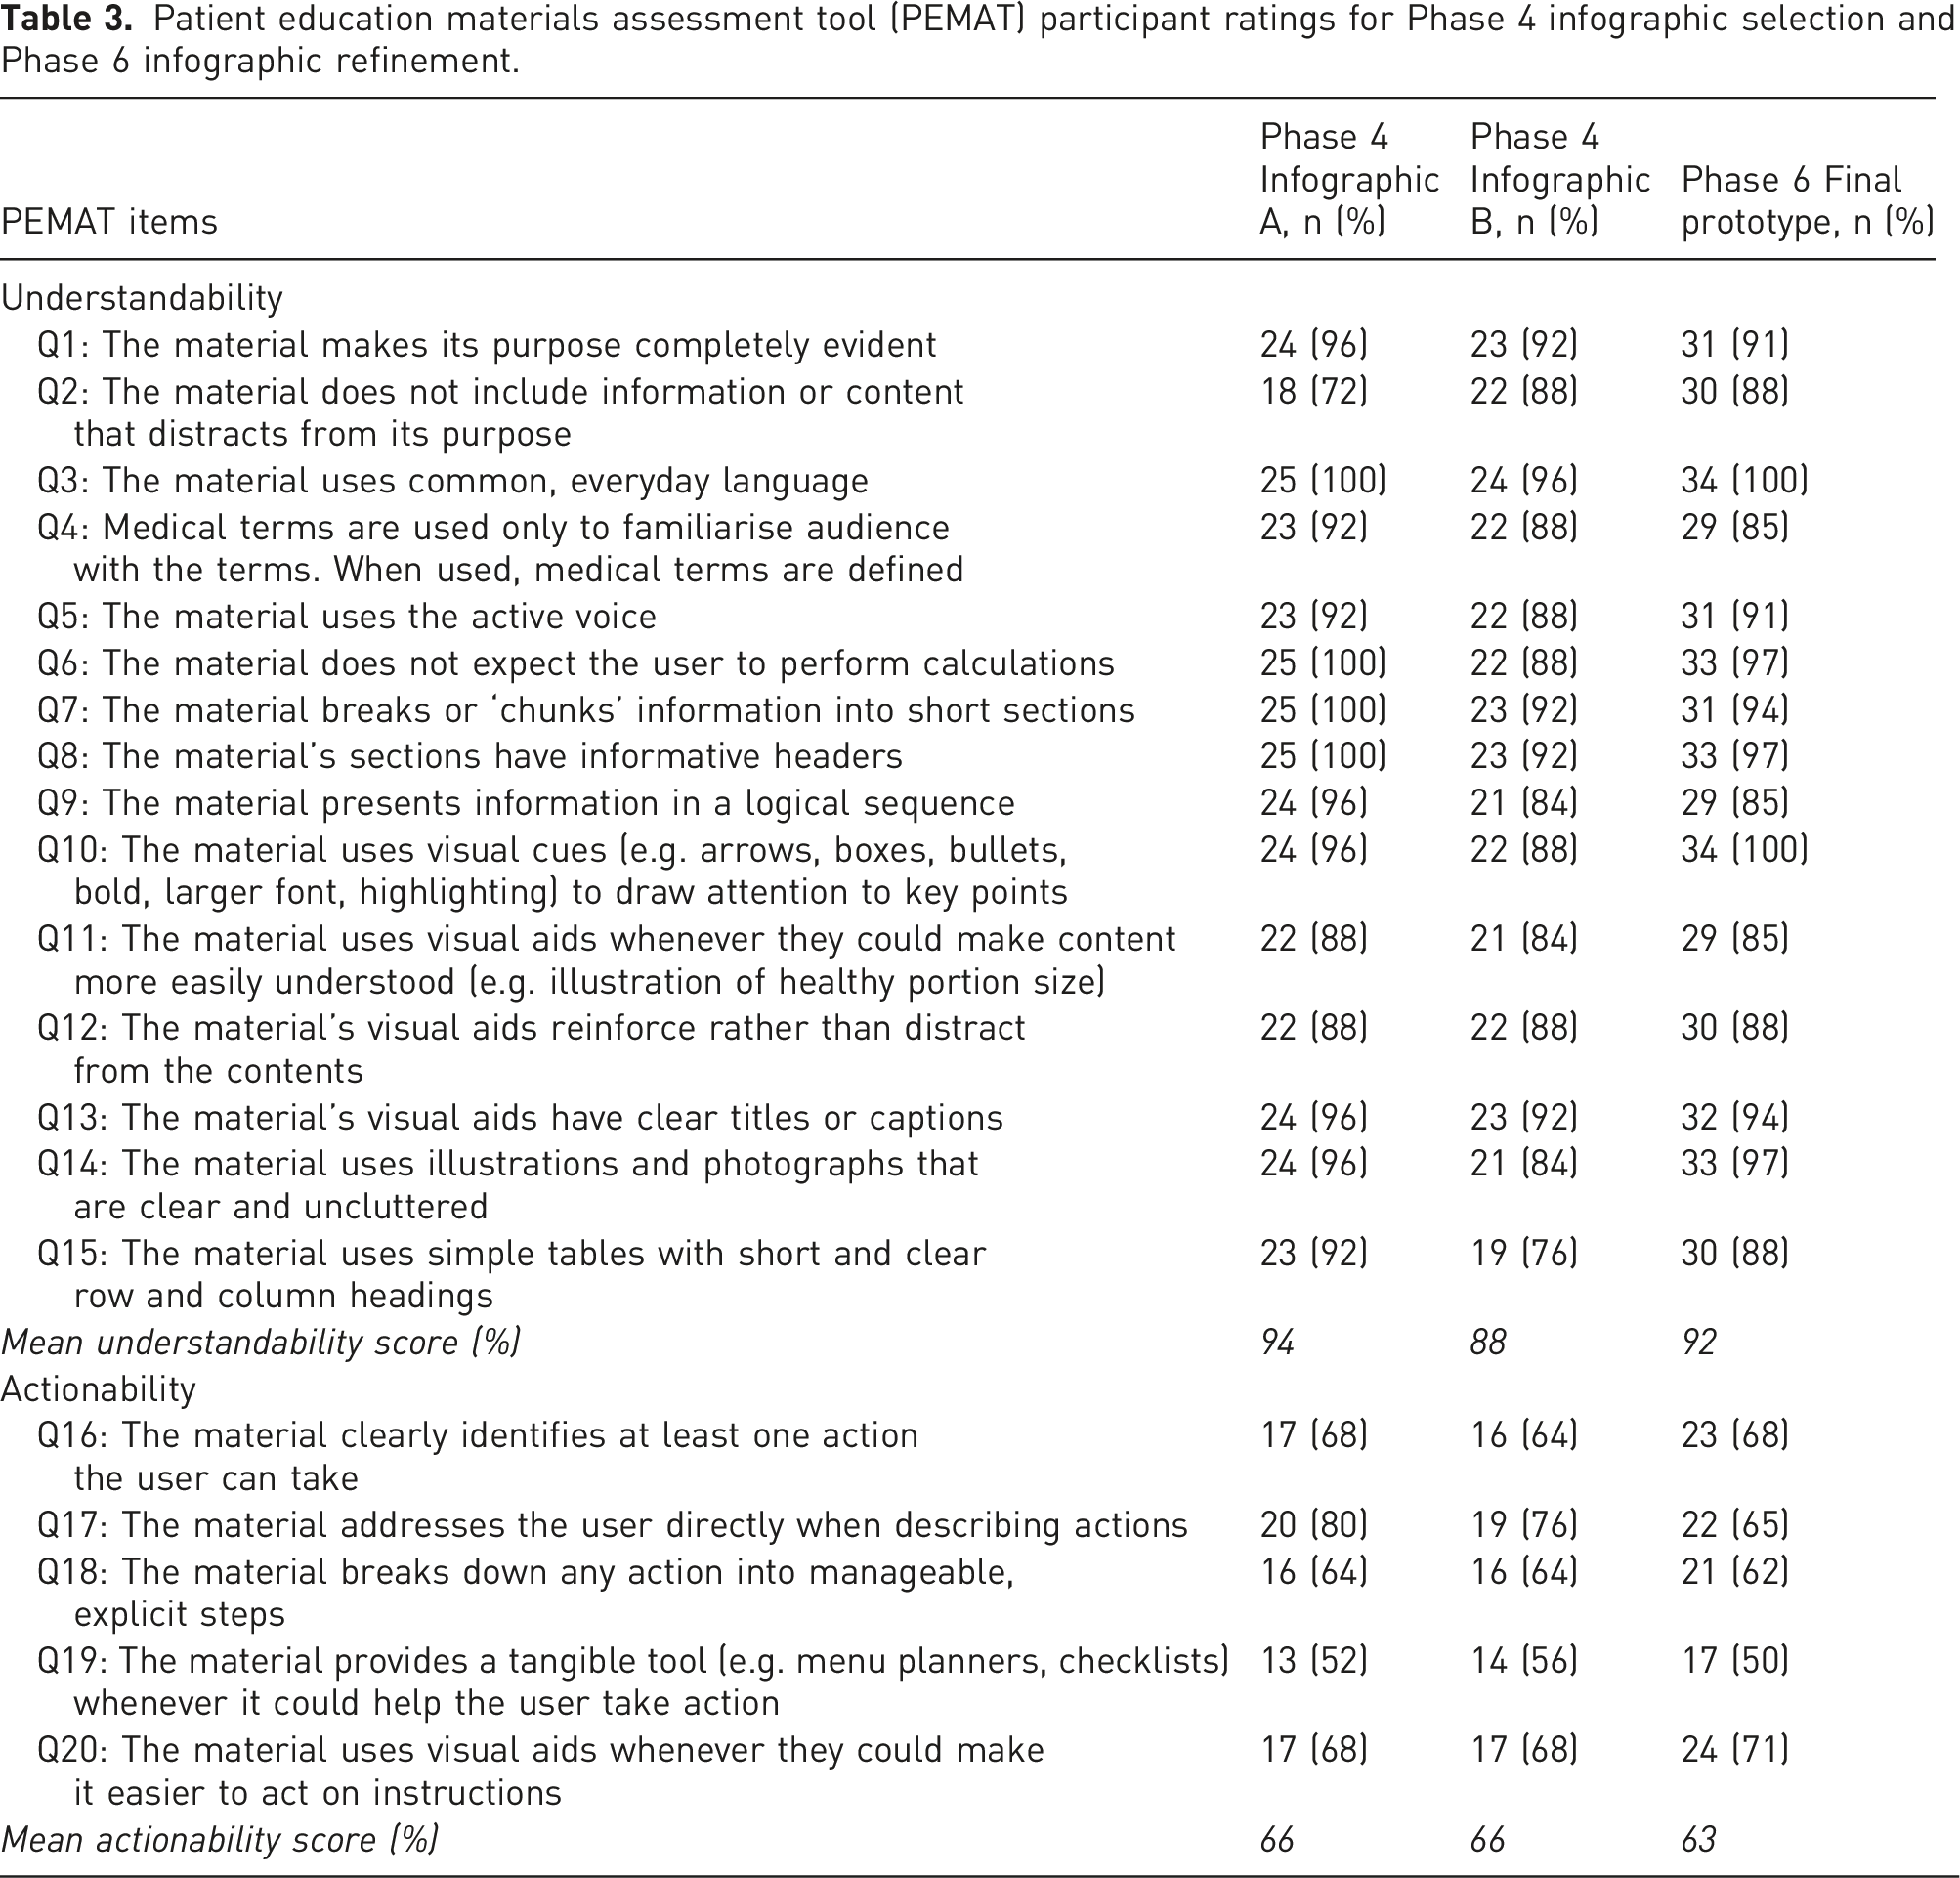
Patient education materials assessment tool (PEMAT) participant ratings for Phase 4 infographic selection and Phase 6 infographic refinement.
Phase 5: Refining the prototype
In response to the PEMAT ratings, consumer feedback and research team discussion, the content and design of Infographic A was iterated with minor changes made to a few icons to ensure relevance to the corresponding text. A statement highlighting the variability of individual experiences with CRPS was added below the infographic title. In collaboration with the CRPS support group (www.burningnightscrps.org) their logo and web link were added to guide consumers seeking more information.
Phase 6: Consumer feedback on the chosen design
The final prototype scored 92% and 63% for understandability and actionability, respectively (Table 3). Further, 93% (28/30) of the participants indicated they would utilise the infographic to share information about the lived experience of CRPS, and 79% (27/34), indicated it would have been helpful to have received this infographic earlier in their experience with CRPS. There was a small increase in participants’ ratings of their confidence in knowledge of CRPS pre- (mean 6.38 (SD 1.9) and post- (mean 6.71 (SD 1.5) survey (p=0.009). As in Phase 4, open-ended feedback related to the potential to add information on signs and symptoms and treatments. Of the Phase 6 participants, 11% (4/34) and 15% (5/34) reported they had taken part in Phase 2 and Phase 4, respectively.
Phase 7: Finalising the infographic
Following a further consensus discussion, some of the images were updated, one quote edited and minor reorganisation of the content was performed. The final design is available in Appendix 1.
Discussion
Building on descriptions of the lived experience of CRPS generated from robust qualitative research,11,14 this project used a participatory design approach to translate this evidence into a trustworthy consumer resource. The online format was an efficient manner for gaining consumer input at different stages of the process. The participants rated the co-created infographic highly for understandability and as a useful resource for sharing accurate information on the lived experience of CRPS. Further work might review the impact and perception of utility of the infographic following broader dissemination.
Core educational concepts for CRPS have been previously identified using an e-Delphi process involving healthcare professionals (n=7) and people with CRPS (n=55). 23 The content included in our infographic aligns well with these educational concepts, specifically those related to the psychological and social sequalae of living with CRPS. The identified core concepts include information on the nature of the disorder and specifics about management options. 23 Although important, these concepts were not a specific part of our remit for the infographic produced here, as we wanted to focus on the lived experience. However, during the participatory design process some participants did comment on the lack of this clinical information in our infographic. We envisage that a similar participatory process could be used to develop trustworthy, complementary educational material on these additional core concepts. While there is a lot of educational material readily accessible for people with CRPS, there are significant concerns about the quality of this material.7,8 Trustworthy material can be co-created (as we have here and others before us 22 ), and the need for more co-created content such as clinical management of CRPS has been noted. 23
Once credible and trustworthy information has been created, helping people navigate to these sources of information needs further consideration. There is a clear role for healthcare professionals here. Provision of education is a key role for managing people with CRPS. 2 However, practice behaviours in this area most frequently include ‘general patient education and support’, ‘facilitation of self-management’ and ‘pain neuroscience education’. 37 Increased emphasis of healthcare professionals to provide guidance to patients and their carers on where and how to access trustworthy information to improve their understanding and support self-management could be useful. Healthcare professionals have the expertise to discern credible resources from those that are less credible. Some healthcare professionals see that helping people navigate through information resources could be part of their role. 38
Clinical relevance
While surveys of healthcare professional practice behaviours indicate education is being provided to people with CRPS,37,38 the messages from this education might not be getting through. People living with CRPS do not necessarily have helpful, relevant and meaningful knowledge about their condition, 6 and continue to express difficulties in finding trustworthy CRPS-specific information.11,12,14 Use of visual methods, including infographics, has been recommended as one pragmatic strategy to improve patient education24,39,40 and may also be a strategy to help combat low health literacy.41,42 Co-creation can maximise relevance and understandability of infographic or other visual materials. Iterative participatory design provides a good foundation for consumer engagement in health,21,28 including co-creation of specific educational resources as demonstrated in this study. As another example, participatory design models are being used widely in digital health.33,43
In terms of the specific infographic produced here (Appendix 1), there are several potential advantages to using this resource in clinical management. People with CRPS report feeling isolated and alone.9–14 Knowing that their individual situation might not be unique, facilitated by sharing common aspects of the lived experience of this disorder selected for relevance by consumers for this infographic, may help reduce some of these feelings. Providing this information in an easily understandable, credible and trustworthy format could improve patient education efforts. Further, people with CRPS might not feel validated by healthcare practitioners.9–14 Clinicians may be able to use this infographic with patients as part of a validation process,
44
assisting with the development of therapeutic alliance. Even though not specifically related to management strategies (for which there is often low evidence anyway),45–47 use of the infographic might set a path for increased understanding and self-empowerment, so the patient might take more control in development of their management plan. However, testing the use of co-created resources like this infographic in clinical practice needs to occur. At the public health level, this infographic could be used by information conglomerate sites knowing that it is a credible and trustworthy resource
The timing of providing this type of information to people with CRPS needs further consideration. People with musculoskeletal pain conditions value a prognosis.48,49 This is difficult for clinicians with an inherently unpredictable disorder like CRPS. The need to carefully consider the provision of ‘truthful’ information while maintaining hope for people with CRPS has previously been highlighted. 14 Most studies point to the desire of people with CRPS to have information earlier rather than later, which can include acknowledgement of the frustration that a delayed diagnosis can cause for people with this disorder.11,14 In the clinical encounter, it might make sense for healthcare professionals to share the co-created infographic produced here when their client first begins to mention some of the issues raised in the infographic content. This might include client reported feelings of isolation, negative impact on relationships, loss of identity, queries about broader support beyond specific treatment options and/or reports of feeling that people don’t understand them and their situation. A framework for clinicians to understand and manage clinical uncertainty has been developed which may be a useful resource for clinicians managing people with CRPS. 50
Potential limitations
While we have used a robust process to co-create an infographic, we did not consider potential age-related or sex-specific preferences that could influence the content or the design preferences of the infographic. Given the relative low prevalence rates of the condition we were happy to include people with CRPS worldwide (Table 1). We acknowledge that the infographic may not be reflective of the experiences of those living with CRPS that reside in countries with different healthcare settings as participants were largely from developed countries. The qualitative studies reviewed for content co-creation11,14 reflected a similar demographic to those who participated in this study. Most participants were female, which does at least partially reflect CRPS seeming to be more common in females.
4
We also endeavoured to include not only people with CRPS but also family and friends as part of
Conclusion
We have outlined a process of consumer engagement in co-creating a health resource for CRPS using an iterative participatory design. Participatory design is likely to be useful in future endeavours to improve our shared understanding of CRPS, and to foster collaboration in genuine co-design of new resources to better support people experiencing CRPS with relevant, credible, accessible and trustworthy resources.
Footnotes
Acknowledgements
The research group would like to thank all the participants involved in the study for their generous contributions in the study and the infographic creation. We would like to thank Burning Nights CRPS Support, CRPS UK and the ‘RSD/CRPS and Neuropathic Pain Syndrome’ Facebook group for their support in disseminating our recruitment flyer to their members. We would also like to thank Djen Frenklin for their work in designing and editing the infographic and all other designers for their contributions.
Author contributions
DB and HS conceived of the study. All authors contributed to the design of the study. DB, YH, JL, BL, AY, SG and HS were engaged in data collection and analyses. All authors contributed to and approved the final draft of the manuscript.
Declaration of conflicting interests
The author(s) declared no potential conflicts of interest with respect to the research, authorship, and/or publication of this article.
Funding
The author(s) disclosed receipt of the following financial support for the research, authorship, and/or publication of this article: This project was partially supported by Curtin University and NHMRC Project Grant (APP1141377).
Ethical approval
Curtin University Human Research Ethics Committee (Approval Number HRE2021-0300)
Informed consent
Written informed consent was obtained from all subjects before the study.
Final infographic design to portray the lived experience of complex regional pain syndrome.