
Abstract
Cardiovascular waveforms such as blood pressure, ECG and photoplethysmography (PPG), are routinely acquired by specialised monitoring devices. Such devices include bedside monitors, wearables and radiotelemetry which sample at very high fidelity, yet most of this numerical data is disregarded and focus tends to reside on single point averages such as the maxima, minima, amplitude, rate and intervals. Whilst, these measures are undoubtedly of value, we may be missing important information by simplifying the complex waveform signal in this way. This Special Collection showcases recent advances in the appraisal of routine signals. Ultimately, such approaches and technologies may assist in improving the accuracy and sensitivity of detecting physiological change. This, in turn, may assist with identifying efficacy or safety signals for investigational new drugs or aidpatient diagnosis and management, supporting scientific and clinical decision making.
Keywords
Introduction
Clear advances have been made in the quantity and quality of patient and research data now available to the biomedical community. In cardiovascular medicine and research, signals form a significant part of this data, where a signal is broadly defined as something that captures an observable change in a quantifiable attribute of a phenomenon, usually over a period of time. Signal analysis comprises a major discipline within data science and can be considered as the process that extracts meaningful information from an input signal, be that a description, an insight into the underlying processes or a prediction of their future state. For any input signal, its analysis typically comprises the application of mathematical techniques to extract appropriate metrics and the subsequent manipulation of these to generate a simplified output, upon which clinical or scientific decisions can be made.
Many physiological signals present visually as a waveform with approximately repeating cycles, as we observe in pulse oximetry, photoplethysmography (PPG), electrocardiogram (ECG) and arterial blood pressure recordings. The collection of such signals is commonplace in intensive and high dependency care settings, but also extends to the community, where wearable devices are increasingly being used for both personal use and remote patient home monitoring. The numerical data that makes up such signals is termed time-series data, where a variable (e.g. pressure in mmHg) is sampled over time. What may not be well appreciated is the high fidelity of numerical data capture now afforded to us by hospital and home devices, which typically collect hundreds, if not thousands, of data points per second. Yet in much of our current analysis, only fraction of these data points are output to the researcher or clinician. For example the systolic blood pressure as the maximum of each arterial pressure cycle or ECG intervals as time between fiducial points on the ECG; these output values are then often further averaged to a single metric. Furthermore, it is increasingly evident that the subtleties of a waveform contain clinically useful information, for example changes in the blood pressure waveform shape can be observed as arteries become less elastic 1 and the second derivative of the PPG signal has been proposed as an indicator of coronary heart disease. 2 By presenting only a handful of output metrics, our current interpretation of these routine signals, does not harness the full potential of the information they contain and may miss physiologically relevant changes. Thus the development of new research methods to enhance signal analysis could better support clinical decision-making.
The historical development of devices to capture cardiovascular signals
The measurement of the arterial pulse has been described in ancient texts including the Papyrus Ebers of ancient Egypt (∼3500 years ago), believing that the ‘heart speaks out to every limb’, whilst ‘pulse diagnosis’ has been practiced for centuries in China as detailed in the Yellow Emperor's Classic of Medicine (∼4600 years ago). 3 These concepts were captured in William Harvey's “De Motu Cordis” in the mid seventeenth century where, through experimental observation, he demonstrated blood circulates around the body propelled by the action of the heart.
The first invasive measurement of blood pressure was in the eighteenth century by the Reverend Stephen Hales. 4 Over the nineteenth century, many researchers worked to establish the basis of the modern-day sphygmomanometer including John Leonard Marie Poisseuille, Carl Ludwig, Karl von Vierordt, Etienne-Jules Marey and Karl Ritter von Basch and Scipione Riva-Rocci.5,6 Frederick Akbar Mohamed illustrated the additive clinical value of one of these early devices (the sphygmograph) in numerous patient groups. 7 In the twentieth century, Peterson and colleagues demonstrated the clinical utility of intra-arterial catheters coupled to a manometer, 8 and further techniques have been described by Peirce 9 and Seldinger. 10
In addition to arterial blood pressure, other important signal measurement includes blood oxygen saturation and the electrical activity of the heart. Stephen Hales also made the first record of central venous catherization in the eighteenth century. 11 A device to measure blood oxygen saturation was first established by Karl Matthes in the 1930s and subsequently Takuo Aoyagi developed the pulse oximeter in the 1970s. 12 As understanding grew around the electrical activity that underpins the function of the heart, work was undertaken to capture this with electrodes placed on the skin. The first human ECG was recorded by Waller in 1887. 13 Einthoven (‘the father of electrocardiography’) subsequently developed the first practical device to capture the ECG in the early 1890s, for which he was awarded the Nobel Prize in 1924, and presented the resulting signal in the form we use today.14,15 Now, in the twenty-first century, rapid technological enhancements have meant that devices capturing high fidelity cardiovascular signals, are routine in both hospital and community settings. Cloud based remote monitoring will become increasingly commonplace as wearable sensors improve in their accuracy, usability and signal to noise ratio. Yet, the current extracted measures (e.g. systolic pressure, ECG intervals, rate and SpO2) only use a small fraction of the available information contained within the signal. Importantly, decades of research have demonstrated that there are manymore metrics that could be extracted.. It is alsoimportant to acknowledge that prospective validation and implemention of such new metrics into clinical practice is a highly challenging task and such metrics must be understandable, acceptable and easy to implement by the intended end users.
How can cardiovascular waveforms give us more information?
We have already touched on how the morphology of a high-fidelity waveform can contain clinically useful information.1,2 Further nuanced information pertaining to arterial stiffness and wave reflections can be derived by measuring blood flow and appraising the shape of arterial waveforms. Well described measures include pulse wave velocity and augmentation index, which have been shown to change in response to aging, disease and drug treatment.16–19
Cardiac interbeat intervals are typically determined from a cardiovascular signal such as ECG or PPG and can be considered a further signal in their own right. Whilst their analysis typically falls under the wide field of heart rate variability (HRV), the clinical potential of two lesser-known methods to analyse cardiac interbeat interval dynamics are described in this special collection. The first method, heart rate fragmentation analysis, quantifies frequent changes in heart rate acceleration that are non-vagally mediated. Lensen et al. 20 retrospectively analysed Holter ECG records adults, and demonstrated that increased heart rate fragmentation was associated with poor survival and was an independent predictor of 2-year mortality. This study illustrates the additive value of measuring non-autonomically controlled changes in beat-to-beat variability, moving beyond conventional HRV analysis. The second method, heart rate characteristics (HRC), refers to a pattern of changes identified in neonatal sepsis comprising reduced HRV coupled with transient heart rate decelerations. In this special collection, Zimmet et al. 21 extended the group's previous studies, and identified a series of risk clusters that are associated with different types of HRC trajectory in very low birth weight infants at risk of ensuing sepsis. This simultaneously demonstrates the potential value of a measure capturing such changes, whilst also supporting the potential for more refined decision making for intensivists who already use HRC.
In addition to beat-to-beat variability, increasing evidence highlights the importance of appraising ECG morphology beyond routine interval and amplitude measures. Deep learning data science approaches have demonstrated it is possible to classify between biologically distinct groups (including age and sex) based on utilising all the ECG waveform data,22,23 and errors in classification may be associated with an increased mortality risk. 24 The appraisal of T wave morphology has also garnered particular interest, for example the T-peak to T-end (Tpe) interval is a metric of the spatial dispersion of repolarization in the left ventricle which, if prolonged, can increase vulnerability to arrythmias, providing a marker of arrhythmic risk and mortality. The Tpe interval is lengthened in patients who are at risk of suffering from torsade de pointes following drug induced QT prolongation 25 and in individuals at risk of sudden cardiac death. 26 Similar measures have been extended to preclinical research, to more sensitively screen out cardiotoxic drugs during development. 27 In this special collection, Ramirez et al. 28 reviewed the utility of various ECG morphology characteristics. Building on their previous work, that demonstrated that characteristics, such as the Tpe interval are heritable, 29 they described a data sciences case study combining various ECG waveform metrics with corresponding genetic data from a subset of UK Biobank participants, and provided a summary of associations between different genetic loci and the behaviour of the cardiac electrical system under exercise stress testing and recovery. 28
Other, less routine, signals also have a part to play in supporting biomedical research, and clinical decision-making. In this special collection, Van Daele et al., 30 described how doppler flowmetry can be used to supplement standard arterial blood pressure measurements, providing greater detail on organ specific adverse effects, when screening compounds during medicines development. Polcz et al., showcased the use of non-invasive venous waveform analysis (NIVA) to assess intravasacular volume status in preclinical porcine models, to quantify the effect of vasoactive drugs. Whilst they demonstrated utility of the method in euvolemic animals, they acknowledged the need for follow up studies in hypervolemia and hypovolemia in order to increase translatability to the intensive care setting. 31 Bartlett et al. 32 described the non-invasive use of doppler waveform analysis and ultrasound derived turbulence intensity ratios, to quantify different flow patterns that are associated with the development of neointimal hyperplasia, which can accompany the surgical creation of arterio-venous fistulae in patients. The authors concluded that further development and validation of such a technique could lead to patient-focussed surveillance programmes to more effectively manage those patients at higher risk of developing outflow stenoses within their vascular access sites, through regular imaging-based surveillance. 32
The challenge of clinical uptake
Whilst such research is demonstrating an the diversity of information that can be extracted from existing cardiovascular signals, much of this is not yet utilised routinely in the clinical setting. A classic example is that of HRV analysis, where a reduction in HRV is often observed to be an unfavourable sign for a patient from foetal stress through to ICU mortality33–36 supporting its value as a clinically useful metric. However, despite a Web of Science search for ‘HRV’ and ‘heart rate variability’ returning more than 58,000 results since 1965, with more than 14,000 of these from the last four years, HRV analysis has a low uptake in many research and clinical settings. 37 The ability to accurately measure and interpret HRV in a real time clinical setting is hampered by various method limitations, inherent assumptions about the autonomic-electrophysiological axis, and the resulting ongoing debate regarding the clinical value and meaning of traditional HRV metrics.38,39
Such challenges are not just limited to HRV. Exemplar signals in textbooks are usually stylised in presentation, making the identification of key points of interest (e.g. PQRST points on an ECG) seem like a relatively simple problem. However, in practice, noise and natural variability mean that accurate and consistent identification of important features on waveforms can be challenging40,41 and automated detection may be prone to error. To overcome this, a more accurate interpretation of noisy signals may require a high level of manual input or oversight, but this can introduce bias into the extracted metrics and is impracticable in a busy lab or clinical environment. Techniques that move away from the identification of specific features may help to overcome this. The Symmetric Projection Attractor Reconstruction method42,43 can encapsulate all the data from any approximately periodic signal, giving an alternative visual presentation from which unbiased metrics can be drawn. Alternatively, the use of deep learning approaches into which we can input high fidelity signal waveforms themselves, can also provide a means of automated analysis.22,44,45
Studies may not be seen to report their methodologies comprehensively and are open to concerns about reliability and reproducibility, 46 and it is key to address this. For example, in this collection, Chivers et al. 47 validated an automated detection algorithm for intervals from the foetal ECG (where both maternal ECG artefact and foetal movement make this a challenging signal to analyse) by compariing againstgold-standard clinical adjudication,. They emphasised the potential for such technologies to allow rapid screening of suspected arrhythmia or to more easily measure cardiac time intervals, in the maternal and child health setting.
Integrating waveform information into clinical decision support systems
We are now entering an age where ‘big data’ proliferates, at both patient and population level. Multiple physiological signals can be captured concurrently from individuals at high fidelity, and large datasets abound in research studies,22,44,45 with repositories such as Physionet 48 and UK Biobank, 49 available to biomedical researchers. The enhanced information that we can obtain from cardiovascular signals can be combined with other data (serology, imaging, clinical observations, genomics), providing large multi-centre datasets. Such datasets have contributed towards the explosion of data-driven research and subsequent development of clinical decision support tools (machine learning assisted diagnostics). Well known examples include risk prediction models such as the Framingham Risk Score and QRISK along with emerging risk scores for ICU settings.50,51 Such models aim to facilitate prediction of acute events, optimisation of treatment or to expedite primordial prevention strategies. 52 However, these are not without limitations 53 and, as we noted above, wider prospective validation is still required for many of these models, meaning that successful clinical implementation, whilst feasible, 54 is still rare.
To develop trust in such predictive or diagnostic systems requires meaningful engagement with end users, empowering them to critique methodology, acknowledge limitations, assumptions, relevance and potential benefits. 55 There is also a growing recognition that such research often presents methodologies that are biased to certain populations, so it is important to highlight that data gaps exist in many existing predictive models. If left unchanged or unchallenged, this can compound existing inequalities or fuel unsubstantiated conclusions drawn on insufficient evidence.
For example, sex and gender differences exist in symptoms and prevalence of cardiovascular disease, response to treatments and overall patient outcomes. 56 There has been an historical predominance of men in cardiovascular clinical trials, although this is gradually equalising in areas such as heart failure and stroke. 57 Sex differences in the PR intervals and precordial amplitudes of the ECG were described as early as the 1960's.58,59 More recently, sex and age differences in the morphology of the entire ECG waveform have been confirmed in larger populations using deep learning approaches.22–24 Black adults are under-represented in cardiovascular disease trials, meaning that reported therapeutic effects, pharmacokinetic profiles or adverse drug reactions may be limited in their relevance when extended to the wider heterogeneous patient population. 60 Skin tone has been shown to affect oxygen saturation readings from pulse oximeters, overestimating values in those with darker skin tone,61,62 whilst skin structure, which may change with aging, can also impact a PPG waveform. 63 Such examples demonstrate that incorporation of routine physiological waveform data into machine learning assisted diagnostics, must be transparent about model limitations, where such data gaps or inaccuracies exist. Scientific and clinical communities must also acknowledge the clear social determinants of cardiovascular disease, management and outcomes, 64 although these will be harder to encompass into objective machine learning models. There are obvious challenges to translate these types of analytical technique from research to the clinical setting, but progress is being made. cknowledging the need to develop more personalised approaches to diagnosis and treatment, is of paramount importance.
To overcome the barriers of clinical uptake, it is essential that any techniques developed for the analysis of physiological signals are accepted by both clinical practitioners and analysts, and so must be easily comprehensible, efficient to implement, and validated in real world settings. In parallel, early public, patient and end user engagement is necessary and is increasingly prioritised by research funders, but needs to be performed and evaluated in a meaningful manner. 65
The difficulties encountered in making more effective use of existing data and translating research findings into usable tools for clinicians and patients, is by no means a new problem. We end by joining Frederick Mahomed, a physician at Guy's Hospital, London, in 1872, when he had started promoting the use of a non-invasive device, the sphygmograph, that visually displayed arterial pulse waveforms. Excited by the potential value of this additive data, he wrote
66
: “Ever since the art of healing has been practised, the pulse has been one of our two most prominent symptoms…..this index of the centre of life has been the advisor of the Physician or the Surgeon; no remedy is administered, no operation performed without consulting it. That silent tale-bearer tells us how life is ebbing or flowing in our patient; whether that wonderful organ, whose never ceasing action is so necessary to life, tires or faints at its work; whether it requires assistance, and when that assistance has been given, whether life or death will be the result….”
He went on to describe the potential superiority of the semi-quantitative sphygmograph outputs in being less error prone, when compared with more qualitative physical examination of the pulse – a key aspect of achieving acceptance for our modern-day implementations - “The pulse ranks the first among our guides; no surgeon can despise its council, no Physician shut his ears to its appeal. Since then, the information which the pulse affords is of so great importance and so often consulted, surely it must be to our advantage to appreciate fully all it tells us, and to draw from it every detail that it is capable of imparting. Our sense of touch, however highly educated, is manifestly liable to error, and it is to our more reliable sense, that of sight, we appeal, when possible for confirmation. It is by the aid of this more accurate sense we should study the pulse in its marvellous changes of character and form, as recorded by the sphygmograph.
Finally, he reflected on the limited implementation or knowledge of the technique amongst clinical peers, a problem that we still face today: This instrument, though it has now been used in England for several years, has not yet received the general attention which its great value demands…”
The Physiology and Clinical use of the Sphygmograph Mahomed, F.A Student of Guy's hospital. Medical Times and Gazette 66
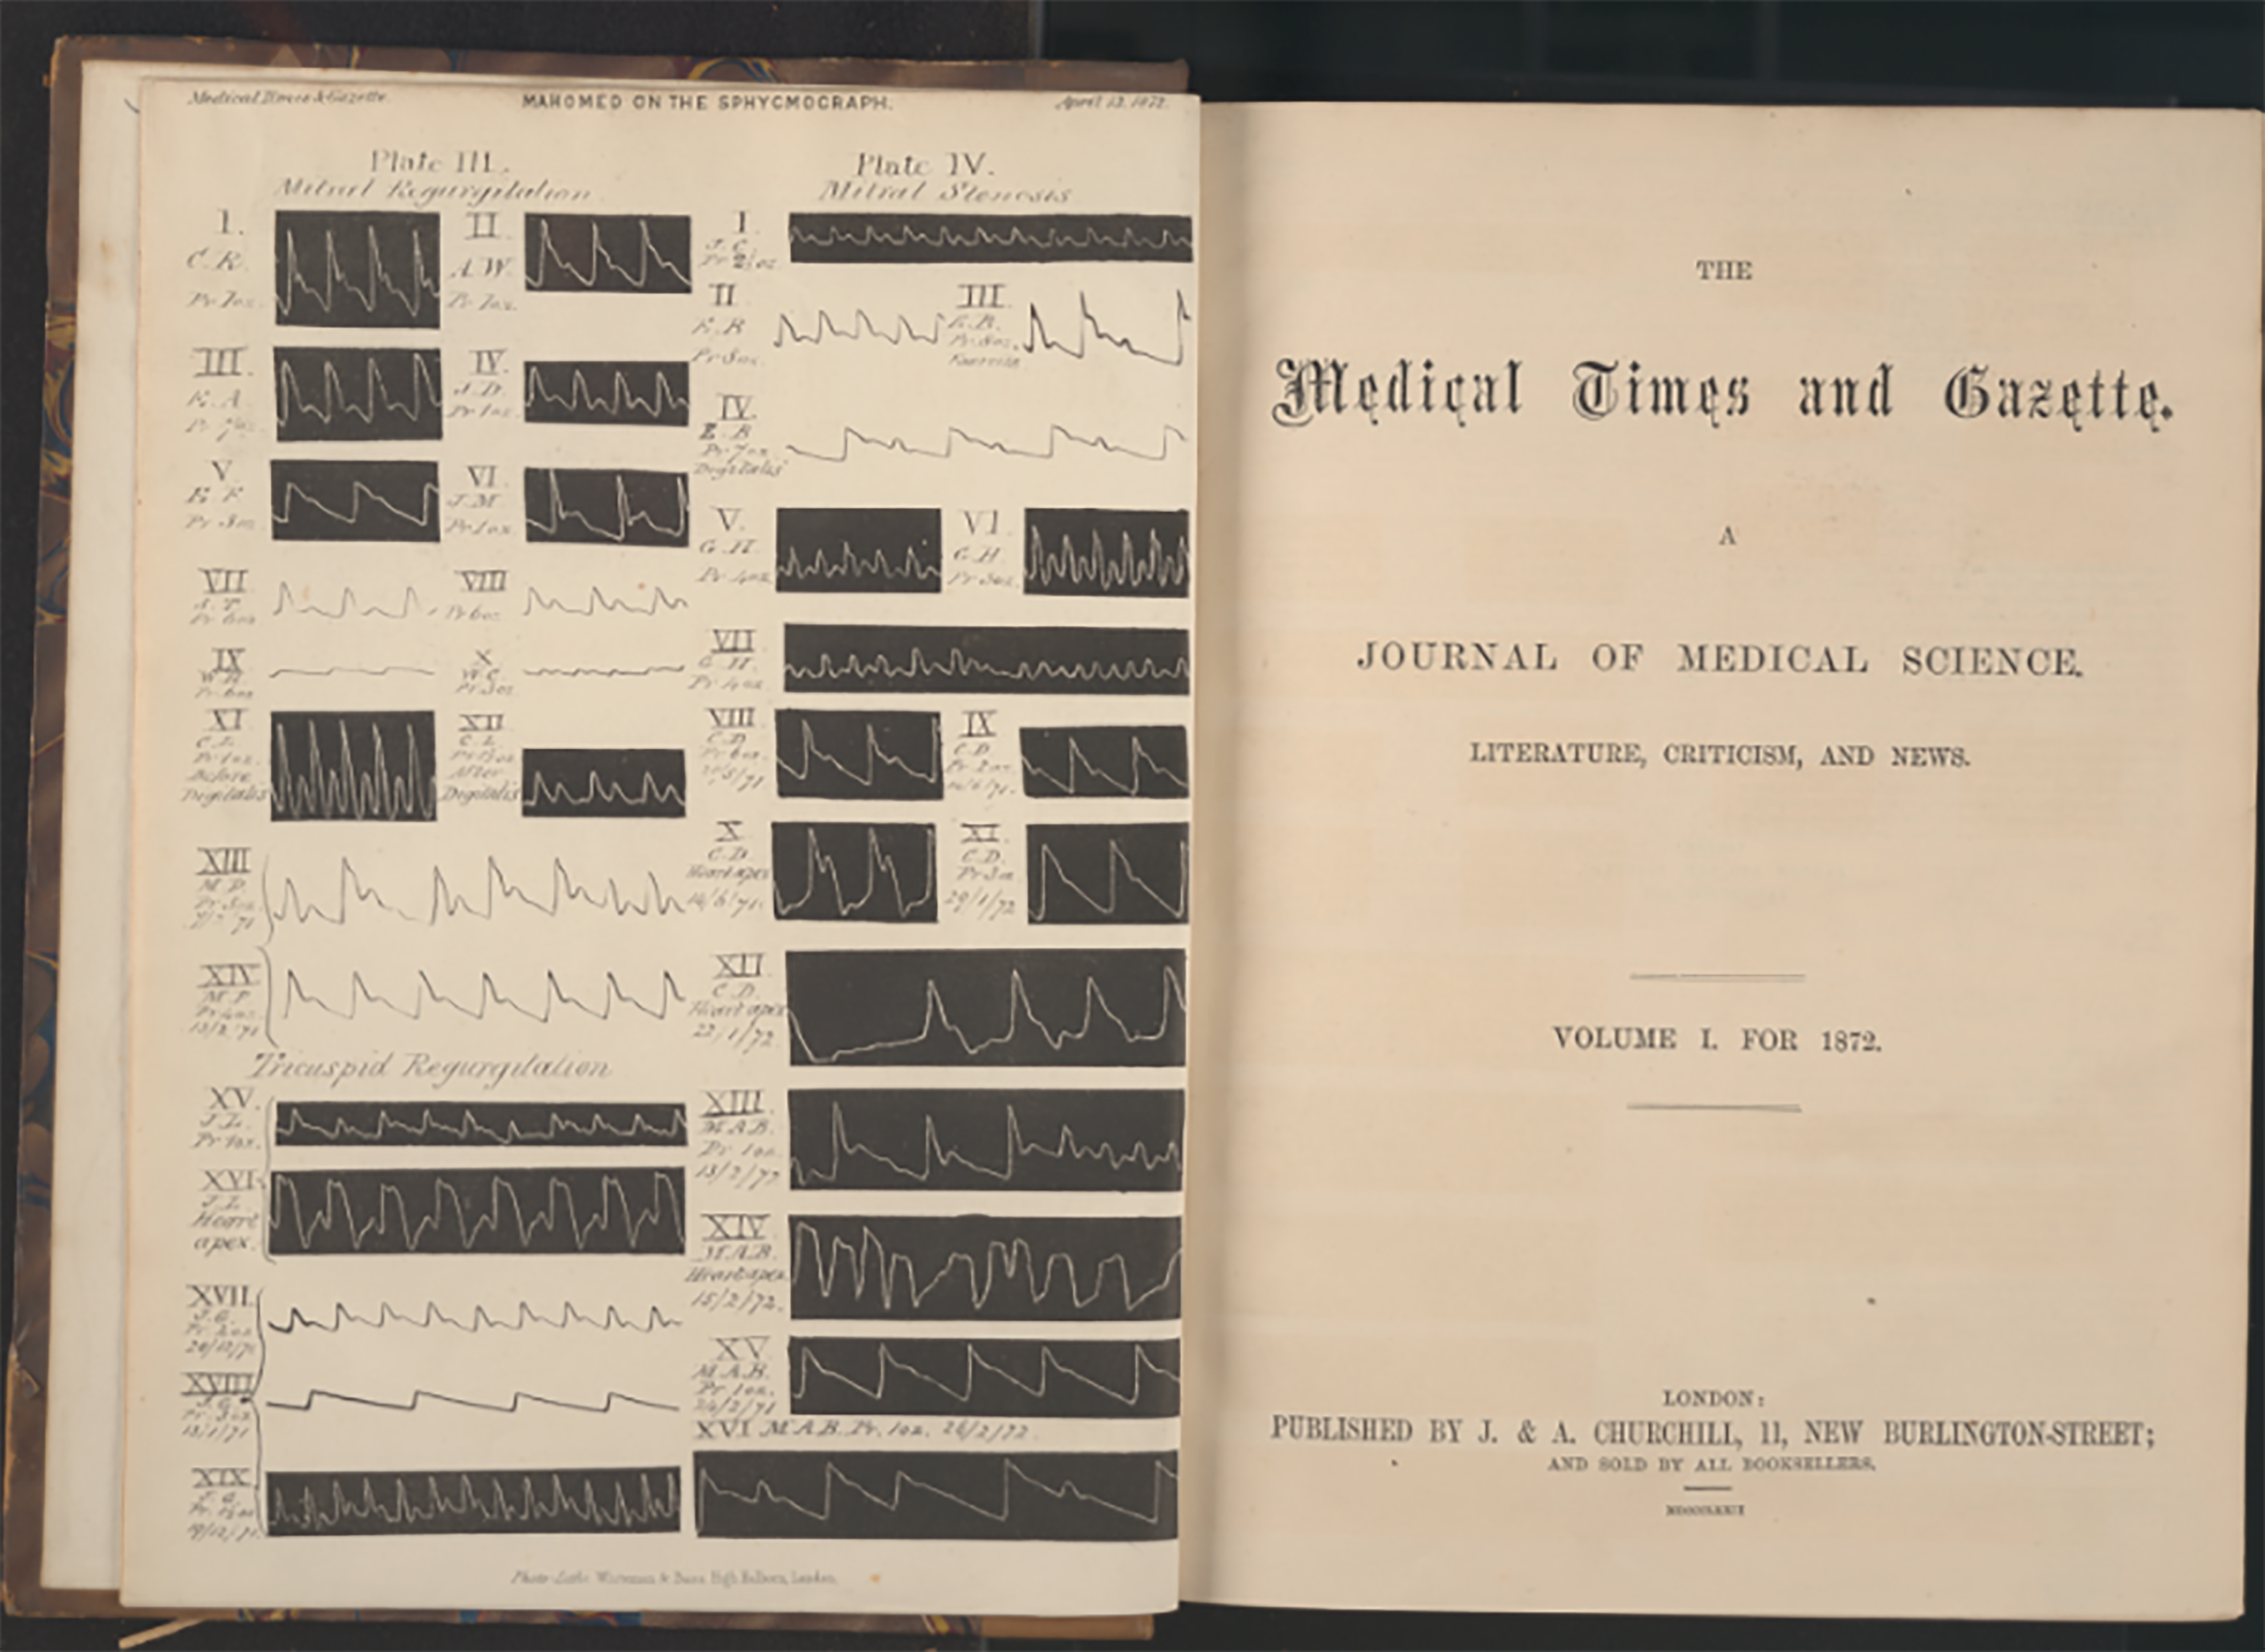
Medical Times and Gazette 1872 cover page illustrating waveforms collected by the sphygmograph (F.A. Mahomed). Courtesy of King's College London, Foyle Special Collections Library.
This historical vignette summarises the aims of this special collection which introduces methods and advances in how cardiovascular signals can be appraised to provide new or more nuanced clinically useful information, to better support biomedical research, patient risk stratification and personalised care.
Footnotes
Declaration of Conflicting Interests
The author(s) declared no potential conflicts of interest with respect to the research, authorship, and/or publication of this article.
Funding
The author(s) disclosed receipt of the following financial support for the research, authorship, and/or publication of this article: Author MA is supported by the HEE/NIHR ICA Programme Pre-doctoral Clinical Academic Fellowship, (grant number NIHR301095).