
Abstract
Purpose
Two-dimensional perfusion angiography is a new method to quantify and evaluate tissue perfusion during endovascular intervention. The aim was to evaluate time-patterns and dynamics of contrast arrival and distribution before and after endovascular intervention in patients with critical limb threatening ischemia.
Methods
Data were collected from 37 patients with critical limb threatening ischemia due to infra-inguinal occlusive disease having a successful endovascular procedure. two-dimensional perfusion angiography was used as a post-processing software with analysis of numeric parameters related to arrival and distribution patterns of contrast.
Results
Thirty-three patients were successfully analysed whereas four patients were excluded due to motion artefacts. All patients were successfully treated with recanalization of the superficial femoral, popliteal, below the knee-vessels or a combination. Short-term improvement at 30-day follow-up was noted both clinically and by ankle-brachial index and toe pressure measurements. A significant reduction in contrast arrival time between pre-and post-angioplasty runs was noted as measured by arrival time median 3.2 and interquartile range (2.5–4.2) vs. 2.6 (1.6–3.4) and time-to-peak 4.1 (3.6–5.0) vs. 3.1 (2.3–3.9) p = 0.009. An increased wash-in rate was also observed 18.3 (12.6–21) vs. 30.1 (22–30.5) p = 0.001 between pre-and post-angioplasty runs.
Conclusions
The use of perfusion angiography for evaluation of foot-circulation during endovascular interventions provides new information regarding quantitative assessment of contrast inflow before and after endovascular intervention without the need for extra contrast or runs. No selective catheterisation is necessary. The technique is easily adopted in a clinical setting. Further studies are necessary to create robust clinical endpoints.
Introduction
Critical limb threatening ischemia (CLTI) is frequently treated by means of endovascular therapy and recommended as a first-line strategy in many clinical situations. 1 The results from treatment of femoro-popliteal and below the knee arteries with percutaneous transluminal angioplasty (PTA) are usually evaluated by digital subtraction angiography (DSA) at the time of intervention to determine the result. This technique just provides anatomical information since only the macro-circulation, which includes the main arteries and collaterals, is evaluated. CLTI also involves deficiencies at the microcirculatory level with impaired capillary flow and oxygen delivery as a result. An impaired microcirculation is of particular importance in arterial diabetic disease. To further measure and predict outcome after leg revascularisation functional methods are currently being developed. The imaging modality needs to be fast, dynamic, safe and readily accessible at the intervention. Current available techniques include transcutaneous partial pressure oxygen monitoring (TcPO2),2,3 single tissue oxygen saturation (Sto2), 4 hyperspectral imaging (HIS), 5 indocyanine green angiography (ICG),6,7 Spect/PET, 8 laser Doppler technology 9 and recently presented hydrogel sensors that are injected into the skin. 10 These techniques are suitable to assess functional level of perfusion rather than the macrocirculation but not so easy accessible at the time of intervention.
Perfusion angiography is a novel X-ray imaging technology using the time-density curves generated during the first pass of contrast agent. Two-dimensional perfusions images are derived from standard DSA-runs of the foot. The aim of the present study was to assess time-patterns and dynamics before and after endovascular intervention of stenoses or occlusions in the femoro-popliteal and/or infra-popliteal vessels.
Methods
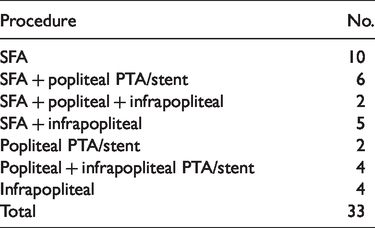
This single-centre study was designed as a prospective, non-randomised feasibility observational study. Patients with CTLI according to the European second consensus document 11 were included and classified according to Rutherfords criteria. 12 Both ankle-brachial index (ABI) and toe-brachial index (TBI) were measured before intervention and at 30-day follow-up (Table 1). All patients were treated in an angiography suite under local anaesthesia. The material consisted of selected patients with target lesions in the femoro-popliteal segment and/or below-the-knee vessels or both of these locations (Table 2). In patients with long occlusions in the femoro-popliteal or popliteal segments, additional endovascular treatment was added at the discretion of the interventionist. The first angiographic run used for 2D-perfusion was performed directly after an antegrade puncture in the common femoral artery (CFA) and placement of a 6F sheath. The second run was made in conjunction with completion control after angioplasty ± stenting, with contrast injection also in the CFA. All patients had paired angiographic runs for 2D-evaluation. In four patients, motion artefacts made the 2D-perfusion measurement inconclusive and were not included in the study.
Demographics and clinical characteristics.

aRutherfords classification CLI.12
Endovascular procedures.
Ethics
This pilot study was approved by the ethics committee at Lund University (Dnr 2016/924). All patients gave written consent to inclusion in the study.
DSA protocol
The foot was strictly immobilised, and lateral projection DSA (Phillips Allura XPER FD20, Philips Healthcare, Best, The Netherlands) of the foot was performed. The angiography was performed according to standardized protocol which uses 10 ml of iodixanol (140 mg I/ml, Visipaque, GE healthcare, Oslo, Norway) at a rate of 5 ml/s in the femoral 6F introducer. The delay for contrast arrival and starting points for contrast arrival was accounted for by manual calculation. The frame rate was three frames per second, and the field of view is 31 cm. All series were collected during a 20-s run. No vasodilatation was used.
Post DSA image analysis
The software for post-processing was provided by Philips Healthcare, Best, the Netherlands and performed on a 2D-perfusion enabled workstation (Interventional Workspot R1.0.1 Philips Healthcare, Best, the Netherlands). The characteristics of how the pixel intensity changes over time were measured, and signal intensity curve (SIC) was generated. The software condenses a sequential series of DSA-images into a single 2-D colour-coded map. Regions of interest (ROI) was manually created and centred between the tibio-talar joint and the midtarsal region including part of the calcaneus with the aim to include the posterior tibial and dorsal pedal artery. The software subsequently automatically creates an identical ROI in the post-angioplasty run. Density values were calculated for each pixel of the DSA-images of the entire run pre and post angioplasty. SIC for arrival time (AT), time to peak (TTP), mean transit time (MTT), wash-in rate (WI) and area under the curve (AUC) were recorded. The perfusion data were analysed after the procedure. AT (s) reflects the inflow-time from contrast-injection to the target. TTP (s) measures time from arrival of contrast to maximal density. WI measures upward slope of pixel intensity change, MTT (s) records time to reach centre of gravity and AUC the total accumulation of density values, i.e. blood volume. No comparisons were performed between different target lesion procedures or different ROI over the foot. Both patients with stenotic or occlusive lesions were included.
Statistics
Continuous data were calculated as the mean ± standard deviation as well as median with interquartile range: 25th and 75th percentile and presented as absolute values. Test for normal distribution was performed using Shapiro–Wilks test. Comparisons between pre- and post-angioplasty data were performed with Wilcoxon signed rank test. The threshold of statistical significance was a p-value of <0.05. Statistical analyses were performed with Statview 5.0.1 (SAS Software, North Carolina, USA).
Results
Thirty-three patients were successfully analysed whereas four patients were excluded due to motion artefacts and were excluded from further analyses. All patients were treated under local anaesthesia. Demographics and risk factors are presented in Table 1. All patients were treated with successful recanalization of occlusions in the superficial femoral, popliteal, below knee- vessels or a combination of these (Table 2). Completion angiograms demonstrated successful treatment of target lesions in all patients as defined by ocular inspection. No patients had clinical deterioration or major amputation at 30-day follow-up. Both ABI and TPI were significantly improved at 30-day follow-up (Table 3). 2D-perfusion measurements were successfully performed before and after endovascular treatment in all 33 patients. The 2D-perfusion series did not interfere with the procedure, and no extra runs or contrast were used in order to obtain perfusion values. No clinical decision making was performed on-table based upon the values received.
ABI and TPI before and after intervention (mean ± SD).

A significant reduction was noted between mean AT and mean TTP between pre-and post-angioplasty, AT median 3.2 and IQR (2.5–4.2) vs. 2.6 (1.6–3.4) p = 0.007 and TTP 4.1 (3.6–5.0) vs. 3.1 (2.3–3.9) p = 0.009 (Figure 1(a) and (b)). A significant increase in WI was also demonstrated after angioplasty 18.3 (12.6–21) vs. 30.1 (22–30.5) p = 0.001 (Figure 1(c)). MTT was significantly reduced after angioplasty 4.4 (3.8–5.1) vs. 3.4 (2.7–4.7) p = 0.008 (Figure 1(d)), and AUC remained unchanged (Figure 1(e)). Assessment of the generated time–density curves identified several patterns of contrast arrival as well as patterns of diffusion of contrast. In most patients, a shorter time of AT as well as TTP was identified after intervention. An increased peak value of density was also seen (Figure 2(a)). In three patients, a significant delay of density wash-out combined with accumulation of density was seen before intervention (Figure 2(b)). This was associated with a large variation of TTP, MTT as well as AUC in pre-angioplasty runs in these three patients.

(a–e) Box and whisker plot demonstrates SICs before and after angioplasty. The horizontal line in the middle of each box represents the median value, the top and bottom borders of each box mark the 75th and 25th percentiles and the whiskers mark the highest and lowest values.

(a) Perfusion angiography after and before endovascular intervention with ROI. Density curves demonstrate a significant increase of density, a shorter AT and also a more rapid washout after SFA and anterior tibial artery recanalization. Violet curve represents before intervention and white line after intervention; (b) perfusion angiography after and before endovascular intervention with ROI. A continuous and ongoing accumulation of density is observed before intervention. After recanalization of popliteal artery and PTA of proximal anterior tibial artery a shorter arrival time and a more rapid wash-out is noted. Violet curve represents before intervention and white line after intervention.
Discussion
This study used a protocol for perfusion angiography and demonstrated a correlation between improved perfusion as measured by measured parameters (AT, TTP, WI and MTT) after successful angioplasty. In this study, a standardized infusion of contrast was performed through an introducer in the groin as described by Murray et al. 13 In a pioneering study by Reekers et al.,14,15 contrast was injected in a catheter placed in the mid popliteal artery before and after intervention to the infra-popliteal vessels. The advantage of only injecting in the popliteal vessels would be to isolate the influence of infra-popliteal vessels e.g. the angiosome concept whereas injection in the groin introducer measures the complete procedure including superficial and profunda femoral artery and popliteal artery influence before and after treatment.
Measuring local tissue perfusion is useful since adequate delivery of oxygen and nutrients to the capillary bed are critical for wound healing. With the perfusion angiography technique used in the present study, it was possible to further explore the time frame of contrast-arrival and accumulation before and after successful angioplasty. Several imaging-techniques have been developed for non-invasive measurement of tissue perfusion and include both computed tomography, magnetic resonance-based and DSA. The main indication has been for stroke-monitoring, tumour-evaluation and heart-myocardial perfusion at tissue level.16,17 Traditional methods to evaluate the circulation are based on evaluation of the macro-circulation using anatomical imaging and different pressure-measurements. Unfortunately, these methods only show and measure blood flow in the main arteries. Tissue perfusion is the basis for delivery of oxygen and nutritional elements and is the basis for healing ischemic wounds. Perfusion is originally defined as flow per unit tissue mass (ml/min/g) and has to be differentiated from flow (Q) which is defined by volume/time (L/min). Tissue 2D-perfusion offers additional functional data in the target tissues from DSA runs. The measurements reflect the change in contrast per pixel, which corresponds to a region (ROI) as a whole not only the larger arteries. By tradition, a successful peripheral intervention has been characterized by an open vessel and a rapid ‘blush of contrast’. This means an inter-observer and intra-observer variation without robust quantification. With growing interest in targeted interventions including both angiosome (direct) and non-angiosome (indirect)-based therapy, a clear need for assessing perfusion at tissue level arises. 18 The method also has to be readily available at the time of intervention to facilitate in on-site decision making. The goal in all interventions for CTLI is to re-establish an adequate pedal perfusion ensuring adequate oxygenation and exchanges of metabolites. DSA is only an indirect diagnostic modality of perfusion at the capillary level; however, with the addition of 2D-perfusion, a much more detailed picture is obtained. This includes not only arrival of contrast but also the volume flow through relevant ROIs indirectly describing the distribution in the microcirculation.13,14 Several perfusion-parameters were evaluated with the software on a completion basis, but no comparisons were made between fem-pop or crural interventions. AT as well as TTP demonstrated a significant reduction after intervention. In some of the cases with very low flow before intervention (Figure 1(b)), a long TTP was observed. In two patients with very severe ischemia, a very low TTP was observed and was combined with a very low AUC. This was also observed by Murray et al.,13,19 and this means that isolated parameters have to be interpreted with care. A significant increase in WI was noted after intervention indicating a faster contrast arrival after intervention. No significant change was noted in the AUC after intervention. The same pattern was observed concerning the MTT. One would probably have expected a significant increase in the AUC after intervention as has been observed in previous studies;13–15,19 but as noted in Figures 1(e) and 2(b), the values were very high in some patients at the beginning indicating a continuous accumulation of contrast. The same pattern was also observed by Kim et al.20 and might be attributed to poor outflow and subsequent limited washout of contrast. This is also noted in the large variation of WI indicating an ongoing accumulation of density. This might be due to increased endothelial leakage and/or decrease in flow in the microcirculation and was also observed by Jens et al. 14 in some patients. All time-density curves were also analysed visually. In most patients, a clear pattern was delineated before and after intervention. This included a rapid and steady increase in the time-density curve clearly different from the initial run. An example is shown in Figure 2(a). The colour-coded signal function also allowed for a direct visual comparison of contrast accumulation. A concern with the present method is the long exposure time combined with sensitivity for motion artefacts, and in this study, four patients were excluded due to this. It is extremely important to have the foot completely immobilized during the angiographic run, and thus, only fully cooperative patients were included in the study. Our study was designed as a prospective observational study with the aim of measuring several values from the time-density curves without the objective to compare with the clinical course e.g. establishing cut-off values in defining a successful intervention. No further intervention was performed after the last perfusion angiography, and thus no decision-making was based on the perfusion angiography results. However, the next step will be to establish firm values which will assist in on-table decision and clinical validation. The advantage with the current technique is that it is readily available during the procedure without need for further contrast-runs or extra equipment. To further help in establishing cut-off values, it might facilitate to add measurement of tcpO2 or oxygenation 4 and compare with perfusion angiography-values. As described by Reekers et al.,14,15 the ROI was established in a standardized matter and not at the area of the ulcer. Perfusion angiography itself cannot describe the local ischemia or improvement at a potential ulcer but rather the perfusion in the region measured as a whole. The contrast used was iodinated, non-ionic and diluted to 140 mg iodine/ml as always used in our clinical practice for leg intervention. In other studies, a concentration of 320 mg iodine/ml was used. The use of diluted contrast is of particular interest in this category of patients who often has impaired renal function. Despite the use of diluted contrast, no problems with interpreting the perfusion angiography curves were encountered. The focus in our study was to investigate the possibility of further information from our standardized interventional practice without additional contrast, angiographic runs or additional pharmacologic agencies. However, a very careful standardization is necessary while performing the perfusion angiography.
Conclusion
Using 2D-perfusion for evaluation of foot-circulation during endovascular intervention offers new information regarding the quantitative assessment of contrast inflow. Our protocol consists of a technique with contrast-injection in the groin-introducer in all patients without need for extra contrast or angiographic runs. Significant changes of perfusion dynamics of possible clinical relevance were found after successful endovascular treatment indicating an improved limb-perfusion. The method is easily adopted in a regular clinical setting, and no additional equipment is needed apart from dedicated software. Further studies are necessary to create robust endpoints, ideally using comparisons with clinical outcome and other parameters such as TCO2 measurements.
Footnotes
Acknowledgements
Håkan Pärsson and Hans Lindgren are partly supported by research grants.
Declaration of conflicting interests
The author(s) declared no potential conflicts of interest with respect to the research, authorship, and/or publication of this article.
Funding
The author(s) disclosed receipt of the following financial support for the research, authorship, and/or publication of this article: The study was supported by The Gorthon foundation, Helsingborg, Sweden. The software analysis tools were provided for free from Philips Healthcare, Best, The Netherlands.