
Abstract
Background
Nationally, ischemic heart disease mortality has declined significantly due to advancements in managing traditional risk factors of hypertension, diabetes, hyperlipidemia, smoking, and obesity and acute intervention. However geographic disparities persist that may, in part, be attributed to environmental effects.
Methods
Ischemic heart disease age-adjusted mortality were obtained from the CDC database for years 1999 through 2014 by county, gender, race, and Hispanic origin for the Central Valley of California.
Results
There was an increase in mortality from north to south of 14.9 (95% CI: 8.0–21.9, p value <0.0001) in time period 1, 7.9 (95% CI: 0.8–15, p value <0.05) in time period 2, and 9.2 (95% CI: 4.0–14.3, p value <0.001) in time period 3. In time period 1, the ambient particulate matter ≤2.5 micrometers (PM2.5) level increased from north to south by 0.84 µg/m³ (95% CI: 0.71–0.96), in time period 2 there was a 0.87 µg/m³ increase (95% CI: 0.74–1.0), and a 1.0 µg/m³ increase in time period 3 (95% CI: 0.87–1.1). PM2.5 level was correlated to IHD mortality in all time periods (Period 1 r2 = 0.46, p = 0.0001; Period 2, r2 = 0.34, p = 0.008; Period 3 r2 = 0.51, p value <0.0001).
Conclusion
Continued declines in ischemic heart disease mortality will depend on the concerted efforts of clinicians in continuing management of the traditional risk factors with appropriate medication use, acute interventions for coronary syndromes, the necessity of patient self-management of high risk behaviors associated with smoking and obesity, and the development of coordinated actions with policy makers to reduce environmental exposure in their respective communities.
Introduction
Ischemic heart disease (IHD) is a common and costly condition that is showing a steady decline thought to be explained by a decrease in coronary atherosclerosis due to improved primary and secondary prevention and acute intervention.1–3 The American Heart Association Executive Summary for 2016 noted a reduction of 28.8% from 2003 to 2013; however, it still accounted for 30.8% of all deaths, or 1 of every 3 in 2013. 4 National trends in mortality have shown a steady decline; however, rates still show geographic disparities. Vaughan estimated age-adjusted mortality of disease of the heart for 3099 United States (US) counties between 1973 and 2010 and found significant differences in decline of mortality between races, gender, and geography. They suggested that differences in diffusion of risk management and acute intervention efforts were the cause. 5 Gillum et al. analyzed age-adjusted coronary heart disease death rates comparing European Americans to non-Hispanic African-Americans in the US between 1999 and 2007. They found persistent disparities in the level and rate of decline between the two races and by geography. They attributed the differences to the classic risk factors of a diet high in saturated fats, elevated serum cholesterol, blood pressure, diabetes, and smoking. 6 Leigh et al. reviewed the recent literature in ethnic minorities coronary heart disease disparities and found much of the differences to be attributed to the persistent gap in socioeconomic status and health care system-level factors. 7 In the Harvard Six Cities study, a study of a cohort of adults followed prospectively beginning in 1974 for 14–16 years, Dockery et al. and later in a follow-up extension, Laden et al. found that cardiovascular disease mortality was positively associated with ambient particulate matter of size ≤ 2.5 µg/m3 (PM2.5) air pollution.8,9 Pope et al. corroborated this finding in the American Cancer Society study of a cohort of 552,138 adults with a seven-year follow-up who were assessed for risk of death from cardiopulmonary disease in 151 US metropolitan areas. They found that an increase of PM2.5 of 10 µg/m³ was associated with an 8–18% increase in CVD mortality. 10 More recently Di et al. estimated the risk of over 60 million Medicare beneficiaries and found significant adverse effects related to air pollution exposure, particularly in racial minorities and those of low income. 11
The Clean Air Act, first established in 1970, and amended in 1990, identified two types of ambient air quality standards. Primary standards provide public health protection, including the health of “sensitive” populations, and secondary standards that are related to decreased visibility and damage to animals, vegetation and buildings. Since 2012 the standard for PM2.5 has been an average annual level of 12.0 µg/m³ for primary and 15.0 µg/m³ for secondary (https://www.epa.gov/criteria-air-pollutants/naaqs-table). The level for PM10 was less than 50 µg/m³ until it was revoked by the United States Environmental Protection Agency (EPA) in 2006. 12
California has ranked in the upper half compared to the other states though IHD rates have also declined considerably. Despite these achievements, the Central Valley has historically had higher rates compared to the rest of the state, for reasons which have not been entirely explained. 13 It has been suggested that there is a gradient of increasing ischemic heart disease from north to south due to environmental exposures. Although also declining, the PM levels have been above the national standards.
The Central Valley of California is a rich and fertile agricultural and industrial area. It has unique geographic and climate qualities that may contribute to the observed trends in ischemic heart disease mortality. Reports from the California Department of Public Health on the burden of cardiovascular disease noted in 1994, 14 and later in 2007 13 a geographic trend in the Central Valley. Cahill et al. noted a relationship with ambient air particulate matter that may have, in part, explained this observation. 15 This study was designed to estimate the relative mortality risks and ambient air pollution levels in this area.
Methods
Age-adjusted mortality data from ischemic heart disease (International Classification of Disease 10th (ICD-10) codes I20-I25), grouped by county, gender, race, and Hispanic origin were accessed from the National Vital Statistics System (NVSS) database from years 1999 through 2014. 16 Race was classified as Caucasian, African-American, Asian-American, Hispanic (as identified by Hispanic or Latino origin), and American-Indian/Alaska Native. Age-adjusted death rates were computed for persons 45 and older per 100,000 using the 2000 US standard population. Following NVSS policy, death rates reported to be less than 20 were reported as unreliable and thus missing. Comorbidity data were accessed from the California Health Information Survey (CHIS) database. 17 Smoking rate data were also obtained from the California Tobacco Survey database website. Population statistics were from the California Department of Finance database for 2010. The ambient PM2.5 average annual levels were obtained from the Environmental Protection Agency’s Data Mart (http://aqsdr1.epa.gov/aqsweb/aqstmp/airdata/download_files.html#1999-2014). The years of 1999 to 2014 were divided into three 5-year periods, 1999–2004, 2005–2009, and 2010–2014. Statistical analysis used correlation, ANOVA, and Bartlett’s test for equal variances functions of STATA (STATA Corp., version 13, College Station, TX).
Study population
California adults from age 45 and older served as the comparison group and adults from age 45 and older in the respective counties were the study group. This was an ecological study. The thirteen counties (Shasta, Butte, Sutter, Placer, Sacramento, Yolo, San Joaquin, Stanislaus, Madera, Fresno, Kings, Tulare, Kern) in the Central Valley have been collectively called the Transect counties, i.e., a narrow section through a natural feature along which observations are made. California Central Valley racial distribution is heavier in Caucasian (54%–87%) and Hispanic (8%–61%), with much fewer African-Americans (2%–10%), Asian-Americans (3%–14%), and American-Indian/Alaska Native (AI/AN, <1%) (CA Dept. of Finance, http://www.dof.ca.gov/research/demographic/state_census_data_center/census_2010/#SF2). The northern Transect counties are predominately Caucasian (Shasta, 87%, Butte, 82%, Sutter, 61%, Placer, 84%, Sacramento, 57%, Yolo, 63%, San Joaquin, 51%, Stanislaus, 66%, Madera, 63%, Fresno, 55%, Kings, 54%, Tulare, 60%, and Kern, 60%) which allowed controlling for race by studying IHD rates in Caucasian. In the counties with the lowest percent Caucasian, they were predominantly Hispanic (50%–60%).
The CDC transitioned cause of death ICD codes to ICD-10 starting in 1999. The codes I20.0–I25.9 incorporate ischemic heart disease. ICD codes representing acute ischemic heart disease were used 36% of the time (I21.9, AMI, unspecified) and those for chronic disease were used 64% (I25.0, ASCVD, so described, 19.1%, I25.1, ASCVD, 39.7%, I25.5, ischemic cardiomyopathy, 4.3%, and I25.9, chronic ischemic heart disease, unspecified, 2.6%).
Average annual age-adjusted death rates were compared by gender and race. Because of the heavy distribution towards White and Hispanics in most counties, and primarily Caucasian in the northern counties, race adjusted rates were calculated and compared only for the Caucasian racial group. Because of the consistent death rate of women being two-thirds that of men, trend analysis focused on Caucasian men.
Results
California, in general, had a rate of 487 (SD, 179) deaths per 100,000 during the first time period, 486.6 (SD, 179) in the second, and 293.8 (SD, 79) in the third, a 40% decline. The total population for the Transect counties was 1,921,144 in Period 1, 1,875,589 in Period 2, and 2,070,574 in Period 3 which represented approximately 13% of the total California population. The mean population for each of the Transect counties studied was 147,780 in Period 1, 144,276 in Period 2, and 159,274 in Period 3. The mean IHD deaths rates for all races 560 (SD, 203), 442 (SD, 173) (21% decline), 345 (SD, 131) (38% decline), all men 678.4 (SD, 181), 539 (SD, 154) (21% decline), 431.8 (SD, 109) (36% decline), all women 437.4 (SD, 143), 342.8 (SD, 129) (22% decline), 253.4 (SD, 79) (43% decline), Caucasian men 694.5 (SD, 127), 559.9 (SD, 110) (19% decline), 466.4 (SD, 84) (32.8% decline), and Caucasian men 433.4 (SD, 102), 343.8 (SD, 85) (21% decline), 258.7 (SD, 65) (61% decline) declined steadily with the larger reduction between the second and third periods. Women consistently had death rates between 30% and 40% less than their men counterparts. African-American men had the highest rate in each period 869 (SD, 223), 731 (SD, 168) (16% reduction) and 523.4 (SD, 119) (40% reduction) and had comparable reductions. African-American women also had the highest rates of the women 634.6 (SD, 147), 526.4 (SD, 149) (16% reduction), and 332.3 (SD, 66) (48% reduction) but also some of the highest reduction. Hispanic men had rates less than their Caucasian counterparts 590.8 (SD, 155), 428.4 (SD, 92) (28% reduction), and 358.1 (SD, 68) (39% reduction) but with a similar reduction in mortality. Hispanic women 382.7 (SD, 104), 278.8 (SD, 84) (28% reduction), and 233.1 (SD, 72) (40% reduction) Asian-American men were similar to Hispanic men 559.5 (SD, 153), 435.3 (SD, 125) (22% reduction), and 349.5 (SD, 108) (38% reduction) followed by Asian-American women who had the lowest rates, 293.1 (SD, 55), 221.6 (SD, 59) (25% reduction), 196.1 (SD, 94) (33% reduction). For the counties with a significant Hispanic population, the total IHD mortality rate would be lower if not controlled for race.
Towards the third period, although African-American men still had higher IHD mortality rates, they approached Caucasian men’s rates (25% higher IHD rate for African-American compared to Caucasians in Period 1, 31% in Period 2, and 12% in Period 3). Hispanic and Asian-American men both were 20% lower than Caucasian men. African-American women were much higher than their Caucasian counterparts in Period 1, but then also approached their Caucasian counterparts (46% higher in Period 1, 53% in Period 2, and 28% higher in Period 3). Hispanic and Asian-American women were lower than their Caucasian counterparts by approximately 10% to 30%.
For the three time periods, there was a significant and consistent decline in rates from IHD in the Transect Counties; however, a trend of increasing death rates from north to south was evident (Figures 1 and 2). The notation “distance from north” indicates that the counties are presented in a north to south ordering to highlight the geographical nature of the data.

Ischemic heart disease mortality rate of Caucasian males in the California Central Valley 1999–2014 by county arranged north to south. Shasta County is at the most northern end and Kern County is at the southern end.
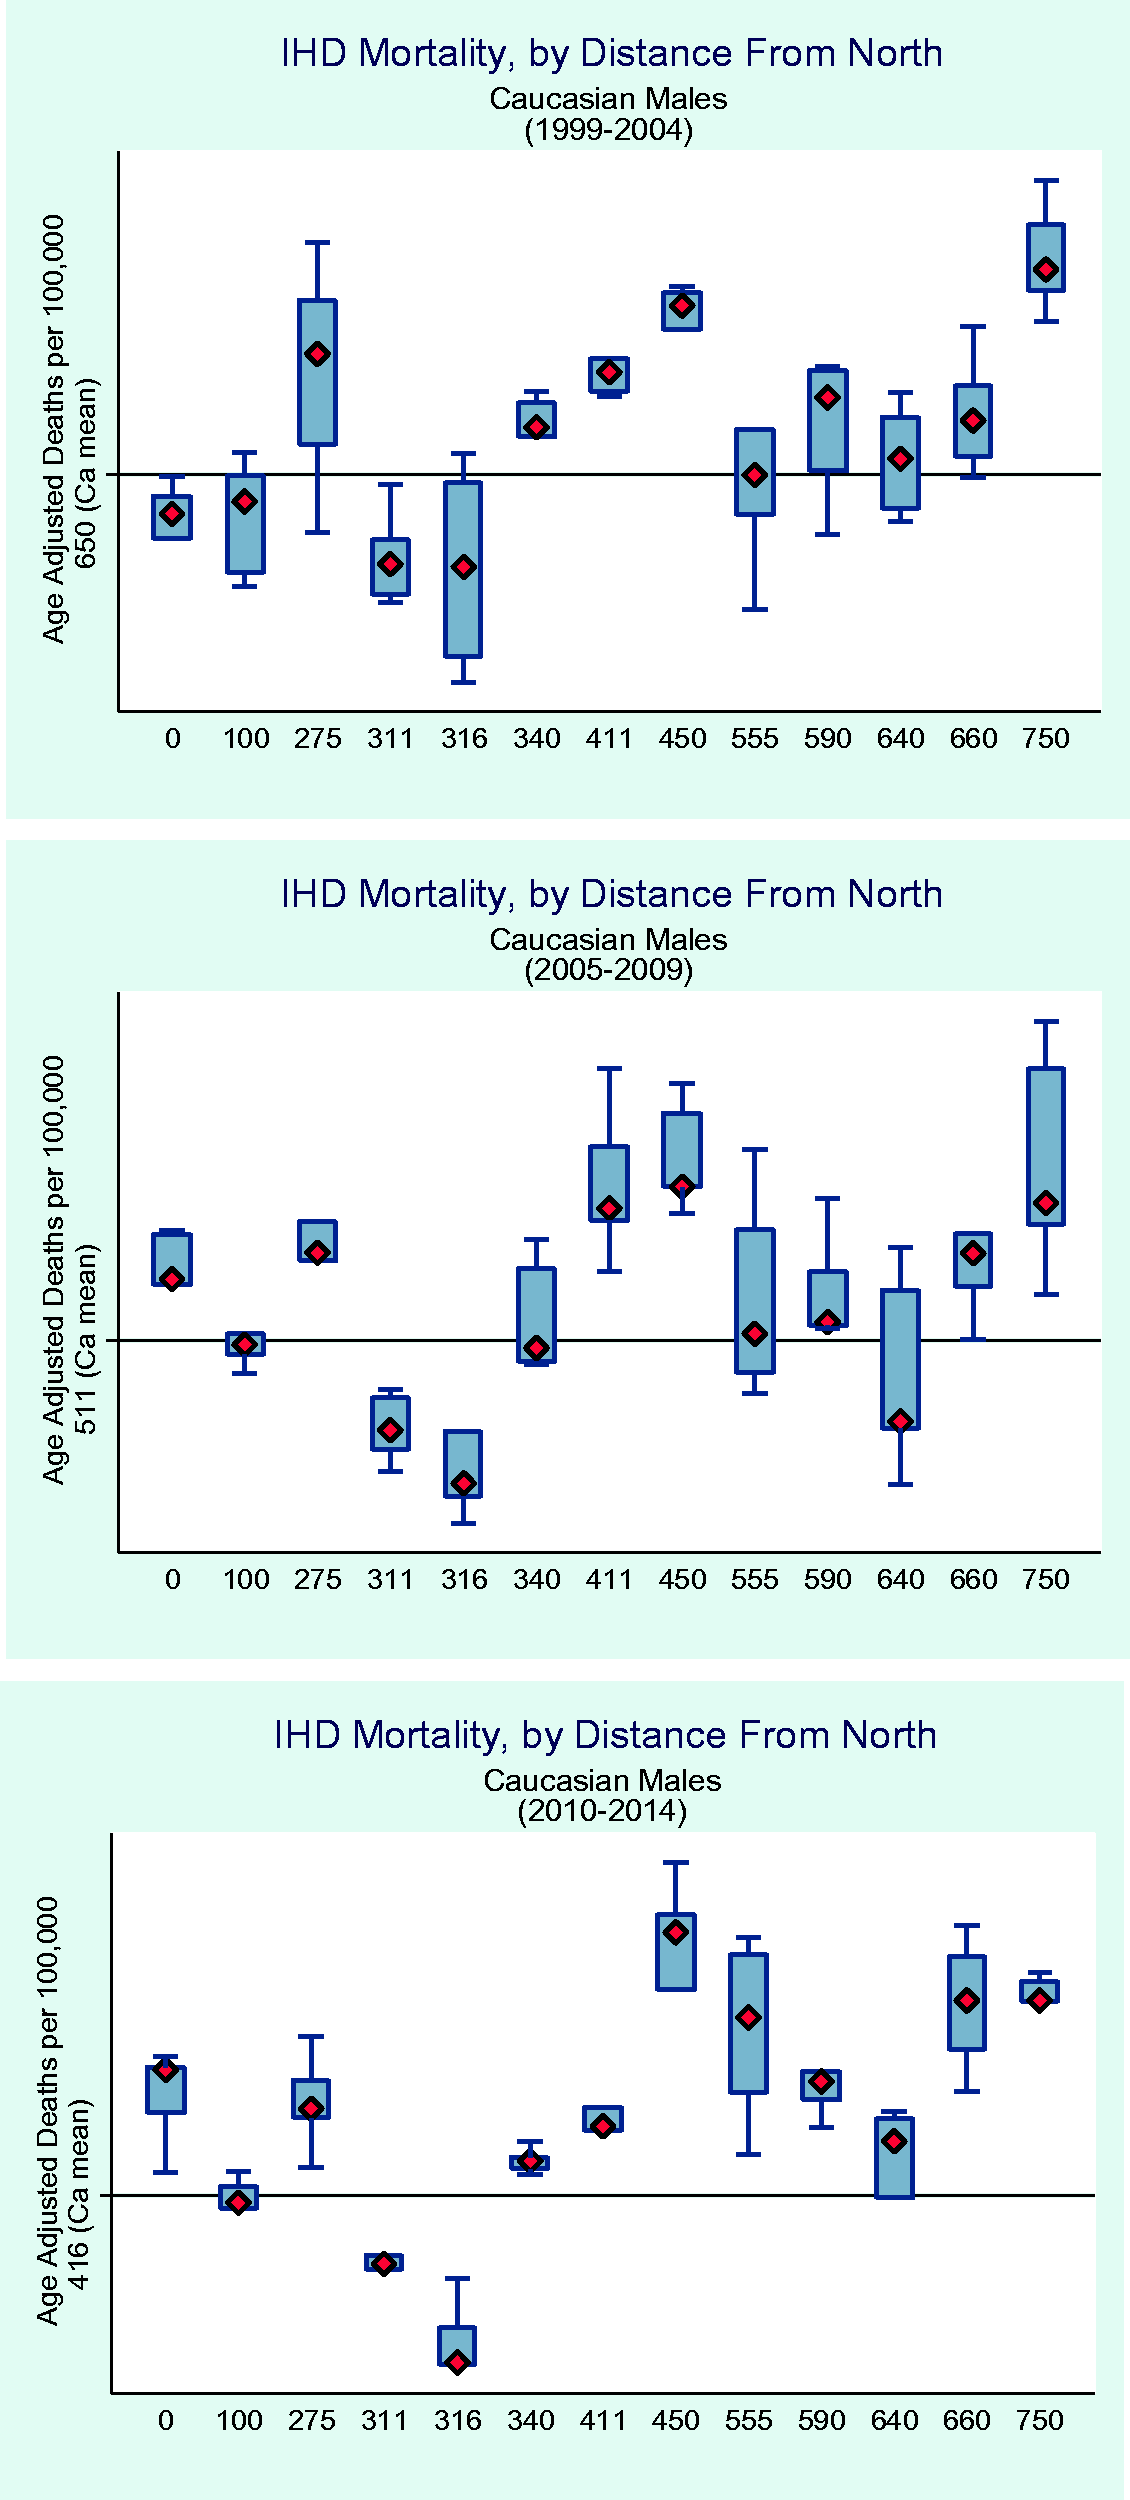
Ischemic heart disease mortality rates in Caucasian males arranged by distance from the most northerly county to the most southerly compared to California state average by time period. Specifically, the x-axis is the distance from the centroid of Shasta county.
The mean reduction in IHD mortality was 114.6 deaths per time period in the Central Valley (95% CI: −132.8 to −96.4). There was an increase in mortality from north to south of 14.9 (95% CI: 8.0–21.9) in time period 1, 7.9 (95% CI: 0.8–15) in time period 2, and 9.2 (95% CI: 4.0–14.3) in time period 3.
The traditional risk factors of hypertension, diabetes, smoking and obesity were compared (Figure 3).

Rates of hypertension, diabetes and hyperlipidemia in each county arranged north to south by time period.
Hypertension was present in 24.3% (SD, 1.9) in first period, 28.3% (SD, 2.9) in second, and 29.5% (SD, 4.9) in third, p value <0.001 for trend. It increased per time period by 2.4% (95% CI: 1.8–3.1, p value <0.001), it increased from north to south by 0.3% in Period 2 (95% CI: −0.1–0.17, p value not significant (ns)) in Period 1, it dropped by −0.3% in Period 2 (95% CI: −0.5–0.07, p value <0.01), and by the same in Period 3 (95% CI: −0.7–0.01, p value ns). Diabetes was present in 7.9% (SD, 1.3) in Period 1, 8.5% (SD, 1.7) in Period 2, and 8.9% (SD, 3.6) in Period 3, p value <0.0001 for trend. It increased 0.9% per time period (95% CI: 0.52–1.4, p value <0.0001 for trend). It increased from north to south in Period 1 by 0.07 (SD, 0.05) (95% CI: −0.02–0.17, p value ns), 0.3% (SD, 0.04) in Period 2 (95% CI: 0.2–0.4, p value <0.0001), and dropped −0.06% (SD, 0.13) in Period 3 (95% CI: −0.03–0.2, p value ns). Hyperlipidemia was only available for the second period, the mean was 21.9 (SD, 0.6) and it dropped from north to south by −0.2% (95% CI: −0.3–0.002, p value <0.05).
Smoking and obesity were reviewed (Figure 4).

Rates of smoking and obesity in each county arranged north to south by time period.
Smoking was present in 31.9% (SD, 2.7) in Period 1, 30.3% (SD, 6.4) in Period 2 and 29.5% (SD, 5.7) Period 3, p value <0.0001 for trend. It dropped by time period by −1.6% (SD, 0.5) (95% CI: −2.5–0.07, p value <0.001). It increased from north to south by 0.3 (SD, 0.1) (95% CI: 0.1–0.5, p value <005) in Period 1, it dropped by −0.02 (SD, 0.2) (95% CI: −0.05–0.4, p value ns), and increased by 1% (SD, 0.2) (95% CI: 0.7–1.3, p value <0.001). Obesity was present 23.9% (SD, 2.9) in Period 1, 28.1% (SD, 3.4) in Period 2 and 29% (SD, 6.2) in Period 3, p value <0.001 for trend. In Period 1 it increased from north to south by 2.9% (SD, 0.4) (95% CI: 2.1–3.7, p value <0.001), by 0.6% (SD, 0.1) in Period 2 (95% CI: 0.4–0.07, p value <0.001), and by 0.8% (SD, 0.2) (95% CI: 0.5–1.2, p value <0.001).
Hypertension correlated with diabetes modestly (r = 0.45, p value <0.001), diabetes and smoking correlated better (0.57 and 0.60 respectively, p value <0.001). There was no significant correlation between hypertension, smoking, or obesity.
Distance from north, PM10 and PM2.5 annual averages were studied (Figure 5).
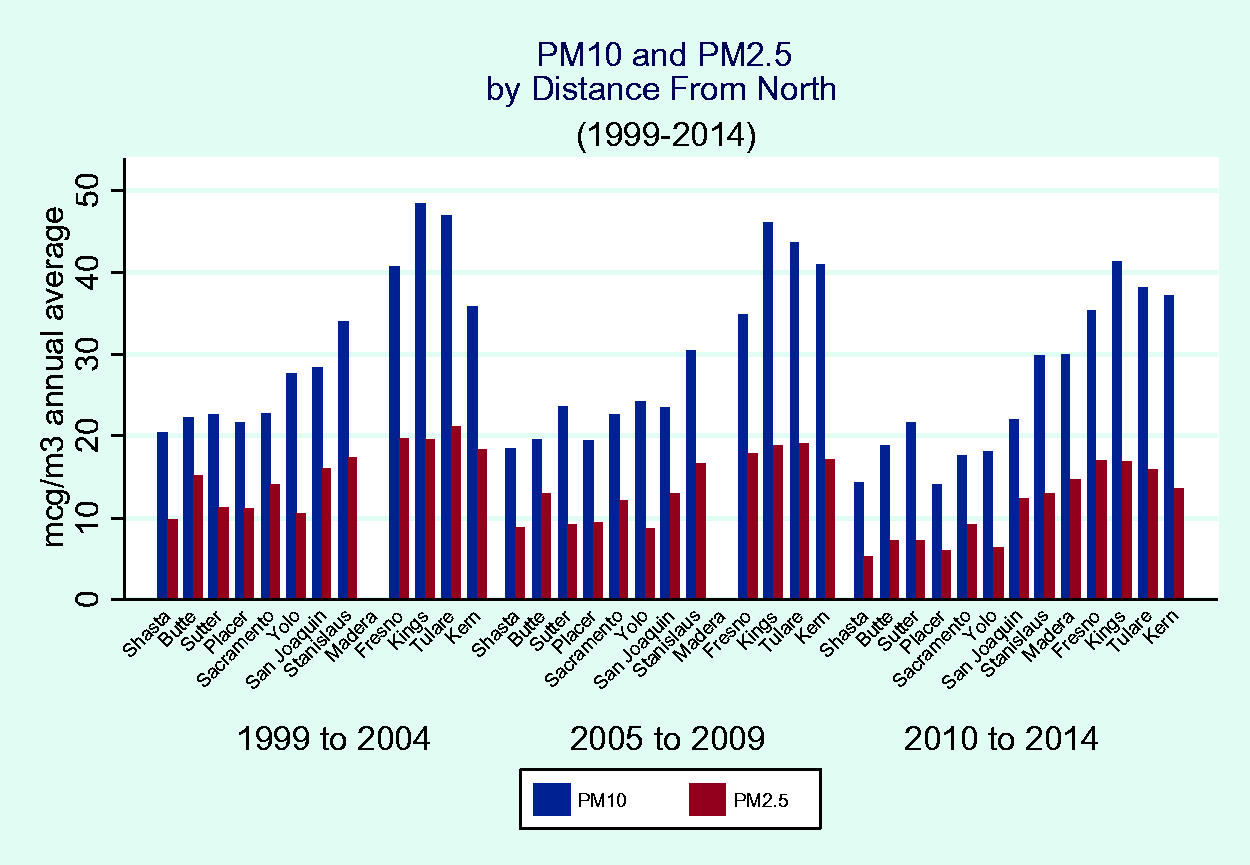
PM10 and PM2.5 concentration levels arranged by county from north to south and by time periods.
There was a reduction of the level of PM10 of 2.5 µg/m³ (95% CI: −4.1–0.9) over each time period. In time period 1, the PM10 level increased from north to south by 2.2 µg/m³ (95% CI: 2.0–2.5), in time period 2 there was a 2.3 µg/m³ increase (95% CI: 2.1–2.5), and a 2.3 µg/m³ increase in time period 3 (95% CI: 2.0–2.5). PM10 level was correlated to IHD mortality in time periods 1 and 3 (Period 1: r = 0.29, p = 0.01; Period 2: r = 0.22, p value ns; Period 3: r = 0.5, p value <0.0001). There was a reduction of the level of PM2.5 of 2.1 µg/m³ (95% CI: −2.8–1.4) over each time period. In time period 1, the PM2.5 level increased from north to south by 0.84 µg/m³ (95% CI: 0.71–0.96), in time period 2 there was a 0.87 µg/m³ increase (95% CI: 0.74–1.0), and a 1.0 µg/m³ increase in time period 3 (95% CI: 0.87–1.1). PM2.5 level was correlated to IHD mortality in all time periods (Period 1: r = 0.46, p = 0.0001; Period 2: r = 0.34, p = 0.008; Period 3: r = 0.51, p value <0.0001).
Counties were compared by population size, the larger counties (those greater than 200,000) had a significantly higher IHD mortality rate compared to the smaller counties (less than 50,000) (775 vs. 659.2 in Period 1, 610 vs. 510 in Period 2, and 485.5 vs. 433.5 in Period 3, all p values significant at 0.05 or better).
Comparing the northern counties (Shasta, Butte, Sutter, Placer) with the southern counties (Fresno, Kings, Tulare, Kern) demonstrated a significant greater IHD mortality rate in the larger counties (IHD rate 629.1 vs. 750.2 for Period 1, 525.1 vs. 582.6 for Period 2, and 433.2 vs. 501.2 for Period 3, all p values significant at 0.05 or better).
Discussion
The results of this population-based study demonstrate that the persistence in IHD mortality disparities may be due to the relatively increased prevalence in smoking, obesity, and environmental exposures in the southern counties as compared the northern counties. The consistent decline across race and gender suggests equal access and quality of care regarding primary and secondary management of risk factors and acute interventions, while the demonstration of a geographic trend suggests environmental factors at play. Jolly et al. studied the rates of cardiac procedures in American-Indian/Alaska Native population in California and found comparable rates. 18
Clinicians have more control of the management of hypertension and hyperlipidemia through medical management and relatively modest control over diabetes due to the difficulty in assuring compliance with diet and activity. Smoking and obesity less so, though with persistent and repeated encouragement, results can be rewarding. Yang et al. studied the trends in cardiovascular health metrics which include not smoking, physically active, blood glucose and cholesterol levels, weight and eating a healthy diet and noted a significant reduction in IHD mortality in those who adhered to more of the metrics. 19
Unlike the traditional risk factors whose pathophysiologic effects are well known, the role of ambient particulate matter is less so. Mechanisms proposed are activation of the pulmonary receptors resulting in autonomic nervous system imbalance and the development of rhythm disturbances, induction of pulmonary and systemic inflammation, and introduction of the particles to the systemic circulation. 20 Interestingly, this seems to be more strongly correlated with IHD than stroke. 15 Evidence is accumulating regarding the role of specific components of ambient air pollution and IHD.21–23 Although the PM10 levels for the counties of the Central Valley are well below the 2006 standard, the southern counties continue to be significantly above the standard for PM2.5. PM2.5 has been accepted as an important contributor to cardiovascular morbidity and mortality. 24
Clinicians need to partner with community leaders in order to make an impact on environmental effects, as seen in Utah. 25 The American College of Physicians has addressed this in their recent position paper on the effects of climate change on health. 26 Also, though the most current CVD risk calculations have been validated, it may be necessary to add a geographic or environmental modifier to allow attainment of mortality decline parity. 27 Di et al. were able to stratify the adverse effects of air pollution at the zip code level, adding this to the current CVD risk calculators would identify populations at increased risk and provide an opportunity to be treated with aspirin and lipid-lowering agents.
The strengths of the study are the length of time frame allowing long-term trends to be studied. The limitations of the study are those common to ecological studies, in that associations may be identified but no causal associations may be estimated. Data for hypertension, diabetes, smoking and obesity would be more accurate if from cohort or case–control databases. Mortality rates based on validated events would allow stronger confidence than those from death certificates.
Conclusion
Continued declines in ischemic heart disease mortality will depend on the concerted efforts of clinicians in continuing management of the traditional risk factors (hypertension, diabetes, and hyperlipidemia) with appropriate medication use, the necessity of patient self-management of high risk behaviors associated with smoking and obesity (personal pollution), and the development of coordinated actions with policymakers to reduce environmental exposure in their respective communities.
Footnotes
Acknowledgements
The contents of this commentary reflect the perspectives of the author alone and not necessarily of the United States Government or the United States Public Health Service.
Declaration of conflicting interests
The author(s) declared no potential conflicts of interest with respect to the research, authorship, and/or publication of this article.
Funding
The author(s) received no financial support for the research, authorship, and/or publication of this article.
Ethical approval
Ethical approval requirement was waived. There was no actual patient contact made to collect any personal and clinical information.
Guarantor
RS is the guarantor for this study
Contributorship
Conception and design: RS, NS, and HSS. Data collection: RS, NS, and HSS. Data analysis: RS. NS, and HSS. Manuscript drafting and revision: RS, NS, and HSS. Approved the final version of the manuscript: all authors.