
Abstract
Background
Since the discovery of Ca2+ sparks and their stochastic behaviour in cardiac myocytes, models have focused on the inclusion of stochasticity in their studies. While most models pay much attention to the stochastic modelling of cytosolic Ca2+ concentration the coupling of Ca2+ sparks and blinks in a stochastic model has not been explored fully. The cell morphology in in silico studies in the past is assumed to be Cartesian, spherical or cylindrical. The application on curvilinear grids can easily address certain restrictions posed by such grid set up and provide more realistic cell morphology. In this paper, we present a stochastic reaction–diffusion model that couples Ca2+ sparks and blinks in realistic shapes of cells in curvilinear domains.
Keywords
Introduction
Ca2+-induced Ca2+ release (CICR) is the repeated process in which influx of extracellular Ca2+ into the cytosol from L-type channels triggers a release of Ca2+ from the sarcoplasmic reticulum (SR) through ryanodine receptors (RyRs) on the z-lines.
1
The CICR process is schematically illustrated in Figure 1. A more detailed review of the processes leading to contraction can be found in Arif et al.
2
The Ca2+ release event appears as Ca2+ sparks3–8 in the cytosol and Ca2+ blinks
9
in the SR. The successive activation of RyRs increases the local Ca2+ concentration in the cytosol. This process is called Ca2+ transient.10–12 Ca2+ sparks observed in the heart muscle were found to behave stochastically
4
and that release occurs at discrete sites closely associated with transverse (t)-tubules at Z-lines
13
with regular spacing of 1.8–1.9

Schematic view of the influx and efflux of Ca2+ in a cardiac myocyte. Ca2+ entry through L-type channels on the sarcolemma triggers Ca2+ release from the SR. This is a repeated process of the CICR mechanism. The Ca2+ released from the SR increases the concentration in the cytosol. Ca2+ here travels to the sarcomeres and interacts with filaments and activates the contractile machinery. Upon relaxation, Ca2+ disassociates from the filaments and is pumped back into the SR by the SERCA pumps. Modified from Arif et al. 2
In cardiac ventricle cells, spontaneous propagating waves of Ca2+ may occur due to Ca2+ overload which is believed to occur under pathological conditions. This can affect the heart’s normal function and may lead to ventricular arrhythmias and heart failure.14,15 Therefore, it has become increasingly important to understand the underlying mechanism of the CICR process and any experimental or mathematical studies would contribute towards this.
Several models have been used to simulate the Ca2+ sparks and waves. A number of them are partially based on the CICR process and the release from RyRs is described as either deterministic16–26 or stochastic.15,27–30 The models mainly consist of fractional differential equations (FDEs), partial differential equations (PDEs), and ordinary differential equations (ODEs). Although some of these models include buffers and dye and others do not, they all shape our understanding of the underlying mechanism of CICR in cardiac myocytes. Throughout the years models have been refined to account for more buffers and a more realistic representation of the calcium release units (CRUs).
Backx et al. described the CICR process with magnesium buffer reactions using a one-dimensional model that only takes into account longitudinal diffusion. 16 The Ca2+ release from the SR occurs at CRUs and is assumed to be a time dependent process with an exponential rise and fall of the Ca2+ flux from the SR. The occurrence was dependent on a threshold for Ca2+ concentration which leads to a deterministic description of this term in the model. A similar deterministic formulation was incorporated in the release flux by Soeller and Cannell which was then included in the total calcium current by volume integration. 17 The aim was to experimentally test the extraction of the release flux underlying calcium sparks including a more detailed dye and buffer binding structure.
Another deterministic construction of the SR calcium release was represented in two-dimensional models21–23 so the spatial and anisotropic properties of the cytosolic Ca2+ diffusion can be successfully reproduced. In these models, the diffusion of Ca2+ sparks obeys Fick’s Law. Later on, an anomalous subdiffusion model was proposed based on an FDE that represents the cytosolic Ca2+ concentration24,26 and it was shown to reproduce the spatial characteristic of sparks more realistically.
There have also been deterministic models with no buffer reactions.18–20 These models focused on representing the CICR process in a compartmental model with no dye and buffer reactions. No virtual point sources of CRUs are described. Instead the SR Ca2+ release is associated with a nonlinear term based on the cytosolic and sarcoplasmic concentrations applied to all spatial points of the computational domain. In 2009, this two-pool CICR model was integrated into a force-calcium relation by Tracqui and Ohayon to successfully reproduce Ca2+ waves and the resulting phases of contraction using cylindrical coordinates. 25
More recently, stochasticity is introduced into models 27 in which the Ca2+ channel opening depends on a probability function. Lu et al. integrated rogue RyRs into this model to simulate the effect of these receptors on the Ca2+ wave in ventricular myocytes with heart failure. 15 These models were extended from Fick’s Law-based Ca2+ diffusion to anomalous subdiffusion.28,29 This has greatly improved our understanding of the calcium dynamics under pathological conditions. The majority of stochastic models focus on the coupling of cytosolic and sarcoplasmic Ca2+ concentrations using only one equation to represent this coupled state. This equation is usually used to track the change of cytosolic Ca2+ concentration in space and time. In order to measure or observe the change in sarcoplasmic Ca2+ concentration a separate equation is required for this which is yet to be fully explored under stochastic conditions. One recent work by Li et al. 30 is based on two governing equations. One is based on anomalous subdiffusion that models the Ca2+ sparks and waves in the cytosol and the other models the Ca2+ blinks in the SR. One limitation to this work is the use of a Cartesian domain in representing the cell structure which can cause difficulty in modelling Ca2+ waves in more complicated cell shapes.
The main motivation of this work concerns the cell domain considered in the computational studies. The majority of models to date, focus on representing the cell morphology using simplified domains applied to Cartesian, spherical 17 or cylindrical coordinates. 31 However, these can become impractical for more complicated shaped cells. Using a simplified domain to represent such complicated shapes can be useful, however, insufficient for the accurate estimation especially at the boundaries. An alternative method that can address this problem is the use of finite element method (FEM) which has been implemented before for the modelling of contraction in isolated cardiac myocytes.25,32 In this work, an alternating direction implicit (ADI) method with curvilinear coordinate transformation technique is used. ADI is a finite difference-based method and is more computationally efficient than FEM and the method itself is also easier to implement. Finite difference-based methods are a good alternative to FEM, however, it has not been used in this area in combination with a curvilinear transformation technique. This is the first work to have ever used a finite difference-based method with a curvilinear coordinate transformation technique for estimating stochastic Ca2+ movement in a cardiac myocyte with and without buffers and dye.
The aims of the present paper are (1) extension of the stochastic formulation by Izu et al. 27 to include the Ca2+ sparks coupled with Ca2+ blinks and its application on curvilinear domains (this allows one to work on real cell morphology); (2) representation of two different systems: (a) buffered and dyed system to account for Ca2+ movement observed in in vitro studies and (b) non-buffered and non-dyed system to observe the difference between the two systems; (3) comparison of the Cartesian and curvilinear domains. The model and its extension to curvilinear grids are described in the next section. The application to curvilinear grids and comparison results between models are presented in the results section with conclusions and potential future improvements discussed in the final section of this paper.
Methods
Mathematical model for Ca2+ sparks and Ca2+ blinks with buffer and dye
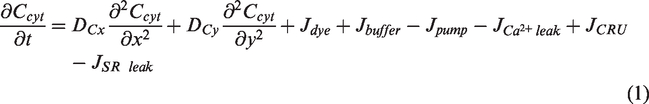
The set of differential equations (DEs) by Izu et al.22,23,27 describing the cytosolic Ca2+ concentration with buffer and dye binding properties is modified to include an additional term for the cytosolic leak19,20,25 and a slightly different representation of the SR leak term.19,20,25 An extension to this model here includes a coupling of the cytosolic Ca2+ diffusion with the sarcoplasmic Ca2+ concentration. For simplicity, diffusion is restricted to follow Fick’s Law and the Ca2+ concentration in the SR is restricted to time diffusion and so is not diffusive in space giving rise to a simple ODE. This is adopted from several other authors18–20,25,32,33 and was shown to produce promising results. Therefore, for the current study it will suffice to use these assumptions for computational simplicity. Considering the above, the reaction–diffusion equations are expressed as


CRUs: calcium release units; SR: sarcoplasmic reticulum.


The SR Ca2+ release term, 
Molar flux through the RyRs,
The CRUs are placed at regular intervals of 
Cartesian and curvilinear domains
The computational domain for the cell is represented by two different coordinate systems, namely Cartesian and curvilinear. It is assumed that the SR spans the size of the respective computational domains used. Two different systems are solved on the Cartesian and curvilinear domains: (1) non-buffered and non-dyed (NBND) system (i.e.
Parameter values for NBND and BD cases applied to the Cartesian and curvilinear grids.

Note: Some values used in the case of the BD system are within the range of the cited values.
NBND: non-buffered and non-dyed; BD: buffered and dyed.
A two-dimensional domain is considered with the Cartesian and curvilinear grids shown in Figure 2. The Cartesian problem (Figure 2, top) is solved with equations (1) to (4). Finite discretisation of the PDEs is used and an ADI method 36 is used as the numerical scheme. The ODE for the sarcoplasmic Ca2+ concentration is solved by using a fourth order Adams-Bashforth (AB) method and the other ODEs are solved by using the traditional forward Euler method.
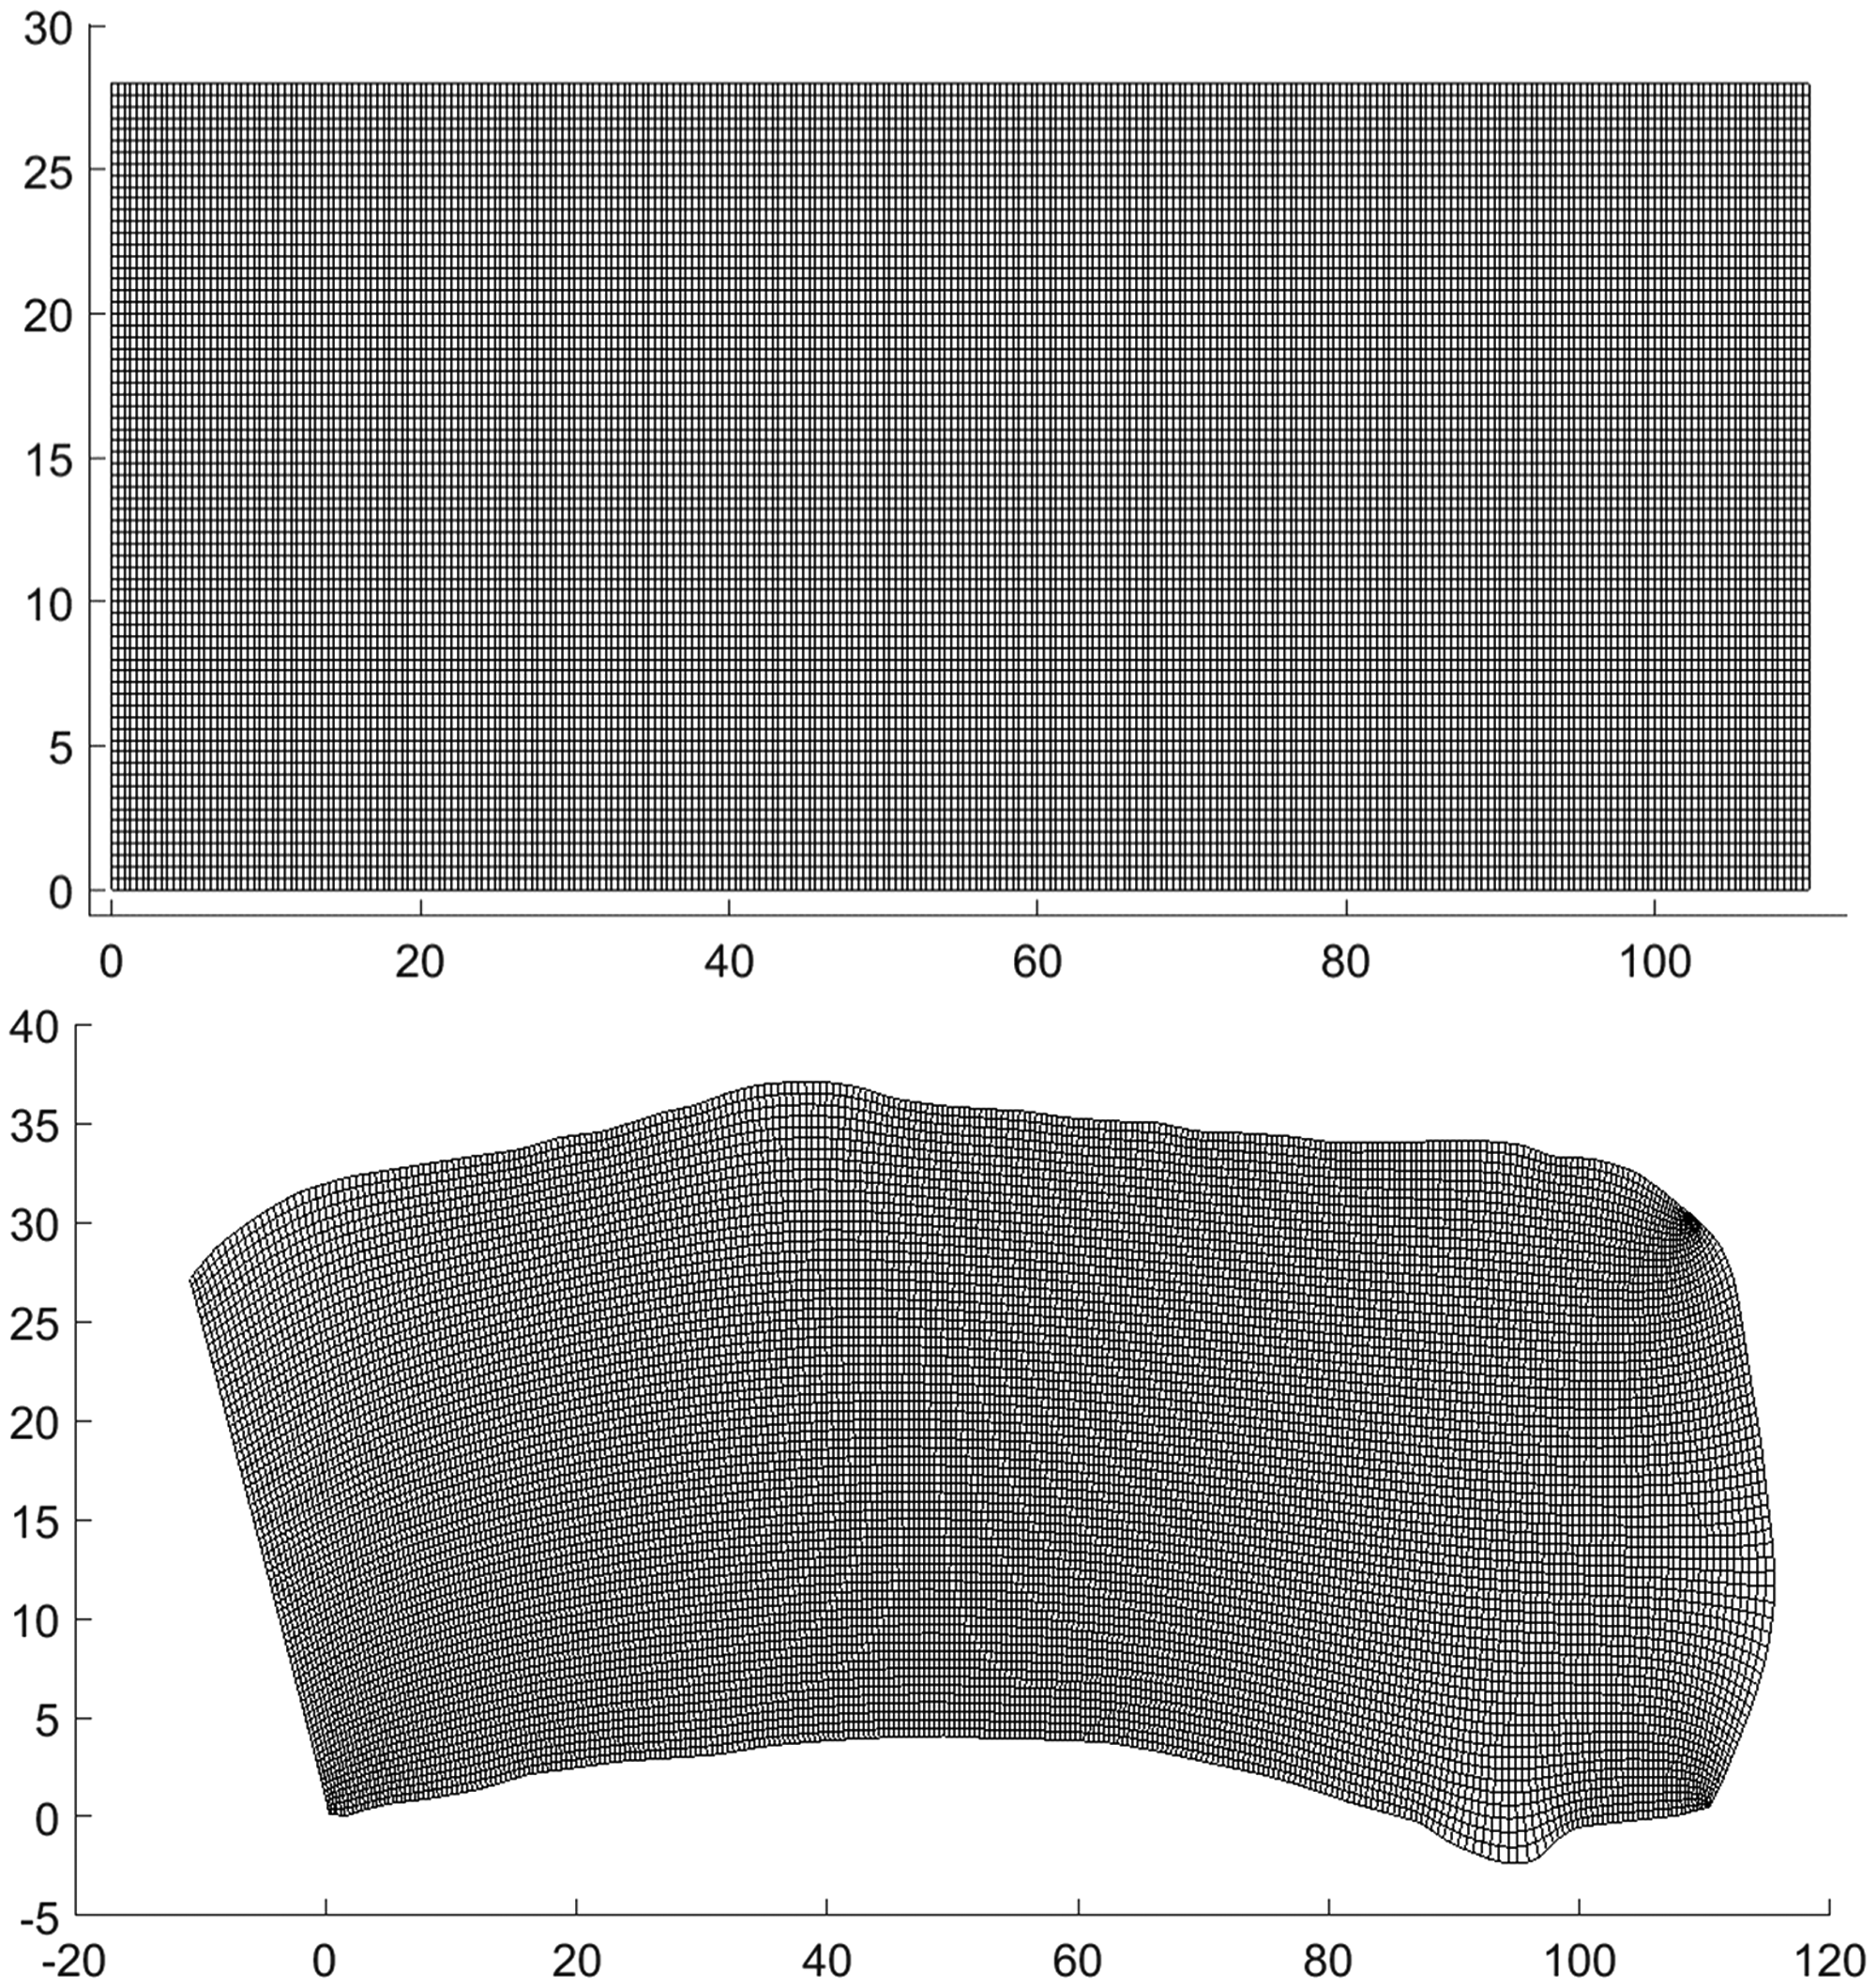
Grids generated on the Cartesian (top) and curvilinear (bottom) coordinate system. In both cases, the system is discretised into 276 × 71 grid points. A cell size of 110
In the curvilinear case, the diffusion equations (1) and (3) need to be transformed from the Cartesian-based system with the gridlines specified by x and y to the curvilinear coordinate system with gridlines specified by 

These equations are then solved by using the ADI method. 36 The source strength becomes spatially dependent since the distance between grid points is not uniform. Equations (2) and (4) to (6) are then solved on the curvilinear grid (Figure 2, bottom).
Orthogonal curvilinear coordinates are generated using the software gridgen-c developed by Sakov and CSIRO Marine Research (2006–2017) (see acknowledgement). The code incorporates a CRDT algorithm by Driscoll and Vavasis for conformal mapping
37
which smoothly distributes the grid points throughout the domain. This algorithm provides the x and y positions of the curvilinear grid which is then used along with a 10th order compact finite difference scheme
38
to evaluate the derivatives associated with the curvilinear coordinates
The CRUs are distributed with

Distribution of the CRU channels on the Cartesian (left) and curvilinear (right) domains. The CRUs are uniformly distributed in the Cartesian case while in the curvilinear case, they are spaced out evenly with an equal number of grid points between them leading to the distribution to appear denser at the concave (top bending) and coarser at the convex (bottom bending) regions. Sensors are also included in the domains with their x and y coordinates in
As boundary conditions zero-flux is assumed at the cell boundaries by imposing
In the next section of this paper, temporal concentration profiles are provided for the cytosolic and sarcoplasmic Ca2+ concentrations. Sensors are placed in both domains to record these concentration values. The exact location of these sensors is given in Figure 3. In addition to these results, the mean wave velocity of Ca2+ propagation is provided in each case. For the estimation of the velocity, the peak of the Ca2+ wave is tracked from a point close to the centre to the end of either side of the domain. The distance travelled (in
Results
In cardiac myocytes, Ca2+ waves propagate as sharp bands 39 with velocities and frequencies that are high enough to allow for the simultaneous propagation of distinct fronts in a given individual cell. The latter type of wave has been called type 1 for convenience. 33
In the following results, Ca2+ waves of type 1 is observed. Once sparks are initiated they develop in 10 ms and increase the concentration around the region. The probability of firing is proportionally dependent on the local concentration. Therefore, a rise in concentration increases the probability of SR release and eventually leading to the activation of neighbouring CRUs. If the concentration is sufficiently high more CRUs fire consecutively which creates a propagating Ca2+ wave.
In all cases that are presented in this section, the initial cytosolic Ca2+ concentration at rest is set to
NBND system on the Cartesian and curvilinear domains
In this section, results are presented for the NBND system. The set of equations (1) to (4) are solved on the Cartesian domain and equations (2) and (4) to (6) on the curvilinear domain. Buffer and dye reactions are neglected in the model, i.e.

Ca2+ wave propagation on the Cartesian grid in the absence of buffer and dye reactions. Snapshots are recorded at times 10, 25, 50, 75, 125, 150, 175, 190 and 300 ms (left to right, top to bottom). The colour bar denotes the Ca2+ concentration in

Ca2+ wave propagation on the curvilinear grid in the absence of buffer and dye reactions. Snapshots are recorded at times 10, 40, 70, 125, 175, 225, 275, 375 and 550 ms (left to right, top to bottom). The colour bar denotes the Ca2+ concentration in
Looking at the simulation time when the Ca2+ reaches the end boundaries it was observed that the wave propagates in less time compared to that in the curvilinear case. As can be seen in Figure 6, the peak of the wave exits the domain in 200 ms in the Cartesian (Figure 6(a)) and 400 ms in the curvilinear (Figure 6(b)) cases. The longitudinal mean velocity of the wave is calculated to be approximately 312.41

Cytosolic Ca2+ wave propagation without buffer and dye reactions. The spatial characteristics of the wave propagation are plotted on the (a) Cartesian domain at times 50, 100, 150 and 200 ms and (b) curvilinear domain at times 100, 200, 300 and 400 ms. Output is given from five separate simulations.

Cytosolic (a, c) and sarcoplasmic (b, d) Ca2+ concentrations are plotted on the Cartesian (a, b) and curvilinear (c, d) domains. See Figure 3 in previous section for the location of the sensors. Output is given from five separate simulations.
There is a periodic exchange of Ca2+ between the SR and the cytosol. These result in the mentioned Ca2+ sparks and blinks, the simulation results of which are presented in Figure 7. There is a slight difference in the amplitude of the cytosolic concentration profiles when comparing the Cartesian and curvilinear problems. Similarly, there is not much variation in the sarcoplasmic concentration profiles when comparing the solution on the two different domains. In the Cartesian case, concentration in the SR drops to approximately 580.7–582.5
BD system on the Cartesian and curvilinear domains
In this section, results are presented for the BD system. The same set of equations as in the previous section are solved but with reactions included, i.e.

Ca2+ wave propagation on the Cartesian grid in the presence of buffer and dye reactions. Snapshots are recorded at times 10, 40, 75, 110, 150, 200, 300, 350 and 700 ms (left to right, top to bottom). The colourbar denotes the Ca2+ concentration in

Ca2+ wave propagation on the curvilinear grid in the presence of buffer and dye reactions. Snapshots are recorded at times 10, 40, 60, 125, 225, 400, 500, 660 and 900 ms (top to bottom left to right). The colourbar denotes the Ca2+ concentration in

Ca2+ wave propagation in the presence of buffer and dye reactions. The spatial characteristics of the wave propagation are plotted at times 100, 200, 300 and 400 ms on the (a) Cartesian and (c) curvilinear domains. Output is given from five separate simulations.
The Ca2+ concentration increases rapidly initially thus a steep rise in the normalised fluorescent value. The concentration is high enough so that neighbouring sites will activate eventually leading to wave of Ca2+. As Ca2+ propagates from the region the concentration will decrease leading to a decrease in the normalised fluorescent values. There is a small delay from initially activated channels to the neighbouring channels becoming active which explains the next two phases in the profile of decreasing then increasing trend.
A large variation is observed in the sparks and blinks (Figure 11). The amplitude of the sparks range 41.3–53.46

Time courses of the Ca2+ wave propagation located at sensors 1–5. Cytosolic Ca2+ concentrations are plotted on the (a) Cartesian and (c) curvilinear domains. Similarly, sarcoplasmic Ca2+ concentrations are plotted on the (b) Cartesian and (d) curvilinear domains. See Figure 3 in previous section for the location of the sensors. Output is given from five separate simulations.
Discussion and conclusion
In this paper, the application of Ca2+ waves on curvilinear grids is successfully demonstrated with comparisons against the Cartesian case. This enables the quantitative analysis on Ca2+ sparks/blinks and waves by taking into account more realistic cell morphology. The in silico study undertaken here included BD and NBND systems to observe the Ca2+ wave characteristics on the different systems. It has been shown in the case of the NBND system that although not much variation was observed in the amplitudes of the cytosolic and sarcoplasmic Ca2+ concentration profiles, the computed wave velocity in the Cartesian case was much higher (almost twice as much) than that in the curvilinear case (which is closer to the experimentally observed value of 100
The formation and development of Ca2+ sparks into waves appear differently in the Cartesian and curvilinear grids. The wave propagation region appears to be more elongated in the y-direction for the curvilinear cases. This may be due to either the distribution of CRUs being grid dependent or the partially contracted state of the cell morphology making the distribution of CRUs in the bottom half of the domain more dense and coarser in the top half compared to that in the central part of the cell. In either case, having a curvilinear representation of the problem is a major contribution towards a more realistic cell shape which can handle more sophisticated shapes than the one presented here. The underlying algorithms used in the generation of the curvilinear domain ensure the conformal mapping of grid points. Although some regions will be densely or coarsely populated with grid points the CRDT algorithm maintains a relatively smooth distribution. Therefore, the distribution of CRUs will be dense or coarse in the respective regions accordingly. Having a spatially dependent distribution rather than a grid dependent one will make the curvilinear model more realistic since it is known that CRUs are longitudinally 2
A general buffer term was represented by a single ODE. However, it is known that Ca2+ can bind to buffers consisting of calmodulin, troponin C, binding sites on the SR and sarcolemmal (SL) membranes. Therefore, a more detailed model accounting for each of these buffers would improve this model. Additionally, Ca2+ bound buffers and dye in the SR have different reaction and diffusional properties than that in the cytosol. Therefore, an additional set of equations accounting for this would make this model more comparable to the real case scenario. For the sarcoplasmic Ca2+ concentration, an ODE has been used. However, diffusion is also present in this compartment so a PDE can be used to account for this.
Recently, it has been shown that cytosolic Ca2+ diffusion follows an anomalous subdiffusion. Fick’s Law is known to produce Ca2+ full-width at half maximum (FWHM) of 1
Footnotes
Acknowledgements
The authors are greatly thankful to fellow researcher, Christopher Beckwith, for his assistance on generating the orthogonal curvilinear grids and applying the 10th order compact finite difference scheme. The authors would also like to acknowledge the orthogonal grid generator (gridgen-c) provided by Pavel Sakov and CSIRO Marine Research (2006–2017). The code gridgen-c is available at ![]() .
.
Contributorship
All authors contributed equally to the conception, methodology implementation and manuscript drafting.
Declaration of conflicting interests
The author(s) declared no potential conflicts of interest with respect to the research, authorship, and/or publication of this article.
Funding
The author(s) disclosed receipt of the following financial support for the research, authorship, and/or publication of this article: This work was supported by a Vice-Chancellor’s PhD scholarship of the University of Greenwich (reference number: VCS-ACH-15–14).
Ethical approval
None.
Guarantor
SA.
Informed consent
Not applicable.
Trial registration
Not applicable.