
Abstract
Objectives
To compare the values of pulmonary regurgitation in patients with repaired Tetralogy of Fallot quantified from two-dimensional phase-contrast data, by using a new pixel-wise analysis and the standard velocity-averaging method.
Design
Quantitative in silico and in vivo analysis.
Setting
Hospital Sótero del Río. The magnetic resonance images were acquired using a Philips Achieva 1.5T scanner.
Participants
Twenty-five patients with repaired Tetralogy of Fallot who underwent cardiovascular magnetic resonance imaging requested by their referring physicians were included in this study.
Main outcome measures
Using a computational fluid dynamics simulation, we validated our pixel-wise method, quantifying the error of our method in comparison with the standard method. The patients underwent a standard two-dimensional phase-contrast magnetic resonance imaging acquisition for quantifying pulmonary artery flow. Pulmonary regurgitation fraction was estimated by using our pixel-wise and the standard method. The two-dimensional flow profiles were inspected looking for simultaneous antegrade and retrograde flows in the same cardiac phase. Statistical analysis was performed with t-test for related samples, Bland–Altman plots, and Pearson correlation coefficient.
Results
Estimation of pulmonary regurgitation fraction using the pixel-wise analysis revealed higher values compared with the standard method (39 ± 16% vs. 30 ± 22%, p-value <0.01). Eight patients (32%) had a difference of more than 10% between methods. Analysis of two-dimensional flow profiles in these patients revealed simultaneous antegrade and retrograde flows through the pulmonary artery during systole–early diastole.
Conclusion
Quantification of pulmonary regurgitation fraction in patients with repaired Tetralogy of Fallot through a pixel-wise analysis yields higher values of pulmonary regurgitation compared with the standard velocity-averaging method.
Keywords
Introduction
Tetralogy of Fallot (TOF) is the most common form of cyanotic congenital heart disease.1–3 Advances in diagnosis, surgical treatment, and postoperative care have been such that almost all those born with TOF can now expect to survive to adulthood.1,3 However, residual anatomic and hemodynamic abnormalities are nearly universal. 2
Pulmonary regurgitation (PR) is a frequent abnormality, induced by the deformity of the pulmonary artery valve annulus or the transannular patch enlargement after surgical repair of patients with TOF.4–6 Although PR is usually well tolerated in childhood, it is an important cause of late complications.1–3,7 Residual PR has been related to the most severe adverse outcomes including the right ventricular (RV) dilatation, biventricular dysfunction, progressive exercise intolerance, right heart failure, ventricular arrhythmia, and sudden death.1,4,5,8–11 Therefore, an accurate estimation of PR is essential to monitor patients and guide clinicians in determining the timing of re-intervention in patient with repaired TOF. 12
Cardiovascular magnetic resonance imaging (MRI) has evolved as the reference standard imaging modality for assessing anatomical and functional sequelae in patients with repaired TOF, such as PR.2,13,14 Nonetheless, the presence of vortices at the main pulmonary artery in patients with repaired TOF as shown by four-dimensional flow MRI15,16 may result in antegrade and retrograde flows simultaneously in the same cardiac phase. This situation may lead to erroneous estimation of forward and retrograde flows when using the standard method of two-dimensional (2D) phase-contrast MRI.
The erroneous estimation of PR fraction when using the standard velocity-averaging method is explained because blood velocities, obtained from 2D phase-contrast MRI, are averaged through the cross-sectional vessel area for each cardiac phase. 17 When the average blood velocity for one cardiac phase is positive, flow (i.e. averaged velocity multiplied per lumen area) will be registered as antegrade. Instead, if the average is negative, flow will be registered as retrograde. PR is then calculated using the regurgitation fraction, which is the ratio of retrograde net flow to antegrade net flow.2,5,10,12,18–20 Therefore, regurgitant flow will only be detected if the average blood velocity is negative at one or more cardiac phases.
It is clear that if antegrade and retrograde flows are both present through a vessel lumen at the same cardiac phase, for example in cardiac phases when the pulmonary valve is closing (last part of systole), 21 the averaging process will classify the flow as either antegrade or retrograde or null. Therefore, if the positive blood flow velocities have larger magnitudes than negative ones, it will result in underestimation of retrograde flow.
In this paper, we present a new pixel-wise analysis for calculating antegrade and retrograde flow components for each cardiac phase along the entire cardiac cycle. The aim of this study was to compare the values of PR fractions quantified from 2D phase-contrast data in patients with repaired TOF by using a pixel-wise analysis and the standard velocity-averaging method. We hypothesized that PR fractions would be significantly different between methods due to simultaneous antegrade and retrograde flows within the same cardiac phase.
Materials and methods
Standard velocity-averaging method
Flow is calculated through the standard method by using average blood velocities during each cardiac phase to estimate a mean velocity value, which is then multiplied by the vessel area. The vessel area is obtained from the region of interest (ROI) created. A positive mean velocity value represents antegrade flow, whereas a negative value depicts a retrograde flow. Antegrade net flow is equal to the sum of all antegrade flows throughout all the phases of the cardiac cycle (light gray area, Figure 1(a)), while retrograde net flow is equal to the sum of all retrograde flows during a whole cardiac cycle (dark gray area, Figure 1(a)). Over the entire cardiac cycle, net flow is estimated by subtracting retrograde net flow from antegrade net flow. Regurgitation fraction represents the ratio of retrograde net flow to antegrade net flow.

Quantification of pulmonary regurgitation. (a, b) Two perspectives of a flow curve where simultaneous antegrade (light gray area) and retrograde (dark gray area) flows are present from cardiac phases 8 to 16 (at time 0.23 to 0.47, respectively). Regurgitation fraction is the ratio of retrograde net flow (dark gray area) to antegrade net flow (light gray area). (a) The standard velocity-averaging method masks the retrograde flow from phases 8 to 10, because positive blood velocities have higher magnitudes than negative blood velocities. Regurgitation fraction is 10.7% in this case. (b) Since the pixel-wise analysis estimates antegrade and retrograde flows individually, retrograde flow from phases 8 to 10 is still quantified, although positive blood velocities have higher values than negative velocities. Regurgitation fraction is 19.2% in this case. (c) A cross-sectional example from ninth cardiac phase (green dashed lines in (a) and (b)) showing how blood flow is calculated by both methods. Light gray squares represent pixels with positive blood velocities and dark gray squares the negative blood velocities. In this example, the averaging process of the standard method determines that the positive velocities mask negative ones. This does not occur with the pixel-wise analysis. Note that the net flow is equal between methods, because we assumed a contour area that is equal to the sum of the pixel areas.
Pixel-wise analysis
Pixel-wise analysis calculates flow by multiplying the pixel velocity on each pixel times the pixel area. A positive pixel velocity represents antegrade flow, whereas a negative value depicts a retrograde flow. Antegrade net flow is the sum of all pixels with antegrade flow through the cardiac cycle (light gray area, Figure 1(b)), and retrograde net flow is the sum of all pixels with retrograde flow (dark gray area, Figure 1(b)). Over the entire cardiac cycle, net flow is estimated by subtracting retrograde net flow from antegrade net flow. Regurgitation fraction represents the ratio of retrograde net flow to antegrade net flow.
In cases where there was a difference large or equal than 10% between both methods, 2D flow profiles were inspected looking for simultaneous antegrade and retrograde flows in the same cardiac phase which might explain the detected differences.
Validation analysis
One pulsatile computational fluid dynamics (CFD) simulation (Figure 2) was created using the software ANSYS® Fluent, Release 15.0. The simulation considered a tube with a collateral vessel to induce a retrograde flow (Retrograde Flow Model) (Figure 2(a) and (b)), like the one described by Sutalo et al. 22
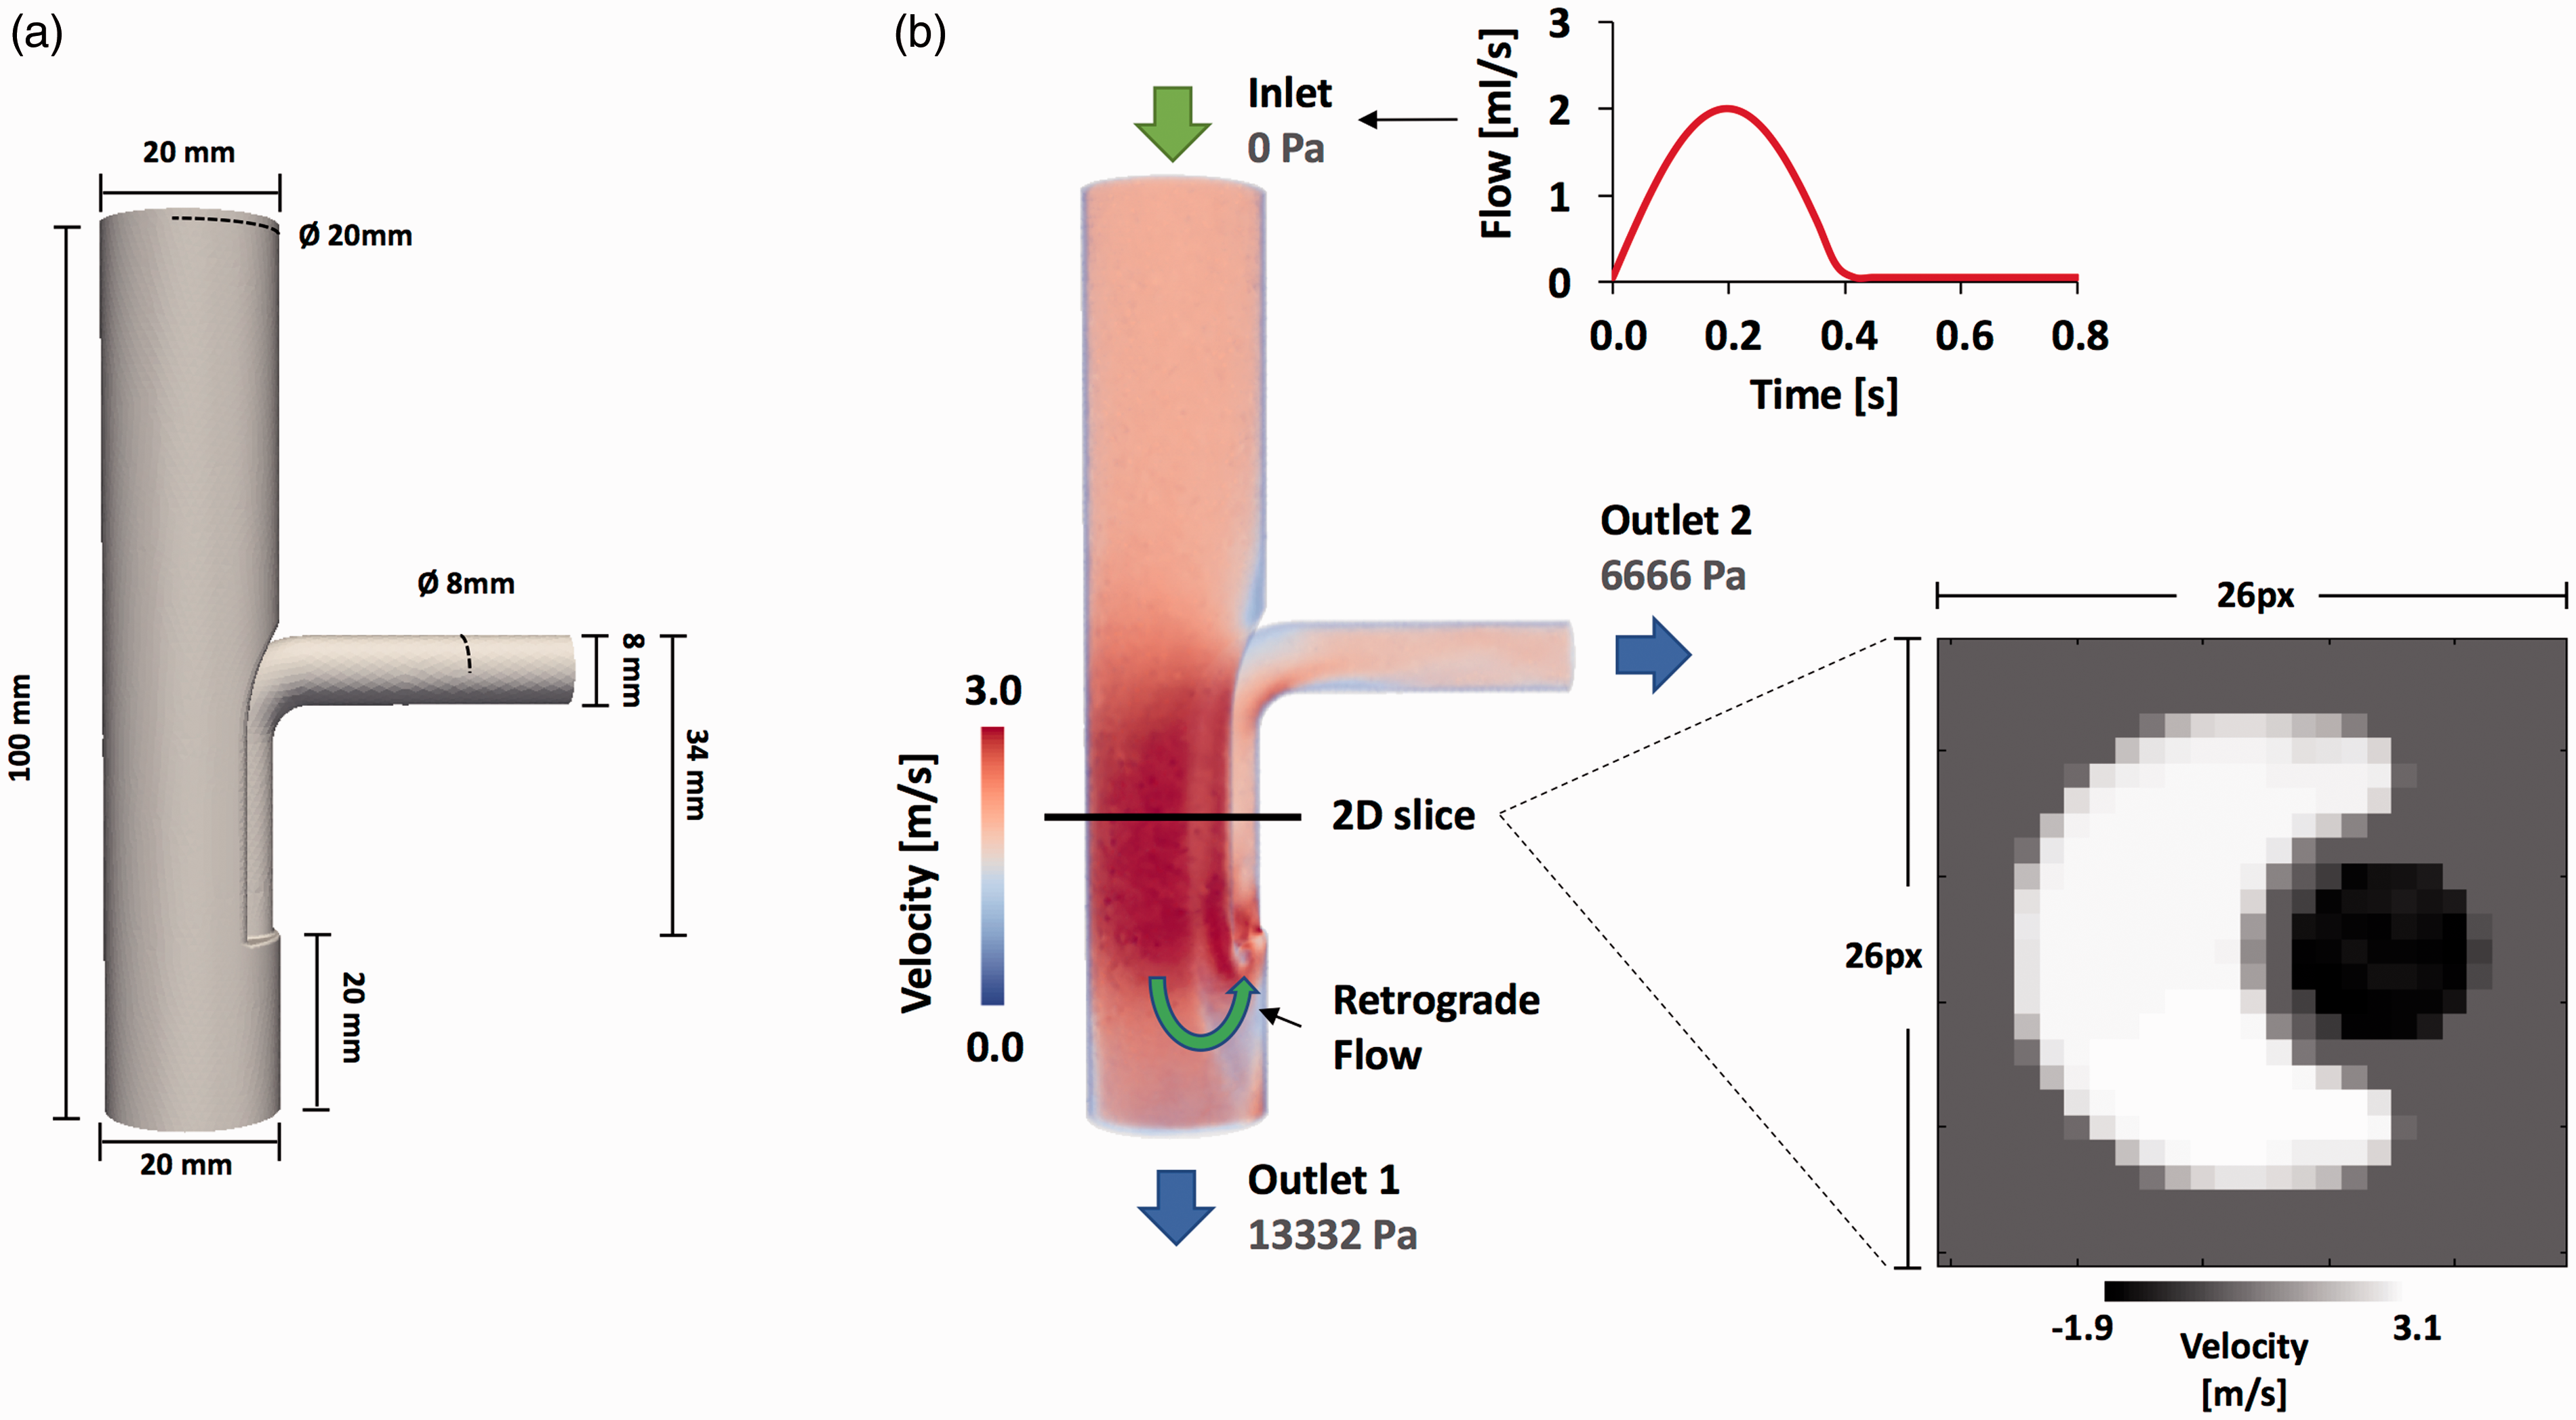
3D model and velocity magnitude of CFD pulsatile simulation. (a) The geometry of the 3D Retrograde Flow Model. In (b) we show the velocity magnitude in systolic phase and additionally the reformatted 2D section that we transform in 2D images, in which we compared the regurgitation fraction obtained by our method with the standard method. We also show in (b) the velocity wave setting in the inlet face of the model.
The flow domain is discretized using tetrahedral elements with a mean characteristic length of 1 mm (91,503 nodes and 493,042 elements). We prescribe the time variation of velocity (Figure 2(b)) at the inlet surface with a mean value of 0.63 m/s and a peak velocity value of 2 m/s, the fluid viscosity to 0.0035 N s/m3 and the fluid density to 1060 kg/m3. Additionally, we consider a static wall at the boundary and enforce a no-slip condition. The pressure (in Pascal) setting in the outlet surface is shown in Figure 2(b).
To be consistent with the image application, we generated one 2D section at the level of the collateral to create a 2D phase-contrast MRI from the CFD simulation result (Figure 2(b)). The velocity was transferred from the 2D section mesh to each pixel of the image using a linear interpolation. Each pixel of the image was set to a resolution of 1 × 1 mm, and the data are processed using an in-house Matlab library (The MathWorks, Natick, MA, USA).
In vivo study
Twenty-five patients with repaired TOF who underwent cardiovascular MRI requested by their referring physicians were included in this study. Table 1 summarizes the clinical data of the patients. The institutional review board approved the study and informed consent was obtained from all subjects or their guardians.
Patient demographics (repaired TOF), surgical procedures, and pulmonary trunk geometry.

BSA: body surface area; TOF: Tetralogy of Fallot; VSD: ventricular septal defect.
MRI protocol
Images were acquired using a Philips Achieva 1.5T scanner (Philips Healthcare, Best, The Netherlands). Patients with repaired TOF underwent a standard cardiac MRI examination using a five-element cardiac coil for signal reception. A 2D phase-contrast sequence acquired at the main pulmonary artery (5 mm over the sinus level) and during free breathing was used for the purpose of the study. Imaging parameters for 2D phase-contrast sequence were as follows: repetition time = 4.4 ms, echo time = 2.4 ms, flip angle = 15°, acquired voxel sixe = 2.43 × 2.43 × 8 mm, reconstructed voxel size 1.37 × 1.37 × 8 mm, number of acquired signals = 3, velocity encoding = 100–200 cm/s, and retrospective cardiac gating with 30–40 reconstructed cardiac phases.
Image analysis
The 2D phase-contrast data processing at the main pulmonary artery was performed using the commercially available software “GTFlow” version 2.0.4 (Gyrotools LLC, Zurich, Switzerland).
An ROI was created surrounding the pulmonary artery, which was manually adjusted throughout the cardiac cycle to analyze the data. Thereafter, values of antegrade flow, retrograde flow, net flow, and regurgitation fraction were calculated with the standard method and the pixel-wise analysis (see Figure 1).
Statistical analysis
Power analysis
Power analysis was conducted to estimate the sample size needed to provide 80% power and a 5% significance level for detecting a mean difference of ±10% in the PR fraction. Because there was no previous report about the standard deviation of the differences and the correlation between both methods in patients with repaired TOF, a pilot sample of 22 patients was used to obtain these values. The analysis revealed that a sample size of 25 patients would provide an 80% statistical power for detecting a mean difference of ±10% (standard deviation of the differences = 11.7%, correlation coefficient r = 0.84). These calculations were performed using the PASS 11 software (NCSS, Kaysville, Utah, USA).
Data analysis
Data were analyzed by using SPSS software, version 19.0 (SPSS, Chicago, IL, USA). Results were expressed as means ± one standard deviation. A two-tailed t-test for related samples was used to compare PR values and net flows obtained by the pixel-wise analysis and the standard method. Statistical significance was set at p < 0.05. A Pearson correlation coefficient was calculated to estimate the correlation between net flows obtained by both methods. Additionally, Bland–Altman plots were also used to evaluate the differences in PR values between both methods. Limits of agreement were defined as the mean difference ±1.96 times the standard deviation of the differences.
Results
Validation analysis
The analyzed 2D section (Figure 2(b)) for the validation process showed a PR fraction of 9.76% and 28.67% for the standard and pixel-wise method, respectively, in comparison with the theoretical values 26.8% obtained by CFD, measurement in the outlet 2. The pixel-wise method showed a better approximation to the real values. Figure 3 shows the flow wave curve obtained with both methods. It can clearly be seen that the temporal underestimation of the retrograde flow in the systolic phases is produced by the standard method.

Flow wave curves. (a) Flow measurement with the standard method and (b) flow measurement with our pixel-wise method. Additionally, we show the volume of the forward and backward flow curve measurements for both methods. For (a) we calculated a pulmonary regurgitation fraction of 9.73%. For (b) we calculate a pulmonary regurgitation fraction of 28.67%.
In vivo study
The estimated PR fraction using the standard method was 29.7 ± 21.2%, vs. 38.7 ± 16.3% using the pixel-wise analysis, and we found statistically significant difference between both methods with p-value <0.01. The Bland–Altman plot (Figure 4(a)) showed a mean difference of 8.93% across patient, i.e. there was a systematic bias, with greater PR fractions obtained by the pixel-wise analysis. The mean difference between both methods was 8.9% ± 11.3%, ranging from −1.1% to 37.7%. Eight patients (32%) had a mean difference of more than 10%. Analysis of 2D flow profiles from these patients revealed simultaneous antegrade and retrograde flows through the pulmonary artery during systole (Figure 4(b) and (c)).

(a) Bland–Altman plot showing the mean difference between values of pulmonary regurgitation obtained by both methods. The graph demonstrates a systematic bias, with greater values of pulmonary regurgitation obtained by the pixel-wise analysis. (b, c) 2D flow profiles at 20% of the cardiac cycle from patients whose PR fraction showed a difference of more than 10% between methods. Images show simultaneous antegrade flow (arrow) and retrograde flow (arrow head) in the same cardiac phase. (b) 2D flow profile from a 14-year-old female (difference between methods = 23.5%). (c) 2D flow profile from a 20-year-old male (difference between methods = 37.7%).
The estimated net flow at the main pulmonary artery using the standard method was 63.6 ± 19.8 ml, vs. 65.3 ± 19.9 ml using the pixel-wise analysis. We also found statistically significant difference between methods (p < 0.01). The mean difference between methods was 1.7 ± 1.8 ml, ranging from −1.3 to 5.5 ml. The correlation coefficient (r value) between net flows obtained with both methods was 0.996 (p < 0.01).
Discussion
Our results showed that in some patients with repaired TOF the estimation of PR fraction by using the standard velocity-averaging method yields lower values compared with the pixel-wise analysis. This difference was explained by the presence of simultaneous antegrade and retrograde flows in at least one cardiac phase, induced by the passive closure of the pulmonary valve. 21 Interestingly, a difference between methods greater than 10% was detected in approximately one-third of our study population.
We validated our method using a CFD simulation. This example allowed us to demonstrate a temporal underestimation of the retrograde flow when using the standard method.
Since PR has been related to right heart failure, ventricular arrhythmia, and sudden death in patients with repaired TOF,1,4,9 accurate quantification of PR fraction is a major issue for this population. Furthermore, timely pulmonary valve replacement has been shown to improve RV function, to offer symptomatic benefit and, in conjunction with intraoperative cryoablation, to decrease the incidence of preexisting atrial and ventricular tachyarrhythmia.23,24 Therefore, underestimation of PR fraction might lead to not recommending timely pulmonary valve replacement.
Accurate estimation of PR fraction in patients with repaired TOF might be difficult to achieve, especially in those patients with complex flow dynamics at the main pulmonary artery. By using four-dimensional flow MRI, it has been shown that patients with repaired TOF commonly present complex flow patterns at the pulmonary artery, such as vortices.15,16 These vortices could explain the presence of simultaneous antegrade and retrograde flows at some cardiac phases, and therefore the lower values of PR fractions obtained by the standard method. In this situation, it might be reasonable to think that a pixel-wise analysis will provide a more accurate estimation. Nonetheless, the degree of flow rotation must be considered to calculate the PR fraction precisely.
Theoretically, if flow rotates less than 360° during the cardiac cycle, the standard method might mask regurgitation flow, as long as the flow velocities from antegrade flow have higher magnitude. Therefore, the pixel-wise analysis would provide a more accurate estimation of PR fraction in this situation. However, if flow rotates more than 360° (but less than 540°), the PR fraction estimated by a pixel-wise analysis will not provide an accurate value, because the retrograde flow keeps rotating and goes finally forward again. In this setting, the pixel-wise analysis would quantify regurgitant flow that is not going finally back to the ventricle, overestimating the PR fraction. The standard method should be preferred in this scenario. The situation switches once again if flow rotates between 540° and 720°, with the pixel-wise analysis providing a more accurate value in this setting. Therefore, if antegrade and retrograde flows are simultaneously present due to vortices at the main pulmonary artery, an accurate estimation of PR fraction should take into account the degree of flow rotation to properly select the best method.
Nonetheless, quantifying flow rotation is not a simple issue. Geiger et al. 16 provided a framework to quantify the flow rotation at the main pulmonary artery of patients with repaired TOF using four-dimensional flow MRI. By consensus reading, patients were classified into three categories: patient with no vortex in the main pulmonary artery, patients with moderate vortex (flow rotation <360°), and patients with pronounced vortex (flow rotation >360°). Although this method could help to properly select the method for quantifying PR fraction, the analysis requires a four-dimensional flow acquisition, and seems to be time consuming and hard to perform. Further research should focus on developing tools to quantify the flow rotation automatically, which would allow identifying the subgroup of patients in whom PR fraction must be calculated using a pixel-wise analysis or the standard method.
Another finding of our results is that the net flow was significantly different between methods. Although this difference was statistically significant, it seems not to be clinically relevant due to the small difference values (mean difference: 1.7 ± 1.8 ml; range: −1.3–5.5 ml). Theoretically, net flow calculated by both methods should be equivalent, but a difference may exist because the approach to calculate the area of the vessel is slightly different for both cases. For the standard method, the area used to calculate flow rate is the area of the ROI. Instead, for the pixel-wise analysis the area is calculated as the sum of the areas of individual pixels contained fully or partially in the ROI.
The main limitation of the present study is the lack of a true reference standard technique for quantifying regurgitation fraction, 25 which does not allow to evaluate the accuracy of the measurements obtained by both methods. However, theoretically the pixel-wise analysis should provide a more accurate estimation in some patients with repaired TOF and the standard velocity-averaging method in others, depending on the degree of flow rotation. Because it is not possible to validate any of the methods vs. a gold standard or calculate the flow rotation easily, both methods should be always used. If the difference between both methods is larger than 10% caution should be taken about the results and their interpretation. Furthermore, a difference larger than 10% should raise the question whether the standard velocity-averaging method or the pixel-wise analysis is more accurate to calculate the PR fraction in a particular case.
In conclusion, quantification of PR fraction in patients with repaired TOF through a pixel-wise analysis yields higher values of PR compared with the standard velocity-averaging method. A pixel-wise analysis should also be considered in patients with repaired TOF who have simultaneous antegrade and retrograde flows at the main pulmonary artery within a cardiac phase, because the standard velocity-averaging method may lead to underestimation of the PR fraction depending on the degree of flow rotation.
Footnotes
Acknowledgements
The authors are grateful to all subject and their guardians who have accepted to take part in this study.
Declaration of conflicting interests
The author(s) declared no potential conflicts of interest with respect to the research, authorship, and/or publication of this article.
Funding
The author(s) disclosed receipt of the following financial support for the research, authorship, and/or publication of this article: CONICYT – PIA – Anillo ACT1416, CONICYT FONDEF/I Concurso IDeA en dos etapas ID15|10284, and FONDECYT #1141036. JS thanks to FONDECYT de Postdoctorado 2017 #3170737
Ethical approval
The study was approved by the Hospital Dr. Sçero del Rio Research Ethics Committee. The study complies with the Declaration of Helsinki and its later amendments. All participants over eighteen years gave written informed consent, and for the participants under eighteen years the informed consent was signed by their guardians.
Guarantor
Sergio Uribe.
Contributorship
JS and PB performed the image processing analysis, statistical analysis and drafted the manuscript. LT, MF and SU, designed the study protocol, performed data acquisition. GC gives us access to the GTFlow software. JU, IV, MA, CT, PI, and SU, revised the manuscript and participated in the scientific discussion during the study. All authors read and approved the final manuscript.