
Abstract
Background
Recombinant human erythropoietin (rhuEPO) has received considerable attention because of its neuroprotective properties. It has recently been reported that rhuEPO increases frataxin levels in combination with clinical improvement in rhuEPO treated patients with Friedreich ataxia (FRDA).
Purpose
To determine possible therapy dependent intracranial volume changes after treatment with rhuEPO using voxel-based morphometry (VBM).
Material and Methods
Nine FRDA patients were scanned on the same 1.5-Tesla MRI scanner before and after treatment with rhuEPO. FRDA patients received 5000 IU rhuEPO thrice weekly subcutaneously for a time period of 8 weeks followed by 2000 IU thrice weekly over 6 months. To test for re-test reliability a control group of 12 healthy volunteers were scanned twice on the same scanner without rhuEPO treatment. Neurological state was defined by the Friedreich Ataxia Rating Scale (FARS) and the Scale for the Assessment and Rating of Ataxia (SARA). Statistical parametric mapping software was used for image processing and statistical analysis.
Results
When comparing follow-up scans after rhuEPO treatment with baseline scans (P <0.001 uncorrected) an increase of gray matter volume was observed bilaterally in the Pulvinar and the posterior parietal cortex. Moreover, clinical improvement detected using specific Ataxia scores correlated with VBM results in the pulvinar.
Conclusion
Given the limitation of a small sample size, our study confirms previous findings that MRI may serve as reliable biomarker in neurodegenerative diseases as well as in monitoring of microstructural changes representing disease progression and/or therapy effects.
Introduction
Friedreich ataxia (FRDA) is the most common inherited ataxia and in most cases due to a gene repeat expansion which provides instructions for producing an enzyme called “glucosidase alpha acid” (GAA) on chromosome 9q13 coding for a mitochondrial protein named Frataxin (1).
Neuropathological studies have shown that FRDA is characterized by neuronal loss and white matter (WM) tract degeneration in the spinal cord, brainstem and cerebellum (2). A magnetic resonance imaging (MRI) study using voxel-based morphometry (VBM) in FRDA patients revealed symmetrical volume loss in dorsal medulla and cerebellum as compared to controls. Both atrophy of the cerebellum and medulla correlated with clinical severity and disease duration (3).
Recombinant human erythropoietin (rhuEPO) has received considerable attention because of its neuroprotective and cardioprotective properties (4–8). An in vitro study found that rhuEPO increases frataxin levels in isolated lymphocytes from FRDA patients. Subsequently, we were able to show significant increase in frataxin-levels in FRDA patients treated with rhuEPO in a two months “proof-of-concept” study and clinical improvement in a 6-month follow-up study (9–11). Furthermore a recent diffusion tensor imaging (DTI) study (12) revealed rather unspecific increase in fractional anisotropy (FA) in the cerebral hemispheres bilateraly in FRDA patients after rhuEPO treatment.
VBM is designed to detect significant regional MRI signal differences in vivo by applying voxel-wise statistics in the context of Gaussian random fields (13–15). The aim of this study was to detect therapy dependent intracranial volume changes using VBM in FRDA patients after treatment with rhuEPO.
Material and Methods
Subjects
Demographic and clinical parameters of study participants.

Patient ID in accordance with prior publication on this sample (11).
*Age at study entry.
DD, disease duration (years); FARS, Friedreich Ataxia Rating Scale; GAA, number of trinucleotide repeats on the shorter allele; SARA, Scale for the Assessment and Rating of Ataxia.
Study design
In an open-label, phase II, proof-of-concept study FRDA patients received 5000 IU rhuEPO thrice weekly subcutaneously for a time period of 8 weeks followed by 2000 IU rhuEPO thrice weekly over 6 months (9). The healthy control group received no rhuEPO.
MR assessment
MR assessment was performed according a predefined protocol before and after treatment with rhuEPO. Additional exclusion criteria for MR assessment were metal in the body that precludes MRI and agoraphobia. The MR assessment of the healthy control group was performed in an interval of 2 months (baseline scan, follow-up scan 2 months later). All MRI scans were proofed by an experienced radiologist (MS) to avoid structural abnormalities or artifacts.
Data acquisition
All participants were scanned on the same 1.5 Tesla MRI scanner (Magnetom Avanto, Siemens, Erlangen, Germany) using a T1-weighted 3D sequence with a repetition time (TR) of 9.7 ms, an echo time (TE) of 4 ms, a matrix size of 256 × 256, and a field of view of 230 mm. The resulting sagittal slices had a thickness of 1.5 mm and an in-plane resolution of 0.98 × 0.98 mm.
Voxel based morphometry (VBM)
Statistical parametric mapping software (SPM2; The Wellcome Department of Cognitive Neurology, London, UK) was used for image processing and statistical analysis. We applied the optimized VBM protocol to the image data as reported by Good et al. (15). This protocol includes a study specific template, extraction of miss-segmented areas and the modulation of the data with the Jacobian determinants.
The creation of the study group-specific template was performed to minimize the scanner specific bias by averaging all images from the study specific subject group, after being normalized using linear 12-parameter affine-only transformation. Custom tissue probability maps were obtained by segmenting the individual normalized images into gray matter (GM), white matter (WM), and cerebrospinal fluid (CSF), averaging and smoothing with an isotropic Gaussian kernel of 8 mm full-width at half maximum (FWHM).
The optimized VBM protocol includes two segmentation steps. First segmentation was performed in native space and non-brain tissue was removed automatically by modulation with an individually derived brain-tissue mask. Second segmentation was performed after applying the normalization parameters to the original whole brain images (as described below) including once again removing of non-brain tissue followed by re-slicing onto a voxel size of 1 × 1 × 1 mm.
The spatial normalization parameters were estimated by matching the native spaced individual GM image with the study-specific GM template using combined 12 parameter linear and non-linear (7 × 9 × 7 basic functions) transformation. The parameters resulting from this spatial normalization step were then reapplied to the original structural images.
Multiplying voxel values of the segmented images with the Jacobian determinants was implemented to convert the GM segments into measures of absolute gray matter volume (GMV), as opposed to relative GMV, following spatial normalization.
Finally, all modulated images were smoothed with a 10 mm FWHM Gaussian kernel to reduce confounding by individual variation in gyral anatomy. This also has the effect of rendering the data more normally distributed (by the central limit theorem) (13,14).
Smoothed and segmented gray matter partitions have been subjected for statistical analysis choosing the factorial design “paired t-test”.
The statistical parametric maps were thresholded at P uncorrected <0.001 with an extent threshold of 20 contiguous voxels. Finally, smoothed GM segments were entered into a voxel-based multiple regression analysis to investigate linear correlations between GM volume and primary clinical outcome measures (FARS and SARA) (10).
Results
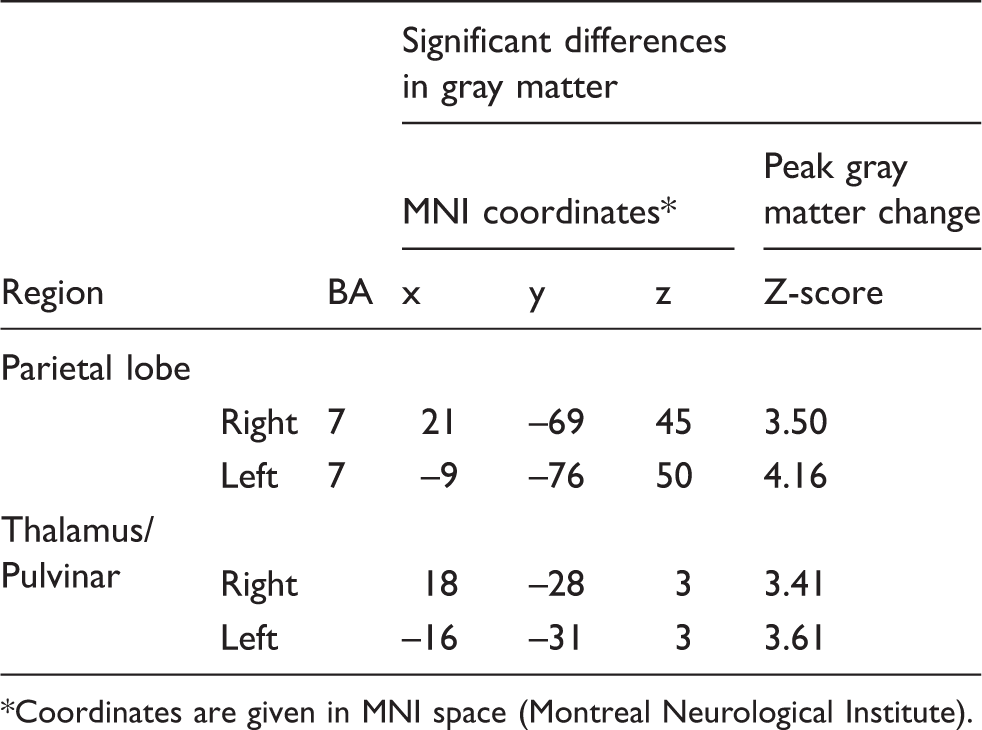
When comparing the follow-up scans after treatment with recombinant human erythropoietin (rhuEPO) with the baseline scans an increase of GMV (Table 2) was observed bilaterally in the posterior part of the thalamus (pulvinar) (Fig. 1) and in the posterior parietal lobe (Brodmann area 7) (Fig. 2) (P < 0.001 uncorrected).
Areas of subcortical GMV increase when baseline MR scans of patients with Friedreich ataxia are compared to the follow-up scans after treatment with recombinant human erythropoietin (rHuEPO). Results are superimposed on the slices of a T1-weighted mean-picture (a) axial, (b) coronal, and on the slices of a modulated mean picture (c) sagital, (d) coronal, (e) axial of all study participants. The color bars give the corresponding Z-scores. Threshold was set at T = 3.4 (corresponding to a P value of <0.001 uncorrected). Results in SPM render-style show areas of cortical GMV increase when baseline MR scans of patients with Friedreich ataxia are compared to the follow-up scans after treatment with recombinant human erythropoietin (rHuEPO). Threshold was set at T = 3.4 (corresponding to a P value of <0.001 uncorrected). Relative increase of gray matter volume in patients with Friedreich ataxia after treatment with recombinant human erythropoietin (rHuEPO) relative to baseline examination before treatment (P < 0.001 uncorrected). *Coordinates are given in MNI space (Montreal Neurological Institute).

There were no regions showing significant decrease in GMV, and there was no significant group difference in white matter volume (WMV).
Correlation analysis (Spearman rank correlation analysis performed with SPSS, Version 15; SPSS Inc., Chicago, IL, USA) for FRDA patients revealed an association between age at onset of disease and GAA repeat length (R = −0.927, P = 0.003). Voxel-based multiple regression analysis showed that there were significant correlations between GMV in rather unspecific cortical and subcortical structures and individual clinical ataxia scores such as SARA and FARS. Additionally, scores in SARA and FARS showed a significant negative correlation (P < 0.001 uncorrected) with increased GMV in the pulvinar and posterior parietal cortex bilaterally. The healthy control group showed no significant change of GMV (P < 0.001 uncorrected).
Discussion
In the last years, the non-erythroid, especially neuroprotective functions of EPO have been increasingly recognized. These functions probably base on suppression of apoptosis and promotion of neurogenesis, as suggested by several experimental animal studies (18–26).
In the present study, we report on a volume increase in the dorsal thalamus (Pulvinar) measured with the help of VBM in a patient collective with FRDA, receiving EPO over a period of several months. As our initial VBM analysis had shown no changes in primary disease-specific areas (e.g. cerebellum), we also looked for supratentorial changes, in accordance with previously published DTI results (12) within the same study collective. This pulvinar volume increase correlated with an improvement in ataxia rating scales. Additional significant volume increase was found in the posterior parietal cortex, where higher association areas are in permanent interaction with the pulvinar. Parietal association areas play a major role in linking incoming sensory information with the primary motor area. This is of major interest, as FRDA is an autosomal-recessive neurodegenerative disorder mainly affecting sensory neurons in the dorsal root ganglia as well as the spinocerebellar tract, pyramidal tract and the dorsal columns (27).
Underlying mechanisms of dynamic structural alterations detected by VBM are not entirely clear. Macroscopic alterations may be based on changes at the level of synaptic bulk, or they might include increased cell genesis of glial and/or neuronal cells. EPO has been shown to enhance the levels of BDNF (brain derived neurotropic factor) (28) which results in an improvement of the mTOR (mammalian target of rapamycin) pathway, representing an integral cell growth regulator (29), which might result in changes of cellular volume.
Another study administering large systemic doses of rhEPO in mice revealed transient enhancement of hippocampal neurogenesis (30).
PET studies investigating glucose metabolism in FRDA patients have shown that glucose metabolism is initially increased in several brain regions like brain stem, cerebellum, and thalamus and declines with disease severity (31). Alternatively, altered regional volume as measured in our VBM study might therefore be related to an improvement of energy supply in the dorsal thalamus.
Since our healthy control group showed no significant changes over time, it can be assumed that VBM with longer intra-individual scan intervals is a stable method. This finding is in accordance with a recent study showing that regional GMV was relatively stable within the same scanner, but can significantly change when comparing images acquired on different scanners (32).
Given the limitation of small sample size in this pilot study further confirmation of our findings are of major interest. Future interventional animal studies combining structural and functional MRI with histological verification are needed to enlighten the impact of MRI in monitoring of microstructural changes representing disease progression and/or therapy effects.
In conclusion, our study confirms previous findings that MRI may serve as reliable biomarker in neurodegenerative diseases as well as in monitoring of microstructural changes representing disease progression and/or therapy effects.