
Abstract
Background
eHealth programs can lower blood pressure but also drive healthcare costs. This study aims to review the evidence on the effectiveness and costs of eHealth for hypertension and assess commonalities in programs with high effect and low additional cost.
Results
Overall, the incremental decrease in systolic blood pressure using eHealth, compared to usual care, was 3.87 (95% confidence interval (CI) 2.98–4.77) mmHg at 6 months and 5.68 (95% CI 4.77–6.59) mmHg at 12 months’ follow-up. High intensity interventions were more effective, resulting in a 2.6 (95% CI 0.5–4.7) (at 6 months) and 3.3 (95% CI 1.4–5.1) (at 12 months) lower systolic blood pressure, but were also more costly, resulting in €170 (95% CI 56–284) higher costs at 6 months and €342 (95% CI 128–556) at 12 months. Programs that included a high volume of participants showed €203 (95% CI 99–307) less costs than those with a low volume at 6 months, and €525 (95% CI 299–751) at 12 months without showing a difference in systolic blood pressure. Studies that implemented eHealth as a partial replacement, rather than addition to usual care, were also less costly (€119 (95% CI –38–201 at 6 months) and €346 (95% CI 261–430 at 12 months)) without being less effective. Evidence on eHealth programs for hypertension is ambiguous, heterogeneity on effectiveness and costs is high (I2 = 56–98%).
Conclusion
Effective eHealth with limited additional costs should focus on high intensity interventions, involve a large number of participants and use eHealth as a partial replacement for usual care.
Keywords
Introduction
Hypertension is the strongest modifiable risk factor for cardiovascular disease and the leading cause of death worldwide. However, its global prevalence and associated cardiovascular complications have not been reduced, partly due to inadequacies in prevention, diagnosis and control. 1 Merely half of the adults with hypertension is aware of their condition, little over one in three were treated and as little as 14% had their blood pressure under control. 2 The emergence of new technologies could play an important role in improving these numbers. 1 , 3 Digital health and eHealth, and more specifically home or telemonitoring, are the most promising emerging strategies, providing participants with the opportunity to transfer physiological data such as blood pressure values remotely. 4 However, adding technological innovation might drive healthcare costs upwards. Evidence on success factors for low-cost, high-effect eHealth strategies for patients with hypertension is scarce and ambivalent. 5 , 6
In home blood pressure telemonitoring for hypertension, patients measure their blood pressure at home using medical devices. Ideally, values are remotely checked by a healthcare team, enabling swift therapeutic action. Evidence suggests that home monitoring of blood pressure through eHealth, if combined with additional support such as telecounselling or digital feedback, significantly lowers blood pressure in patients with hypertension compared to usual care. 3
However, eHealth strategies for home monitoring of blood pressure can be costly. Additional cost drivers in home blood pressure monitoring programs include hardware and software for each patient to allow them to perform measurements at home, the infrastructure to transfer results to a remote server and a dedicated team to monitor incoming data, and act on them. 7 , 8 eHealth therefore requires new payment schemes that take additional (short-term) cost into account. On the other hand, prevention of cardiovascular events could significantly lower long-term costs. So far, the lack of adequate reimbursement schemes, leading to financially unsustainable eHealth programs, has prevented home monitoring from general and successful implementation into daily care. 9 This led to our primary research question: what are the differences in incremental effectiveness and costs of eHealth interventions for patients with hypertension, compared to usual care? Secondly, we investigated common characteristics in high-effect, low-cost eHealth programs.
Methods
Data sources and search
This paper has been prepared in adherence to the Preferred Reporting Items for Systematic Reviews and Meta-Analyses (PRISMA) reporting guideline. 10
We searched the Pubmed, Cochrane and NIHR-HTA databases for studies in April 2020. The search was developed iteratively for synonyms of ‘hypertension’, ‘home monitoring’ and ‘cost-effectiveness’, using both controlled vocabulary (i.e. MeSH) and free text words (search strategy in supplementary materials). Paediatric studies, case reports and reviews were excluded. We cross-checked the reference lists and the cited articles of the identified relevant papers for additional references.
Study selection
Studies were considered for inclusion if they fulfilled the following criteria: (a) they described a randomised controlled trial; (b) participants were diagnosed with hypertension; (c) a home monitoring or self-management infrastructure was compared with usual care; (d) the costs of the intervention were described; and (e) the minimal follow-up was at least 6 months. Studies should at least describe the difference in costs and systolic blood pressure (SBP) between baseline and follow-up for both intervention and usual care. The home or self-management infrastructure should be used for monitoring rather than diagnostic purposes and should be continuously used during the length of the study.
All identified studies were checked for eligibility for inclusion by two researchers (SB and ELL) based on title and abstract. Thereafter, the remaining potentially eligible studies were read in full and uncertainties were discussed by two authors (SB and ELL). Disagreements concerning eligibility were resolved by discussion.
Data extraction and quality assessment
Data were extracted from the report of each trial on study design, publication year, number of included subjects, type of eHealth intervention, inclusion criteria of trial participants, costs and cost calculations and relevant endpoints as described above. If a study consisted of several comparisons between groups, for example, different interventions, they were interpreted as separate studies.
To describe costs, we used the difference in total healthcare costs in Euros (€) during the study period. If costs were reported in other currencies than Euros, they were recalculated using the current currency rate as described by www.xe.com. We defined effectiveness as the change in mean SBP in mmHg in the study period. The various interventions were compared on the incremental costs and SBP change separately.
For our statistical analysis we needed the mean change in SBP and costs including standard deviation (SD) and number of participants for the intervention and control group. Missing data were handled as described in the corresponding chapters of the Cochrane Handbook.
11
If instead of SDs only confidence intervals (CIs) were available, SDs were calculated using the following formula:

If no SDs for the change between baseline and follow-up were available, they were calculated, using the following formula:

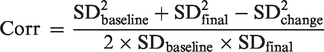
The correlation coefficient (Corr) was imputed from a comparable study, and was the average of the correlation coefficient in the experimental group and the control group, using the following formula:
If the standard error (SE), but not the SD was available, the SD was calculated using the following formula:

If the SD of baseline, but not of follow-up data was available, the baseline SD was also used for follow-up. If data on effect and costs were presented but SD, SE and CIs were missing, the weighted average of the SD of other studies was used.
Based on literature on economics of eHealth we scored studies on three parameters: intensity of intervention, volume of participants and replacement of usual care. We then assessed whether studies that showed low additional costs and high additional effect had these parameters in common.
Intensity of intervention
While all eHealth systems are characterised by patient education, instructions and remote control, the extensiveness of those aspects differs from program to program. We classified all studies as intensive or non-intensive, based on a previously described intensity classification. 3 , 12 Intensive intervention was defined as self-monitoring with active intervention or self-monitoring with tailored support, for instance on education and feedback, and non-intensive as self-monitoring with no or automated instructions or feedback. 12
Volume of participants
While upfront investment costs to set up a digital eHealth infrastructure might be considerable, fixed and variable costs change very little per additional patient compared to usual care. 13 , 14 Therefore, an increasing number of participants of an eHealth program might decrease costs per patient (economy of scale). We calculated the average number of participants in the collected studies and compared the studies with a larger than average population with the smaller ones.
Replacing usual care
Through eHealth technologies, patients are enabled to upload patient data remotely to their care providers, thereby replacing or minimising time-consuming and costly face-to-face consultations. 14 However, evidence on, for instance, the adverse effects of replacing usual care with eHealth is limited. 15 Therefore, current programs either replace (parts of) usual care by, for instance, decreasing the amount of visits to general practitioner or outpatient clinics for patients participating in eHealth, or are used on top of it, which will influence total healthcare costs.
Risk of bias of individual studies was assessed using the Cochrane collaboration tool. 16 Risk of bias assessment included: (a) sequence generation; (b) allocation concealment; (c) blinding of participants, personnel and investigators; (d) incomplete data; (e) selective reporting of outcomes; and (f) other possible sources of bias.
Data synthesis and statistical analysis
We used the difference in mean reductions in SBP and healthcare costs between eHealth interventions and usual care. We performed a meta-analysis using fixed-effect methods in case of moderate or substantial heterogeneity, and random-effect methods in case of considerable heterogeneity. Heterogeneity was assessed using the I2 test and corresponding 95% CIs estimated using the formula proposed by Higgins and Thompson.
17
According to the Cochrane handbook, we interpreted levels of heterogeneity as follows:
11
30% to 60%: may represent moderate heterogeneity; 50% to 90%: may represent substantial heterogeneity; 75% to 100%: may represent considerable heterogeneity. A P value less than 0.05 was set as the minimum level of statistical significance throughout the text.
Results
The search in the three databases resulted in 313 potentially eligible studies (Figure 1). After screening on title, abstract and full text 15 studies were suitable for the quantitative analysis according to our predefined requirements, resulting in 15 comparisons between eHealth interventions and usual care at 6 months’ follow-up, and 15 at 12 months’ follow-up. The year of publication of the included studies varied from 1992 to 2019, they were performed in the USA (n = 8), UK (n = 5), Denmark (n = 1) and Italy (n = 1). In total, the studies included 5414 participants at 6 months’ follow-up and 5593 at 12 months’ follow-up (Table 1).
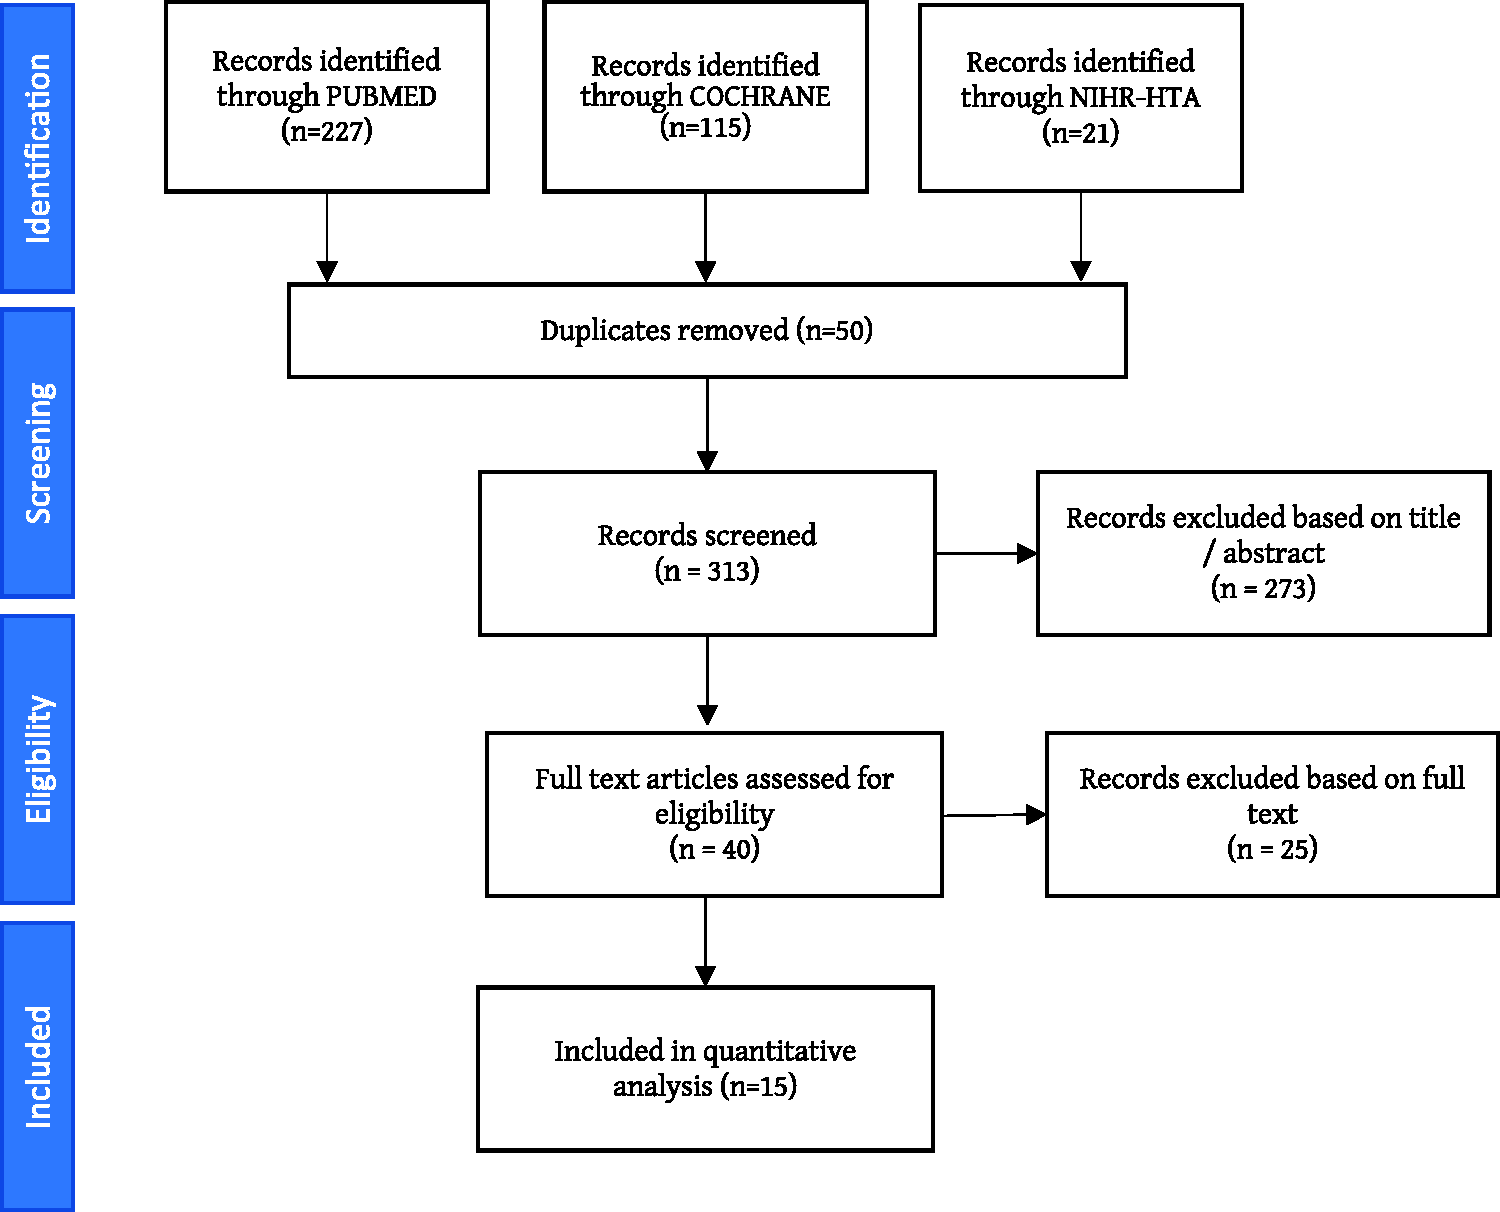
Literature search strategy based on Preferred Reporting Items for Systematic Reviews and Meta-Analyses (PRISMA) guidelines and selection of studies.
Characteristics of included studies.
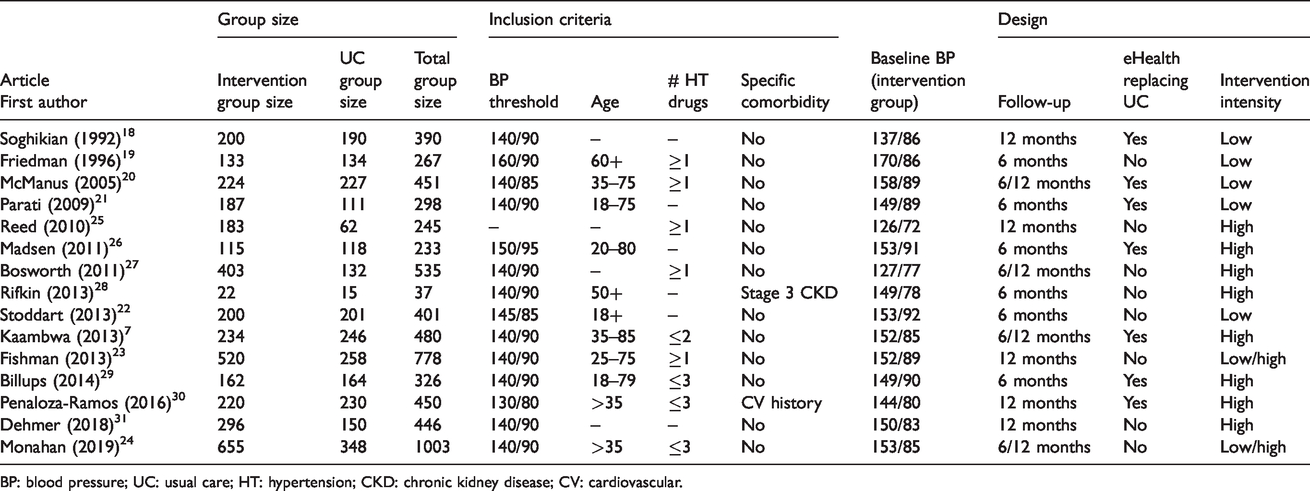
BP: blood pressure; UC: usual care; HT: hypertension; CKD: chronic kidney disease; CV: cardiovascular.
Risk of bias
Figure 2 shows the summary of risk of bias for each individual study (n = 15). Blinding of participants and personnel (performance bias) is typically not possible in eHealth home monitoring studies, which is why for all included studies this item was labelled as high risk. Blinding of outcome assessment is possible but was not reported in over 50% of selected studies. Attribution rates are typically high in eHealth programs; in our selection of studies the rate varied between 6% and 25%. An overview of the assessment of risk of bias of each individual study is to be found in the Supplementary materials.
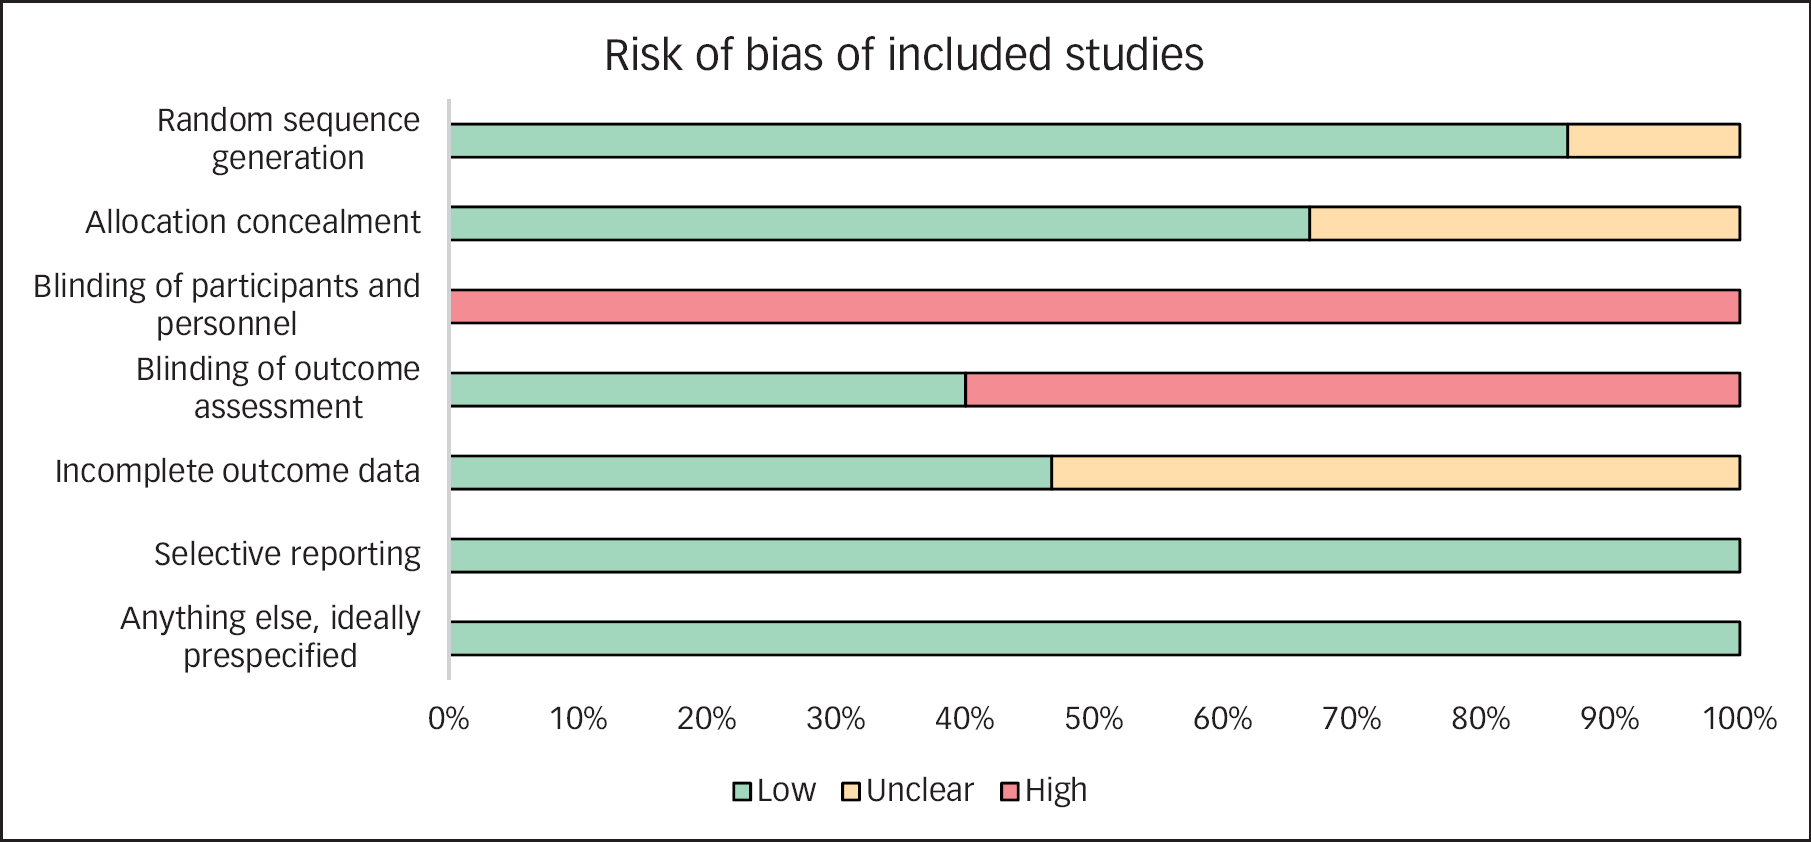
Risk of bias of included studies.
Overall effectiveness and costs
Overall, home monitoring of blood pressure was associated with a lower blood pressure at follow-up compared with usual care. The mean incremental decrease of SBP was 3.87 (95% CI 2.98–4.77) mmHg at 6 months’ follow-up and 5.68 (95% CI 4.77–6.59) mmHg at 12 months' follow-up (Figure 2). Heterogeneity on effectiveness between the studies was substantial at 6 months’ follow-up (I2 = 71%); however, was only moderate at 12 months (I2 = 56%).
Healthcare costs per patient for the home monitoring programs were overall higher than costs for usual care. On average, costs within the study period were €119 (95% CI 74–166) higher at 6 months’ follow-up and €238 (95% CI 174–303) at 12 months. However, heterogeneity on costs was considerable (I2 = 98% at 6 months and 97% at 12 months).
Additional parameters
Overall, low intensity interventions showed less incremental effectivity and costs compared to high intensity, while providing the intervention to a large rather than a small volume of participants and using it as a (partial) replacement of care rather than as an addition, decreased mean costs per patient without having an effect on blood pressure at follow-up (Figure 3).
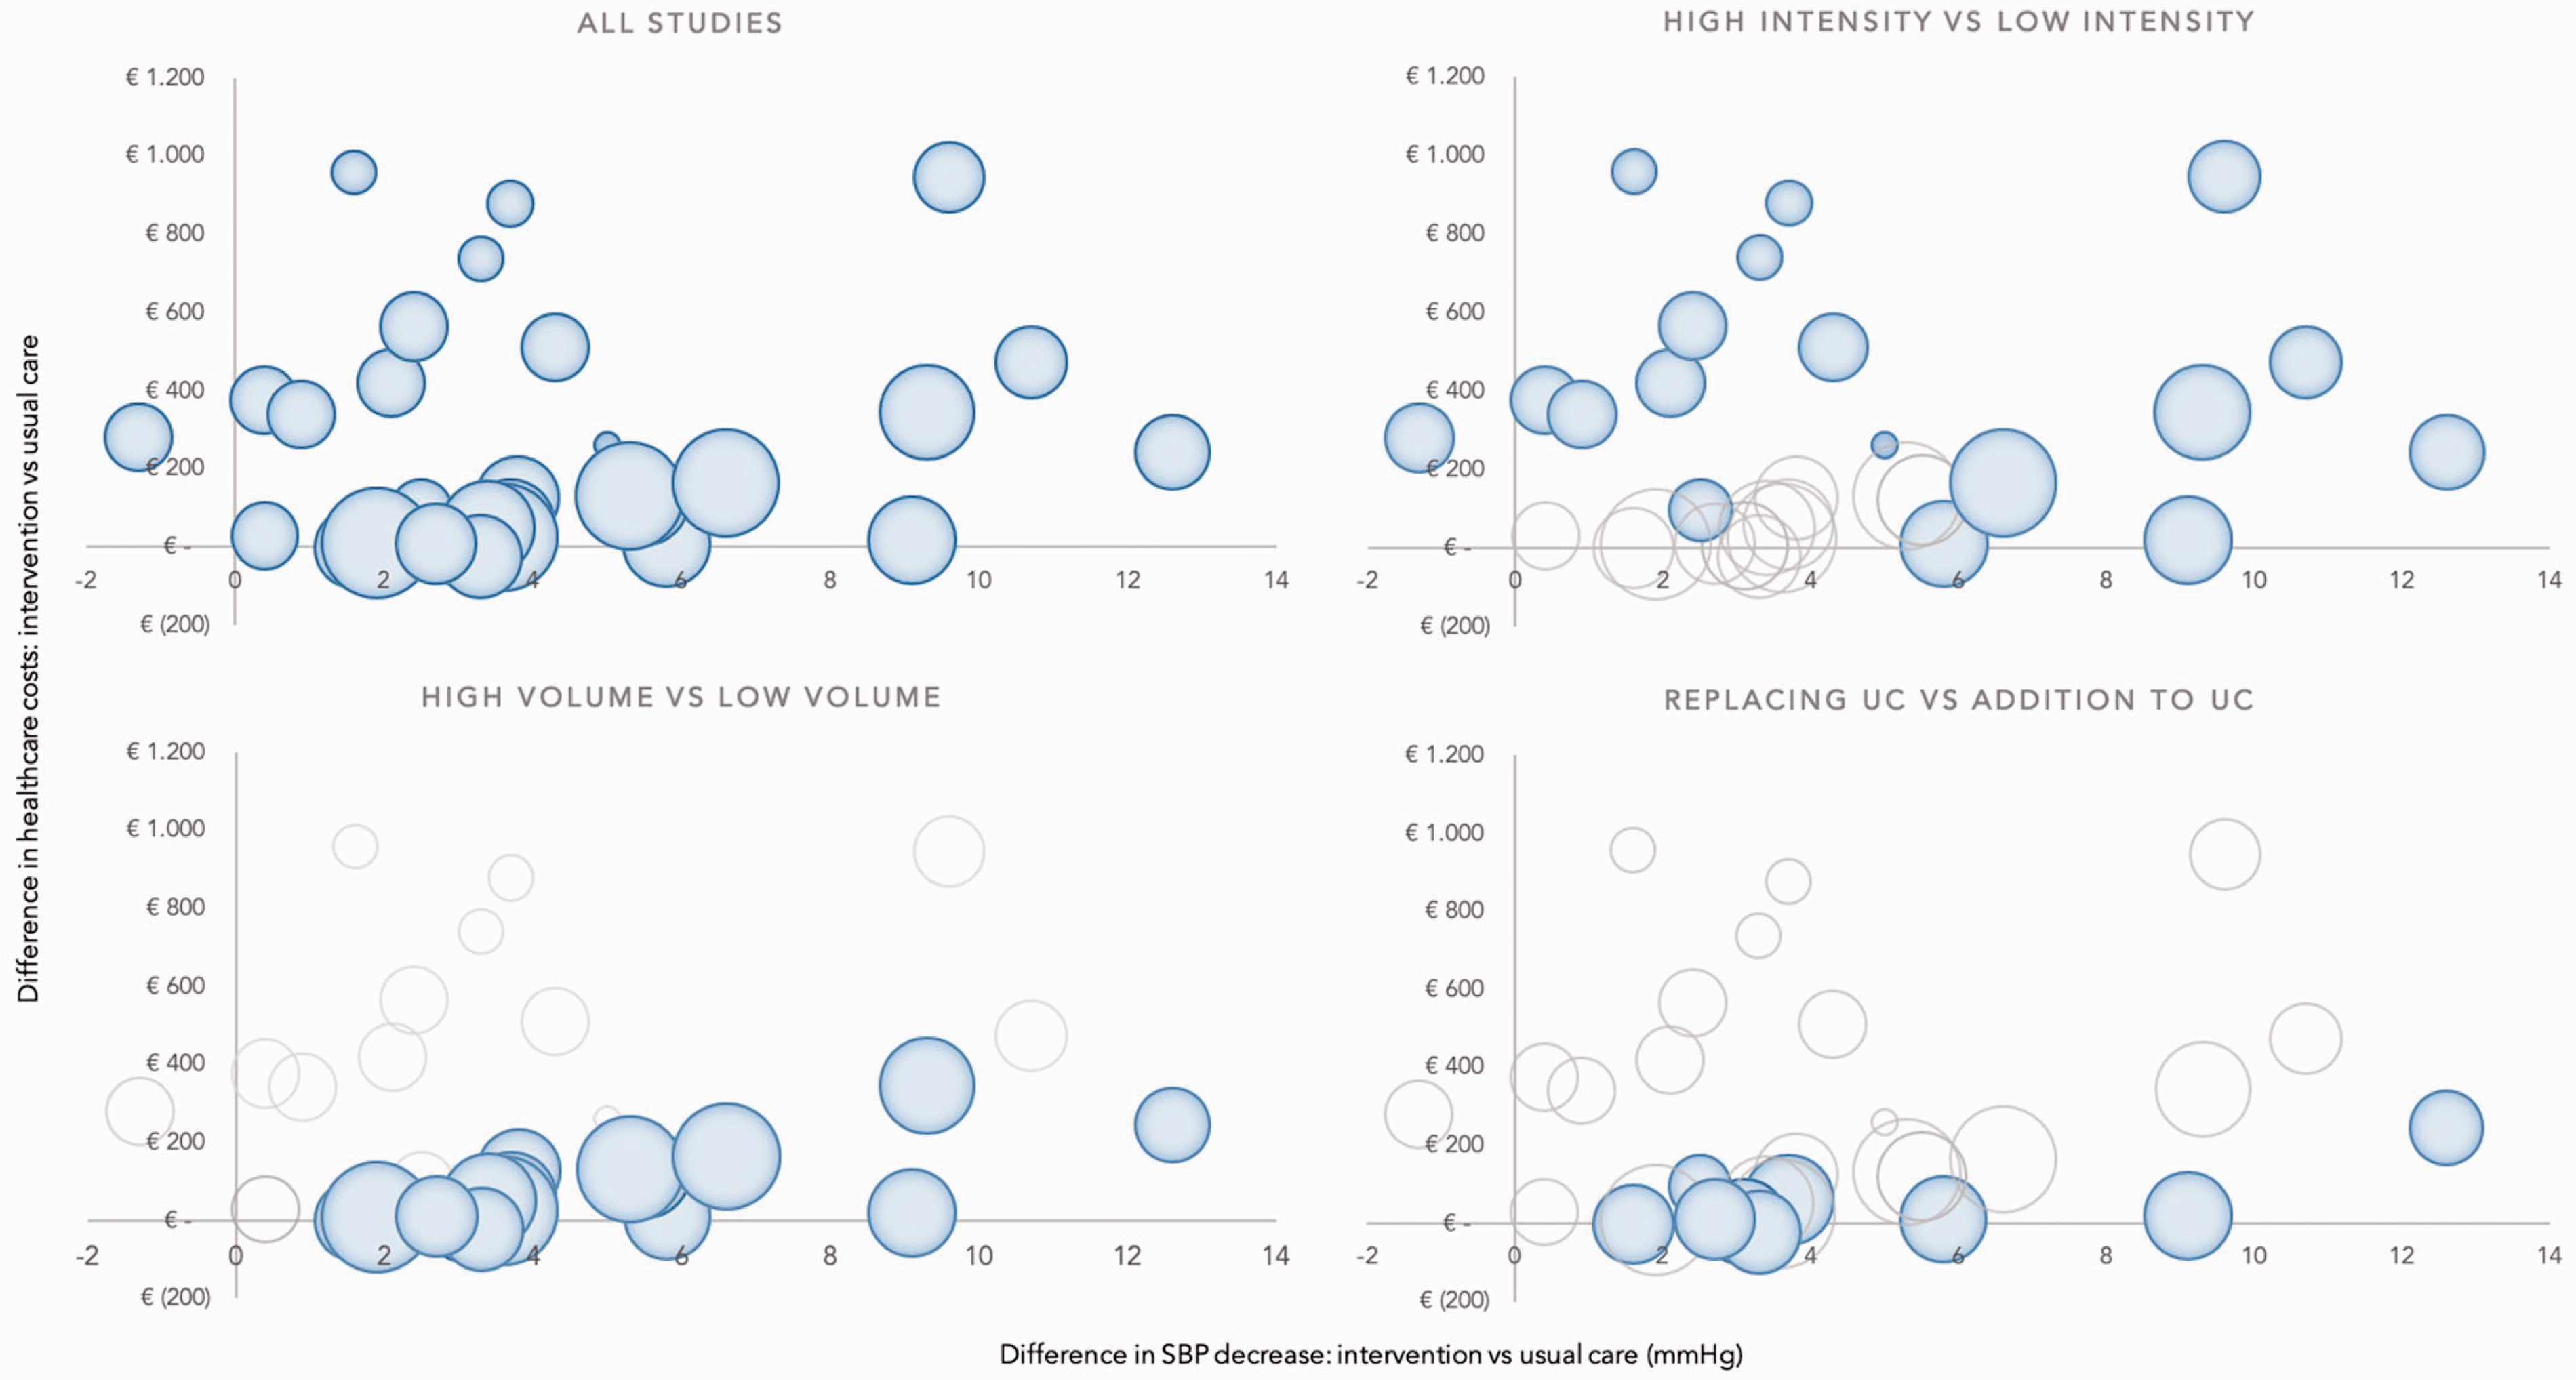
Incremental costs and effectiveness of the selected studies. The size of the surface of the balls reflects the study population in the intervention group. SBP: systolic blood pressure.
Intensity of intervention
Seven studies reported on low intensity interventions18–24 and 10 studies reported on high intensity interventions. 7 ,23–31 Studies with low intensity interventions showed a limited incremental decrease in SBP compared to usual care. At 6 months’ follow-up, low intensity programs achieved 2.4 (95% CI 1.1–3.8) mmHg incremental SBP decrease, while studies with high intensity showed a 5.0 (95% CI 3.8–6.2) mmHg decrease (Figure 4). At 12 months’ follow-up the difference remained and even enlarged slightly, with an incremental SBP decrease of 3.7 (95% CI 2.2–5.1) mmHg for low intensity and 6.9 (95% CI 5.8–8.1) mmHg for high intensity.
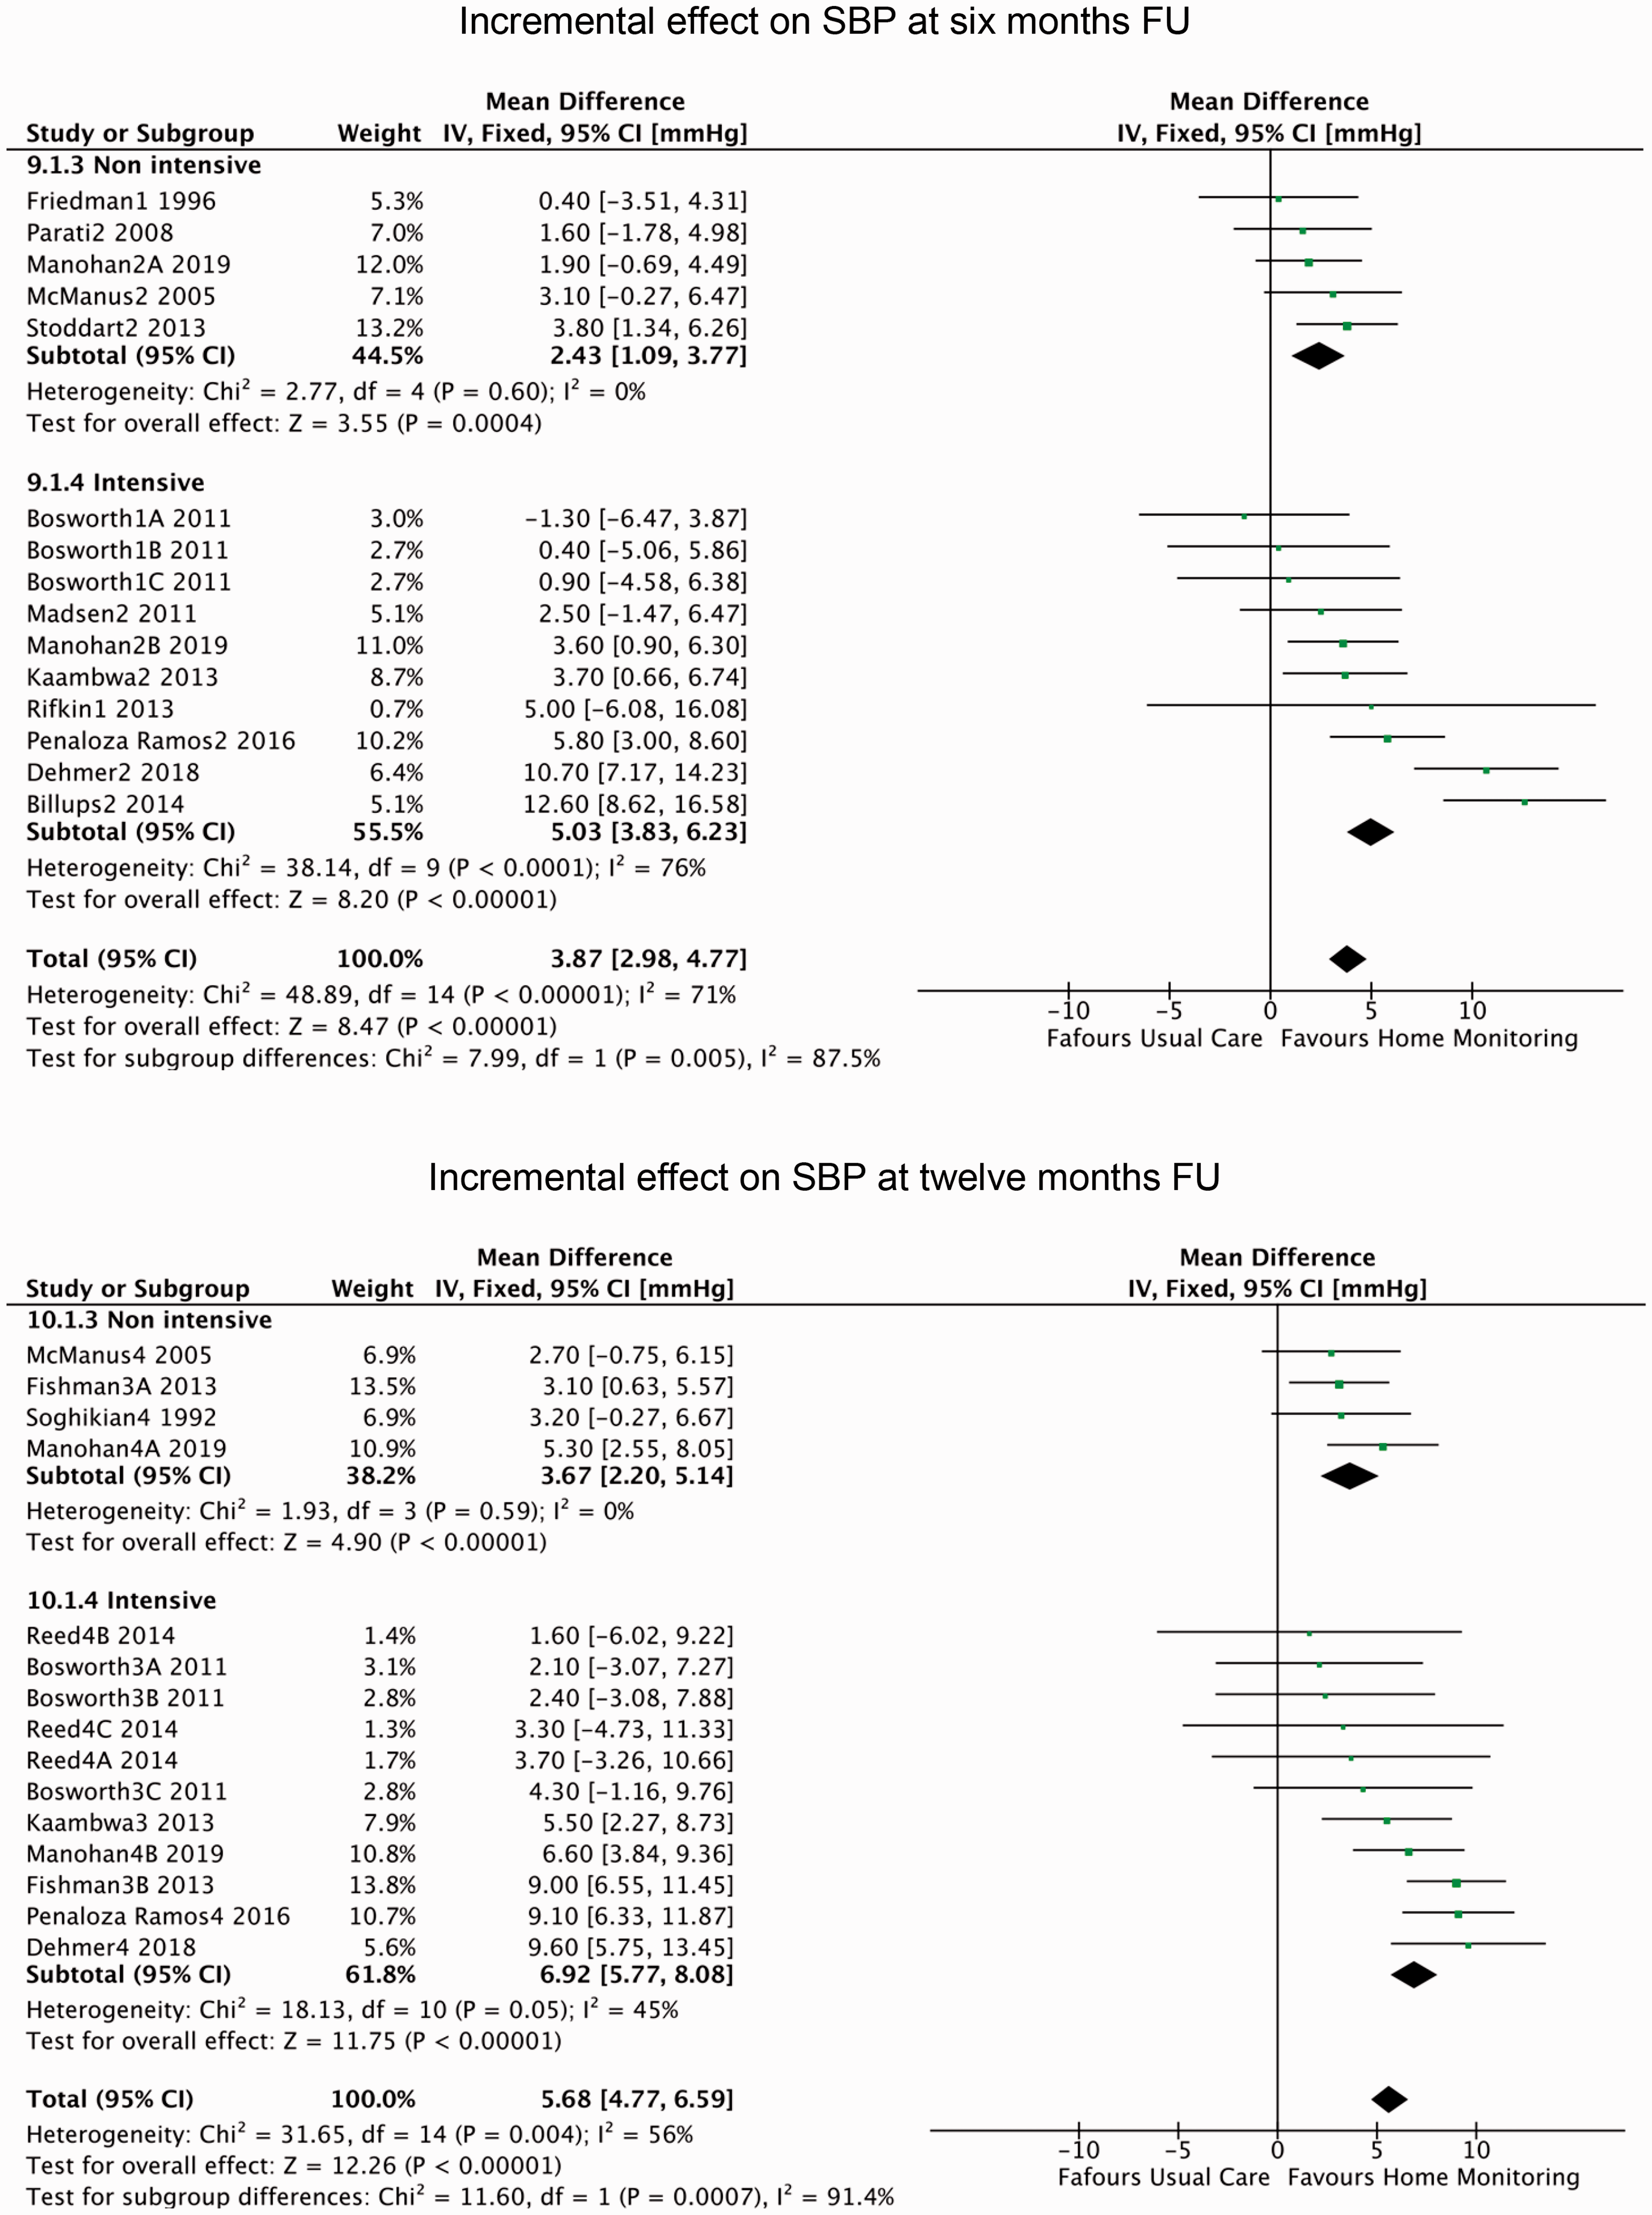
Incremental change in SBP at 6 and 12 months’ follow-up. SBP: systolic blood pressure; FU: follow-up; CI: confidence interval.
Intensive home monitoring programs were more effective than non-intensive ones, but costs were also higher. Mean incremental costs per patient in the study period for the low intensity interventions were €34 (95% CI –38–105), compared to €203 (95% CI 114–293) in the high intensity group at 6 months’ follow-up. At 12 months the costs increased to €43 (95% CI –27–113) for low intensity and €385 (95% CI 183–587) for high intensity (Table 2).
Incremental effectiveness and costs for three parameters.
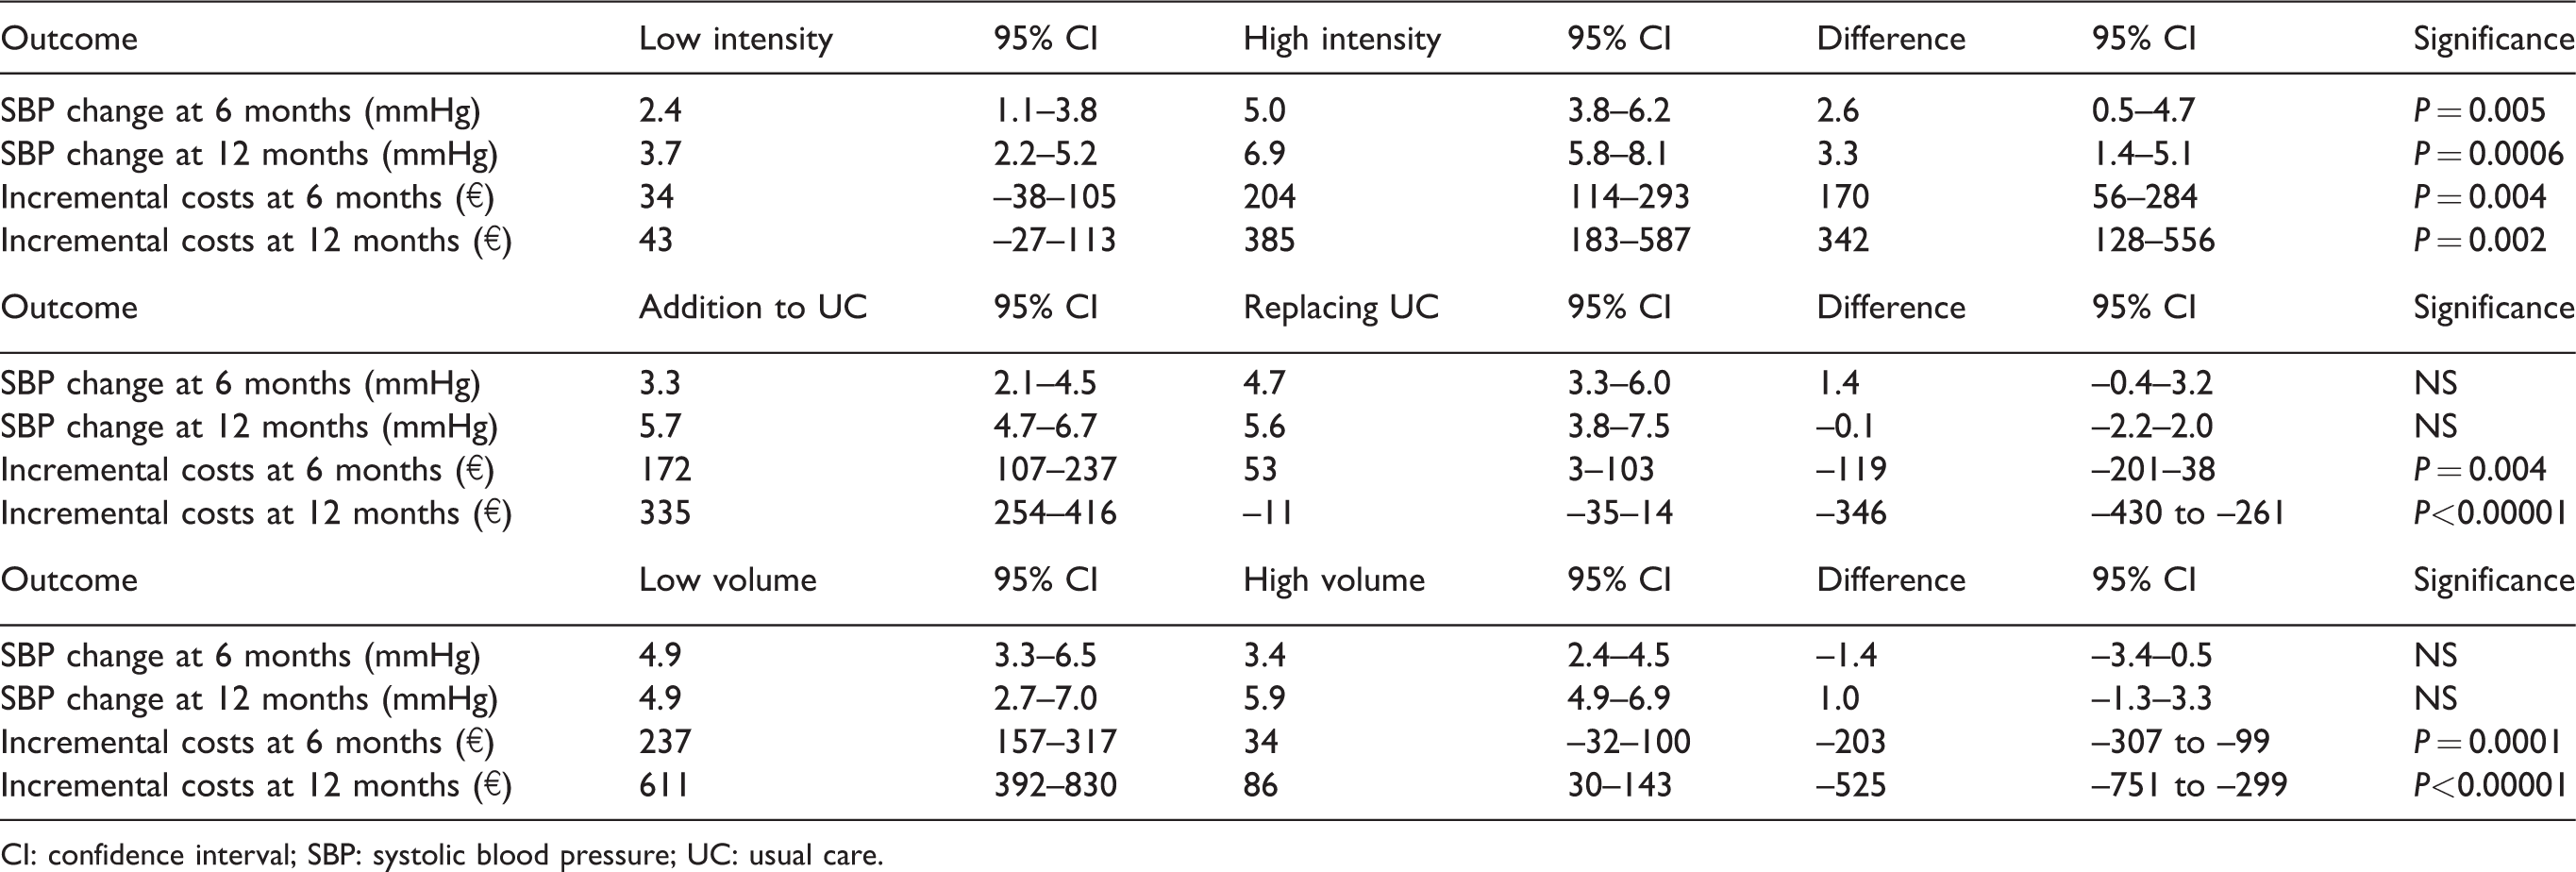
CI: confidence interval; SBP: systolic blood pressure; UC: usual care.
Volume of participants
The average number of participants in the intervention group was 183, which was the cut-off point we used to divide the studies into low volume and high volume. Seven studies included fewer than average participants, 19 , 21 ,25–29, 31 eight included more. 7 , 18 , 20 ,22–24, 30 There was no significant difference in incremental SBP decrease in the low-volume group compared to the high-volume group at both 6 and 12 months’ follow-up. However, the programs with a high volume of involved participants showed significantly lower costs per patient during the study period. At 6 months’ follow-up costs in the high volume group were €34 (95% CI 32–100), while in the low volume programs they accounted for €237 (95% CI 157–317). At 12 months the difference increased, as for high volume costs they were €86 (95% CI 30–143), while for low volume they were €611 (95% CI 392–830) (Table 2).
Replacing usual care
For seven studies we were able to conclude that home monitoring was (partially) implemented to replace usual care, 7 , 18 , 21 , 26 , 29 , 30 , 32 while in eight studies it was merely used as an addition. 19 , 22 , 23 , 25 , 27 , 28 , 31 There was no significant difference in the incremental decrease of SBP in the studies that used eHealth as an addition and those that implemented it as a (partial) replacement of usual care. However, using eHealth as a partial replacement resulted in significantly lower costs in the study period. At 6 months, costs in the replacement group were €53 (95% CI 3–103), in the addition group they accounted for €172 (95% CI 107–237). At 12 months, the costs in the replacement group were €11 less (95% CI –35–14) than usual care, while in the addition group they were €335 (95% CI 245–416) higher (Table 2).
Discussion
Although the evidence on effects and costs of eHealth programs for blood pressure management is heterogeneous, we found several parameters associated with considerable clinical effectiveness with limited additional cost. While a higher intensity of home monitoring leads to higher costs and a bigger effect on SBP, a high participant volume and using home monitoring as partial replacement for usual care lower the cost without affecting the effectiveness. The combination of self-measurement of blood pressure, with active intervention or tailored remote support as a replacement for usual care in a large population tends to be the most successful on both parameters.
As previous research demonstrated, the most successful eHealth programs for the management of hypertension have been shown to be cost-effective compared to usual care. 24 However, the critical factors leading to the relative success of these studies were unknown to date, which is why we aimed to identify them in this study. We used a previously described framework of intensity of intervention, which proved to be successful in predicting the effectiveness of home monitoring interventions. It is interesting to find that this framework has only limited value when costs and effectiveness are combined. Indeed, a low level of intensity is associated with low additional costs and low additional effect, while our results demonstrate that studies with a high level of intensity vary in both effectiveness and costs. The intensity level of the intervention is the first parameter we identified for home blood pressure monitoring that combine effectiveness with limited costs. As has been described elsewhere, a low level of intensity of the intervention is associated with limited effect. 3 , 6 Therefore, when designing an effective home monitoring scheme, it is mandatory to set up a high intensity level, an active remote intervention or tailored patient support. This will inevitably lead to a certain level of fixed costs, for instance for the set-up and availability of a dedicated remote healthcare team. Therefore, it is key to scale up the monitoring program to a considerable number of participants to reduce the cost per patient. The average study population of the papers included in our investigation was 183; we found that those with a larger amount of intervention participants showed lower additional costs per patient, without having an effect on SBP at follow-up. The third parameter is to use the opportunities of home monitoring to save on events elsewhere in the care chain instead of just adding new activities, so that the additional costs of the programs can be partially abolished. We found several examples of this substitution of usual care by eHealth in the included studies, including the use of self-monitored instead of clinic blood pressure readings to guide antihypertensive treatment decisions, train patients to self-titrate their antihypertensive medication following a predetermined plan and remotely check medication adherence. 29 , 30 , 33 We found that this replacement of visits to outpatient clinics or general practitioners by eHealth, while reducing costs, does not have less effect on SBP at follow-up.
The generalisability of our results is limited, as the evidence on costs and effectiveness of home monitoring of blood pressure for patients with hypertension is not unambiguous. Studies selected in this paper varied with respect to how blood pressure was measured (e.g. office blood pressure measurement vs. ambulatory blood pressure measurement), (additional) healthcare costs were calculated (e.g. only additional costs of intervention vs. total healthcare costs in study period vs. projected lifetime healthcare costs) and follow-up duration (6 months vs. 12 months). Studies were conducted in different countries, although all were high-income nations with developed healthcare systems, and discrepancies in healthcare and reimbursement systems will have impacted costs presented in the studies. Similarly, studies were published over a long period (1992–2019) while covering the rapidly emerging field of eHealth, and although we did not find a correlation between study year and costs or effects this might have impacted the results. Finally, factors outside the scope of this study, including treatment options and patient characteristics such as educational level, socioeconomic status, age and other risk factors might impact the way in which low or high intensity eHealth interventions are perceived by the patient.
This lack of standardisation in research methods and the absence of a useful framework to predict cost-effectiveness of home monitoring of hypertension mark the need for the identification of a set of standardised measures to appreciate better the associated costs of eHealth provision. Because of the ambiguity of the evidence in this field it remains difficult to assess whether home blood pressure monitoring using telemonitoring programs is cost-effective in general. Earlier attempts on meta-analyses reported similar issues on the substantial heterogeneity of costs between the studies, underlining our finding that based on current evidence we cannot draw an overarching conclusion about the cost-effectiveness of eHealth. 5 , 6 We did see, however, multiple successful examples that should lead the way in where we are heading with eHealth. Therefore, we can pursue the identification of common parameters among these studies that combine high incremental effectiveness with low incremental costs. Our paper provides these parameters, which can be used for designing new home monitoring programs, leading to scalable, affordable and effective eHealth. Such initiatives are especially necessary as the suboptimal management of chronic diseases such as hypertension increasingly count for accumulating socioeconomic costs.
Conclusion
eHealth programs for patients with hypertension, that are characterised by an intense remote intervention with high patient volumes and that (partly) replace usual care, tend to demonstrate high effectiveness and limited costs. These success factors should be taken into account when designing new programs. Future research should focus on real-world experiences that represent economically viable and reimbursable programs, to determine further the cost-effectiveness of eHealth for blood pressure management.
Supplemental Material
sj-pdf-1-cpr-10.1177_2047487320957170 - Supplemental material for Success factors in high-effect, low-cost eHealth programs for patients with hypertension: a systematic review and meta-analysis
Supplemental material, sj-pdf-1-cpr-10.1177_2047487320957170 for Success factors in high-effect, low-cost eHealth programs for patients with hypertension: a systematic review and meta-analysis by Sebastiaan Blok, Eva L van der Linden, G Aernout Somsen, Igor I Tulevski, Michiel M Winter and Bert-Jan H van den Born in European Journal of Preventive Cardiology
Footnotes
Author contribution
SB, MMW and BJHB contributed to the conception or design of the work. SB, ELL, GAS, IIT, MMW and BJHB contributed to the acquisition, analysis or interpretation of the work. SB drafted the manuscript. ELL, GAS, IIT, MMW and BJHB critically revised the manuscript. All authors gave final approval and agree to be accountable for all aspects of thework ensuring integrity and accuracy.
Declaration of conflicting interests
The author(s) declared no potential conflicts of interest with respect to the research, authorship, and/or publication of this article.
Funding
The author(s) received no financial support for the research, authorship, and/or publication of this article.
References
Supplementary Material
Please find the following supplemental material available below.
For Open Access articles published under a Creative Commons License, all supplemental material carries the same license as the article it is associated with.
For non-Open Access articles published, all supplemental material carries a non-exclusive license, and permission requests for re-use of supplemental material or any part of supplemental material shall be sent directly to the copyright owner as specified in the copyright notice associated with the article.