
Abstract

Although natriuretic peptide levels have been associated with incident heart failure and prognosis of heart failure patients,1,2 trials on natriuretic peptide-guided treatment have provided inconsistent results. 3 Existing trials mostly used predefined screening intervals and target levels, which do not account for variations in temporal patterns of circulating biomarkers between individuals. This may hamper their potential use for therapy guidance. In contrast, a personalized screening approach with screening intervals and target levels based on the evolution of biomarkers in individual patients may further improve risk assessment and therapy guidance. Such personalized screening intervals maximize information gain on the individual patients’ disease progression, while minimizing the necessary number of measurements. 4
In the Bio-SHiFT study, we demonstrated that individual temporal patterns of serially measured chronic heart failure (CHF)-related biomarkers are associated with the prognosis of CHF patients. 5 We also demonstrated a method to obtain a patient-specific dynamic estimate of prognosis. This estimate is updated after every additional measurement, as each measurement provides additional information. 5 This personalized risk assessment can also be used to derive personalized screening intervals for future CHF patients. However, the benefits of this approach, over predefined screening intervals and targets, have not yet been investigated in CHF patients. Here, we compare personalized scheduling of N-terminal pro-B-type natriuretic peptide (NT-proBNP) measurements to a predefined, fixed scheduling approach.
In 263 stable CHF patients from the Bio-SHiFT study, NT-proBNP was measured trimonthly according to a prespecified, fixed schedule. 5 The composite primary endpoint (PE) consisted of cardiac death, cardiac transplantation, left ventricular assist device implantation or heart failure hospitalization. Using joint models for time-to-event and longitudinal data, we modelled the association between repeated NT-proBNP measurements and the PE. 5 Subsequently, we performed a simulation study where we generated 750 patients with baseline characteristics and NT-proBNP profiles similar to the 263 patients included in the Bio-SHiFT study. We divided these patients into a training (700 patients) and testing (50 patients) set. 4 In the training set, we fitted a new joint model for NT-proBNP. We compared scheduling of NT-proBNP measurements according to a fixed screening design and a personalized screening design in the testing set of patients, using the joint model developed based on the training set. Specifically, in the personalized screening design, we derived a personalized risk profile using the previously measured NT-proBNP levels as well as the current NT-proBNP level (Figure 1a). Then the fitted joint model was used to find the time point at which the patients’ cumulative risk of PE was 7.5%. The next NT-proBNP measurement was scheduled between the current outpatient visit and this time point (Figure 1b). Subsequently, we used the fitted joint model to estimate the expected information gain on the patient’s prognosis at every time point within this specified time window.4 Then, based on the Kullback-Leibler divergence, we scheduled the next NT-proBNP measurement at the optimal time point at which we expected the maximum information gain on the patient’s prognosis (Figure 1c). After this additional NT-proBNP measurement was performed in the patient, the personalized cumulative risk of PE was updated. Based on this updated personalized cumulative risk of PE, again the time point at which the cumulative risk of PE is 7.5% was determined. If the personalized cumulative risk of PE within 3 months was less than 7.5%, we proceeded to schedule the next NT-proBNP measurement. However, if the personalized cumulative risk of PE within the next 3 months exceeded 7.5%, scheduling was stopped in order to adjust therapy and avoid the imminent PE.4 We compared personalized scheduling with fixed tri-monthly scheduling in terms of the capability to identify the start of high-risk intervals (i.e. whether timely intervention was possible before occurrence of PE) and number of measurements needed (Figure 1(d)). Apart from using the risk threshold of 7.5% over a three-month period, we repeated the analysis using 5% and 10% risk thresholds.
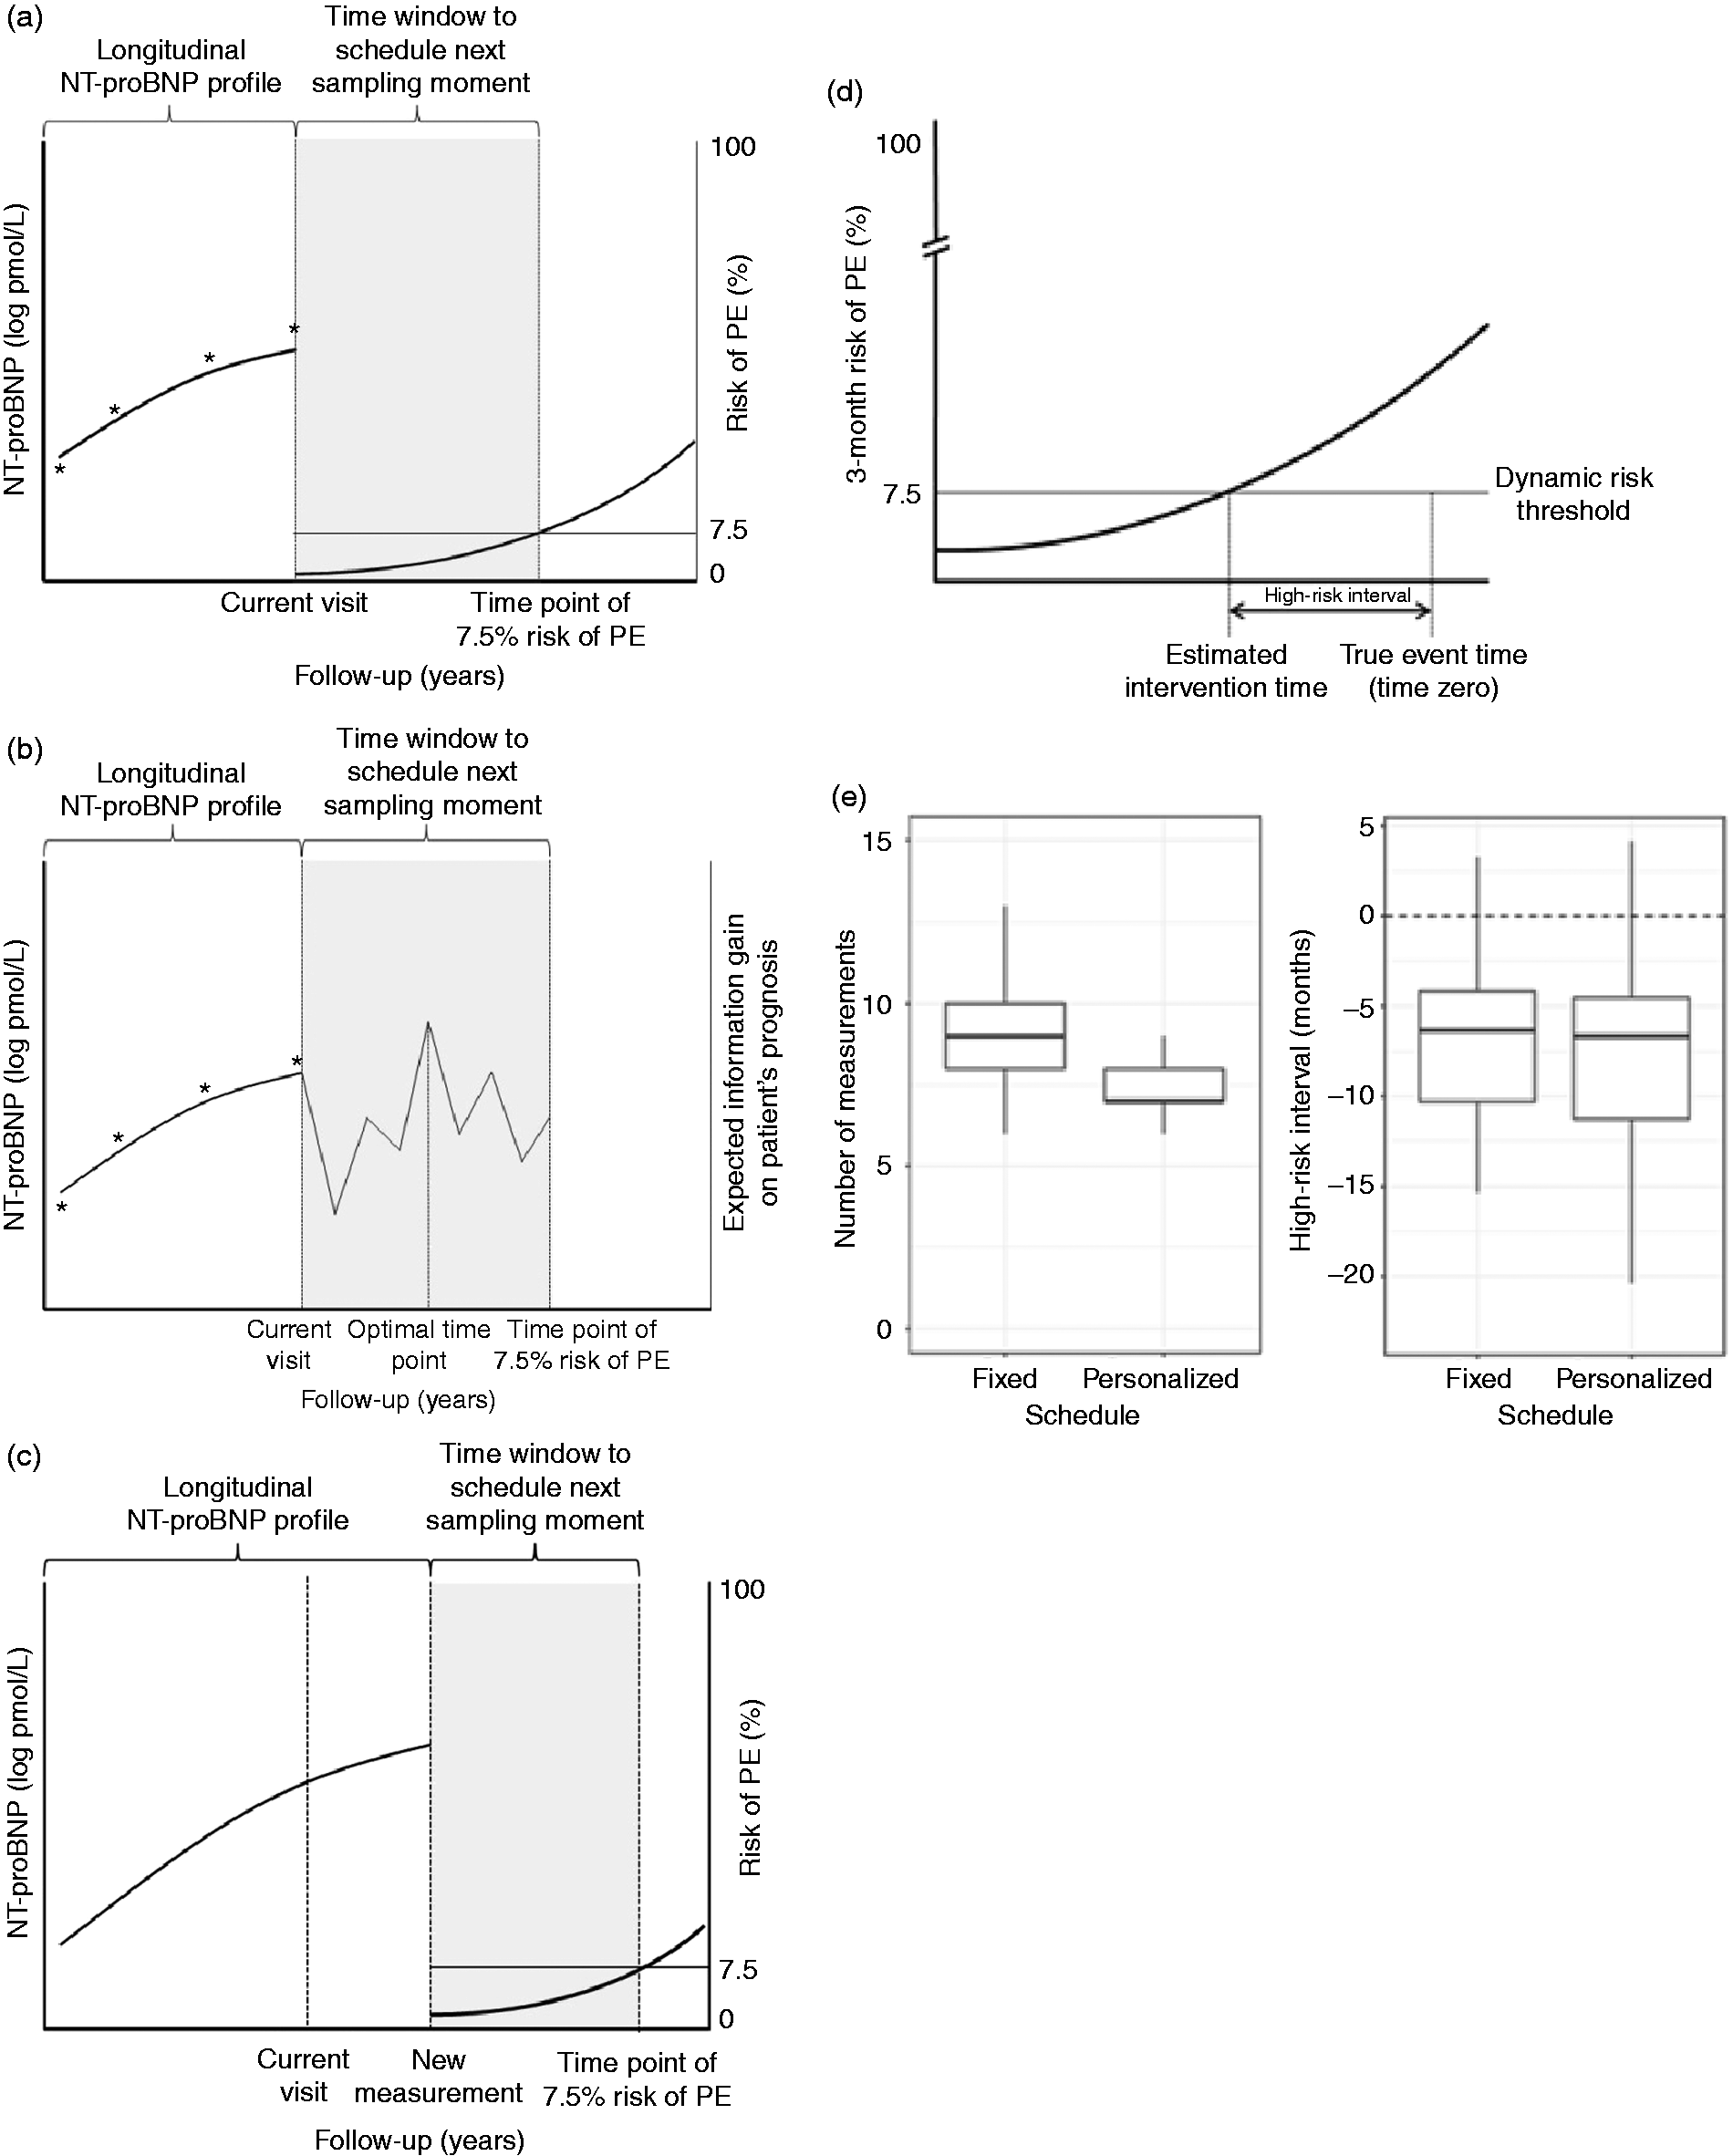
(a) Use the joint model to find the time point at which the patients’ cumulative risk of PE is 7.5%. The next measurement will be scheduled between the current visit and this time point. (b) Schedule the next measurement within this time window at the optimal time point at which we expect the maximum information gain on the patient’s prognosis (c) Perform the next measurement and update the personalized cumulative risk of PE. Subsequently, again, find the time point at which the patients’ cumulative risk is 7.5%. (d) Definition of high-risk interval as used in the personalized scheduling approach. The ‘true event time’ is generated by the simulation study. Based on the estimated NT-proBNP profile, the patient’s 3-month risk of PE (%) is estimated by the personalized scheduling approach (curve). The time point at which this 3-month risk of PE exceeds the risk threshold is defined as the ‘estimated intervention time’. The start of the high-risk interval is defined as the estimated intervention time minus the true event time (in months). (e) Comparison of personalized and fixed scheduling using a risk threshold of 7.5% over a 3-month period.
The mean age of the 263 original Bio-SHiFT patients was 66.7 (12.6) years and 71.9% were men (Table 1). The median baseline NT-proBNP value was 137.3 (interquartile range (IQR): 51.7–272.6) pmol/L. During a median follow-up of 2.2 (IQR: 1.4–2.5) years, a median of nine (IQR: 5–10) NT-proBNP measurements per patient were performed. The PE occurred in 70 patients (26.6%). After adjustment for age, gender, diabetes mellitus, New York Heart Association class, body mass index and renal function, serially measured NT-proBNP remained independently associated with the PE (hazard ratio per doubling of NT-proBNP level: 2.20, 95% confidence interval: 1.84–2.68). The baseline characteristics of the simulated patients were similar to those of the Bio-SHiFT study patients (data not shown). The simulation study showed that the personalized schedule used fewer measurements as compared to the fixed schedule (Figure 1(e)). The personalized schedule used a median of seven (IQR: 7–8) measurements, while the fixed used nine (IQR: 8–10). The personalized and fixed schedules showed similar results regarding the high-risk interval identified for therapeutic intervention to prevent PE occurrence (the personalized schedule had a median of 6.6 (IQR: 4.5–11.3) months, and the fixed schedule had a median of 6.3 (IQR: 4.2–10.3); Figure 1(d), (e)). Therefore, both schedules stopped scheduling new sampling moments and allowed for timely intervention before the event occurred.
Baseline characteristics.
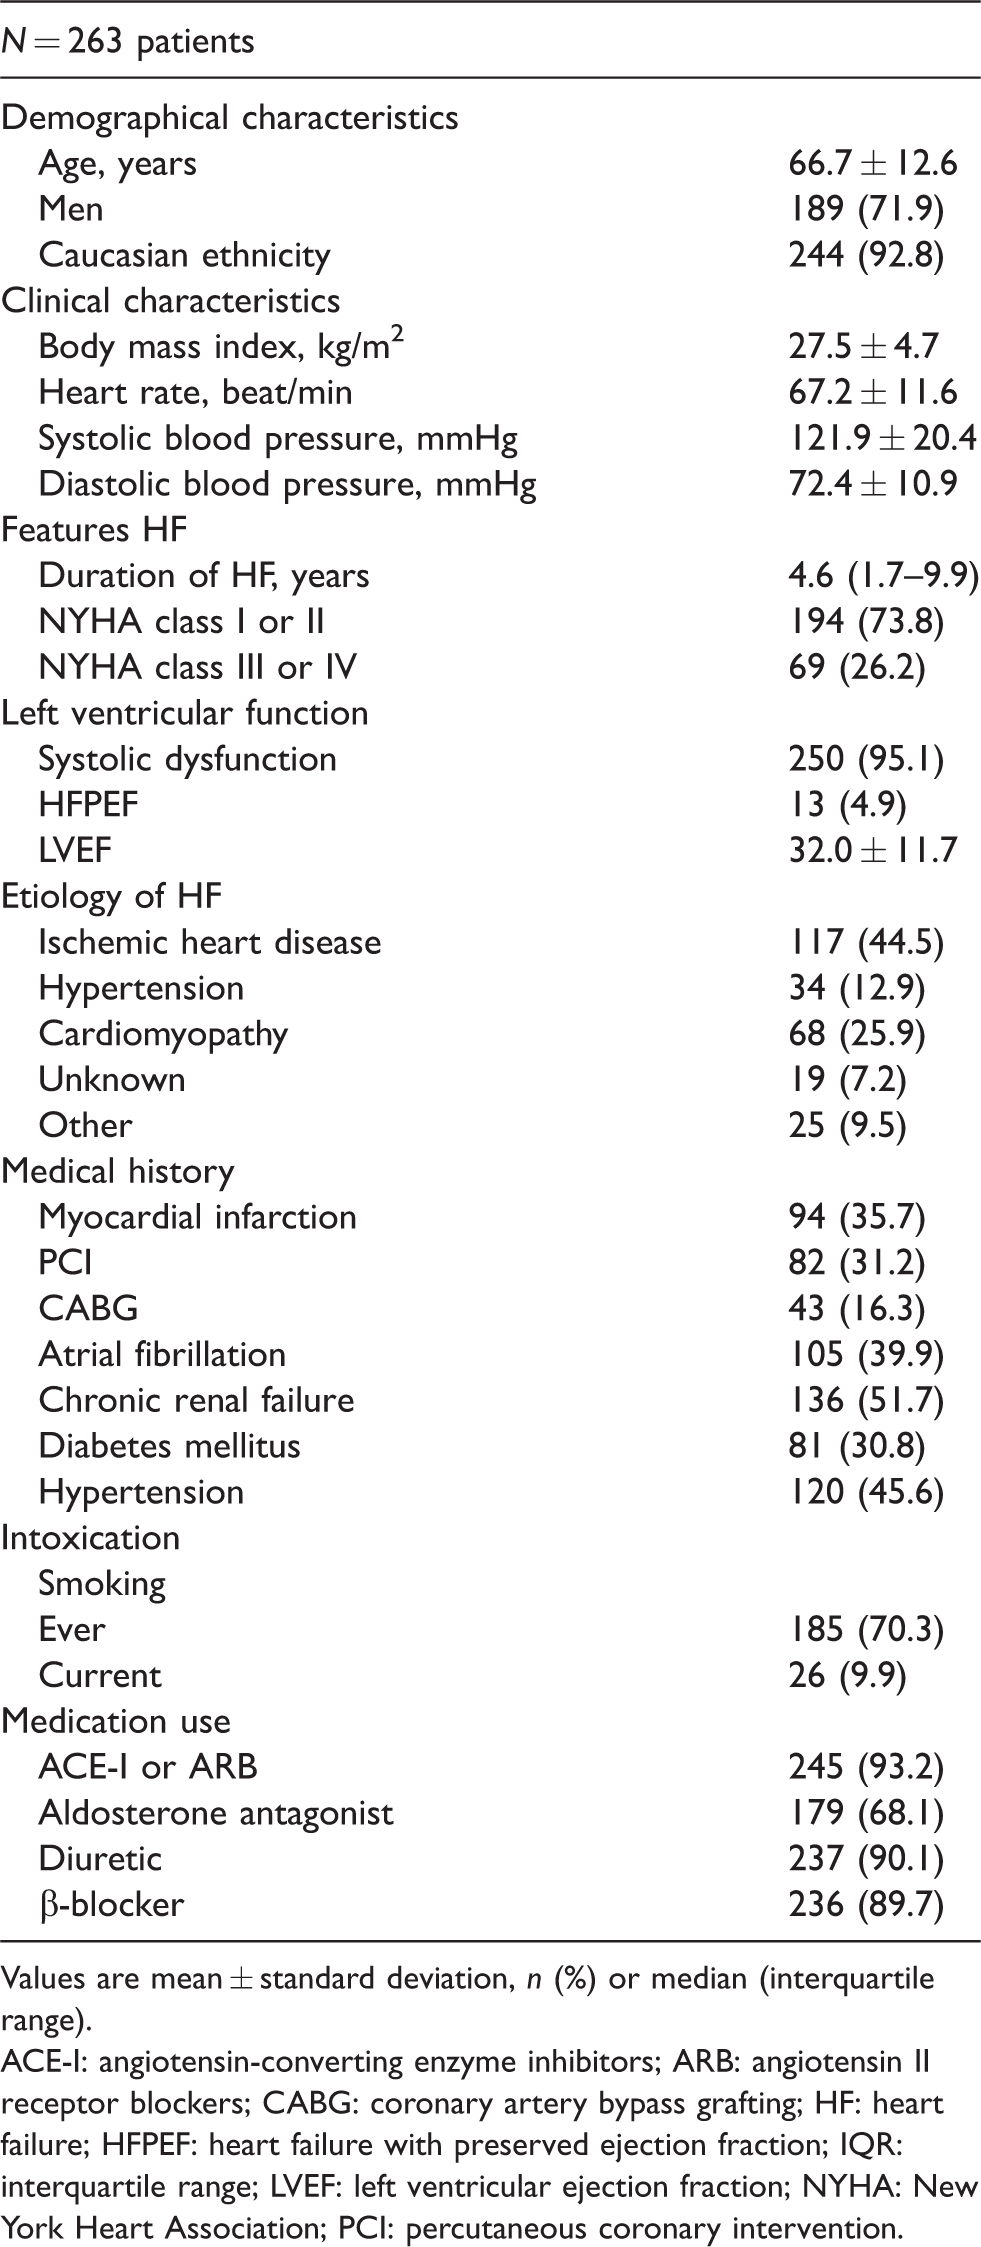
Values are mean ± standard deviation, n (%) or median (interquartile range).
ACE-I: angiotensin-converting enzyme inhibitors; ARB: angiotensin II receptor blockers; CABG: coronary artery bypass grafting; HF: heart failure; HFPEF: heart failure with preserved ejection fraction; IQR: interquartile range; LVEF: left ventricular ejection fraction; NYHA: New York Heart Association; PCI: percutaneous coronary intervention.
Study limitations that warrant consideration include the use of only one testing set, and assumptions that were made when developing the model and defining the risk thresholds. However, using a risk threshold of 5% over three months, the fixed and personalized screening schedules demonstrated similar results for the high-risk interval. Again, the personalized screening schedule used fewer measurements as compared to the fixed screening schedule. Similar results were found for a risk threshold of 10%.
To conclude, this study demonstrates for the first time that personalized scheduling of NT-proBNP measurements in patients with CHF performs similarly with respect to the prediction of recurrent events, but requires fewer NT-proBNP measurements than fixed scheduling. If such personalized scheduling were to be applied in natriuretic peptide-guided therapy, these benefits may translate into improved outcomes. Therefore, a clinical trial incorporating personalized scheduling warrants consideration.
Footnotes
Declaration of conflicting interests
The author(s) declared no potential conflicts of interest with respect to the research, authorship, and/or publication of this article.
Funding
The author(s) disclosed receipt of the following financial support for the research, authorship, and/or publication of this article: This work was supported by the Jaap Schouten Foundation and Erasmus MC efficiency grant (2015-15110).