
Abstract
Background
Strong associations have been demonstrated between the American Heart Association’s cardiovascular health (CVH) metrics and various cardiovascular outcomes, but the association with sudden cardiac death (SCD) is uncertain. We examined the associations between these CVH metrics and the risks of SCD and all-cause mortality among men in Finland.
Methods and results
We used the prospective population-based Kuopio Ischaemic Heart Disease cohort study, which consists of men between 42 and 60 years of age at baseline. CVH metrics were computed for 2577 men with CVH scores at baseline ranging from 0 to 7, categorized into CVH scores of 0–2 (poor), 3–4 (intermediate) and 5–7 (ideal). Multivariate Cox regression models were used to estimate the hazards ratios (HRs) and 95% confidence intervals (CIs) of ideal CVH metrics for SCD and all-cause mortality. During a median follow-up period of 25.8 years, 280 SCDs and 1289 all-cause mortality events were recorded. The risks of SCD and all-cause mortality decreased continuously with increasing number of CVH metrics across the range 2–7 (p value for non-linearity for all <0.05). In multivariable analyses, men with an ideal CVH score had an 85% reduced risk of SCD compared with men with a poor CVH score (HR 0.15; 95% CI 0.05–0.48; p = 0.001). For all-cause mortality, there was a 67% lower risk among men with an ideal CVH score compared with those with a poor CVH score (HR 0.33; 95% CI 0.23–0.49; p <0.001).
Conclusions
Ideal CVH metrics were strongly and linearly associated with decreased risks of SCD and all-cause mortality among middle-aged men in Finland.
Introduction
Sudden cardiac death (SCD) accounts for about half of all deaths from cardiovascular disease (CVD). 1 Estimates from death certificate data suggest that 15% of all deaths in western countries are caused by SCD. 2 Common risk factors for CVD may contribute to the development of SCD and risk stratification techniques can help to identify patients at risk of SCD, although effective prevention is challenging. 2
A decade ago, the American Heart Association (AHA) developed metrics for ideal cardiovascular health (CVH) to assess the cardiovascular status of the population. The metrics focused on seven modifiable health behaviours and biological factors affecting cardiovascular risk: smoking, body mass index (BMI), physical activity, diet, fasting blood glucose (FBG), total cholesterol and blood pressure. 3 Although several studies have established strong associations between these CVH metrics and various cardiovascular outcomes,4–6 there is still a lack of research available on the association between the AHA’s CVH metrics and the risk of SCD. To the best of our knowledge, no study has yet evaluated the association between the CVH metrics and the risk of SCD. We therefore aimed to evaluate the prospective relationship between the ideal CVH metrics and the risk of SCD and all-cause mortality among a middle-aged Finnish population.
Methods
Study population
This study used the ongoing population-based Kuopio Ischemic Heart Disease (KIHD) study. The KIHD study was initially designed to investigate the different risk factors for developing CVD and other chronic diseases among middle-aged men in Kuopio and the surrounding communities. 7 Briefly, the study commenced in 1984 with men randomly selected from the national population register who were aged 42–60 years at baseline. Of the 3235 eligible men, 2682 volunteered to participate in this study. Women were included 11 years after the baseline examinations. The present analysis is based on the initial cohort of 2577 men with non-missing data on ideal CVH metrics, relevant covariates and SCD. The research protocol (KIHD) was approved by the Research Ethics Committee of the University of Eastern Finland, Kuopio (reference number 143/97). The study protocol conformed to the ethical guidelines of the Declaration of Helsinki. All participants included in the study gave informed consent.
Data collection
A self-administered questionnaire was mailed to each participant prior to their visit to the study centre. The participants were then invited to the study centre for interviews and clinical examination. A trained research nurse was responsible for interviewing all the study participants, who also underwent a health examination. Details of the assessment for blood pressure, BMI, nutritional status, smoking status, alcohol consumption, physical activity, prevalent medical conditions and socioeconomic status (SES) have been discussed previously. 6 The SES scale ranges from 0 to 25, with 0 indicating the highest and 25 the lowest SES score.
Laboratory methods
Participants provided blood specimens between the hours of 8 and 10 in the morning following abstinence from alcohol ingestion for three days, smoking for 12 hours and eating for 12 hours. After the participant had rested for 30 minutes in a supine position, the blood sample was drawn from the antecubital vein with a Terumo Venoject VT-100PZ vacuum (Terumo Corp., Tokyo), without the use of a tourniquet. The cholesterol contents of the serum lipoprotein fractions and triglycerides were measured enzymatically (Boehringer Mannheim). Serum high-density lipoprotein cholesterol (HDL-C) and its sub-fractions were separated from fresh serum samples using ultracentrifugation and precipitation. Blood glucose was measured by the glucose dehydrogenase method (Merck, Darmstadt, Germany) after precipitation of proteins by trichloroacetic acid. 8
CVH metrics
The CVH metrics adopted in this study conformed with the CVH metrics developed by the AHA and consisted of seven health behavioural and biological factors, including a healthy diet score (HDS), physical activity, BMI, smoking status, blood pressure, FBG and plasma total cholesterol.3,6 (Supplementary Table 1, available online). Thus the ideal CVH metric consists of the following seven components.
An HDS of 4–5 – that is, four to five components of the following: at least 4.5 cups/day of fruits and vegetables; at least two 3.5-ounce servings/week of fish; <1500 mg/day of sodium; ≤36 ounces/week of sweets/sugars; and at least three 1-ounce servings/day of wholegrains. The salt intake in this study was substituted by the intake of processed meat, which has been shown to contain high levels of salt (sodium).
9
Physical activity consisting of ≥150 minutes/week moderate intensity physical activity (MET 3–6) or ≥75 minutes/week of vigorous intensity aerobic physical activity (MET >6), or an equivalent combination. A smoking status of never smoked. BMI <25 kg/m2. Blood pressure <120/<80 mmHg. FBG <5.55 mmol/l. Total cholesterol < 5.18 mmol/l.
Ascertainment of SCD and all-cause mortality outcomes
SCD was defined as death that occurred within 1 h of the onset of an abrupt change in symptoms or within 24 h after the onset of symptoms when the clinical findings did not reveal a non-cardiac cause of sudden death. Deaths that occurred unwitnessed during the night, such as being found dead in bed, were classified as those whose death occurred within 24 h of the start of symptoms. Patients who were successfully resuscitated from ventricular tachycardia and/or ventricular fibrillation were also defined. The deaths due to aortic aneurysm rupture, cardiac rupture or tamponade, and pulmonary embolism, cancer, or other non-cardiac co-morbidities were not included as SCDs. The diagnostic classification of events was based on symptoms, electrocardiographic (ECG) findings, cardiac enzyme elevations, autopsy findings (80%) and history of coronary heart disease, together with the clinical and ECG findings of the paramedic staff. Out-of-hospital SCDs and non-SCDs were documented. All hospital documents (including medical records, laboratory and ECG findings from the hospital and paramedical staff, and the use of medications and defibrillators) were available to use.10,11 All deaths that occurred by the end of 2014 were checked against the hospital documents, health centre wards and death certificates. There was no loss to follow-up. All the documents related to the death were cross-checked in detail by to doctors. The Independent Events Committee, masked to the clinical data, classified the deaths. Censoring was carried out on the date from the baseline visit to first development of SCD, death, loss to follow-up, or the end of the observation period (31 December 2014).
Statistical analysis
The baseline characteristics of the participants were summarized using descriptive statistics, presented as mean (standard deviation) or median (interquartile range) values for continuous variables, and as number (percentage) for categorical variables. We explored the shape of the relationship between the CVH metrics (as a continuous variable) and the risk of outcomes using restricted cubic splines with knots at the 5th, 35th, 65th and 95th percentiles of the CVH metrics distribution in a multivariate adjusted model. Multivariate Cox regression models were used to estimate the hazards ratios (HRs) and 95% confidence intervals (CIs) of SCD and all-cause mortality for the baseline ideal CVH metrics, behavioural factors and biological health factors after the confirmation of no major departure from the proportionality assumptions using Schoenfeld residuals. 12 The CVH metrics were dichotomized, with a score of 1 given for every ideal component and 0 for poor and intermediate components, generating a CVH score ranging from 0 to 7. The seven scores were categorized into three groups: 0–2 (poor); 3–4 (intermediate); and ≥5 (ideal) CVH; a CVH score of 0–2 was used as the referent. Based on the ideal components of the two factors that constitute CVH metrics – that is, the behavioural (physical activity, smoking, BMI and HDS) and biological health factors (blood pressure, FBG and total cholesterol) – health scores of 0, 1, 2, ≥3 and 0, 1, 2, 3 were generated, respectively, with a 0 score as the referent.
Hazard ratios were calculated with adjustment in two models. Model 1 used age, alcohol consumption and SES, whereas model 2 used model 1 plus a history of coronary heart disease (CHD) and a history of type 2 diabetes mellitus. These covariates were selected based on their previously established roles as risk factors and potential confounders, taking into consideration factors in the CVH metrics. All statistical analyses were performed using Microsoft Windows software and IBM SPSS Statistics 25. A two-sided p value <0.05 was considered statistically significant.
Results
Baseline characteristics
Table 1 shows the characteristics of the study participants. During a median follow-up time of 25.8 years, 280 cases of SCD and 1289 all-cause deaths were recorded. The mean age at baseline for the 2577 men was 53 years. Only one person achieved all seven ideal metrics at baseline (Supplementary Table 2, available online). Most of the participants (91.9%) were in the ideal FBG category. No participant with a behavioural health score of 4 had an SCD event.
Baseline characteristics and cardiovascular health scores in the KIHD cohort.
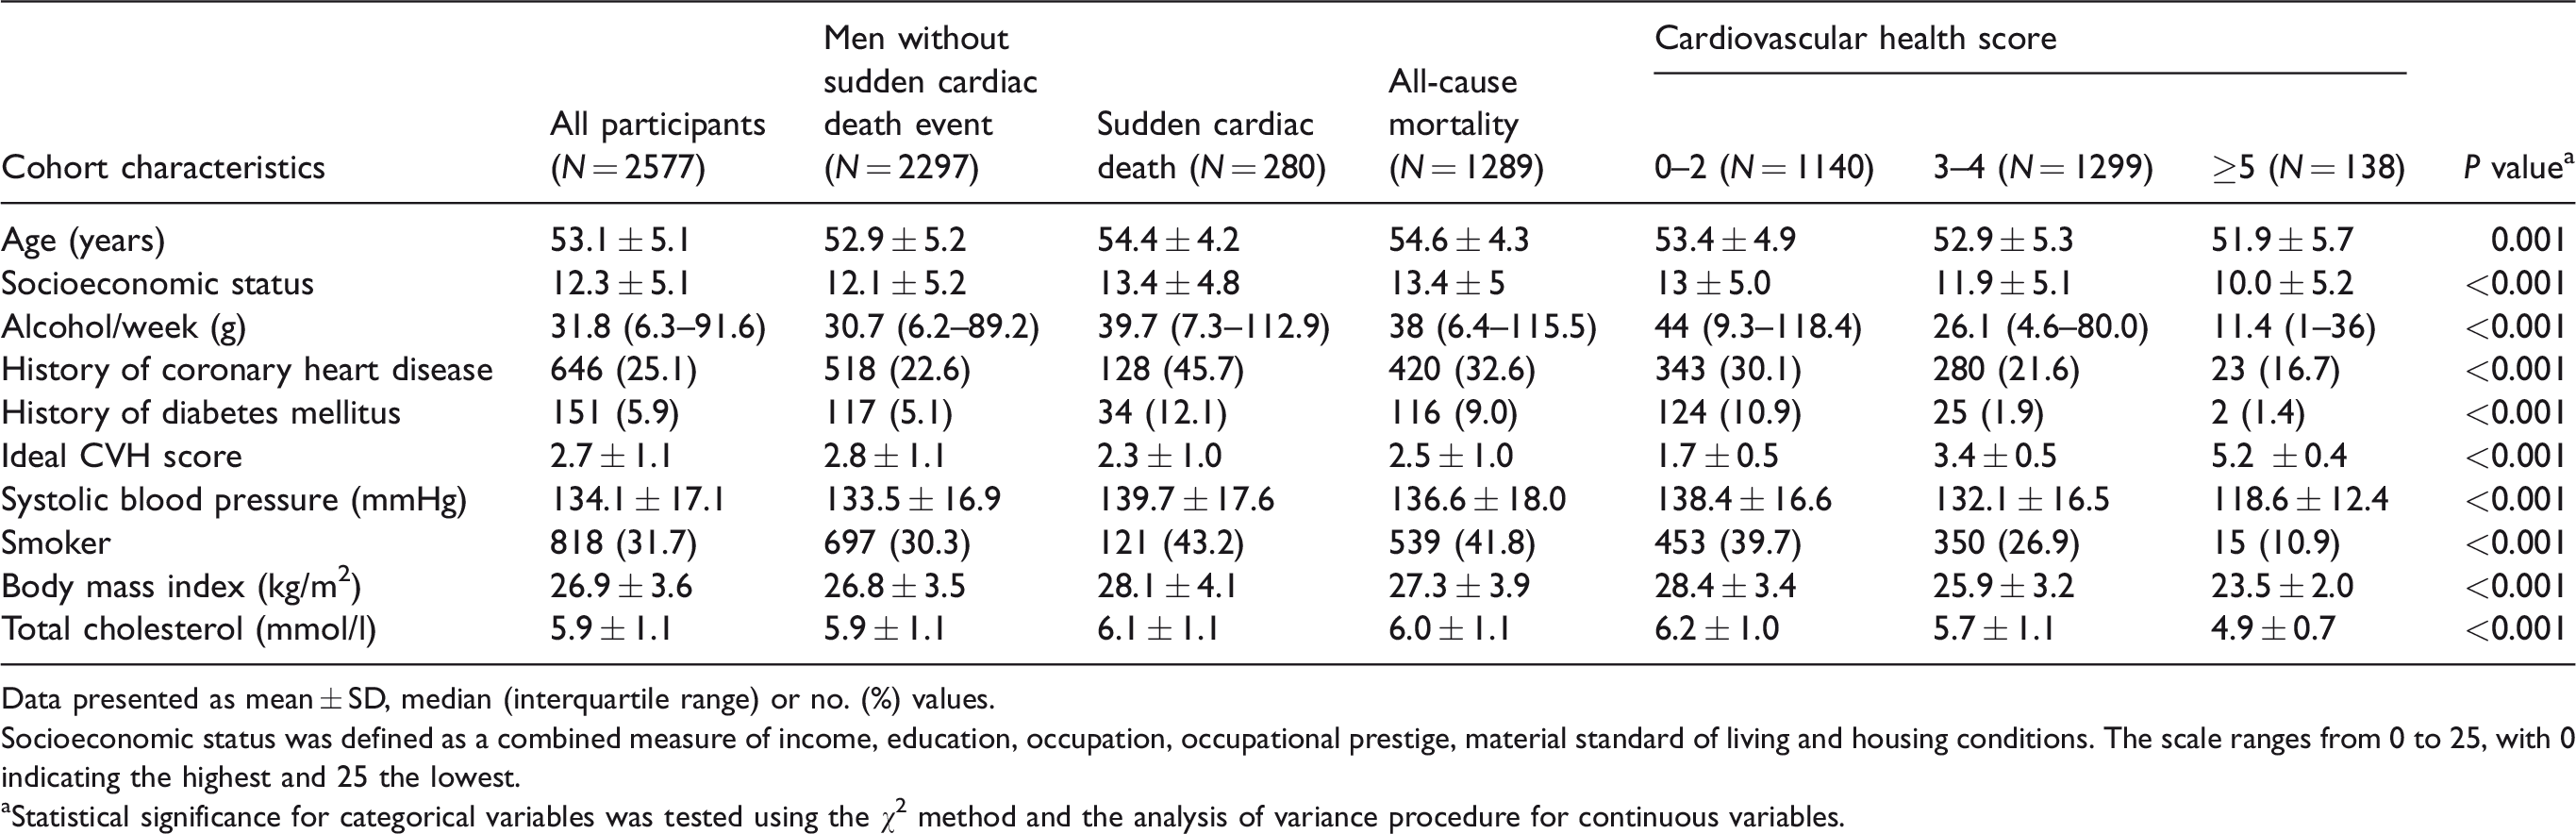
Data presented as mean ± SD, median (interquartile range) or no. (%) values.
Socioeconomic status was defined as a combined measure of income, education, occupation, occupational prestige, material standard of living and housing conditions. The scale ranges from 0 to 25, with 0 indicating the highest and 25 the lowest.
aStatistical significance for categorical variables was tested using the χ2 method and the analysis of variance procedure for continuous variables.
CVH metrics and risk of SCD and all-cause mortality
A restricted cubic spline curve showed that the risk of SCD decreased continuously with increasing CVH metrics across the range 2–7 (p value for non-linearity = 0.54) (Figure 1). Table 2 shows the association between CVH score and the risk of SCD. Men who attained a CVH score ≥5 had an 85% reduced risk of SCD compared with those with a CVH score of 0–2 (HR 0.13; 95%CI 0.03–0.53; p = 0.004) after adjustment for age, alcohol consumption and SES. The association was minimally attenuated on further adjustment for a history of CHD and a history of type 2 diabetes mellitus (model 2). Achieving a behavioural health score ≥3 showed a significant relationship with the risk of SCD compared with those with a score of 0 (HR 0.20; 95%CI 0.10–0.41; p <0.001). A similar significant association was observed with biological health scores.
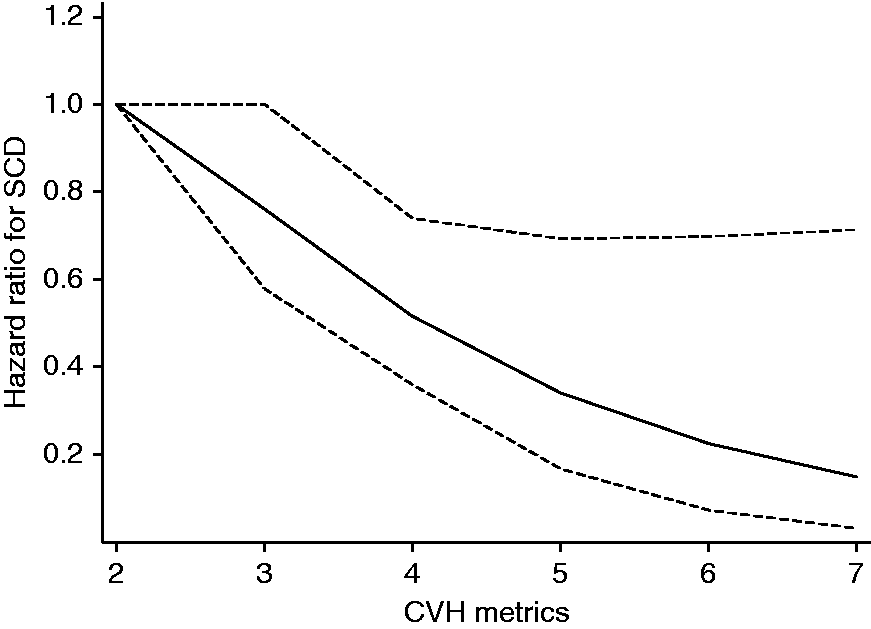
Restricted cubic curve of hazards ratio for sudden cardiac death (SCD) against cardiovascular health (CVH) metrics. Restricted cubic spline functions were analysed with knots located at the 5th, 35th, 65th and 95th percentiles of the CVH distribution, with the reference category set at 2; adjusted for age, alcohol consumption, socioeconomic status, history of coronary heart disease and history of type 2 diabetes mellitus. The dashed lines represent the 95% confidence intervals.
Association of cardiovascular health score, behavioural and biological health scores and risk of sudden cardiac death and all-cause mortality.
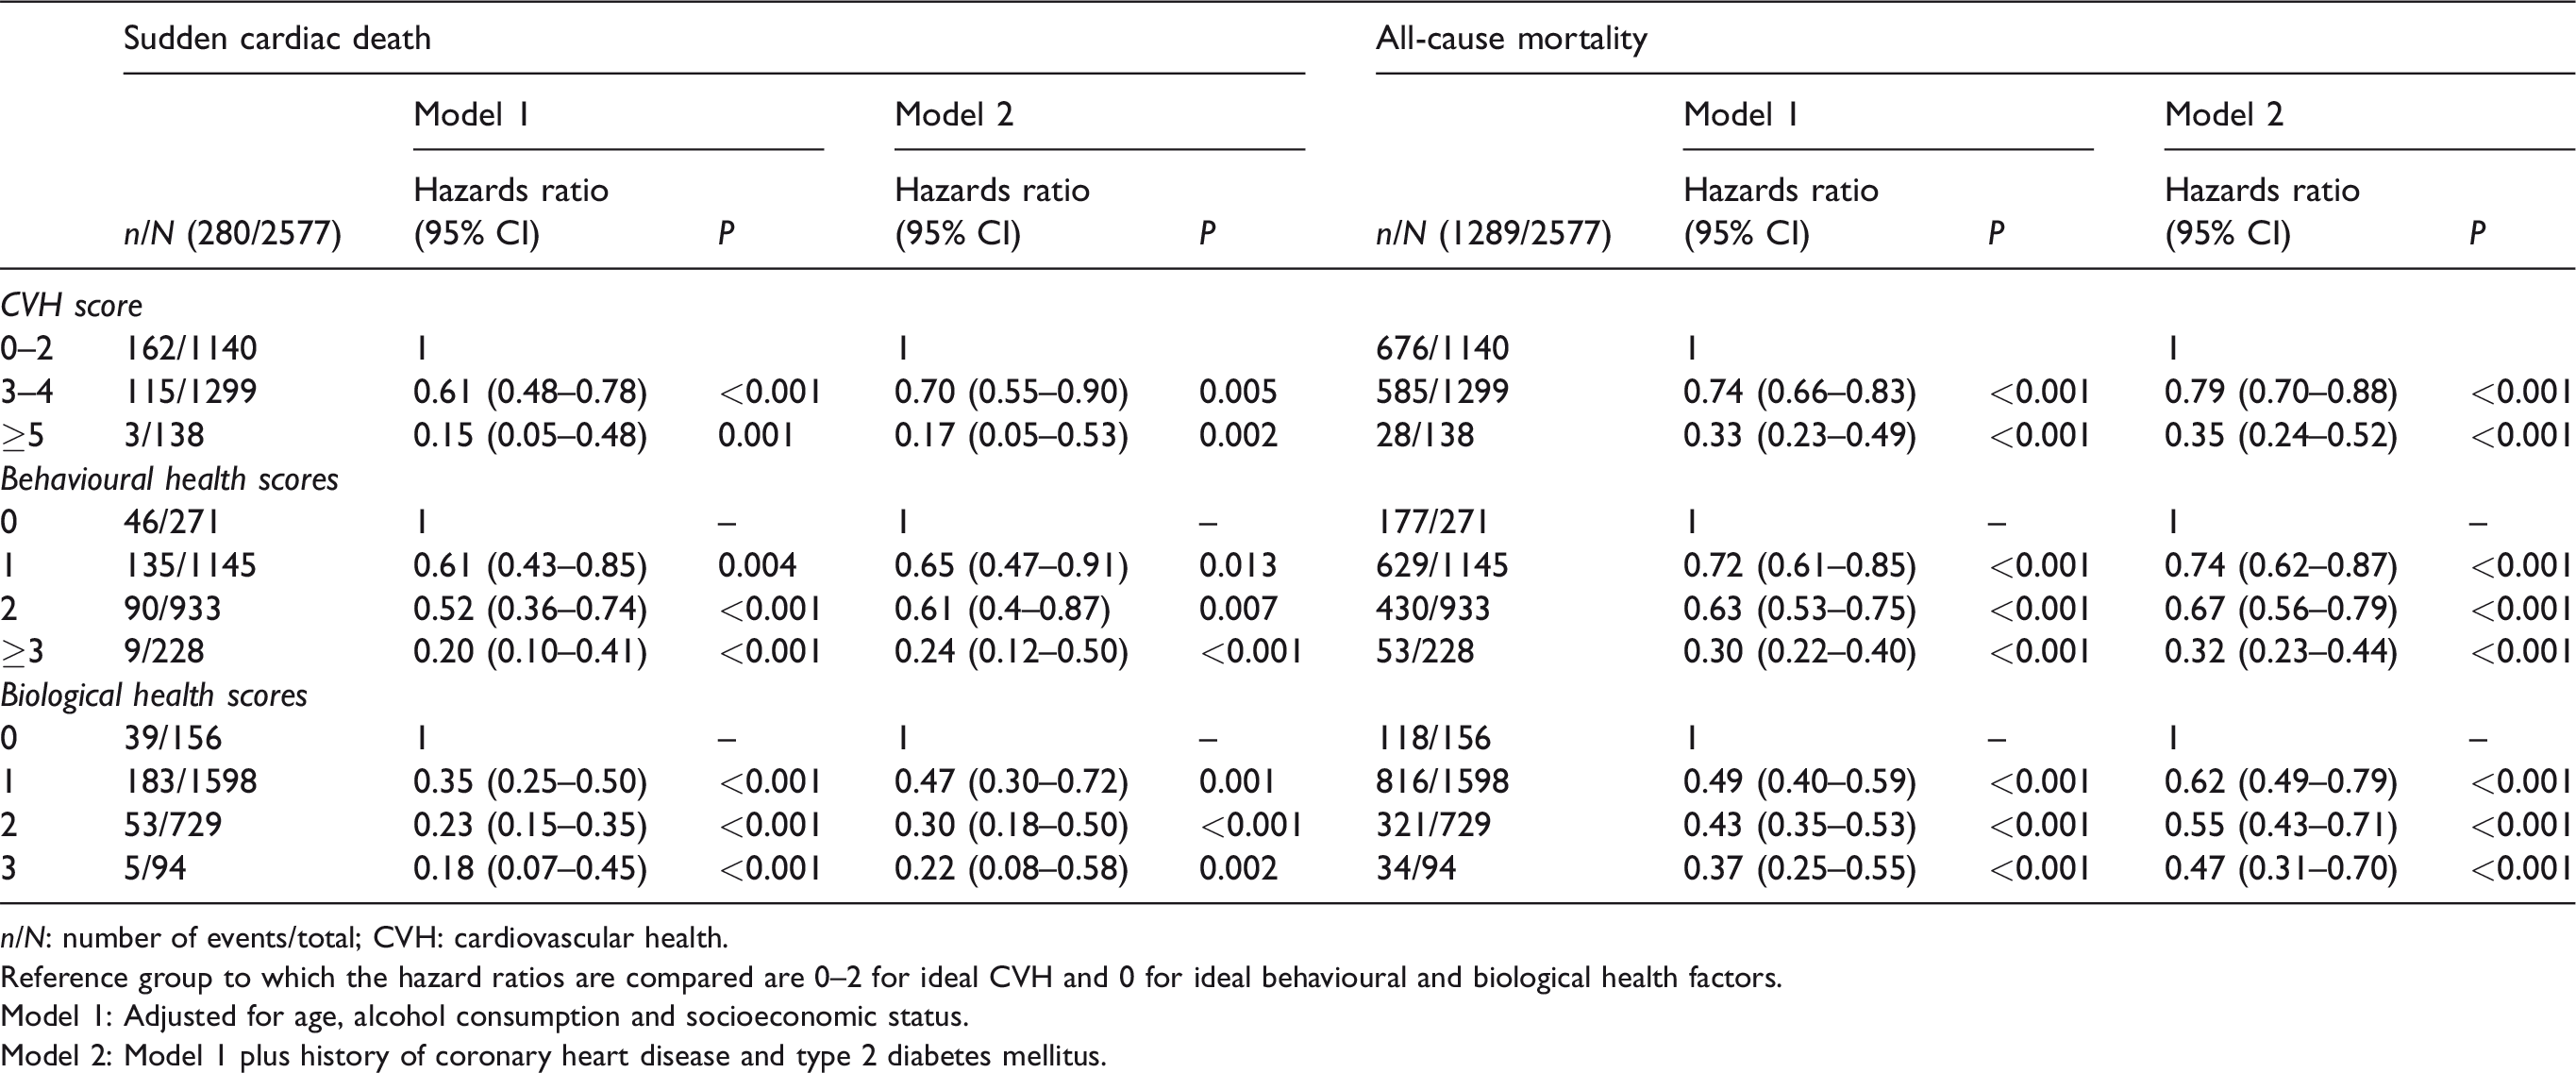
n/N: number of events/total; CVH: cardiovascular health.
Reference group to which the hazard ratios are compared are 0–2 for ideal CVH and 0 for ideal behavioural and biological health factors.
Model 1: Adjusted for age, alcohol consumption and socioeconomic status.
Model 2: Model 1 plus history of coronary heart disease and type 2 diabetes mellitus.
For the association between CVH score and risk of all-cause mortality, the risk of all-cause mortality decreased continuously with increasing CVH scores across the range 2–7 (p value for non-linearity = 0.16) (Figure 2). Men who had a minimum CVH score of 5 were at 67% lower risk compared with those with a CVH score of 0–2 after adjustments for age, alcohol consumption and SES (Table 2). An ideal behavioural factor also showed a significant association, with men who achieved a behavioural health score of at least 3 having a 70% lower risk of all-cause mortality compared with those with a score of 0 (HR 0.30; 95%CI 0.22–0.40; p <0.001). These associations between CVH scores and the risks of SCD and all-cause mortality remained statistically significant after a sensitivity analysis excluding participants with a previous history of CHD at baseline (Supplementary Table 3, available online).
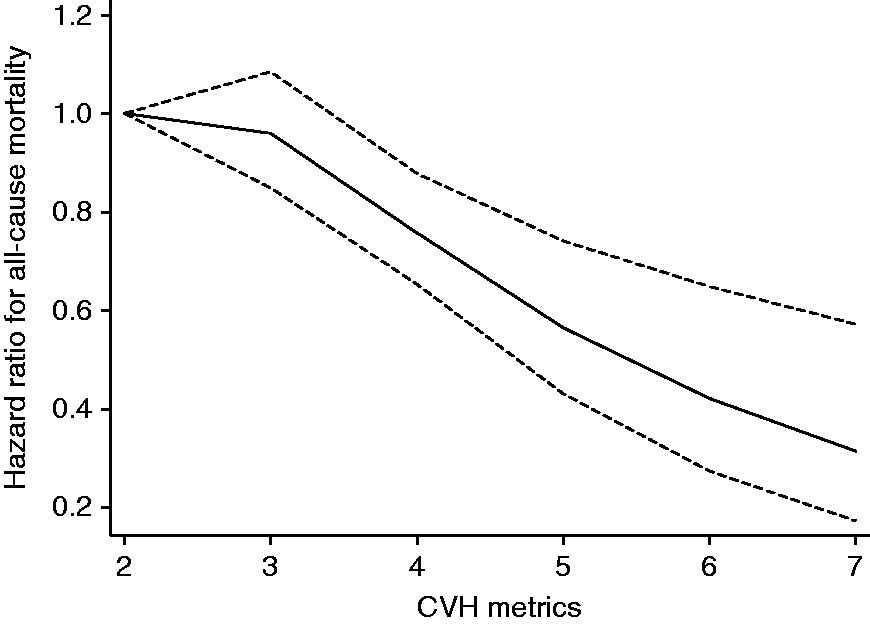
Restricted cubic curve of hazards ratio for all-cause mortality against cardiovascular health (CVH) metrics. Restricted cubic spline functions were analysed with knots located at the 5th, 35th, 65th and 95th percentiles of CVH distribution, with the reference category set at 2; adjusted for age, alcohol consumption, socioeconomic status, history of coronary heart disease and history of type 2 diabetes mellitus. The dashed lines represent the 95% confidence intervals.
Our analysis of the association of the individual components of CVH metrics and risks of SCD and all-cause mortality is shown in Supplementary Table 4 (available online). An ideal BMI is associated with a 50% reduced risk of SCD. Specifically, ideal levels of BMI, smoking status, blood pressure, FBG and total cholesterol contributed significantly to a reduced risk of SCD. Men who achieved three or all four of the ideal behavioural factors had 80 and 70% lower risks of SCD and all-cause mortality, respectively, compared with those with no ideal behavioural factor.
Discussion
In this prospective study of Finnish men, the first study to assess the association of AHA’s CVH metrics and the risk of SCD among the general population, men with a CVH score of 5–7 at baseline had 83% reduced risk of SCD after a median follow-up period of 25.8 years. Similarly, there was 65% lower risk of all-cause mortality among men with a CVH score of at least 5 compared with those with a CVH score of 0–2. The associations were consistent with linear dose–response relationships.
The distribution of ideal CVH metrics among the participants in our study is comparable with earlier studies. The most frequent metric in our study was an ideal FBG, similar to the People’s Republic of China-USA (PRC-USA) Collaborative Study cohort. 13 Also, both the PRC-USA Collaborative Study and our study have diet as the least frequent ideal metric. There is no similar study on the association of the AHA’s CVH metrics and the risk of SCD, but researchers have shown existing associations between ideal CVH and some cardiovascular outcomes and mortality.4,14–17 Thus, in the PRC-USA Collaborative Study, a 54% lower risk of all-cause mortality was observed among participants with four to seven ideal metrics compared with those with zero to two ideal metrics. 13 Similar findings were shown in the northern Manhattan study and the Three City study4,18 and were summarized in a recent meta-analysis of prospective studies. 16 Our findings are consistent with existing evidence on the association of ideal CVH and the risk of all-cause mortality.
Obesity, smoking, hypertension and diabetes have been identified as risk factors for SCD and vigorous physical activity can increase the risk of SCD.10,19 Our study shows a similar pattern of association (Supplementary Table 4, available online). It may not be surprising that ideal physical activity did not show an independent significant association with the risk of SCD compared with those participants with poor physical activity because it incorporated vigorous physical activity (Supplementary Table 1, available online), which might be a cause of sudden death.19–21 The findings remained consistent after excluding men with a previous history of CHD at baseline.
The assessment for the applicability of the AHA’s CVH metrics among middle-aged Finnish men, who are at higher risks of death from diseases of the circulatory system, 22 shows that the metrics may be applicable to European populations and could be used for health promotion purposes to reduce the burden of CVD and future SCD risk, limiting the possible use of drugs or electrical devices for prevention purposes. 23 Thus, campaigns and policies that are aimed at improving CVH metrics should be encouraged. Health professionals can use these metrics to assess and identify people at risk of SCD and encourage early modification of the CVH metrics to improve quality of life. To improve levels of behavioural factors, participants can start from those factors that they can realistically control.
The strengths of this study lie in the relatively large number of participants in a representative sample of the population of middle-aged men in Eastern Finland. They were well characterized and followed up during the study period with well-documented outcome data. However, some limitations of this study warrant mentioning. First, the results are based on Finnish men and therefore cannot be generalized to other population groups. Also, causality cannot be confirmed. Second, there could be misclassification bias given the use of self-administered questionnaires to obtain information on some of the components of the CVH metrics. Also, the substitution of salt intake with the intake of processed meat might have some effect in the computation of the HDS in this study. However, in the Finnish diet and lifestyle recommendations on the use of salt in the 1980s, the intake of processed meats fell under convenience foods to be avoided because they were among the sources of excess salt in the Finnish diet. 24 Third, given the long period of follow-up and the use of baseline assessments, it is likely that the levels of CVH metrics may change over time. This could be due to some potential factors such as ageing, disease, modification of lifestyle and use of lipid-lowering and antihypertensive drugs, thereby leading to the underestimation of true associations as a result of regression dilution bias. Therefore, it would be interesting to investigate further how the longitudinal evolution of the CVH metrics or interventions to improve ideal CVH influences the rates of SCD and all-cause mortality.
Baseline ideal CVH values are strongly and linearly associated with the future risks of SCD and all-cause mortality among Finnish men. Interventions that will help the population to achieve more ideal CVH metrics should be emphasized and embraced as a wide scale health promotion tool to reduce SCD and to improve CVH in the general population.
Supplemental Material
CPR915338 Supplemenatry figure - Supplemental material for Association between ideal cardiovascular health and risk of sudden cardiac death and all-cause mortality among middle-aged men in Finland
Supplemental material, CPR915338 Supplemenatry figure for Association between ideal cardiovascular health and risk of sudden cardiac death and all-cause mortality among middle-aged men in Finland by Nzechukwu M Isiozor, Setor K Kunutsor, Ari Voutilainen, Sudhir Kurl, Jussi Kauhanen and Jari A Laukkanen in European Journal of Preventive Cardiology
Supplemental Material
CPR915338 Supplementary tables - Supplemental material for Association between ideal cardiovascular health and risk of sudden cardiac death and all-cause mortality among middle-aged men in Finland
Supplemental material, CPR915338 Supplementary tables for Association between ideal cardiovascular health and risk of sudden cardiac death and all-cause mortality among middle-aged men in Finland by Nzechukwu M Isiozor, Setor K Kunutsor, Ari Voutilainen, Sudhir Kurl, Jussi Kauhanen and Jari A Laukkanen in European Journal of Preventive Cardiology
Footnotes
Author contribution
NI, SKK and JL contributed to the conception and design as well as the acquisition, analysis and interpretation of the work. AV contributed to the acquisition and analysis for the work. SK and JK contributed to the acquisition of the work. NI drafted the manuscript. All authors critically revised the paper and gave final approval and agree to be accountable for all aspects of work ensuring integrity and accuracy.
Acknowledgements
The authors thank the staff of the Kuopio Research Institute of Exercise Medicine and the Research Institute of Public Health and University of Eastern Finland, Kuopio, Finland, for the collection of data in this study.
Declaration of conflicting interests
The author(s) declared no potential conflicts of interest with respect to the research, authorship, and/or publication of this article.
Funding
The author(s) disclosed receipt of the following financial support for the research, authorship and/or publication of this article: Prof. Laukkanen acknowledges support from The Finnish Foundation for Cardiovascular Research, Helsinki, Finland. Dr. Kunutsor acknowledges support from the NIHR Biomedical Research Centre at University Hospitals Bristol NHS Foundation Trust and the University of Bristol. The views expressed in this publication are those of the authors and not necessarily those of the NHS, the National Institute for Health Research or the Department of Health and Social Care. These sources had no role in design and conduct of the study; collection, management, analysis, and interpretation of the data; and preparation, review, or approval of the manuscript.
References
Supplementary Material
Please find the following supplemental material available below.
For Open Access articles published under a Creative Commons License, all supplemental material carries the same license as the article it is associated with.
For non-Open Access articles published, all supplemental material carries a non-exclusive license, and permission requests for re-use of supplemental material or any part of supplemental material shall be sent directly to the copyright owner as specified in the copyright notice associated with the article.