
Abstract
Background
Guidelines recommend considering workload in interpretation of the systolic blood pressure (SBP) response to exercise, but reference values are lacking.
Design
This was a retrospective, consecutive cohort study.
Methods
From 12,976 subjects aged 18–85 years who performed a bicycle ergometer exercise test at one centre in Sweden during the years 2005–2016, we excluded those with prevalent cardiovascular disease, comorbidities, cardiac risk factors or medications. We extracted SBP, heart rate and workload (watt) from ≥ 3 time points from each test. The SBP/watt-slope and the SBP/watt-ratio at peak exercise were calculated. Age- and sex-specific mean values, standard deviations and 90th and 95th percentiles were determined. Reference equations for workload-indexed and peak SBP were derived using multiple linear regression analysis, including sex, age, workload, SBP at rest and anthropometric variables as predictors.
Results
A final sample of 3839 healthy subjects (n = 1620 female) were included. While females had lower mean peak SBP than males (188 ± 24 vs 202 ± 22 mmHg, p < 0.001), workload-indexed SBP measures were markedly higher in females; SBP/watt-slope: 0.52 ± 0.21 versus 0.41 ± 0.15 mmHg/watt (p < 0.001); peak SBP/watt-ratio: 1.35 ± 0.34 versus 0.90 ± 0.21 mmHg/watt (p < 0.001). Age, sex, exercise capacity, resting SBP and height were significant predictors of the workload-indexed SBP parameters and were included in the reference equations.
Conclusions
These novel reference values can aid clinicians and exercise physiologists in interpreting the SBP response to exercise and may provide a basis for future research on the prognostic impact of exercise SBP. In females, a markedly higher SBP in relation to workload could imply a greater peripheral vascular resistance during exercise than in males.
Introduction
Systolic blood pressure (SBP) is measured routinely during clinical exercise testing and abnormal SBP responses are predictive of underlying 1 as well as future2,3 cardiovascular disease. Depending on the population studied, higher2,4–6 as well as lower1,5,7–9 peak SBP values at exercise testing have been found to be associated with cardiovascular and all-cause mortality, and there is currently no consensus on the normal SBP response to exercise.10,11
During a progressive exercise test, SBP rises in proportion to the increment in workload, due to the fact that cardiac output is almost linearly related to workload, while also being positively related to arterial blood pressure.12–15 Although current exercise testing recommendations16,17 and hypertension guidelines 10 acknowledge the importance of interpreting the SBP response in relation to workload, it is not detailed how this should be done. Several studies present upper limits for peak SBP, stratified by sex and age groups, although they offer little guidance on how to account for workload in evaluating the SBP response.18–20 This may be of importance as recent data suggest that a steeper increase in SBP in relation to workload is a stronger prognostic factor of mortality than peak SBP alone. 21 However, the lack of normative data on the workload-indexed SBP response to exercise in the literature currently limits its applicability in clinical practice and research settings.
The aim of the current study was to assess the normal SBP response to exercise in relation to workload in a large group of male and female adults free from cardiovascular disease and risk factors. Specifically, we aimed to provide normative data on the slope of SBP increase per watt (W) increment (SBP/W-slope), as well as on the ratio of SBP and W at peak exercise.
Methods
Design and subjects
In this retrospective cohort study, we considered all consecutive exercise tests (n = 12,976) in individuals aged 18–85 years, performed at the Department of Clinical Physiology at Kalmar County Hospital in the south-east of Sweden between May 2005 and October 2016.
We applied strict exclusion criteria (Figure 1, detailed in Supplementary Table 1) in order to include only subjects free from underlying cardiovascular disease, risk factors and medications. In brief, we excluded subjects with a registered inpatient or outpatient diagnosis of hypertension, diabetes mellitus, hyperlipidaemia, ischemic heart disease, cardiac arrhythmia, heart valve disease, heart failure, cardiac myopathy, cerebrovascular disease, lung disease, renal disease, arterial/venous thrombosis or malignant cancer within the last five years prior to the exercise test; self-reported use of any cardiac, anti-hypertensive, diabetes or lipid-lowering medication; and individuals who were diagnosed with ischemic heart disease, heart failure, atrial fibrillation or died, within one year from the exercise test. Moreover, subjects with submaximal exercise tests (Borg rating of perceived exertion [RPE] < 16), any arrhythmia during exercise or a poor exercise capacity (<75% of age-predicted)
22
were excluded. Finally, subjects with extreme SBP values at rest (<80 mmHg or >200 mmHg), low SBP during exercise (<100 mmHg), a drop in SBP during exercise or fewer than three SBP measures during exercise were excluded.
Selection of final sample.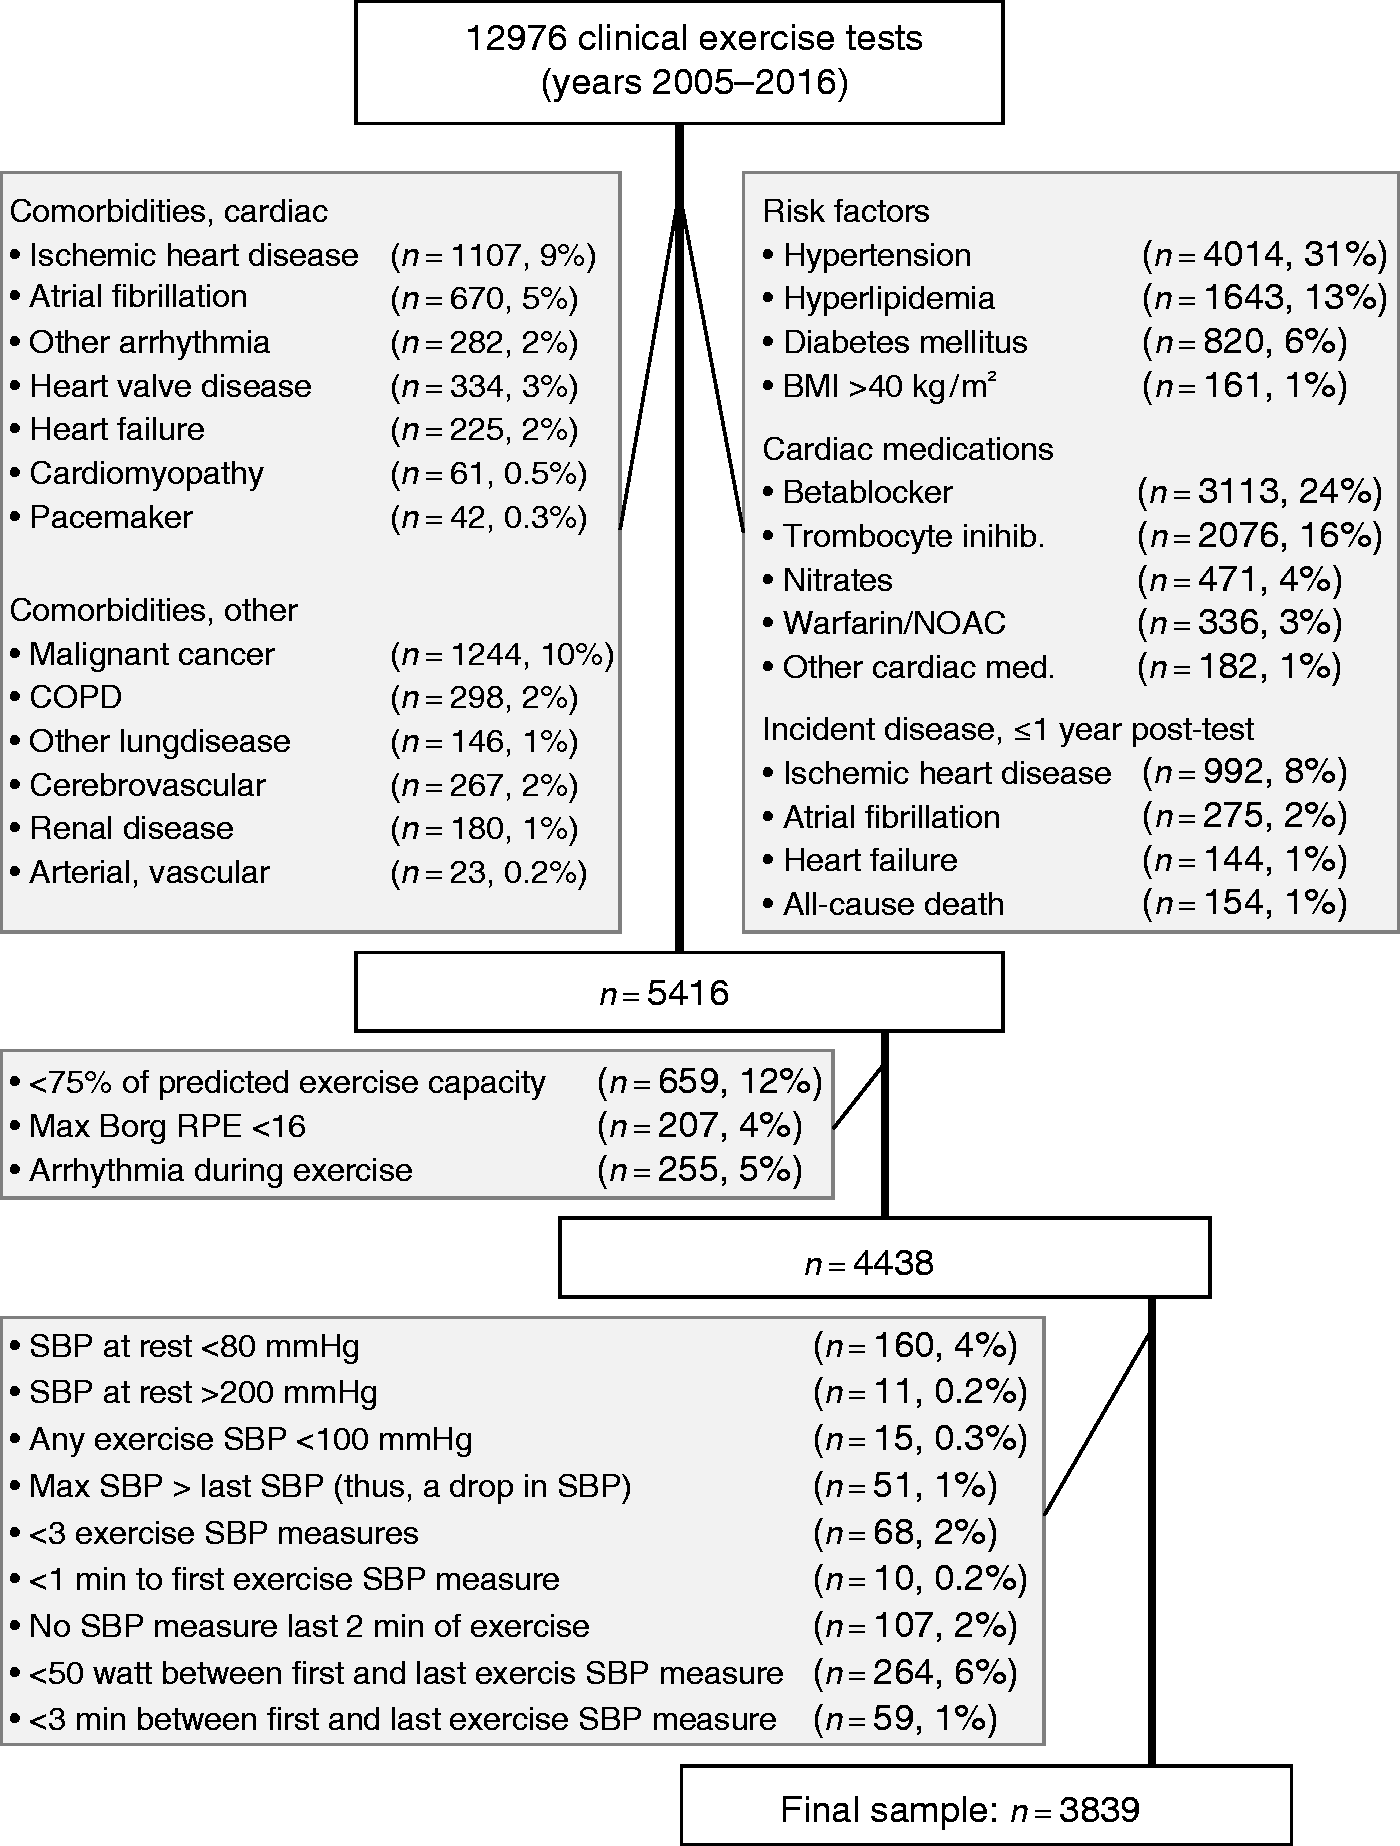
The database was crosslinked (using the Swedish unique personal identification number) with the Swedish National Patient Register, 23 enabling the retrieval of all hospital inpatient and outpatient diagnoses coded by the International Classification of Diseases version 10, as well as admission diagnoses for all participants during the five years before the test and one year after the test. 23 Crosslinking with the National Causes of Death Register 24 was performed to exclude subjects who died within one year after the test. The completeness of these registries is well established.24,25 Medications were recorded at the time of the test, as reported by the patient. Prevalent hypertension, diabetes and hyperlipidaemia were defined as either: (a) a diagnosis per hospital data; or (b) use of any medication relevant for each of the respective diseases as detailed in Supplementary Table 1.
The study was approved by the Regional Ethical Review Board (2012/379-31 and 2018/141-31) and informed consent was waived.
Exercise test
All exercise tests were performed on an electrically braked bicycle ergometer (Rodby Inc, Karlskoga, Sweden). A 12-lead electrocardiogram was recorded at rest before, during and after exercise (CASE 12; Marquette Electronics Inc, and CASE v 6.51, GE Healthcare, Milwaukee, WI, USA). An individualized ramp protocol was used, commencing at 20–100 W, followed by a continuous ramp of 10, 15 or 20 W/min, aiming at a total exercise time of 8–12 minutes. In the absence of any termination criteria (severe chest pain, ST-depression ≥0.4 mV, decreasing blood pressure or malignant dysrhythmias), each test was driven as far as possible, aiming at maximal or near-maximal exertion of the subject. Percent of age-predicted maximal heart rate (HRmax) was calculated as: 100 × (HRmax/[220 – age]), although it was not used as a termination criterium.
During the test, each subject was asked to rate their level of perceived exertion (Borg RPE), dyspnea and chest pain (Borg CR10) every 2–3 minutes, and any symptoms were recorded. To allow comparisons of maximal workload regardless of W increment per minute, Wmax was re-calculated to a standard protocol with an increment of 15 W/min (men) and 10 W/min (women) by the following formulas: 26 Wmaxcorr (men) = Wmax × (incremental workload used/15)1/6; Wmaxcorr (women) = Wmax × (incremental work load used/10)1/6. For indexing of SBP measures, the actual measured workload was used. Wmaxcorr was used to calculate the percent of predicted exercise capacity, in relation to previously published Swedish reference equations, 22 accounting for age, sex and height.
Blood pressure (BP) measurement and calculations
Resting BP measurement before exercise included SBP and diastolic BP, in the supine position after a few minutes of rest, as well as SBP sitting on the bicycle 1–2 minutes before exercise commenced. During exercise, SBP was measured in the right arm by using a Doppler probe over the radial artery, with manual cuff inflation/deflation every 2–3rd minute throughout the test. The subject was instructed to let go of the handlebars with both arms, and let the right arm hang loosely during measurement. SBP was recorded at the appearance of the first Korotkoff sound, and each SBP measurement was recorded in the digital exercise test protocol, with the corresponding test time, heart rate and workload (in W) added automatically.
The highest SBP during exercise (SBPmax) as well as the first and last SBP measurements during the ramp protocol were recorded (SBPfirst and SBPlast). In addition, we recorded SBPmid as the SBP measurement at the timepoint nearest the mid of SBPlast and SBPfirst, as well as the second last SBP measurement (SBPsecondlast) during exercise. The SBP/W-ratio was calculated as the ratio of SBP over the corresponding workload at each measurement point (e.g. SBPfirst/Wfirst). The peak SBP/W-ratio was defined as SBPlast/Wlast. The SBP/W-slope was calculated as the ratio of the difference in SBP from the first to the last SBP measurement during exercise over the increment in W between these two measures ([SBPlast – SBPfirst]/[Wlast – Wfirst]).
Statistical analyses
Cross-linking of databases and initial data cleaning were performed using Stata Statistical Software: Release 14.2 (StataCorp 2015, College Station, TX, USA). Further database management and statistical analyses were performed using R Studio v1.1.456 (R Studio Inc, Vienna, Austria) and SPSS software, v25.0 (IBM Corp, Armonk, NY, USA). Data were tabulated using basic descriptive statistics. Student's t-test was used to compare means and Chi2 tests were used to compare proportions. Two-sided statistical significance was set at p < 0.05 in all analyses.
First, sex- and age-specific normative values for selected SBP variables were calculated and tabulated with mean ±1 standard deviation (SD), 5th, 10th, 90th and 95th percentiles. Age categories were presented as decades between 31 and 70 years and 15-year intervals at the tails to allow for a sufficient number of subjects per group. Second, the relation between SBP and workload, as well as exercise duration, were explored using the relation between the respective mean values, in relation to sex and age. Third, separate multiple linear regression equations for males and females were derived for SBPmax, peak SBP/W-ratio and the SBP/W-slope. In each model, the dependent variable was converted to its natural logarithm if there was significant heteroscedasticity in the distribution of residuals in order to obtain a normal distribution. The following independent variables were evaluated, and inserted into the model if statistically significant at the 0.05 level and increasing the model R2 by > 0.01: (a) SBPmax – age, age2 (squared), age3 (cubed), SBPsitt, Wmax and either of height, weight, body mass index (BMI) or body surface area; (b) peak SBP/W-ratio and SBP/W-slope – age, age2, (squared), age3 (cubed), SBPsitt and either height, weight, BMI or body surface area. For both (a) and (b), the anthropometric variable with greatest improvement in each model's R2 was chosen.
Finally, a spreadsheet was built (Microsoft Excel for Office 365), incorporating the final equations of each model to facilitate clinical implementation, provided as supplementary material online.
Results
Baseline characteristics and standard exercise test data.
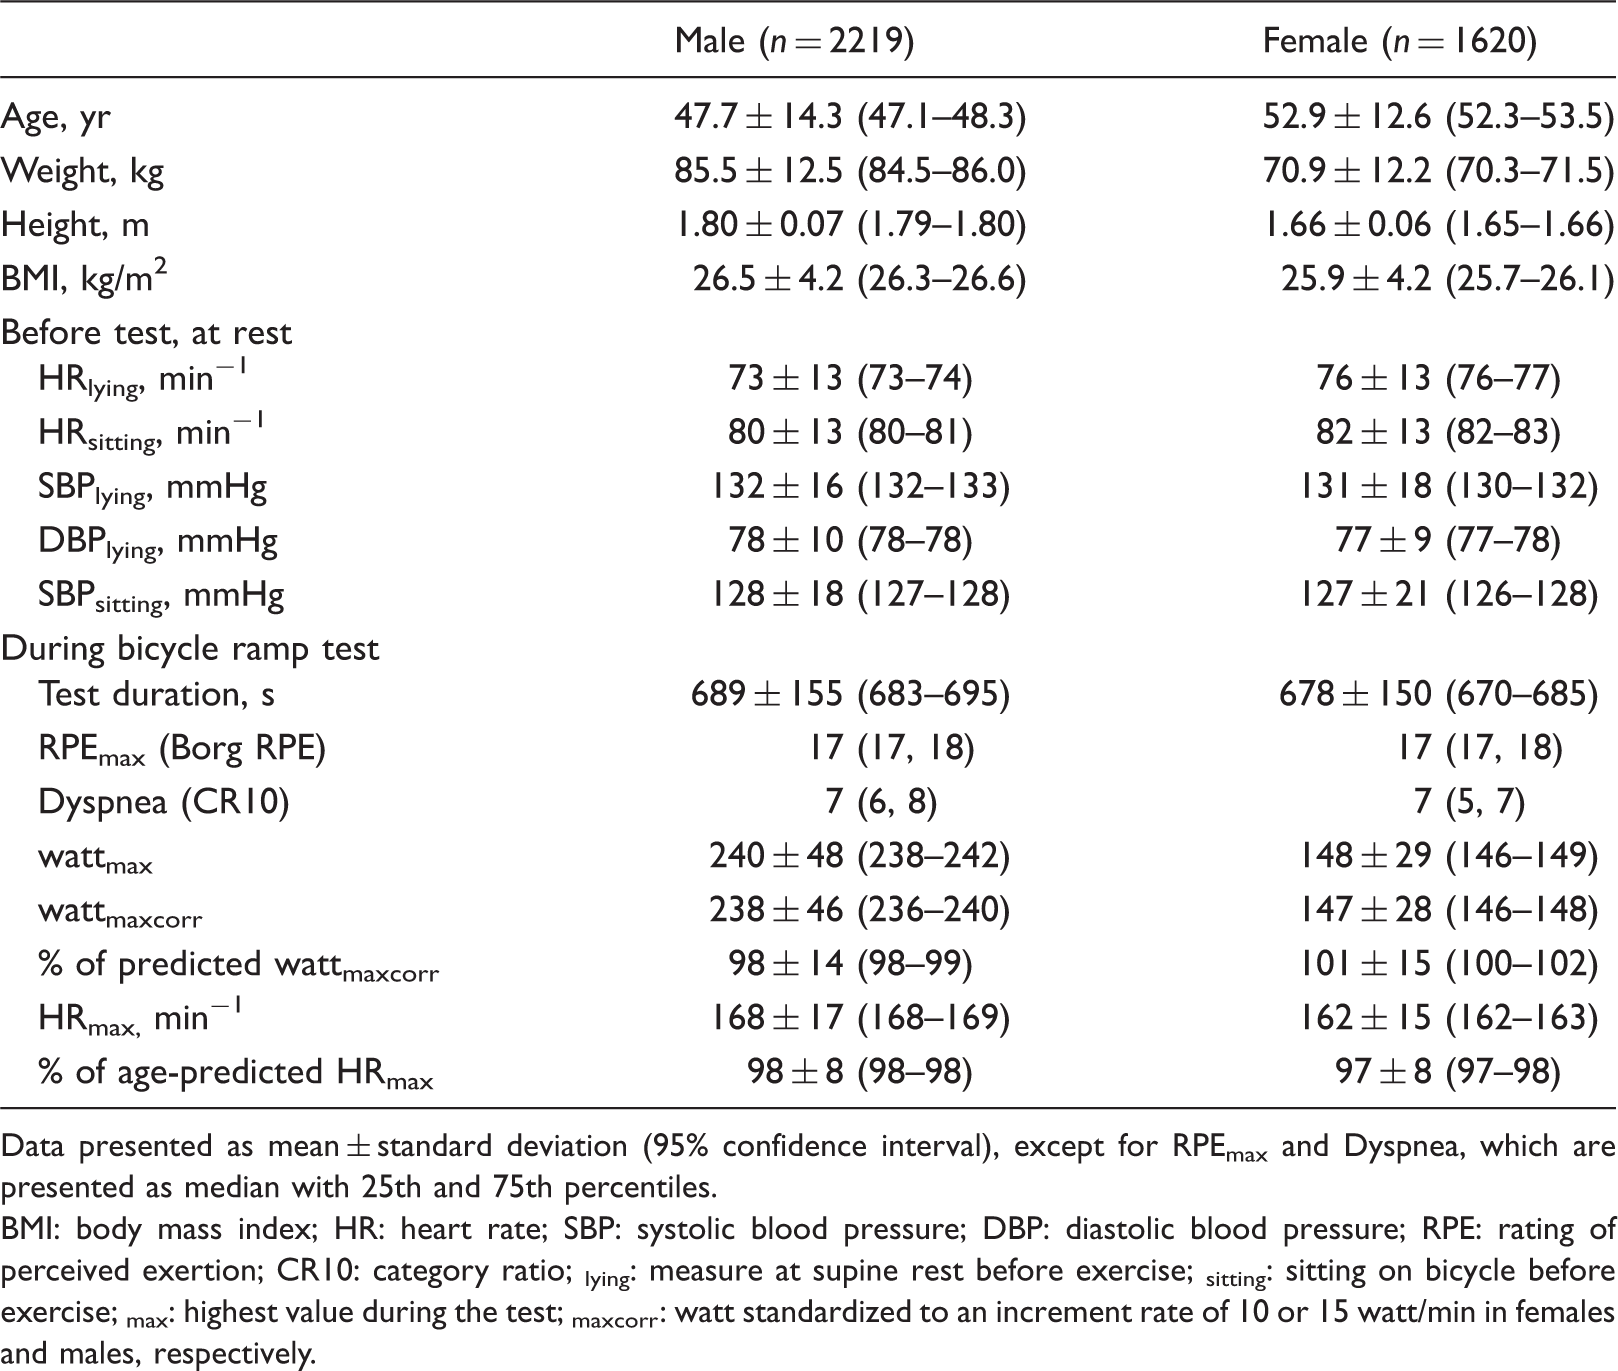
Data presented as mean ± standard deviation (95% confidence interval), except for RPEmax and Dyspnea, which are presented as median with 25th and 75th percentiles.
BMI: body mass index; HR: heart rate; SBP: systolic blood pressure; DBP: diastolic blood pressure; RPE: rating of perceived exertion; CR10: category ratio; lying: measure at supine rest before exercise; sitting: sitting on bicycle before exercise; max: highest value during the test; maxcorr: watt standardized to an increment rate of 10 or 15 watt/min in females and males, respectively.
While males and females had similar SBP before exercise, males, on average, reached a higher maximal SBP during exercise than females: 202 ± 22 versus 188 ± 24 mmHg (95% confidence interval (CI) for difference: 13–16 mmHg). In contrast, the SBP/W-slope was 27% steeper in females than in males: 0.52 ± 0.21 versus 0.41 ± 0.15 mmHg/W (95% CI for difference: 0.10–0.12).
Age and sex were important determinants of exercise capacity as well as of SBP metrics (Figure 2). Upper and lower limits of normal for all SBP measures per sex and age groups are available in Appendix 1.
Age- and sex-specific mean values and 90th percentiles for measures obtained during progressive bicycle exercise testing in 2219 males and 1620 females. Mean exercise capacity (a) and mean maximal systolic blood pressure (b) were higher in males (blue) than in females (red) in all age groups. In contrast, females had higher peak systolic blood pressure in relation to peak watt ((c), the peak SBP/watt-ratio) and larger increments in systolic blood pressure per watt increment between first and last blood pressure measurement during exercise ((d), the SBP/watt-slope).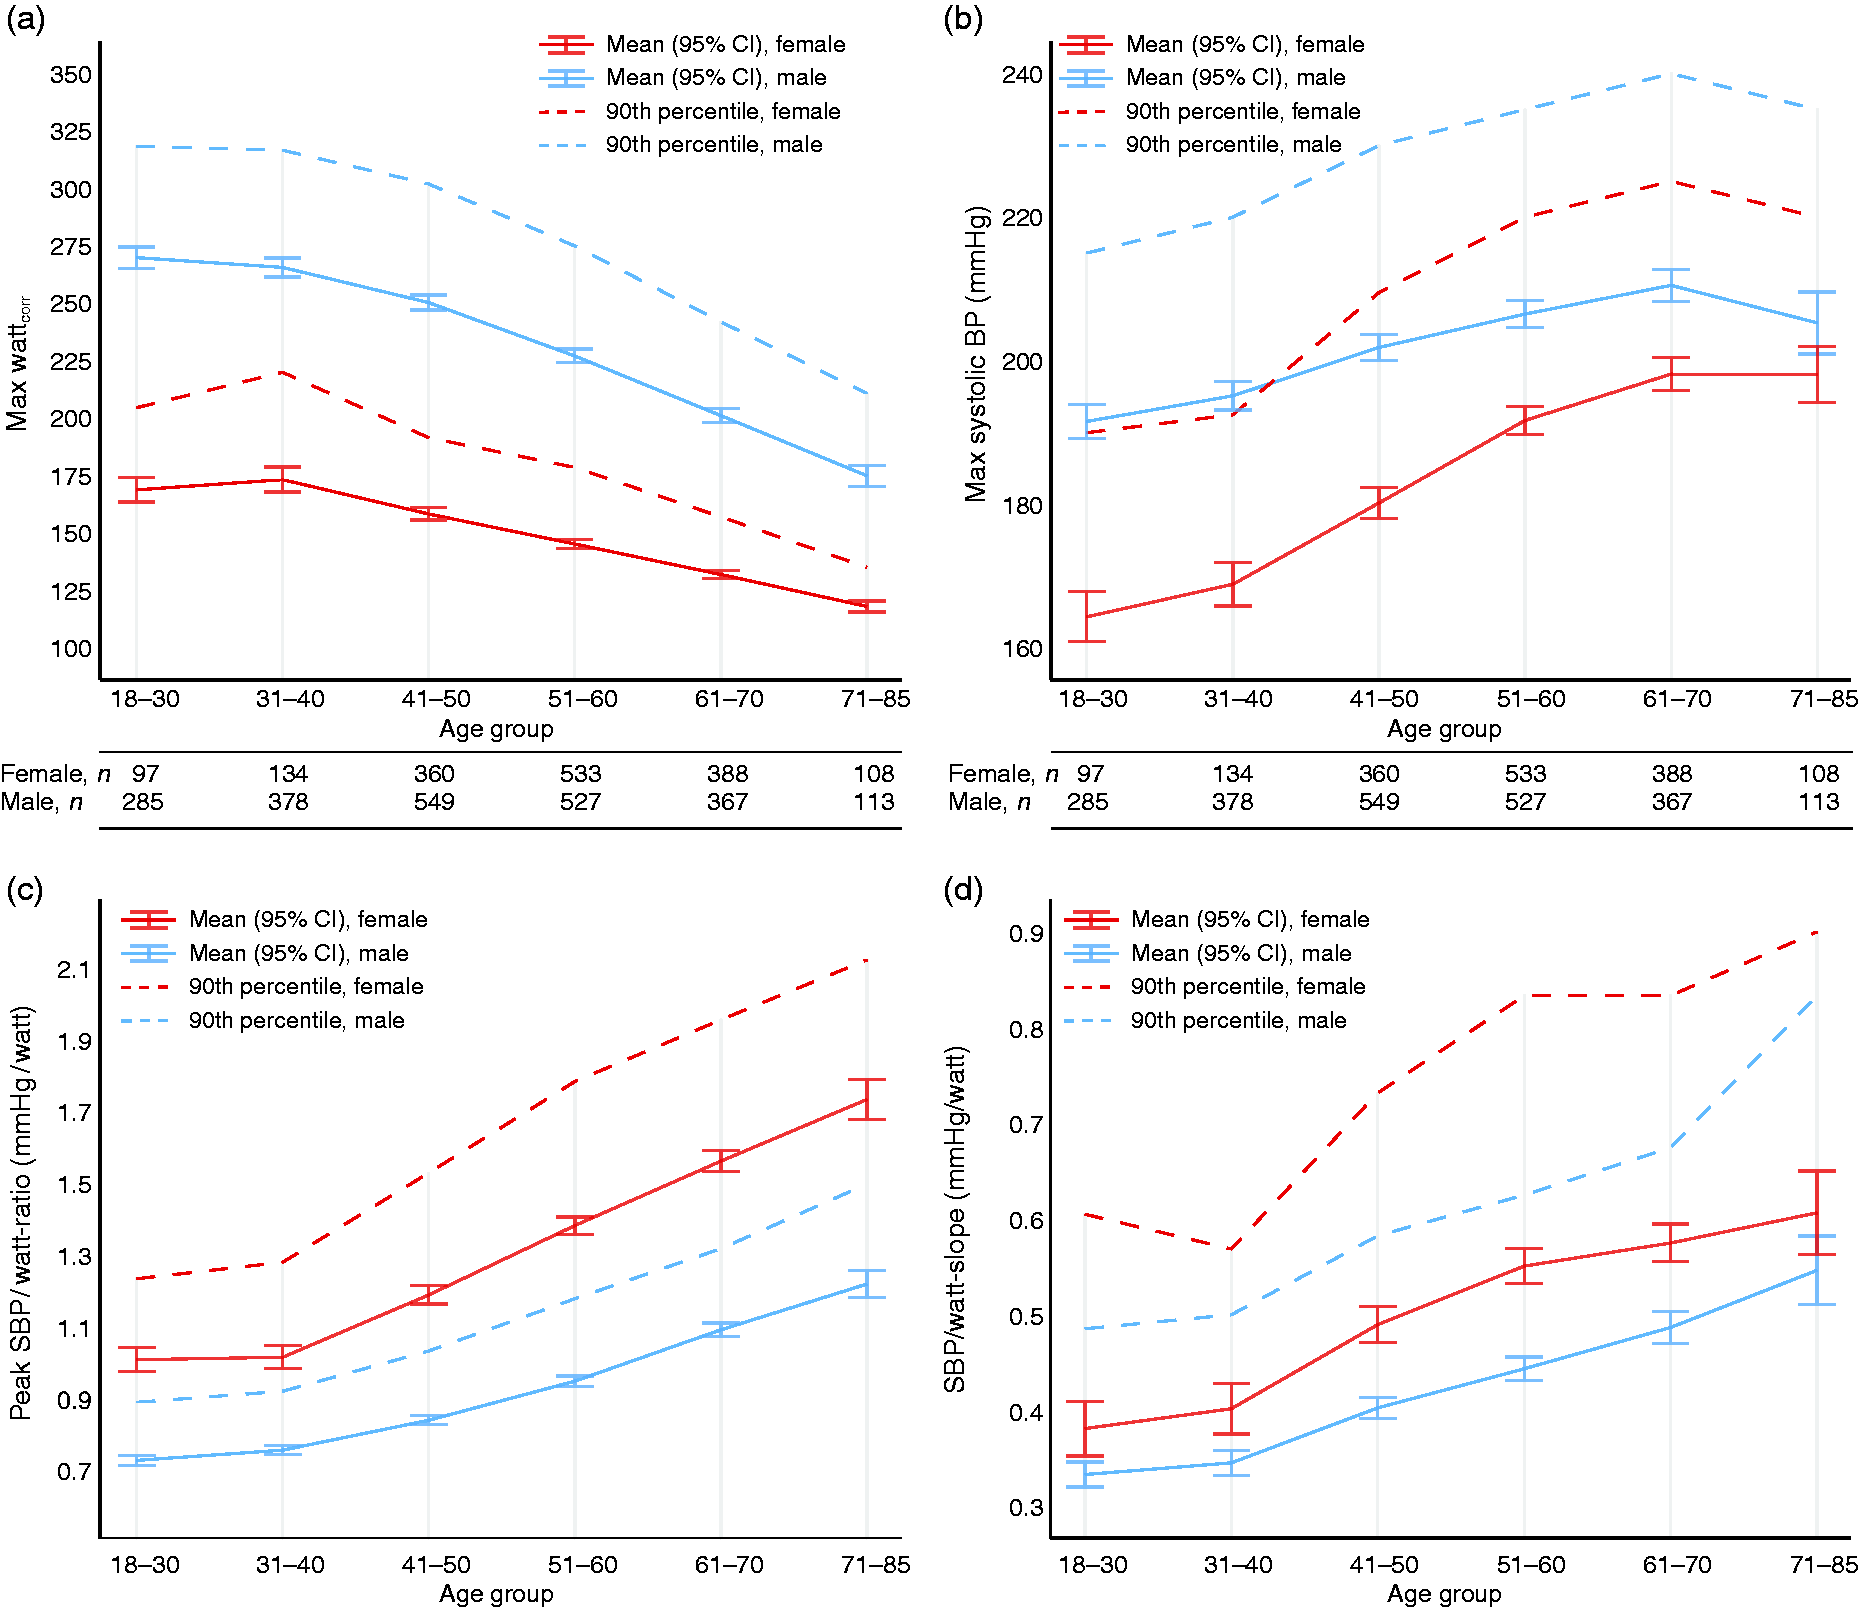
The increase in SBP during exercise was, on average, linear and is plotted as a function of exercise time or workload in Figure 3 (details in Supplementary Table 2). Younger subjects had lower SBP compared to older subjects for all measurement points, both plotted over time and over workload. In females compared to males, SBP was lower at each measurement point, but higher when plotted as a function of workload (i.e. higher SBP/W-ratio).
Mean systolic blood pressure during ramp exercise in relation to mean exercise time ((a) and (c)) and workload ((b) and (d)) presented per sex ((a) and (b)) or age group ((c) and (d)). Although females had a lower systolic blood pressure (SBP) than males at each of the four time points during exercise, they had higher SBP when plotted as a function of workload. In contrast, older subjects had higher SBP at each measurement point as well as in relation to workload. In all four panels, mean SBP at rest (seated), the first SBP measurement during exercise (1st), the measurement nearest the mid-time point between first and last measurement (Mid), the second last (2nd last) and last (Last) measurement during exercise were used. Subjects with no BP measurement during the last two minutes or the first minute of exercise were not included in the study.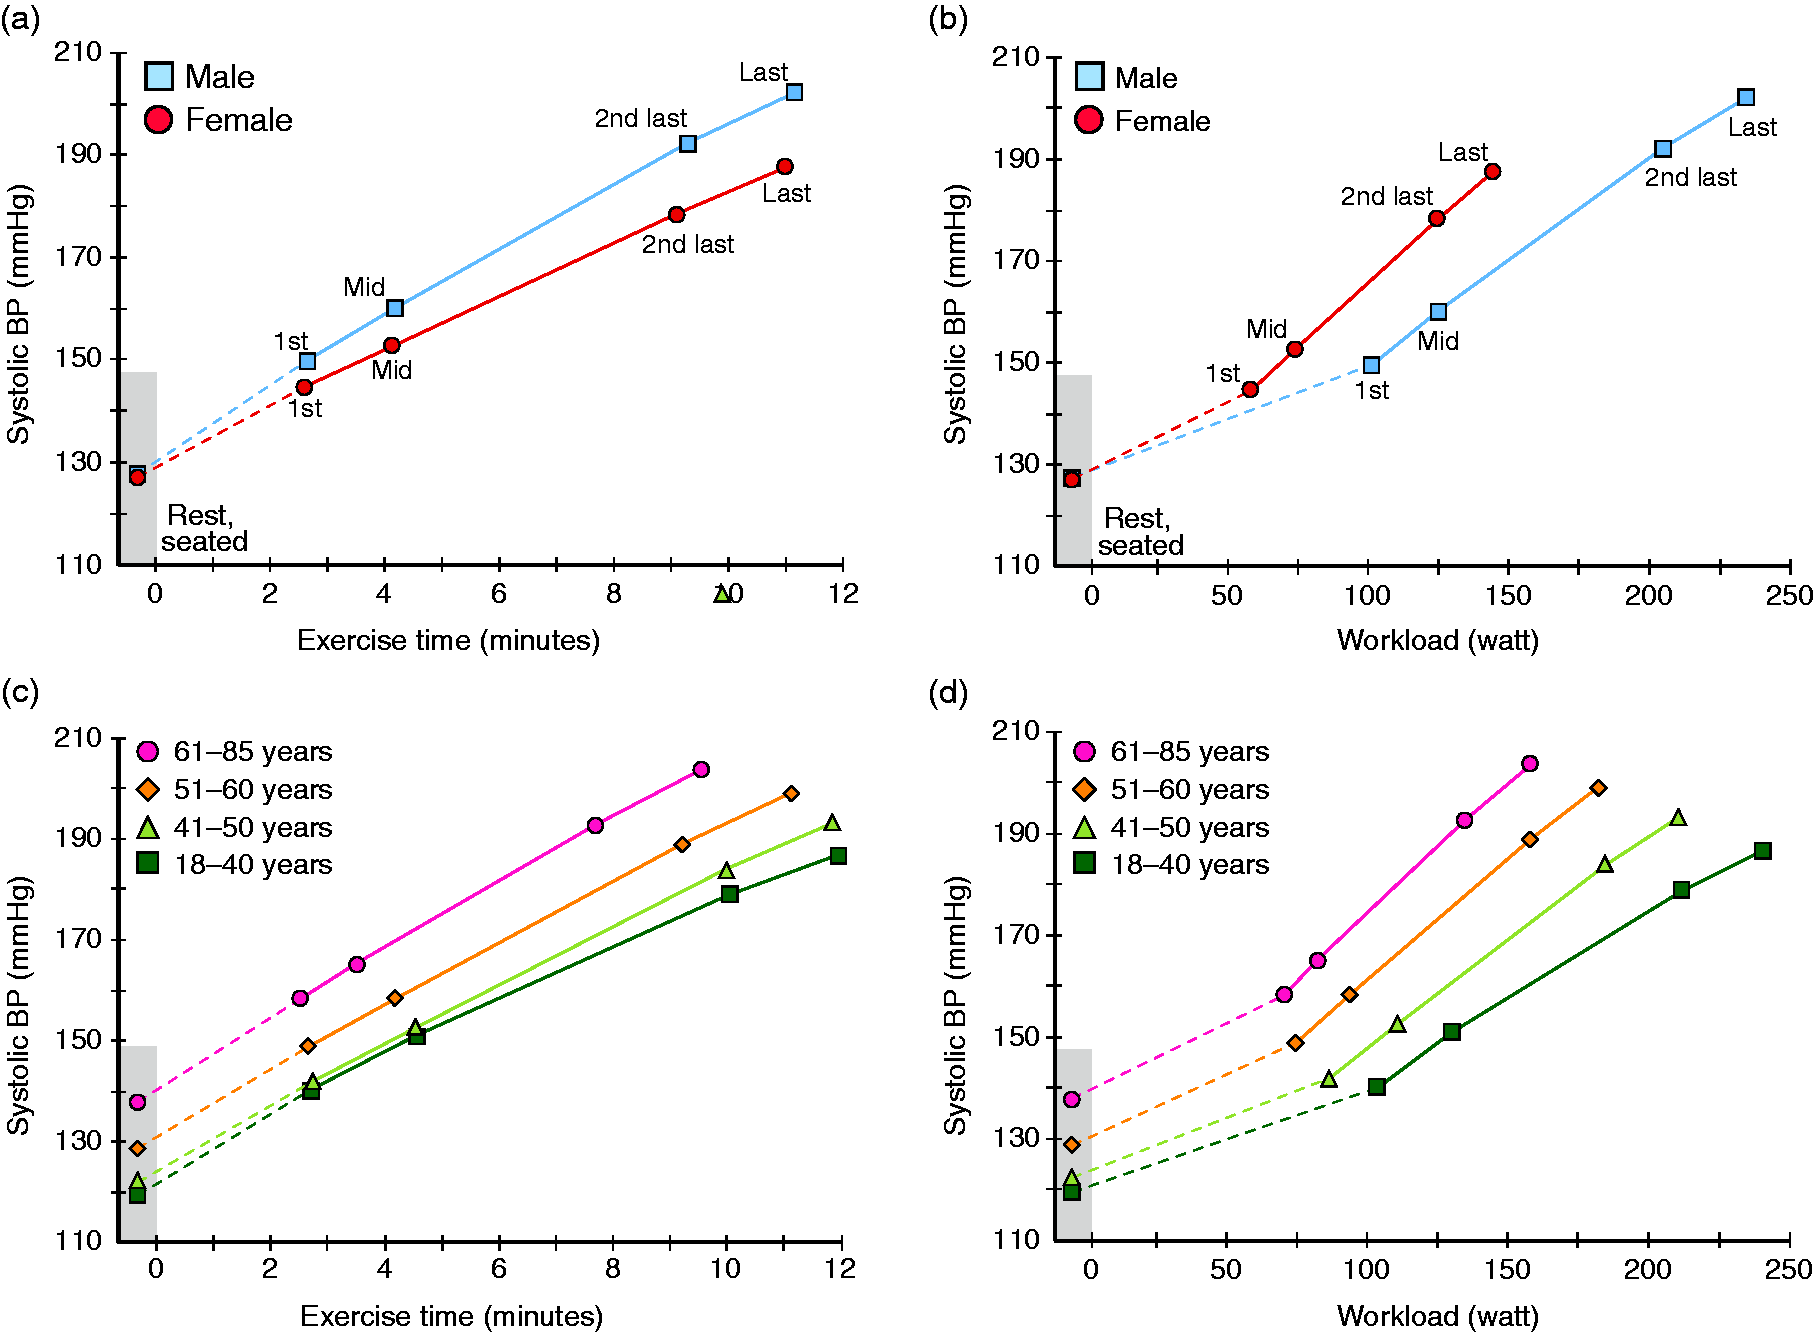
In all subjects, there was a linear association between SBPmax and the corresponding workload (Supplementary Figure 1). However, this relationship was weaker in older age groups and absent in females >40 years.
Reference equations
The associations between age and SBPmax, SBP/W-slope and the peak SBP/W-ratio, respectively, were non-linear, with a steeper increment per year above the age of 30–40 years, and different in males and females (Supplementary Figure 2). Thus, we derived sex-specific equations and used age as well as squared and cubed age in the prediction equations.
Age, seated SBP before exercise and Wmax were significant predictors of SBPmax in both males and females. Height, weight or BMI did not significantly improve the models, and were omitted. In contrast to for SBPmax, the residuals for expected minus predicted SBP/W-slope and the peak SBP/W-ratio were non-normally distributed, and the variables were transformed by the natural logarithm.
Linear multiple regression models for predicting maximal systolic blood pressure, the SBP/watt-slope and the peak SBP/watt-ratio during bicycle ramp exercise.
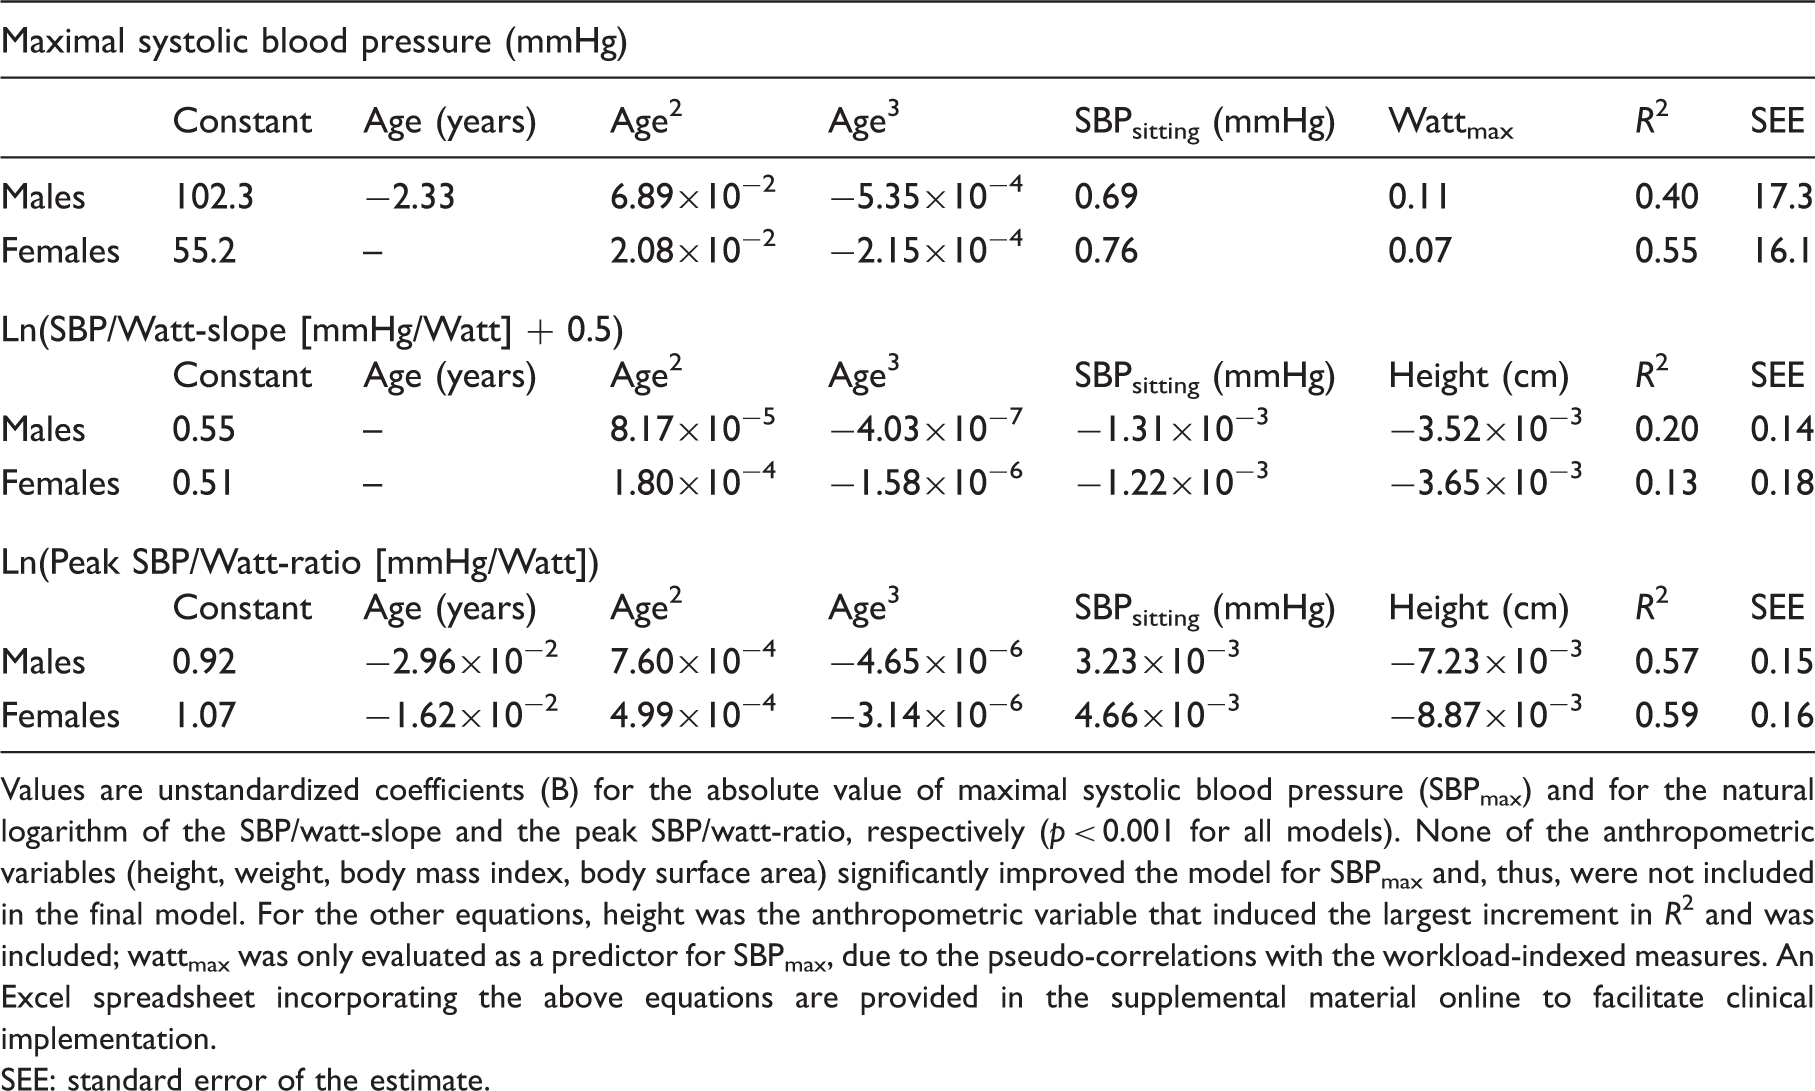
Values are unstandardized coefficients (B) for the absolute value of maximal systolic blood pressure (SBPmax) and for the natural logarithm of the SBP/watt-slope and the peak SBP/watt-ratio, respectively (p < 0.001 for all models). None of the anthropometric variables (height, weight, body mass index, body surface area) significantly improved the model for SBPmax and, thus, were not included in the final model. For the other equations, height was the anthropometric variable that induced the largest increment in R2 and was included; wattmax was only evaluated as a predictor for SBPmax, due to the pseudo-correlations with the workload-indexed measures. An Excel spreadsheet incorporating the above equations are provided in the supplemental material online to facilitate clinical implementation.
SEE: standard error of the estimate.
Discussion
Using strict selection criteria from a large clinical exercise-testing database, cross-linked with nationwide registries, this study present unique age- and sex-specific upper limits of normality as well as reference equations for the workload-indexed SBP response to exercise in subjects without cardiovascular disease or comorbidities. This study also provides novel insights into the effect of workload, age and sex on the SBP response to bicycle ergometer exercise testing, including the fact that females present with markedly higher SBP than males at a similar workload.
Rationale for using workload-indexed SBP measures
The workload-indexed SBP response to exercise has been proposed as a more physiologically relevant metric than peak SBP, 11 and current guidelines on hypertension management 10 as well as exercise testing recommendations16,17 highlight the importance of considering workload when interpreting SBP during exercise. However, while reference values on peak SBP are available,18–20 normative data for the workload-indexed SBP response to exercise testing are scarce 21 and, to our knowledge, non-existing for females and for bicycle ergometry. Thus, the current results fill an important gap in the literature and may aid physicians and exercise physiologists in interpretation of the SBP response during clinical bicycle exercise testing.
In addition, recent data suggest that using workload-indexed SBP response to exercise is superior to peak SBP in predicting mortality. 21 Earlier studies have found either increased1,2,4 or decreased7–9 risk of cardiovascular disease or death with higher peak SBP, in different populations. This can possibly be explained by the confounding effect of maximum workload (exercise capacity), associated both with higher SBP (via greater cardiac output)12,14,15 and with better survival.27,28 Using the workload-indexed SBP response to exercise may circumvent this bias, accounting for both exercise capacity and SBP. 11 Whether the SBP/W-slope or peak SBP/W-ratio provide prognostic value remains to be elucidated, although recent data on the SBP/MET-slope in males were promising. 21 The current data, including age- and sex-specific reference values and upper limits of normality, provides a basis for outcome studies using bicycle exercise testing data, to reinforce the prognostic value of clinical exercise testing.
Effects of sex and age on the SBP response to exercise
While the present study confirms the age-related decline in exercise capacity16,28 and concomitant increase in peak SBP11,19 in both males and females, it provides new insights into the effect of age and sex on workload-indexed SBP. Noteworthy, we found that while females had lower SBP than males at all measurement time points during the exercise test, the SBP/W-slope and the peak SBP/W-ratio were markedly higher in females, at all ages. As females had similar mean SBP to males sitting at rest before exercise, this implies a different physiological adaptation of SBP to exercise in females. In general, during exercise, cardiac output rises almost linearly with increasing exercise intensity, due to the increase in heart rate and stroke volume. 14 As a result, invasive studies confirm a near-linear increase in aortic, 13 mean arterial 29 as well as systolic BP12,13 with increasing muscular work. This is despite the fact that the other determinant of BP, total peripheral vascular resistance, decreases with lower- or whole-body exercise. 12 In terms of sex differences in the SBP regulation and increase during exercise, a few experimental studies are available.30–32 They suggest a difference in the exercise pressor reflex in females, 31 a blunted decrease in peripheral vascular resistance in post- (but not in pre-) menopausal females 30 or a different balance between heart rate, stroke volume and vascular resistance in males and females. 32 Albeit interesting, most studies so far are limited by experimental protocols including exercise with small muscle groups, not reflecting a clinical exercise testing setting. Nevertheless, given the fact that a certain workload requires a certain oxygen uptake, and cardiac output, it seems probable that our results reflect a higher total peripheral vascular resistance in females compared to males, when matched for workload.
Of note, in contrast to what was observed in females compared to males, older age groups compared to younger had higher SBP both when matched for exercise duration and workload. Older subjects also had higher SBP already at rest. Although all subjects were free from a diagnosis of hypertension and not on any anti-hypertensive medication, this may indicate subclinical or untreated hypertension in older subjects, manifested as an increase in peripheral vascular resistance already at rest, as well as a steeper SBP increase per W. As peak SBP has been found to be associated with the later development of manifest hypertension, 33 the SBP/W-slope or peak SBP/W-ratio could constitute a more sensitive measure, although this remains to be investigated.
Limitations
First, although we were able to use nationwide, validated registries with high coverage to establish prevalent disease, we relied on self-reported data on medications. Second, we used a clinical referral database and not a population sample. However, we applied strict inclusion criteria based upon data prior to, collected at the test and one year after the exercise test to select a healthy subset of subjects. Third, data on smoking was lacking. The average yearly prevalence of current smokers in this particular Swedish region varied between 14% (95% CI: 11–16) and 11% (95% CI: 9–13) during the study period, 34 although our selection of subjects free from prevalent or incident cardiovascular disease and free from other risk factors probably lowers the prevalence of smokers significantly. Finally, data on leisure time physical activity were not available, which would be of interest to relate to the workload-indexed SBP response.
Conclusions
This study provides the first reference values and equations for the workload-indexed SBP response to bicycle ergometer exercise testing from a large number of healthy males and females across a wide age span. These data may have important implications in that they can aid clinicians, in line with current exercise testing recommendations,16,17 to account for workload when interpreting exercise SBP, and may provide a more meaningful way of distinguishing an abnormal SBP response to exercise than peak SBP alone. The fact that females had a markedly steeper SBP/W-slope than males is interesting, and warrants physiological studies including direct measures of central and peripheral haemodynamics in both sexes.
Supplemental Material
CPR909667 Supplemental Material1 - Supplemental material for Age- and gender-specific upper limits and reference equations for workload-indexed systolic blood pressure response during bicycle ergometry
Supplemental material, CPR909667 Supplemental Material1 for Age- and gender-specific upper limits and reference equations for workload-indexed systolic blood pressure response during bicycle ergometry by Kristofer Hedman, Thomas Lindow, Viktor Elmberg, Lars Brudin and Magnus Ekström in European Journal of Preventive Cardiology
Supplemental Material
CPR909667 Supplemental Material2 - Supplemental material for Age- and gender-specific upper limits and reference equations for workload-indexed systolic blood pressure response during bicycle ergometry
Supplemental material, CPR909667 Supplemental Material2 for Age- and gender-specific upper limits and reference equations for workload-indexed systolic blood pressure response during bicycle ergometry by Kristofer Hedman, Thomas Lindow, Viktor Elmberg, Lars Brudin and Magnus Ekström in European Journal of Preventive Cardiology
Supplemental Material
CPR909667 Supplemental Material3 - Supplemental material for Age- and gender-specific upper limits and reference equations for workload-indexed systolic blood pressure response during bicycle ergometry
Supplemental material, CPR909667 Supplemental Material3 for Age- and gender-specific upper limits and reference equations for workload-indexed systolic blood pressure response during bicycle ergometry by Kristofer Hedman, Thomas Lindow, Viktor Elmberg, Lars Brudin and Magnus Ekström in European Journal of Preventive Cardiology
Footnotes
Author contribution
All authors contributed to the conception or design of the study. LB acquired the data and managed the database together with ME. KH analysed the data statistically. All authors contributed to the interpretation of data for the work. KH drafted the manuscript including artwork. All authors critically revised the manuscript. All authors gave final approval and agree to be accountable for all aspects of work ensuring integrity and accuracy.
Declaration of conflicting interests
The author(s) declared no potential conflicts of interest with respect to the research, authorship, and/or publication of this article.
Funding
The author(s) disclosed receipt of the following financial support for the research, authorship, and/or publication of this article: KH was funded through a general research grant from County Council of Östergötland, Sweden (grant number LIO-822461). VE was funded by an unrestricted grant from the Scientific Committee of Blekinge County Council, Sweden.
References
Supplementary Material
Please find the following supplemental material available below.
For Open Access articles published under a Creative Commons License, all supplemental material carries the same license as the article it is associated with.
For non-Open Access articles published, all supplemental material carries a non-exclusive license, and permission requests for re-use of supplemental material or any part of supplemental material shall be sent directly to the copyright owner as specified in the copyright notice associated with the article.