
Abstract
Aims
Air pollution and noise are potential risk factors for subclinical atherosclerosis. Longitudinal analyses, especially on the interplay of these environmental factors, are scarce and inconsistent. Hence we investigated long-term traffic-related exposure to air pollution and noise with the development and progression of thoracic aortic calcification, a marker of subclinical atherosclerosis.
Methods
We used baseline (2000–2003) and follow-up (2006–2008) data from the German Heinz Nixdorf Recall cohort study, including 4814 middle-aged adults. Residence-based air pollution (PM2.5 (aerodynamic diameter ≤ 2.5 µm), PM10, nitrogen dioxide and particle number), and noise was assessed with dispersion models. Thoracic aortic calcification was quantified from non-contrast enhanced electron beam computed tomography. The presence and extent of thoracic aortic calcification progression were analysed with multiple logistic and linear regression models, respectively, adjusting for age, sex, lifestyle variables, socioeconomic status and respective co-exposure.
Results
We observed no association in the full study sample (n = 3155, mean age 59.1 (±7.6) years, 52.8% women). While an interquartile range in particle number and night-time noise yielded odds ratios of 1.20 (1.03, 1.40) and 1.21 (1.00, 1.46) for binary thoracic aortic calcification progression, and 0.02 (–0.01, 0.05) and 0.04 (0.00, 0.07) higher growth rates of thoracic aortic calcification in participants with baseline thoracic aortic calcification less than 10, negative findings were observed in those with baseline thoracic aortic calcification of 10 or greater. Results were similar for other pollutants and daytime noise.
Conclusion
Our study shows no overall associations. Subgroup analyses suggest independent associations of traffic-related air pollution and noise with the development and progression of subclinical atherosclerosis in participants with no or minor thoracic aortic calcification at baseline, in contrast to negative findings in those with advanced calcification.
Introduction
Environmental factors like air pollution and noise are associated with a higher risk of cardiovascular disease (CVD).1–4 Moreover, noise was identified as an independent contributor to health risks in the context of air pollution, 5 while partly sharing similar sources and health effect mechanisms. One potential pathway linking both exposures to CVD includes a stress response inducing inflammatory cascades, followed by vascular dysfunction or damage,1,3 potentially developing into atherosclerosis, the underlying pathology for most CVD. 6 Another pathway specifically important for noise is sleep disturbance, which can influence cardiometabolic functions through decreased leptin secretion, potentially increasing appetite, obesity and impaired glucose tolerance. 7
Correlating well with other markers of subclinical atherosclerosis, thoracic aortic calcification (TAC) independently predicts cardiovascular events and has a higher prevalence among middle-aged adults than coronary artery calcification (CAC).8,9 It is therefore well suited for quantitative longitudinal analyses in middle-aged populations. Current epidemiological evidence on the association of traffic-related environmental exposures and the atherosclerotic burden remains inconclusive and is almost exclusively limited to air pollution effects. The majority of cross-sectional studies reported positive associations of air pollution on various markers of atherosclerosis, including carotid intima media thickness, CAC, abdominal aortic calcification (AAC), TAC and the ankle–brachial index;10–14 however, evidence from longitudinal analysis is scarce. While a linear exposure-response for PM2.5 (aerodynamic diameter ≤ 2.5 µm) and the progression of CAC was observed in the prospective Multi-Ethnic Study of Atherosclerosis (MESA) cohort, 13 the analysis of the Framingham Study did not support associations of living close to a major road or PM2.5 exposure with the presence or extent of CAC, TAC or AAC progression.15,16
Road traffic noise has rarely been investigated in the context of air pollution and our previous cross-sectional investigation supported independent associations of air pollution and noise on TAC. 17 However, it remains unclear whether high air pollution exposure enhances the effect of noise on the cardiovascular system and vice versa.
Therefore, we expanded our previous work, investigating potential synergistic associations of long-term exposure to air pollution and noise, on the development and progression of TAC in a German, well-characterised, population-based cohort.
Methods
Study design
We used data from the baseline (t0: 2000–2003) and first follow-up (t1: 2006–2008) examination of the Heinz Nixdorf Recall (Risk Factors, Evaluation of Coronary Calcification, and Lifestyle; HNR) study, a population-based cohort study, initially including 4814 participants between 45 and 75 years of age, selected randomly from the mandatory population registries (age-stratified sampling), from three adjacent cities (Mülheim, Essen and Bochum) in the metropolitan Ruhr area, Germany, of which 4157 participated in the t1 examination. Traditional cardiovascular risk factors, demographics and addresses were assessed at both examinations using self-administered questionnaires, face-to-face interviews, clinical examinations and comprehensive laboratory tests according to standard protocols. 18 This study complies with the Declaration of Helsinki, all participants (or their legally authorised representative) provided written informed consent and the study was approved by the institutional ethics committees. The study design has been described in detail elsewhere. 19
Thoracic aortic calcification
Computed tomography (CT) scans were performed for quantification of TAC at both examinations, using a C-100 (t0) and C-150 (t1) scanner (GE, Imatron, South San Francisco, CA, USA), following a standardised methodology for acquisition and interpretation of the scans, which has been reported previously.18,19
The CT was operated in the single-slice (3 mm) mode with an image acquisition time of 100 ms. Based on the Agatston algorithm,
20
TAC was quantified, including at least four contiguous pixels with a CT density of 130 or greater Hounsfield units for identifying calcified lesions. TAC was assessed by summation of all calcified lesions in the ascending (ATAC) and descending (DTAC) thoracic aorta visible in the CT scan.
9
While the aortic root was included, the aortic arch and the intrarenal abdominal aorta were excluded in the scan. TAC progression (yes/no) was operationalised as TACt1 – TACt0 > 0. Due to its exponential nature, the extent of TAC progression was operationalised as a growth rate of TAC, defined as
Air pollution
Long-term exposure to ambient air pollution, including PM with an aerodynamic diameter less than 10 or 2.5 µm (PM10 and PM2.5 (µg/m3)), particle number of accumulation mode particles (PNacc (#/mL)) and nitrogen dioxide (NO2 (µg/m3)), was estimated using the validated European air pollution dispersion chemistry transport model (EURAD-CTM).23,24 The EURAD-CTM uses input data from official emission inventories (i.e. traffic, industry, agriculture, energy production, etc.), 25 data on meteorology and regional topography, in combination with input on the dispersion of emissions, chemical reactivity and mass transport between horizontal strata and deposition to calculate daily exposure concentrations in a 1 × 1 km 2 grid 24 during the examination years (2000–2003 and 2006–2008), which were assigned to participant’ baseline and follow-up addresses using a geographical information system. Since exposure data from 2004–2005 was not available, long-term exposure was calculated as the mean of all daily values over both examination periods, reflecting long-term spatial exposure differences within our study area.
Road traffic noise
Long-term road traffic noise was modelled for the year 2007 according to the European Union Directive 2002/49/EC 26 and the validated national calculation method VBUS/RLS-90 27 for the year 2007 (supplied from the city administrations) considering small-scale topography of the area, dimensions of buildings, noise barriers, first order reflections, street axis, measured or estimated vehicle type-specific traffic density for all roads, speed limit and type of street surface. Average traffic noise values (A-weighted dB(A)) day-evening-night (24 hour) noise (Lden) and night-time noise (Lnight, 22:00–06:00 hours) were estimated using the most exposed façade of participants’ residences with a resolution of 0.1 dB.
Covariates
We classified education according to the international standard classification of education as total years of formal education grouped into four categories (<11, 11–13, 13–17 and > 17 years). Neighbourhood socioeconomic status was assessed as the unemployment rate (%). Smoking status defined current smoker (during the past year), ex-smoker and never-smoker. Lifetime cumulative smoking was assessed in pack-years at baseline. Exposure to environmental tobacco smoke (ETS) referred to ETS at home, at work or in other places. Body mass index (BMI; kg/m2) was calculated using standardised height and weight measurements. Regular physical activity (yes/no) and alcohol intake (0, 1–3, 4–6, > 6 drinks per week) was assessed by questionnaire. High-density lipoprotein (HDL) and low-density lipoprotein (LDL) cholesterol, and high sensitivity C-reactive protein (hs-CRP) (all mg/dL) were measured with standard methods at the central laboratory of the University Hospital of Essen. Current medications were coded according to the anatomical therapeutic chemical classification index. 28 Blood pressure values were calculated as the mean of the second and third measurement of three measurements, using an oscillometric method according to a standard protocol. Hypertension was defined as systolic or diastolic blood pressure of 140 mmHg or greater or 90 mmHg or greater, respectively, or the use of antihypertensive medication. Diabetes mellitus was defined as a prior physician diagnosis of diabetes, anti-diabetic drug intake, a random blood glucose of 200 mg/dl or greater, or a fasting blood glucose of 126 mg/d or greater. Coronary artery disease (CAD) was defined by coronary artery bypass surgery and/or interventional revascularisation procedures and/or a history of prior myocardial infarction.
Statistical analyses
To assess the association between traffic-related continuous exposures and TAC progression we estimated: (a) odds ratios (ORs) (95% confidence intervals (CIs)) for having more TAC after 5 years using logistic regression; and (b) the change of growth rate in TAC (to be interpreted as a yearly change in percentage points, presented as a decimal number) using linear regression with respect to an interquartile range (IQR) of exposure. Because prior analyses have shown stronger associations of environmental risk factors and early atherosclerosis,27,29,30 and our prior analysis has identified 10 as a cut-point for CAC, 30 we stratified the study population by baseline TAC value (TACt0 < 10 vs. TACt0 ≥ 10). In a sensitivity analysis, we estimated ORs for incident TAC and change in growth rate among participants with TACt0 > 0. Because prior analysis on TAC progression has shown a different susceptibility of segments of the thoracic aorta with regard to risk factors, 22 we also investigated ATAC and DTAC separately. The confounder-adjusted (main) model included age, sex, smoking status, pack-years of smoking, ETS, physical activity and follow-up time.
To investigate the interplay of air pollution and noise, we (a) estimated exposure effects adjusting for the respective co-exposure to evaluate potential confounding; (b) investigated effect modification including interaction terms between exposure and dichotomised co-exposure at the 75th percentile (low/high); and (c) investigated possible synergisms between co-exposures categorising participants into four groups based on the 75th percentile of each exposure: high air pollution and low noise, low air pollution and high noise, high exposure to both, and low exposure to both as a reference.
Sensitivity analysis
We evaluated the robustness of our main results with regard to additional covariates (neighbourhood unemployment rate, city and intake of statin or lipid-lowering medication). Moreover, we adjusted for hypothesised intermediates (systolic blood pressure, hypertension, hs-CRP and type 2 diabetes mellitus) 1 and (BMI and LDL-cholesterol/HDL-cholesterol (ratio), which have recently been discussed as potential intermediates, especially regarding the health effects of noise). 31 We estimated ORs for TAC progression, defined as an absolute change greater than 10% and greater than 20% of the baseline value considering a potential mean interscan variability of 9.7%. 32 In this context, we also repeated the main analysis, excluding extreme outliers of TAC change (growth rate > median + 3 IQR or < median – 3 IQR). Moreover, we restricted our sample to those less prone to exposure misclassification, namely those that have not moved within 5 years prior to the baseline examination and those that did not work full time. In addition, we repeated the analysis in never-smokers and those without incident statin medication. Finally, we investigated baseline and follow-up exposure separately.
Results
Baseline characteristics (mean ± SD, N (%)) of the full study sample (n = 3155) and stratified in subgroups of TACt0 < 10 (n = 1433) and TACt0 ≥ 10 (n = 1722).
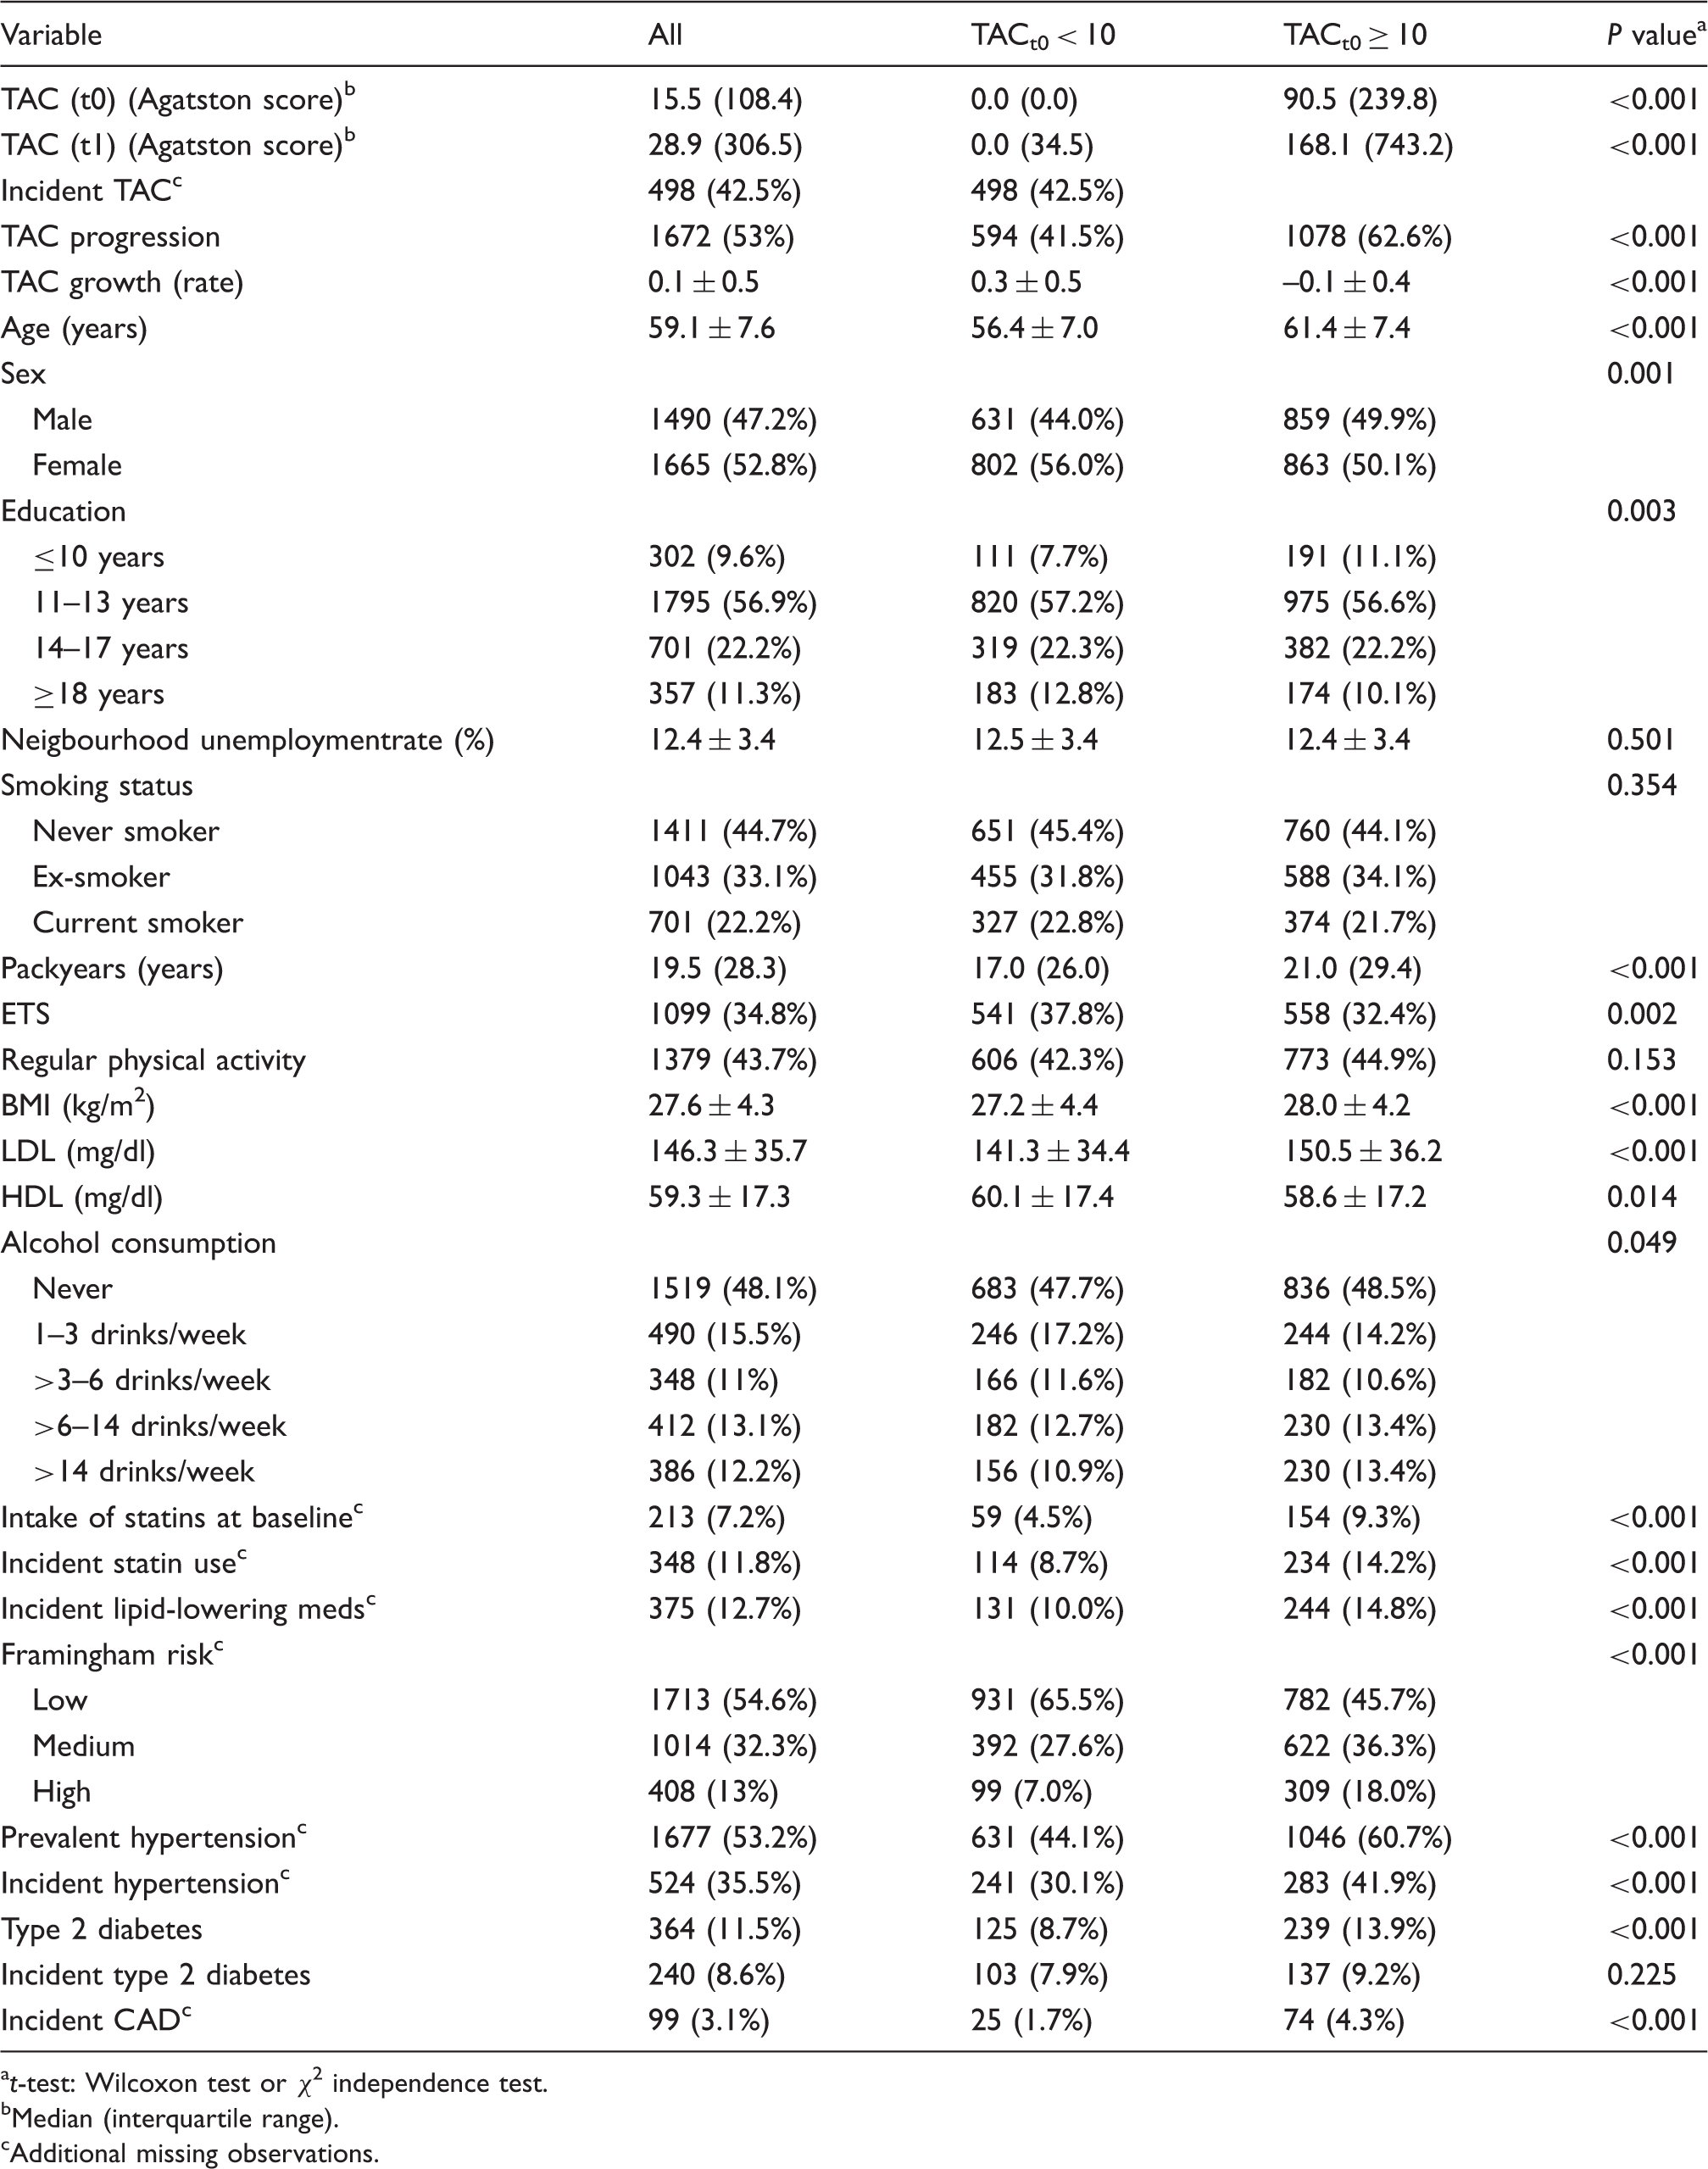
t-test: Wilcoxon test or χ 2 independence test.
Median (interquartile range).
Additional missing observations.
TAC progression was observed in 53.0% with a mean (exponential) annual growth rate of 0.1 ± SD 0.5 (equivalent to a 10% annual increase) (Table 1, Supplementary Figure 2), based on a median Agatston score of 15.5 (IQR 0.0–108.4) at t0 and 28.9 (0.0–306.5) at t1. Incident TAC was observed in 42.5% of 1171 participants.
Summary statistics and Pearson correlation coefficients for traffic-related long-term exposures for 3155 participants of the Heinz Nixdorf Recall Study.
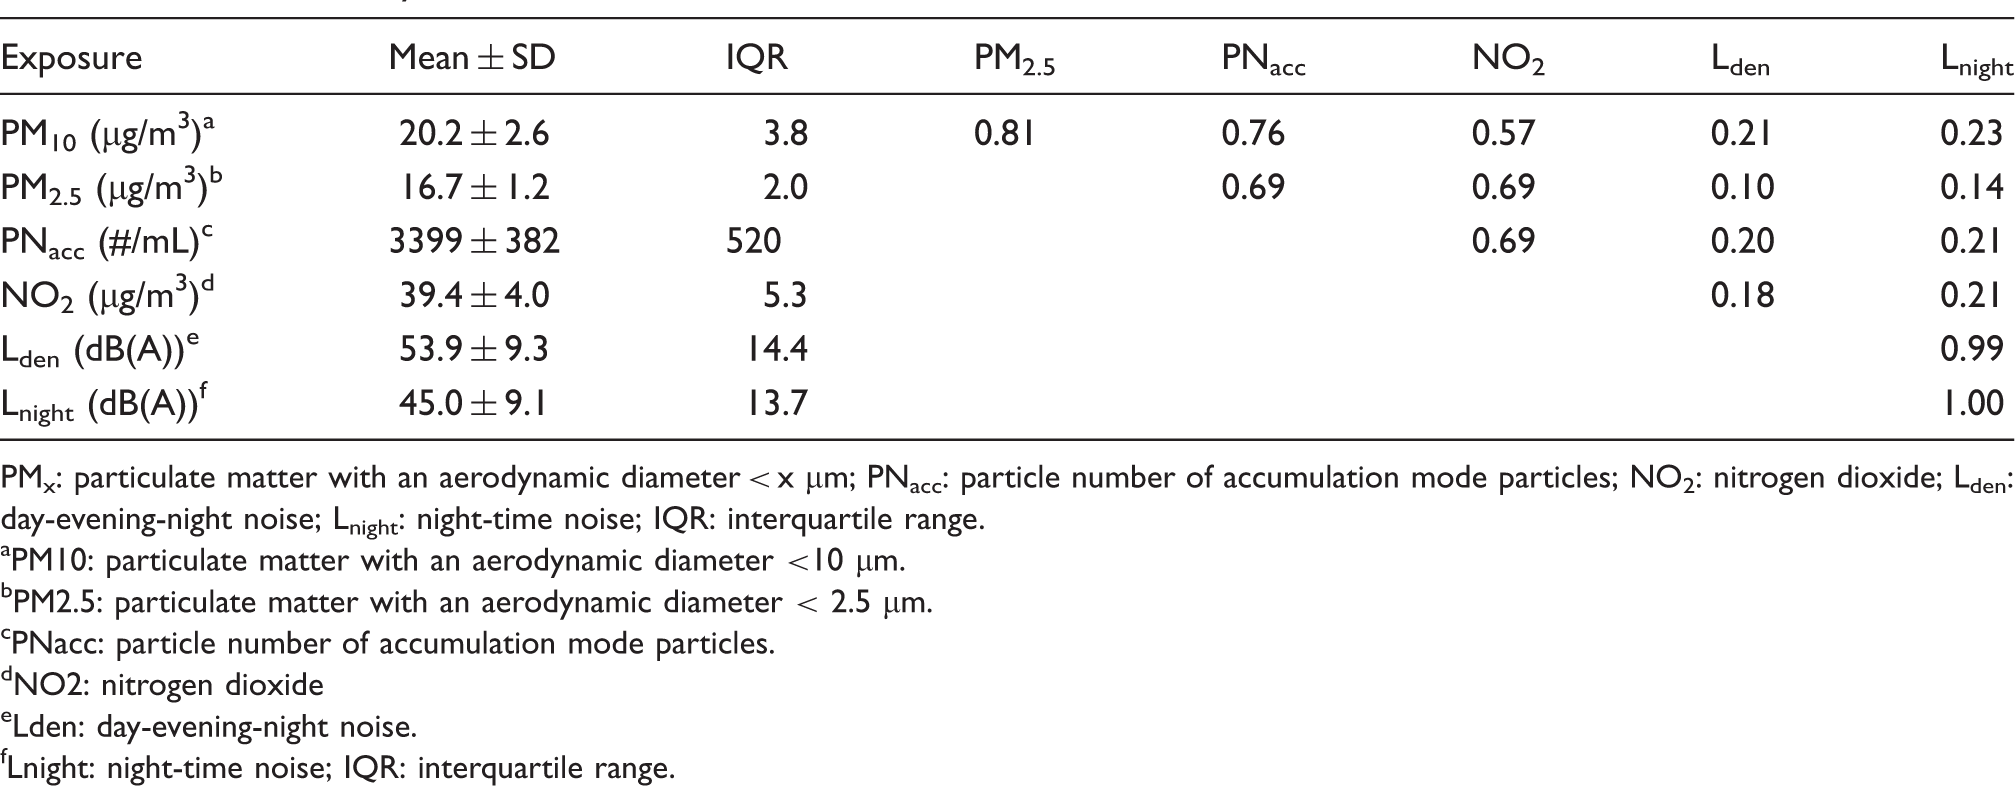
PMx: particulate matter with an aerodynamic diameter < x µm; PNacc: particle number of accumulation mode particles; NO2: nitrogen dioxide; Lden: day-evening-night noise; Lnight: night-time noise; IQR: interquartile range. aPM10: particulate matter with an aerodynamic diameter <10 µm. bPM2.5: particulate matter with an aerodynamic diameter < 2.5 µm. cPNacc: particle number of accumulation mode particles. dNO2: nitrogen dioxide eLden: day-evening-night noise. fLnight: night-time noise; IQR: interquartile range.
Association of traffic-related exposures with TAC progression
While observing no associations of PM10, PM2.5, PNacc, NO2 or noise with the presence or extent of TAC progression in the full study sample, results from participants with TACt0 < 10 suggested exposure-related effects on the presence and degree of TAC progression (Figure 1, Supplementary Tables 1 and 2). In contrast, associations were negative for participants with TACt0 ≥ 10 (Figure 1).
Crude and main effect estimates (95% confidence interval) per interquartile range (IQR) exposure increase on thoracic aortic calcification (TAC) progression in the Heinz Nixdorf Recall study sample and stratified by TACt0, adjusted for age, sex, smoking, physical activity, alcohol consumption, education and follow-up years. (a) Odds ratios (ORs) for TAC progression; (b) change of TAC growth rate. Complementing numbers are presented in Supplementary Tables 1 and 2.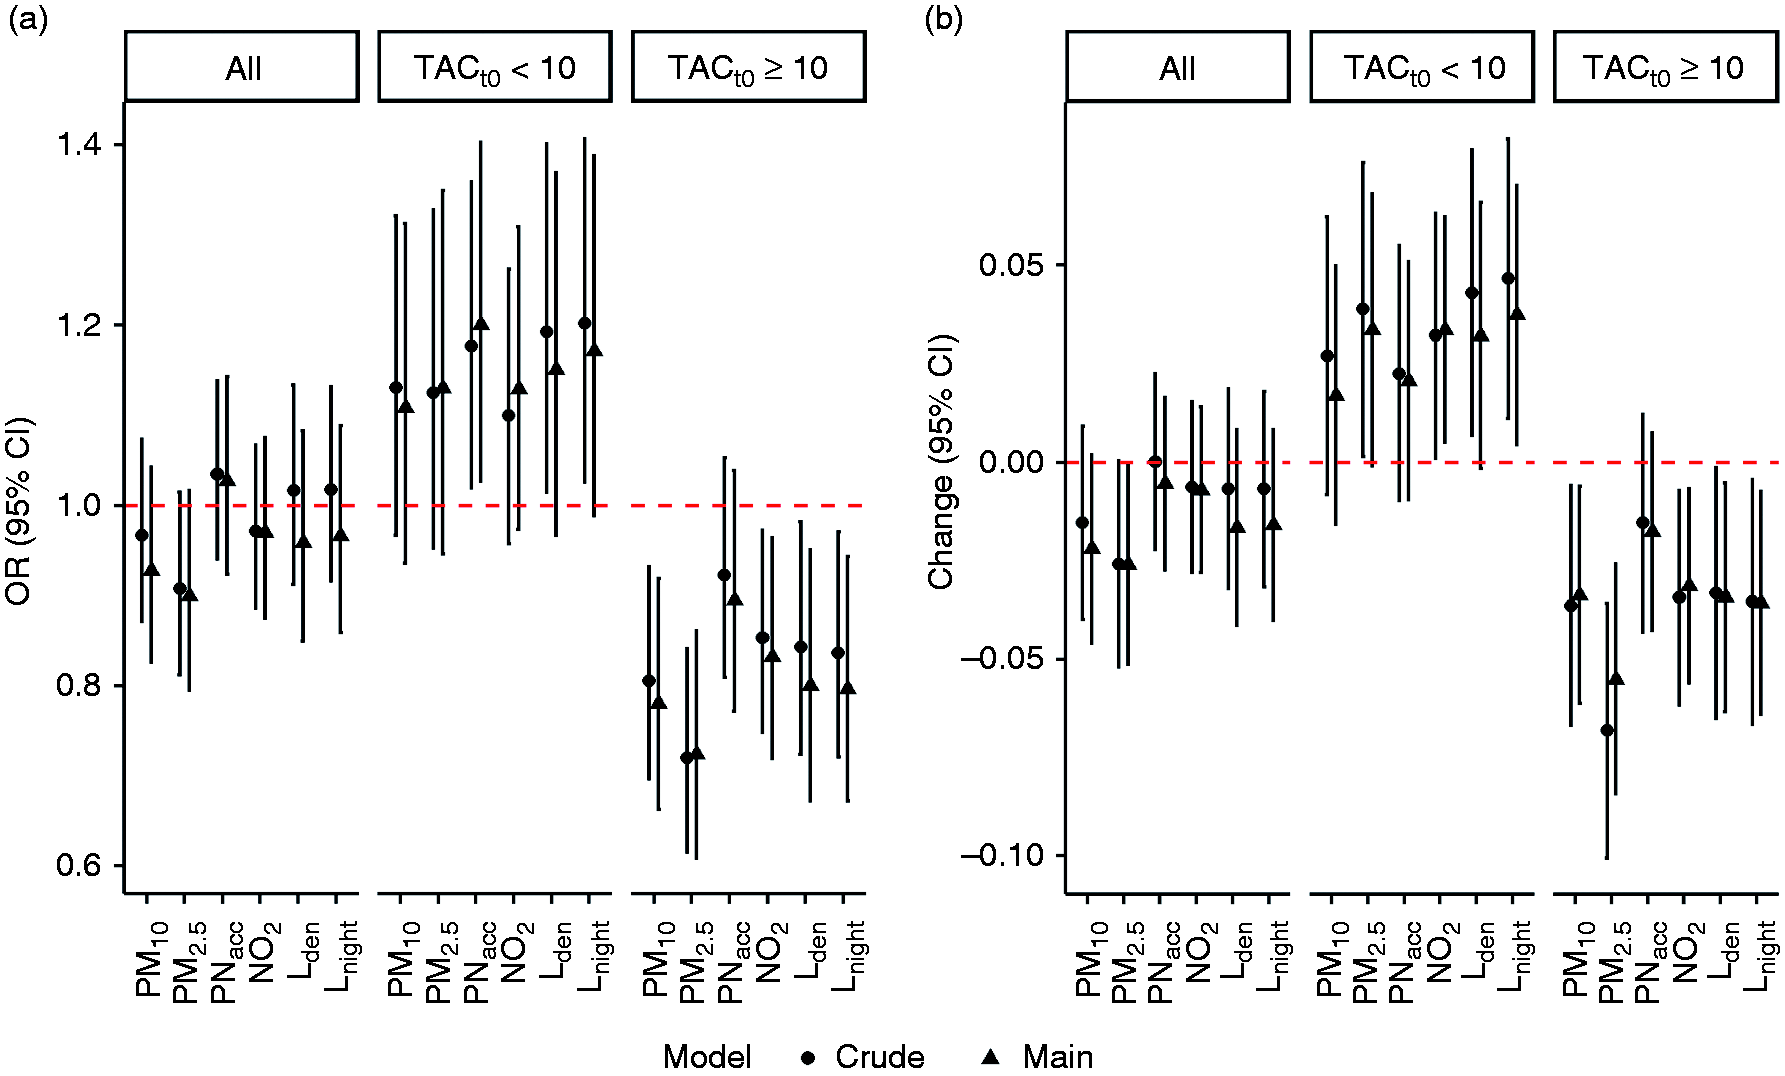
Associations with the presence of TAC progression were strongest for PNacc and Lnight. For example, a 520 #/mL (IQR) increase in PNacc yielded estimated ORs (95% CIs) of 1.03 (0.92, 1.14) for all participants, 1.20 (1.03, 1.40) for participants with TACt0 < 10 and 0.90 (0.77, 1.04) for participants with TACt0 ≥ 10. Similarly, a 13.7 dB(A) increase in Lnight, yielded estimated ORs (95% CIs) of 0.96 (0.85, 1.08), 1.15 (0.97, 1.37) and 0.80 (0.67, 0.95) for all participants, participants with TACt0 < 10 and TACt0 ≥ 10 respectively (Figure 1, Supplementary Table 1). Defining TAC progression as a 10% or 20% change from TACt0 did not affect the results (Supplementary Figure 4).
A similar pattern was observed for the TAC growth rate with strongest associations for IQR increases in PM2.5 and Lnight, yielding changes in TAC growth rates of 0.03 (0.00, 0.07) and 0.04 (0.00, 0.07) in participants with TACt0 < 10, whereas negative associations were observed in those with TACt0 ≥ 10 (–0.06 (–0.08, –0.03) and –0.04 (–0.06, –0.01)) (Figure 1, Supplementary Table 2). For a subject with TACt0 = 5 and an expected growth rate of 0.3, a 0.03 estimated increase in growth rate translates to a TAC score of 26.03 = 5 × exp(0.33 × 5) instead of 22.41 = 5 × exp(0.30 × 5).
Estimated ORs (95% CIs) for incident TAC were 1.19 (1.00, 1.41) and 1.21 (1.00, 1.46) for PNacc and for Lnight, respectively (Supplementary Table 1), while negative changes in the growth rate were observed in participants with TACt0 ≥ 0 (–0.01 (–0.04, 0.01) and –0.03 (–0.06, –0.01)) (Supplementary Table 2).
The results were overall robust with regard to the extended adjustment and to potential intermediates such as hypertension, BMI or diabetes mellitus (Supplementary Figure 5). The only exception was adjustment for city enhancing effect estimates. Although not observing a clear pattern for separate segments of the thoracic aorta, noise seemed to be more strongly related to ATAC, while air pollutants seemed slightly more strongly related to DTAC (Supplementary Tables 1 and 2). Excluding outliers and further subgroup-specific sensitivity analysis overall supported our main results (Supplementary Tables 3 and 4). Restriction to never-smokers yielded slightly stronger effect estimates, particularly regarding PNacc. Investigations of single baseline and follow-up air pollution exposure revealed similar results.
Interplay of air pollution and noise
Associations between air pollutants and TAC progression were not confounded or modified by co-exposure to noise and vice versa (Figure 2, Supplementary Table 5). Overall, we also did not find evidence for synergetic effects of air pollution and noise levels (Supplementary Figure 6, Supplementary Table 6).
Effect estimates (95% confidence intervals) per interquartile range (IQR) exposure increase on thoracic aortic calcification (TAC) progression in participants with TACt0 < 10: co-exposure adjustment (dark grey) and effect modification (black). (a) TAC progression; (b) change of TAC growth rate. Models are adjusted for age, sex, smoking, alcohol consumption, physical activity, education and follow-up time. Complementing numbers are presented in Supplementary Table 7.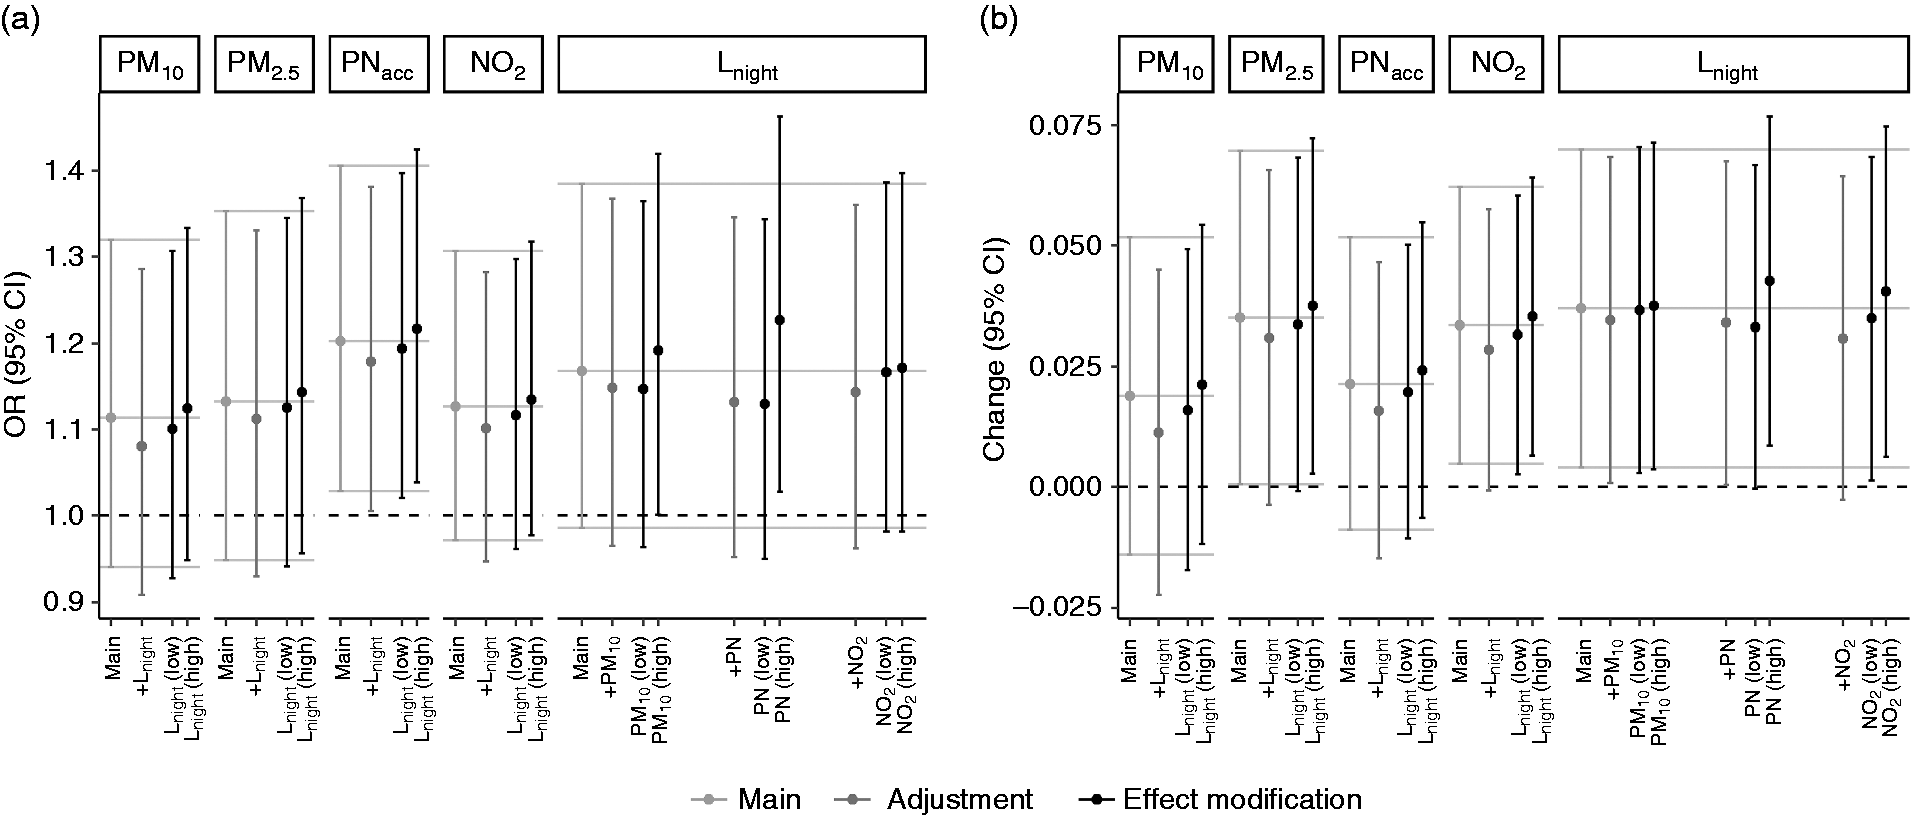
Discussion
In the full study sample our study shows no association of long-term exposure to both air pollution and road traffic noise, with the development and progression of TAC. However, a subgroup analysis of participants with no or only minor calcification at baseline suggests independent associations of long-term exposure to both air pollution and road traffic noise with the development and progression of TAC, while a lower risk was observed in those with advanced baseline calcification. In this study, we were able to expand our previous investigation with a longitudinal design enabling us to analyse the development and progression of atherosclerosis. Moreover, we were able to investigate different traffic-related air pollutants, such as particle mass, particle number and NO2, in the context of traffic-related noise.
The clearest effect estimates for the development, presence and extent of TAC progression were seen for particle number concentrations and noise exposure, which are also the most accurate surrogates of environmental pollution from road traffic. While road traffic has been shown to be related to numerous cardiovascular health effects, 33 most studies were not able to differentiate between air pollution and noise effects due to missing information on both exposures. This study fills this gap by showing independent associations of two traffic-related exposures on the development of subclinical atherosclerosis, the underlying pathology for most CVDs. In contrast, our study shows counterintuitive results in those participants with already advanced atherosclerosis.
There are two pathological processes leading to the formation of vascular calcifications, which often occur simultaneously, 34 yet can be affected differently by different environmental factors. Noise has been postulated to act on the cardiovascular system primarily by causing a stress reaction with the secretion of corticosteroids, accompanied by elevated blood pressure, dyslipidemia, elevated blood glucose and vascular dysfunction, which may all contribute to the progression of atherosclerosis. 3 Next to a sympathetic arousal that can be noted already within hours after the rise of air pollution concentrations, air pollutants have been shown to increase blood pressure and systemic inflammatory responses, which may also contribute to atherogenesis. 1 Previous studies observed cardiovascular-related health effects, like subclinical changes in left ventricular performance, most likely caused by decreased ventricular function in response to PM2.5 exposure. 35
Although still lacking a complete understanding of the health effect mechanisms, our findings can be linked to the public health risk of air pollution and road traffic noise on cardiovascular health. 36 Lacking safe levels of air pollutants, large parts of the population may be subjected to these adverse environmental effects on the vasculature, especially when not given personal risk (e.g. smoking). Importantly, associations were observed at air pollution levels below the European limit values, 26 while mean noise levels were also at or only slightly above the current World Health Organization (WHO) recommendations of 53 dB for Lden and 45 dB for Lnight, 37 indicating that these regulations and recommendations may not sufficiently protect the European population.
Our results show negative associations in participants with a more advanced atherosclerosis burden. Negative findings were also observed in the Framingham Heart Study, investigating associations of traffic proximity and PM2.5 with abdominal or thoracic aortic calcification.15,16 However, other recent studies reported that pathological subjects are more vulnerable to the environmental effects, such as an increased risk of cancer induced by long-term exposure to traffic-related air pollution in myocardial infarction survivors reported by Cohen et al. 38 From a statistical point of view random variations in TAC measurements may have caused regression to the mean at the second examination time, leading to counterintuitive findings. A possible biological explanation for this finding is that subjects with a higher extent of TAC are more likely to be symptomatic. They will therefore more likely be diagnosed with cardiovascular risk factors and will consequently receive aggressive cardio-protective interventions such as statin therapy, antihypertensive therapy and tight control of blood glucose. Indeed, in our study participants with a higher TAC at baseline had higher incidences of cardiovascular-related mortality, as well as higher rates of incident statin medication. Although air pollution exposure may contribute more to the development of early soft plaque than to progression to arterial calcification, 15 which is in line with results from our prior analysis of second-hand smoke and CAC in the Heinz Nixdorf Recall study, 30 negative associations remain to be explained.
In line with our previous cross-sectional investigation 17 and results from a recent review, 5 air pollution and noise revealed independent health effect estimates. Moreover, our results did not indicate that the association of air pollutants on TAC progression was enhanced in those with high noise exposure or vice versa. This is different to a prior analysis of cognitive function in the same study population, in which susceptibility to adverse associations with air pollution was increased in those with high levels of noise exposure and vice versa, and the associations were over-additive in those with high levels of both exposures. 39 The lack of effect modification in the present analysis suggests that air pollution and noise action affect atherosclerosis through biological pathways which do not potentiate each other.1,3,5
The major strengths of this analysis include standardised measurements of classic cardiovascular risk factors, as well as of TAC. The CT scans were repeated with the same scanner technology and identical scanning protocols, so that we avoided the use of any correction factors. Moreover, a potential bias by therapy was eradicated because participants and their physicians were blinded to the results of the calcification scoring at the baseline examination. The detailed information on lifestyle factors, socioeconomic status and potential cardiovascular risk factors allowed an appropriate control of confounding.
Limitations were the relatively short time of follow-up (5 years) with respect to a life-time exposure and atherosclerotic changes. Moreover, measurement of TAC progression can suffer from unsystematic measurement error due to an underestimation of TAC burden at the slice border of each 3 mm CT slice, which most likely biases the effects towards the null. Unfortunately, we do not have repeated measures to assess study-specific interscan variability. Exposure assessment to noise and air pollution was conducted by modelling at participants’ addresses, leading to exposure measurement error. Moreover, grid-based exposure estimation is more prone to measurement error for air pollutants with greater small-scale variation (NO2 and PNacc) than the more homogeneous PM10 and PM2.5.
Conclusion
While our study does not show overall associations, subgroup analyses suggest independent associations of traffic-related air pollution and road traffic noise with the development and progression of subclinical atherosclerosis in participants with no or only minimal thoracic aortic calcification at baseline that may contribute to the development of environmentally caused CVD. The observed lower risk of the development and progression of TAC in participants with advanced calcification remains to be explained.
Supplemental Material
Supplemental material for Investigation of air pollution and noise on progression of thoracic aortic calcification: results of the Heinz Nixdorf Recall Study
Supplemental Material for Investigation of air pollution and noise on progression of thoracic aortic calcification: results of the Heinz Nixdorf Recall Study by Frauke Hennig, Susanne Moebus, Nico Reinsch, Thomas Budde, Raimund Erbel, Karl-Heinz Jöckel, Nils Lehmann, Barbara Hoffmann, Hagen Kälsch and on behalf of the Heinz Nixdorf Recall Study Investigative Group in European Journal of Preventive Cardiology
Footnotes
Acknowledgements
The authors are indebted to all study participants and both to the dedicated personnel of the study centre of the Heinz Nixdorf Recall study and the EBT-scanner facilities and to the investigative group, in particular to U Roggenbuck, U Slomiany, EM Beck, A Öffner, S Münkel, S Schrader, R Peter and H Hirche. They also thank Anna Buschka for the data management.
Author contribution
Frauke Hennig: Conceived and designed the research, performed statistical analysis, drafted the manuscript, made critical revision of the manuscript for key intellectual content. Susanne Moebus: Acquired the data, made critical revision of the manuscript for key intellectual content. Nico Reinsch: Made critical revision of the manuscript for key intellectual content. Thomas Budde: Made critical revision of the manuscript for key intellectual content. Raimund Erbel: Acquired the data. Made critical revision of the manuscript for key intellectual content. Karl-Heinz Jöckel: Acquired the data. Made critical revision of the manuscript for key intellectual content. Barbara Hoffmann: Conceived and designed the research, drafted the manuscript. Made critical revision of the manuscript for key intellectual content. Hagen Kälsch: Conceived and designed the research, acquired the data, drafted the manuscript. Nils Lehmann: Made critical revision of the manuscript for key intellectual content.
Declaration of conflicting interests
The author(s) declared no potential conflicts of interest with respect to the research, authorship, and/or publication of this article.
Funding
The author(s) disclosed receipt of the following financial support for the research, authorship, and/or publication of this article: the authors wish to thank the Heinz Nixdorf Foundation Germany, for their generous support of this study. This study was also supported by the German Ministry of Education and Science (BMBF), and the German Aerospace Center (Deutsches Zentrum für Luft und Raumfahrt, DLR), Bonn, Germany. They acknowledge the support of Sarstedt AG & Co. (Nümbrecht, Germany) concerning laboratory equipment. This work was supported by the German Research Council (DFG; projects (SI 236/8-1, SI 236/9-1, 3314/4-3, 3314/2-3)).
References
Supplementary Material
Please find the following supplemental material available below.
For Open Access articles published under a Creative Commons License, all supplemental material carries the same license as the article it is associated with.
For non-Open Access articles published, all supplemental material carries a non-exclusive license, and permission requests for re-use of supplemental material or any part of supplemental material shall be sent directly to the copyright owner as specified in the copyright notice associated with the article.