
Abstract
Similar to left ventricular and aortic pressure waveforms, augmentation pressure (AugPr) in the right ventricular (RV) pressure waveform is also frequent in patients with pulmonary hypertension (PH). This study sought to evaluate whether the degree of AugPr in RV pressure waveform has prognostic value. Forty-one patients (13 men; mean age = 50.7 ± 16.1 years) with group 1 PH (mean pulmonary artery pressure [mPAP] ≥ 25 mmHg) who underwent cardiac catheterization as part of their work-up were retrospectively enrolled. Patients were divided into three groups. Group A: AugPr/RV systolic pressure < 25%; group B: AugPr/RV systolic pressure ≥ 25%; and group C: no discernible AugPr but showing peaked RV pressure waveform. Ten patients were included in group A (male-to-female ratio 3:7; mean age = 45.9 ± 12.1 years), 12 in group B (4:8, 53.8 ± 14.6 years), and 19 in group C (6:13, 51.8 ± 18.7 years). No differences in mPAP were seen between the three groups. Pulse pressure was significantly higher in group C compared to group A. Eight patients died during the mean follow-up period of 35.9 ± 30.7 months; the incidence of death was significantly higher in group C than in the other groups (one patient in group A and seven patients in group C). AugPr in RV pressure waveform has prognostic value in patients with PH. Therefore, additional attention should be given to the RV pressure waveform in patients with PH undergoing invasive pressure measurements as a part of their work-up.
Introduction
In patients with significant pulmonary hypertension (PH), invasive right ventricular (RV) and pulmonary artery pressure (PAP) measurements have been recommended to validate non-invasive estimates and evaluate pulmonary vascular resistance and vasodilator responsiveness. In a previous study, 1 we evaluated augmentation pressure (AugPr) in RV pressure waveform and noted that the magnitude of AugPr is related to vasodilator responsiveness.
When taking into consideration the mechanism of AugPr formation in left-sided pressure waveforms, it is likely that AugPr in RV pressure waveforms represent vascular stiffness in pulmonary circulation. Changes in vascular stiffness of pulmonary circulation in response to PH may not only be affected by disease severity, but also by the nature of the underlying disease and host response. Therefore, we speculate that AugPr may be a better prognostic marker than the magnitude of PH alone in these patients.
Methods
Patients
Of 140 patients who underwent cardiac catheterization to identify PH during 2006–2015, 65 patients were diagnosed with group 1 PH per the 2014 Nice Pulmonary Hypertension Classification. 2 Of these patients, 22 with unrepaired congenital heart disease were excluded from the analysis, as well as one patient with atrial fibrillation and one patient with a RV pressure waveform that was not adequate for evaluation because of an artifact. Altogether, 41 patients were included in the analysis and retrospectively analyzed.
Cardiac catheterization
Left and right heart catheterization was performed via the femoral approach. Baseline cardiac output, as well as pulmonary and systemic vascular resistance, were calculated using the standard method. RV pressure waveform was recorded during RV pressure measurement with a fluid-filled catheter. As the magnitude of AugPr varies with the magnitude of peak RV systolic pressure (RVSP), we used the AugPr/RVSP ratio to divide patients into three groups: group A = patients with AugPr/RVSP <25%; group B = patients with AugPr/RVSP of ≥25%; and group C = patients with no discernible inflected point on the ascending limb of the RVSP waveform, in which AugPr cannot be determined, but showing peaked waveform (Fig. 1).
Representative RV pressure wave forms in groups A, B, and C. (a) Group A = patients with AugPr/RVSP ratio < 25%; (b) Group B = patients with AugPr/RVSP of ≥ 25%; (c) Group C = patients without discernible inflected point on the ascending limb of the RV waveform, but showing peaked waveform. AugPr, augmentation pressure; RVSP, right ventricular systolic pressure; RV, right ventricle.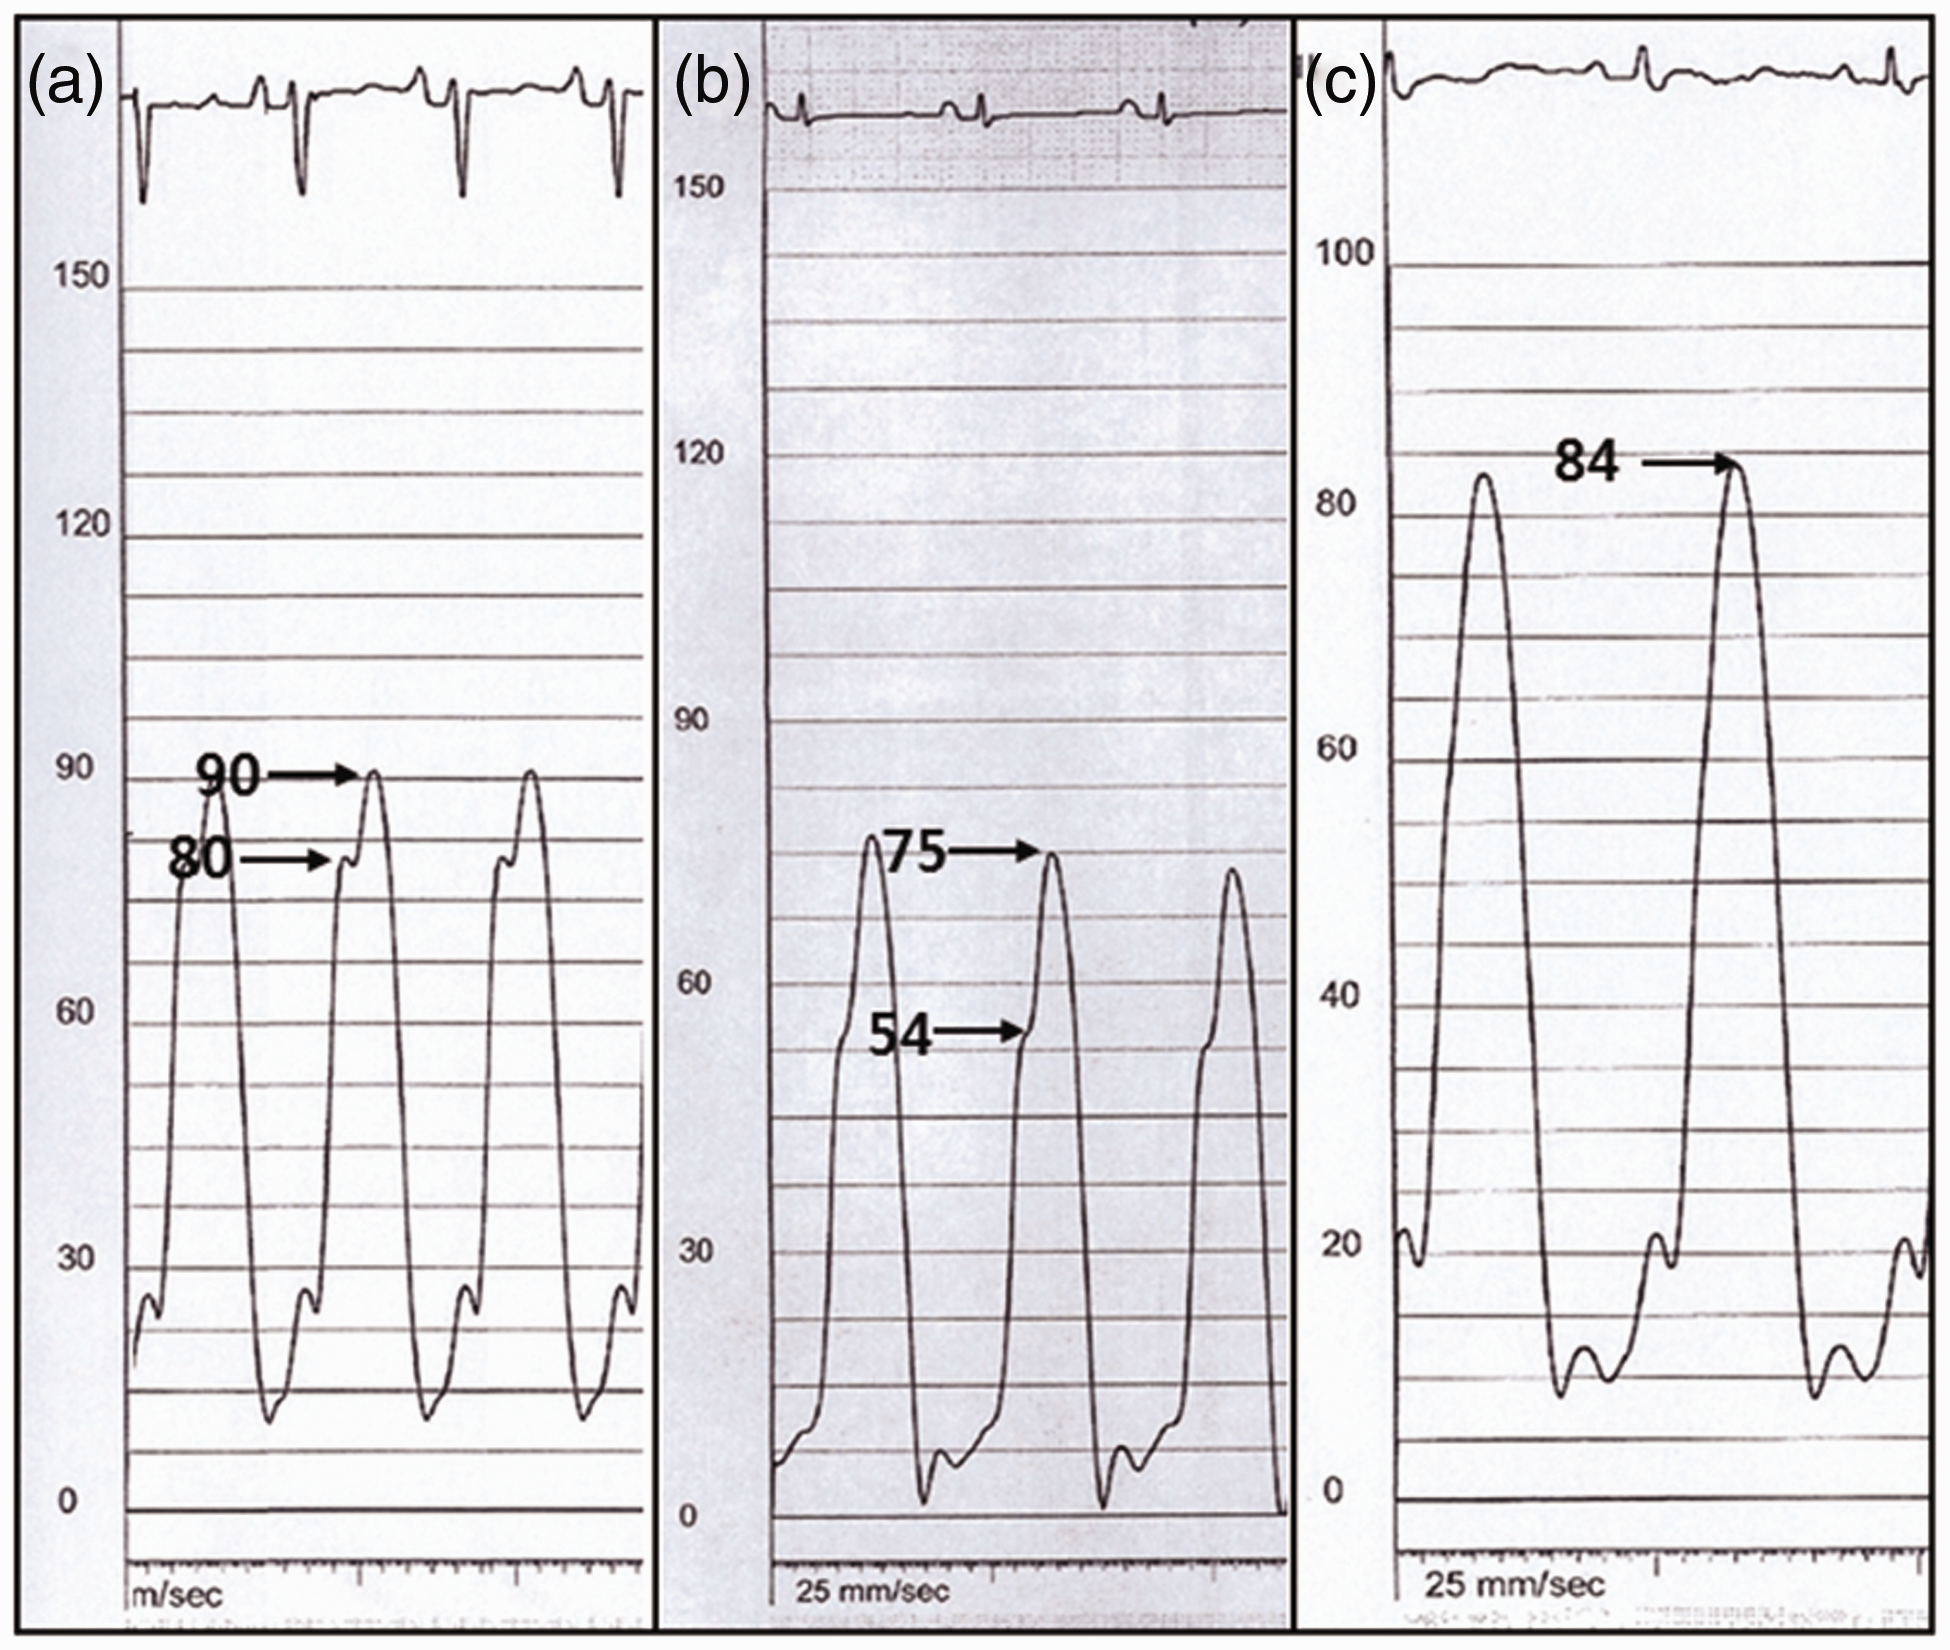
Echocardiography
Echocardiograms were performed during admission for catheterization and follow-up echocardiograms were performed at physicians’ discretion. A follow-up echocardiogram at least six months after the one from baseline was used to evaluate the improvement or worsening of PH.
Statistics
Results were expressed as mean ± standard deviation. The paired t test was used to compare changes in pulmonary artery systolic pressure (PASP) estimated by echocardiography before and after treatment. The ANOVA test was performed to compare differences in mean age, mean PAP (mPAP), PA pulse pressure, RVSP, RV diastolic pressure, and decrease in RVSP during follow-up echocardiography among the three groups. The Scheffé’s test was done when the ANOVA test was statistically significant to compare differences among the groups. Fisher’s exact test was performed to compare the distribution of death cases during the follow-up period in the three groups. A P value < 0.05 was considered statistically significant.
Results
Baseline characteristics
Hemodynamic parameters and cardiovascular deaths.
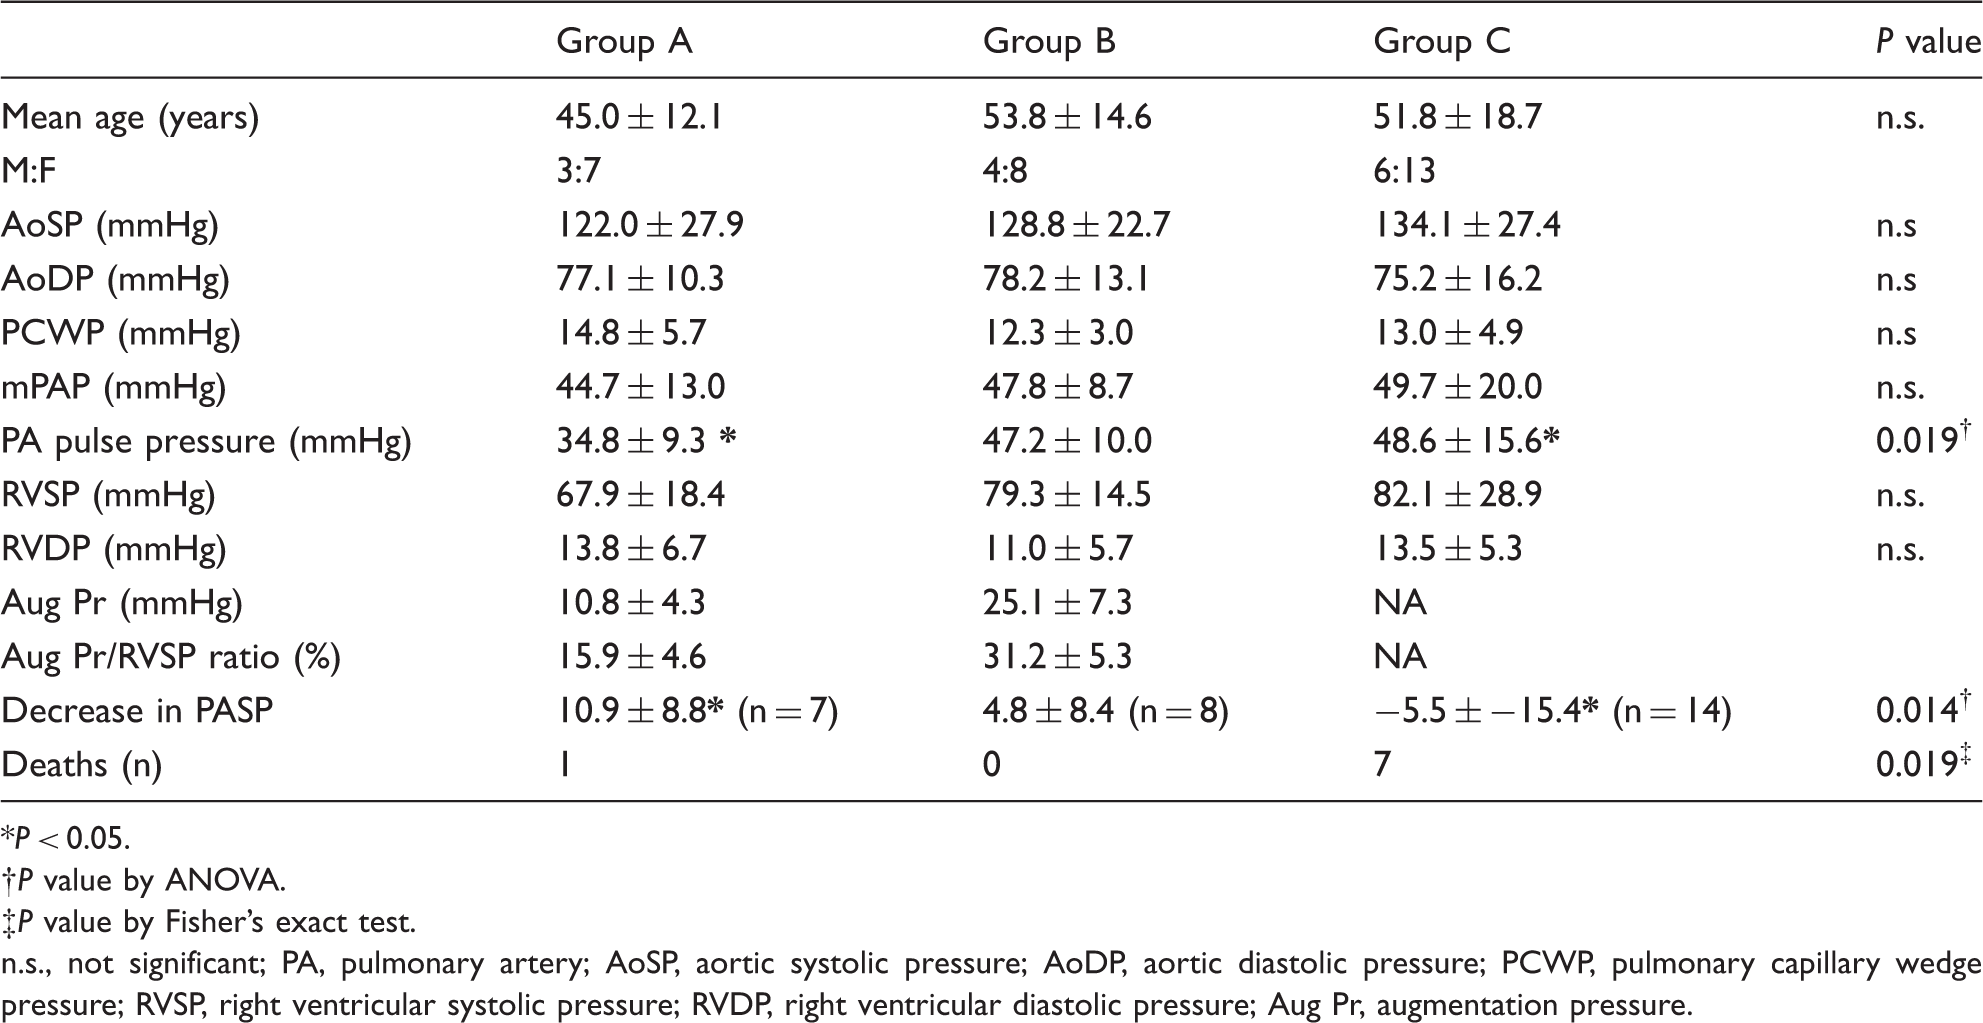
P < 0.05.
P value by ANOVA.
P value by Fisher’s exact test.
n.s., not significant; PA, pulmonary artery; AoSP, aortic systolic pressure; AoDP, aortic diastolic pressure; PCWP, pulmonary capillary wedge pressure; RVSP, right ventricular systolic pressure; RVDP, right ventricular diastolic pressure; Aug Pr, augmentation pressure.
Of 41 patients, pulmonary arterial hypertension (PAH)-specific therapy was prescribed in 31 (75%) patients, including bosentan (n = 11), ambrisentan (n = 8), sildenafil (n = 5), macitentan (n = 1), treponistinil (n = 1), and combination therapy with two agents (n = 4), and medication switched from sildenafil to macitentan during the follow-up period (n = 1).
Difference among groups
RVSP at the time of catheterization in groups A, B, and C were 67.9 ± 18.4, 79.3 ± 14.5, and 79.8 ± 29.4 mmHg respectively. RV diastolic pressures, which were measured at the same time, were 13.8 ± 6.7, 11.0 ± 5.7, and 13.5 ± 5.3 mmHg, respectively. No significant differences in RVSP or RV diastolic pressures were observed between groups. However, pulse pressure was significantly higher in group C compared to group A.
Among patients on PAH-specific therapy, follow-up echocardiography was performed at least six months apart and reliable PASP was obtained in 29 patients (seven in group A, eight in group B, and 14 in group C). Changes in PASP during follow-up echocardiography were not significant in each group. However, significant differences in PASP changes were observed between the groups. In particular, group A had the largest decrease in PASP (60.4 ± 16.9 mmHg to 49.6 ± 16.9 mmHg), whereas group C showed an increase (76.3 ± 17.9 mmHg to 81.8 ± 21.2 mmHg) (Table 1).
There were eight cardiovascular mortalities during the mean follow-up period of 35.9 ± 30.7 months and the incidence of death was significantly higher in group C than in other groups (one in group A and seven in group C).
Discussion
It is not infrequent to observe late systolic peaking in RV pressure waveform in patients with PH. Late systolic peaking from dynamic RV outflow tract obstruction can be excluded in our patient population by measuring PAP and RV pressure. Therefore, late systolic peaking in these patients must be due to the reflection wave, which is similar to the late systolic peaking in left ventricular (LV) or aortic pressure waves.3,4 Late peaking due to the reflection wave gradually becomes larger and appears progressively earlier in systole when the effective reflection site becomes nearer to the measuring site.5–7 Therefore, the larger the AugPr, the stiffer the PA.
Presence of late systolic peaking in PAP waveform and difference in the augmentation index between PH due to chronic pulmonary thromboembolism and primary PH were reported in the previous study. 8 However, in our observation, late systolic peaking was more prominent in the RV pressure waveform than the PAP waveform. This is in contrast the similar prominence observed in aortic and LV pressure waveforms in late systolic peaking; unfortunately, we do not have clear explanation for this observation.
Among the patients included in our study, nearly half the patients did not show discernible late peaking. Instead, RV pressure waveform in these patients showed a peaked RV pressure waveform, instead of the usual inverted U-shaped pressure wave. We assume this waveform represents high AugPr where the inflection point of the late systolic peaking starts early systole.
In our previous study,
1
we showed that a significant difference in AugPr exists in patients with positive and negative response to vasodilator (Fig. 2). It is theoretically quite plausible that the magnitude of AugPr will not be lowered significantly by dilating the resistance arteries in the pulmonary circulation. In this study, not all patients received PAH-specific therapy and the change in mPAP could not be obtained because of the invasiveness. Therefore, whether RV pressure waveform predicts long-term responsiveness to PAH therapy could not reliably be evaluated. If we assume the change in PASP can reflect the change in mPAP and PASP can accurately be estimated by echocardiography, although statistically not significant, patients in group A showed a trend of decreasing PASP. This decrease was higher than in group B, whereas group C showed an increase in PASP during follow-up echocardiography. Considering the small number of patients with available PASP at follow-up, and wider variation in PASP compared with mPAP, especially in patients with high AugPr, further studies are needed to clarify this issue.
RV pressures in patients with a positive response to vasodilator at baseline (a) and following nitroprusside infusion (b). The difference between peak RVSP and pressure at the inflection point was 12 mmHg and the peak RVSP decreased from 70 mmHg to 45 mmHg. RV pressures in patients without a positive response to vasodilator at the baseline (c) and following nitroprusside infusion (d). The difference between peak RVSP and the pressure at the inflection point was 23 mmHg; the peak RVSPs were the same before and after nitroprusside infusion. Pressures are measured with Millar catheter. Ao, aortic pressure; RV, right ventricular pressure (Reprinted with permission by Korean Circulation Journal).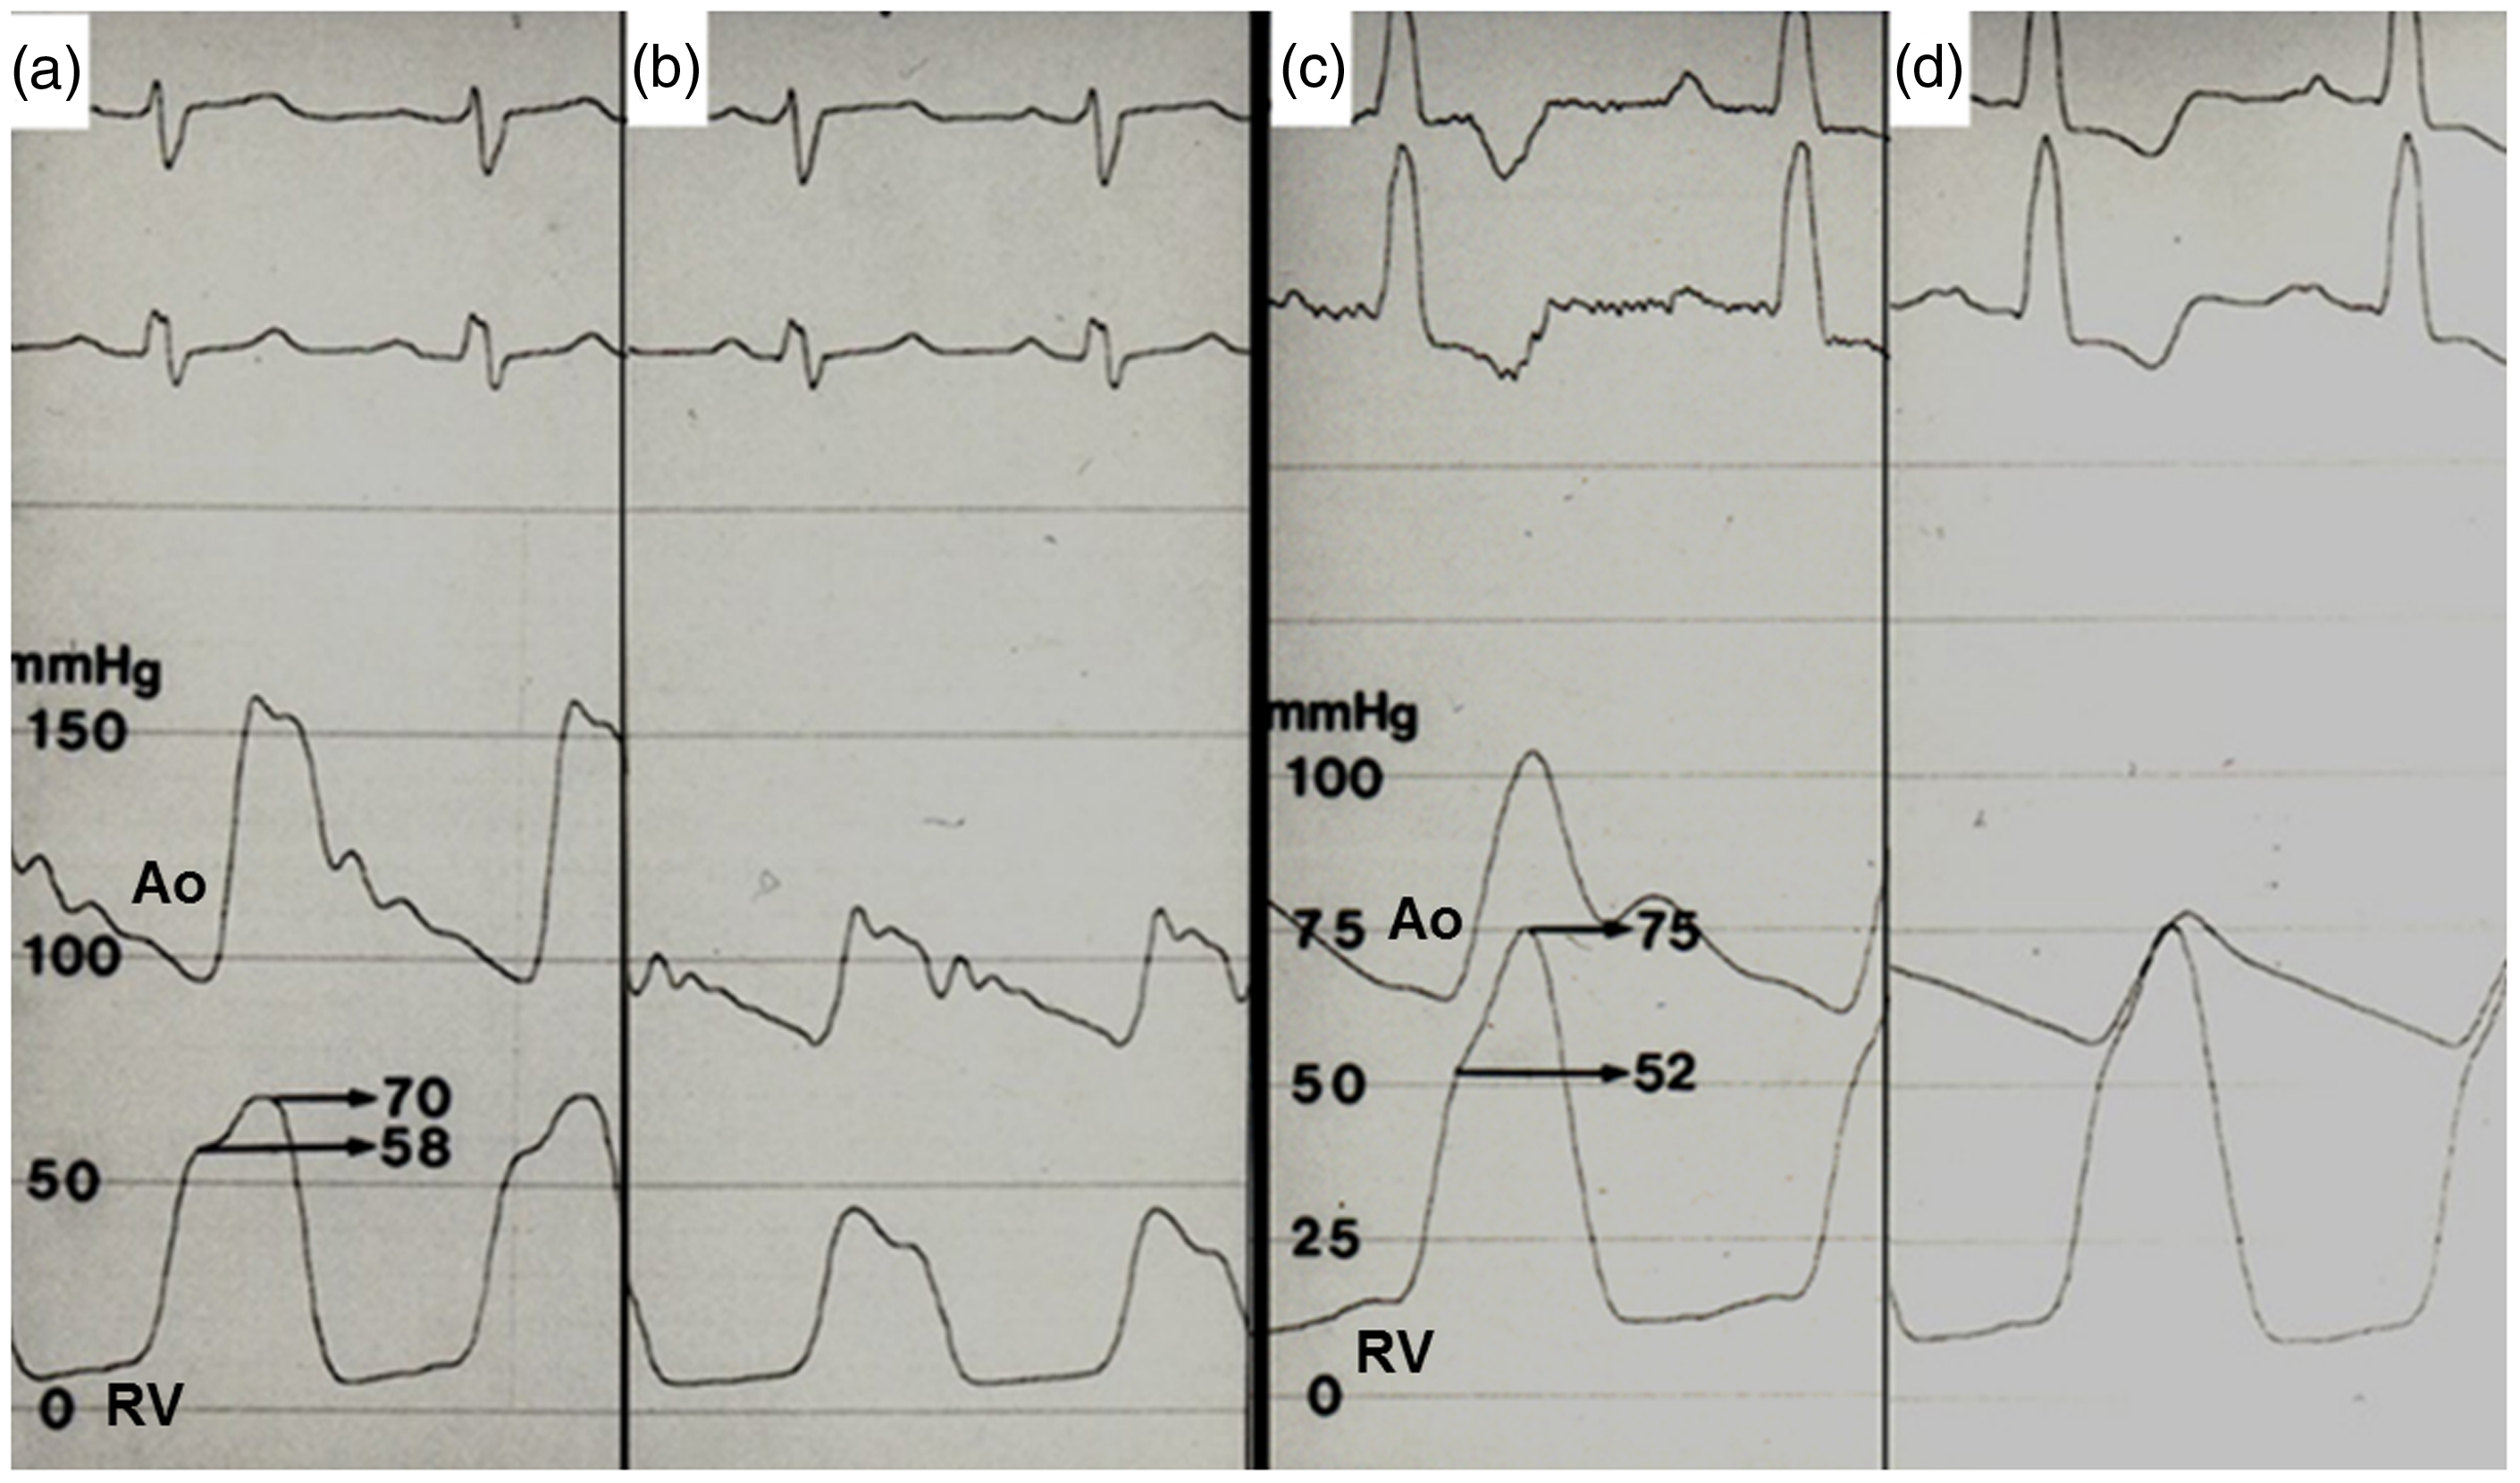
There were significant differences in PA pulse pressure in the three groups. In particular, PA pulse pressure was significantly higher in group C than in group A (Fig. 3). Patients with increased PA pulse pressure due to increased PA stiffness will tend to show wide fluctuations in PASP. This is similar to the phenomenon we frequently observe in the systolic blood pressures of patients with isolated systolic hypertension.
9
Since we usually rely on the estimated PASP by echocardiography to evaluate improvements or worsening of PH, we should take into consideration the wide variation in PASP in these patients during therapeutic decision-making.
Difference in PA pulse pressure in patients with Group A (a) and Group C (b).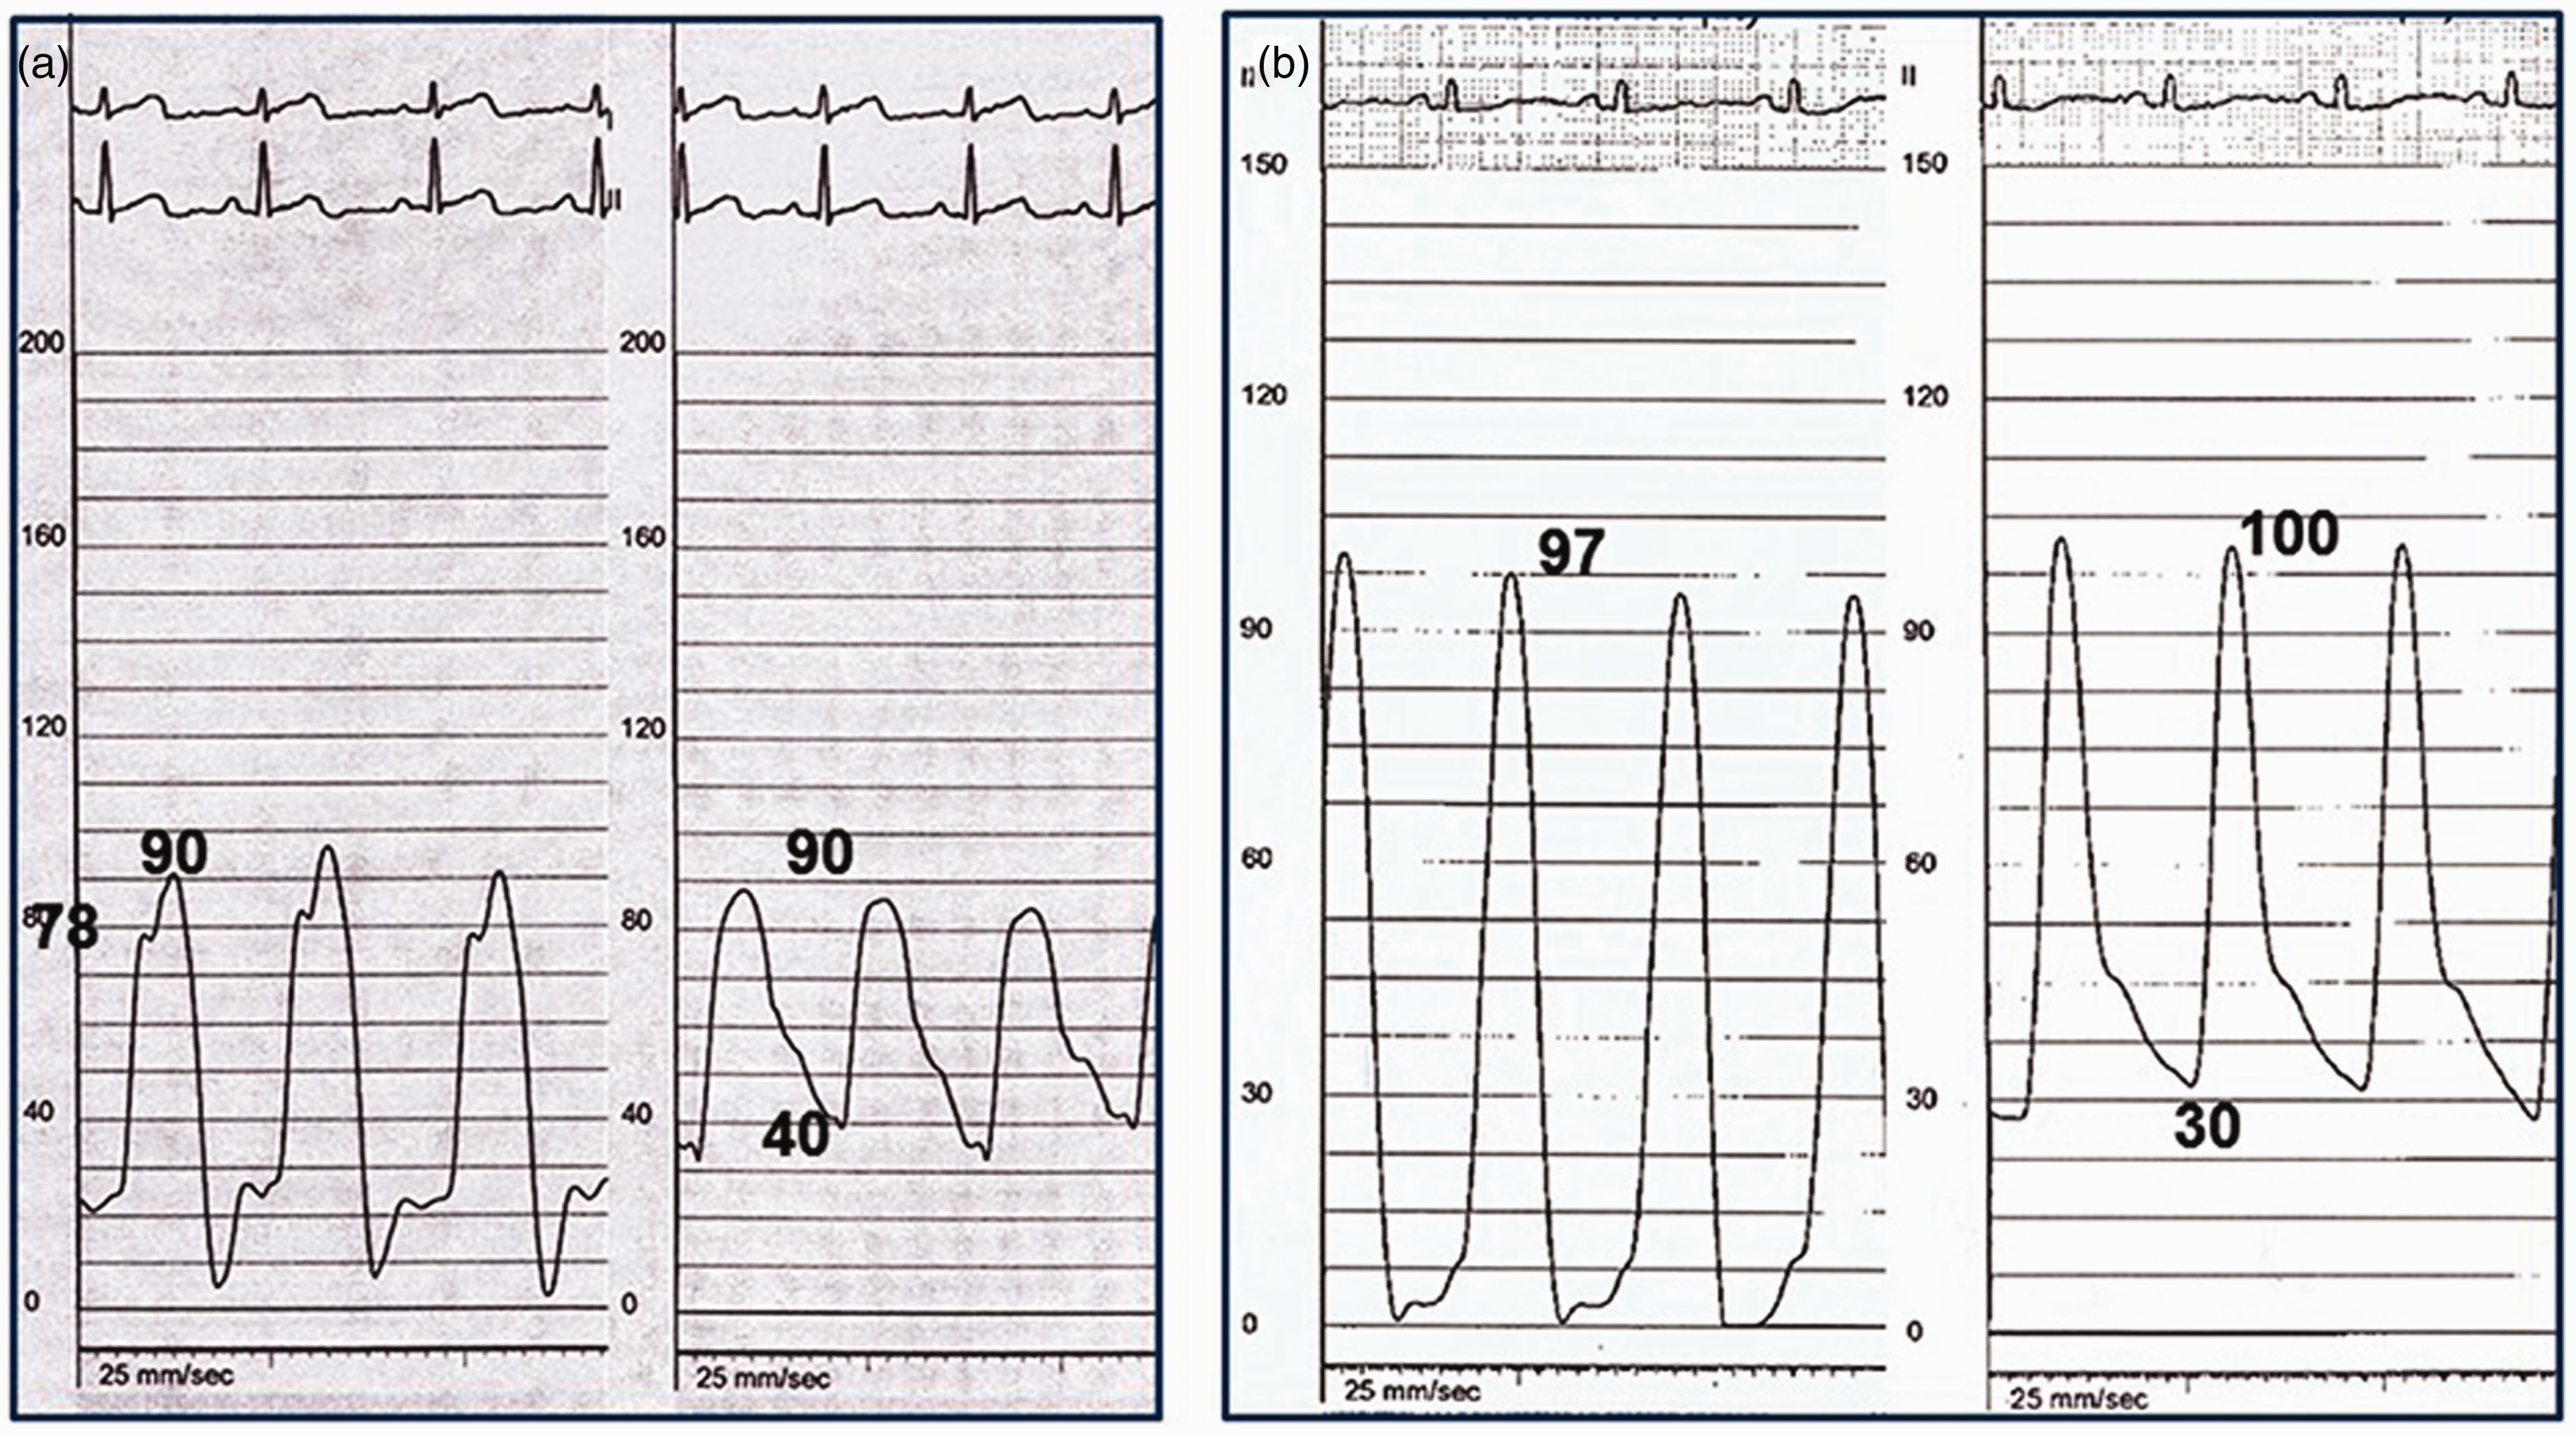
In our study, nearly all patients who died were in group C. Because of its retrospective design, we were unable to obtain other symptom-related, echocardiographic, or biomarker-based prognostic factors. Therefore, whether AugPr/RVSP is an independent prognostic factor unrelated to pre-existing prognostic factors10,11 is not known. However, the majority of currently suggested prognostic markers are related to RV function, whereas AugPr/RVSP does not only represent vascular stiffness but also reflects RV function which determines PA flow velocity as well as amount of RVSP generation. In our study, magnitudes of PASP were not significantly different between groups suggesting that absolute PAP may not be related to disease prognosis.
Study limitation
Our study was limited by its retrospective design; therefore, we could not evaluate other currently accepted prognostic factors. Showing a statistically higher cardiovascular mortality in group C despite the small sample size is quite notable and this finding is worth validating in future studies. Pressure measurements in our study were performed using a fluid-filled catheter; therefore, criticism related to pressure wave distortion in contrast to the miromanometer system cannot be avoided.
Conclusions
Prognostic information can possibly be obtained from the RV pressure waveform in patients with PAH. Additional attention should be given to the RV pressure waveform in patient with PH undergoing invasive pressure measurement as a part of work-up.
Footnotes
Conflict of interest
The author(s) declare that there is no conflict of interest.
Funding
This research received no specific grant from any funding agency in the public, commercial, or not-for-profit sectors.