
Abstract
Pulmonary arterial hypertension (PAH) patients have distinct disease courses and responses to treatment, but current diagnostic and treatment schemes provide limited insight. We aimed to see if cluster analysis could distinguish clinical phenotypes in PAH. An unbiased cluster analysis was performed on 17 baseline clinical variables of PAH patients from the FREEDOM-M, FREEDOM-C, and FREEDOM-C2 randomized trials of oral treprostinil versus placebo. Participants were either treatment-naïve (FREEDOM-M) or on background therapy (FREEDOM-C, FREEDOM-C2). We tested for association of clusters with outcomes and interaction with respect to treatment. Primary outcome was 6-minute walking distance (6MWD) change. We included 966 participants with 12-week (FREEDOM-M) or 16-week (FREEDOM-C and FREEDOM-C2) follow-up. Four patient clusters were identified. Compared with Clusters 1 (n = 131) and 2 (n = 496), Clusters 3 (n = 246) and 4 (n = 93) patients were older, heavier, had worse baseline functional class, 6MWD, Borg Dyspnea Index, and fewer years since PAH diagnosis. Clusters also differed by PAH etiology and background therapies, but not gender or race. Mean treatment effect of oral treprostinil differed across Clusters 1–4 increased in a monotonic fashion (Cluster 1: 10.9 m; Cluster 2: 13.0 m; Cluster 3: 25.0 m; Cluster 4: 50.9 m; interaction P value = 0.048). We identified four distinct clusters of PAH patients based on common patient characteristics. Patients who were older, diagnosed with PAH for a shorter period, and had worse baseline symptoms and exercise capacity had the greatest response to oral treprostinil treatment.
Pulmonary arterial hypertension (PAH) is a heterogeneous disease affecting a range of patient populations, 1 but clinical characterization of the disease has lagged behind development of therapies. The widely used World Health Organization (WHO) classification scheme is based on disease etiology and does not capture dynamic changes including disease progression and response to treatment. In addition, gender, cardiovascular risk factors and age have recently been identified as potential predictors of therapeutic response.2–5
Clustering, also referred to as phenomapping, is a statistical technique that utilizes unbiased machine learning and has been recently applied as a proof-of-concept strategy for classifying patients with heart failure.6–8 We aimed to use cluster analysis on PAH participants included in clinical trials to identify distinct clinical phenotypes in PAH. We selected three recent trials assessing response to the same intervention, oral treprostinil. The trials had the same endpoint, change in 6-minute walk distance (6MWD), allowing us to assess whether change in 6MWD would differ across clinical phenotypes. The trials were FREEDOM-M (oral treprostinil monotherapy: median placebo-corrected 6MWD change, +23 m), FREEDOM-C, and FREEDOM-C2 (oral treprostinil in combination therapy, no significant placebo-corrected 6MWD change).9–11
Methods
Study design
FREEDOM-M (NCT00325403), FREEDOM-C (NCT00325442), and FREEDOM-C2 (NCT00887978) were multicenter, randomized trials of oral treprostinil as mono- or part of combination therapy in patients with PAH. Participants from FREEDOM-M (n = 349) were randomized to oral treprostinil versus placebo as initial PAH treatment in a 2:1 fashion with 12-week follow-up. The FREEDOM-C (n = 350) and FREEDOM-C2 (n = 310) trials randomized participants to oral treprostinil versus placebo in a 1:1 ratio as part of combination therapy for total duration of 16 weeks.
Patient population
Specific eligibility criteria have been previously published.9–11 As an overview, participants with idiopathic or hereditary PAH, drug-associated PAH, PAH associated with repaired congenital shunts, or PAH associated with collagen vascular disease or Human Immunodeficiency Virus (HIV) were recruited. Baseline 6MWD was required to be in the range of 100–450 m for FREEDOM-M and FREEDOM-C, and 150–425 m for FREEDOM-C2.
Additional inclusion criteria for FREEDOM-M were de novo PAH diagnosis and no concurrent background therapy. In contrast, FREEDOM-C and FREEDOM-C2 only included patients taking an approved phosphodiesterase type-5 (PDE-5) inhibitor or endothelin receptor antagonist (ERA) therapy, or combination of both, for at least 90 days and on a stable dose for at least 30 days before study entry. Participants with any evidence of significant left-sided heart disease or parenchymal lung disease were excluded from all studies. Of note, a significant proportion of participants were recruited from Chinese and Indian PAH centers, allowing for study of racial differences.
As is necessary for cluster analysis, patients with missing data for any of the cluster variables were excluded.
Cluster variables
Individual variables that were included for clustering of participants were ascertained at baseline and encompassed clinical characteristics, laboratory data, background medications, and functional capacity. First, the selected variables were clustered to map out all interrelationships. Binary divisive clustering was performed using the PROC VARCLUS function in SAS software (SAS Institute, Cary, NC, USA) for continuous variables. All participants were initially included in one cluster at the beginning of our cluster analysis. In each divisive iteration, a principal component analysis (PCA) was performed on the set of variables within the cluster. The PCA, a procedure used to create predictive models, converts possibly correlated variables via orthogonal transformation into a set of values of linearly uncorrelated variables called principal components (PCs). The first two PCs, which had the highest variance, were identified, and the cluster was split into two corresponding sub-clusters according to the correlation between each variable and each PC. This divisive iteration process was continued until only one PC was found in the cluster (i.e., when the second eigenvalue ≤1). Each divisive iteration was also coupled to a test procedure in which each variable was tested to see if assigning it to a different cluster increased the amount of variance it explained. If it did, the variable was reassigned to that cluster and the components of the two clusters involved were recomputed before the next variable was tested. For categorical variables, PCA and PROC VARCLUS were not applicable. Categorical variables with k levels were therefore represented by k-1 dummy variables.
Our variable grouping with PCA resulted in five clusters for continuous variables (Cluster 1: age, weight, creatinine; Cluster 2: systolic blood pressure, diastolic blood pressure; Cluster 3: aspartate aminotransferase (AST), bilirubin; Cluster 4: years since PAH diagnosis, heart rate; Cluster 5: baseline 6MWD, sodium, baseline Borg Dyspnea Index) and two clusters for categorical variables (Cluster 1: ethnicity, functional class, background therapy; Cluster 2: gender, disease etiology).
Participant clustering
The goal of cluster analysis is to group participants who are more closely related to each other than to other participants. The participant clustering process begins with every individual as a separate cluster. We used PCA output of variable clusters to group participants based on standardized first PC score values derived from each of the seven variable clusters. We used the PROC CLUSTER function to accomplish agglomerative clustering by merging the two closest clusters based on weighted Euclidean distance. Clustering based on this distance is in accordance to Ward’s minimum variance method.
The clustering process is continued until only a single cluster remains that includes all participants. To choose an optimal cluster number, we looked for the stage in the clustering process that provided greatest consensus among three statistics: the local peaks of the cubic clustering criterion and pseudo F statistic, combined with a small value of the pseudo t2 statistic next to a larger pseudo t2 value for the next cluster fusion.
Clinical endpoints
The primary endpoint for all three trials was change in 6MWD from baseline to end of study follow-up (FREEDOM-M: 12 weeks; FREEDOM-C and FREEDOM-C2: 16 weeks). Secondary endpoints of interest included clinical worsening, Borg Dyspnea Index and WHO functional class (FC).
Statistical analysis
Association between identified participant clusters and clinical outcomes was tested using one-way ANOVA for change in 6MWD, and logistic regression for change in functional class and change in Borg Dyspnea Index. Changes were the differences between baseline and end-of-study values. We also assessed for interaction between treatment (treprostinil versus placebo) and outcomes with respect to cluster membership. Interactions for 6MWD change were assessed with two-way ANOVA, and for Borg Dyspnea Index and WHO-FC with logistic regression. To understand trends across clusters, linear trend test was used for continuous variables and the Cochran-Armitage test was used for categorical variables. Continuous variables were expressed as mean ± standard deviation, and categorical variables were expressed as n (%). Normality of the 6MWD data was assessed by the histograms of residuals and quantile-quantile plots in all participants and treprostinil- and placebo-treated subgroups (Supplemental Figure). 6MWD change was also presented as median (Q1, Q3) for comparison to individual study results, and we tested this data for non-parametric significance with the Kruskal–Wallis test. A P value < 0.05 was considered statistically significant for all analyses.
Results
Baseline characteristics of combined participants from FREEDOM-M, FREEDOM-C, and FREEDOM-C2 trials.*
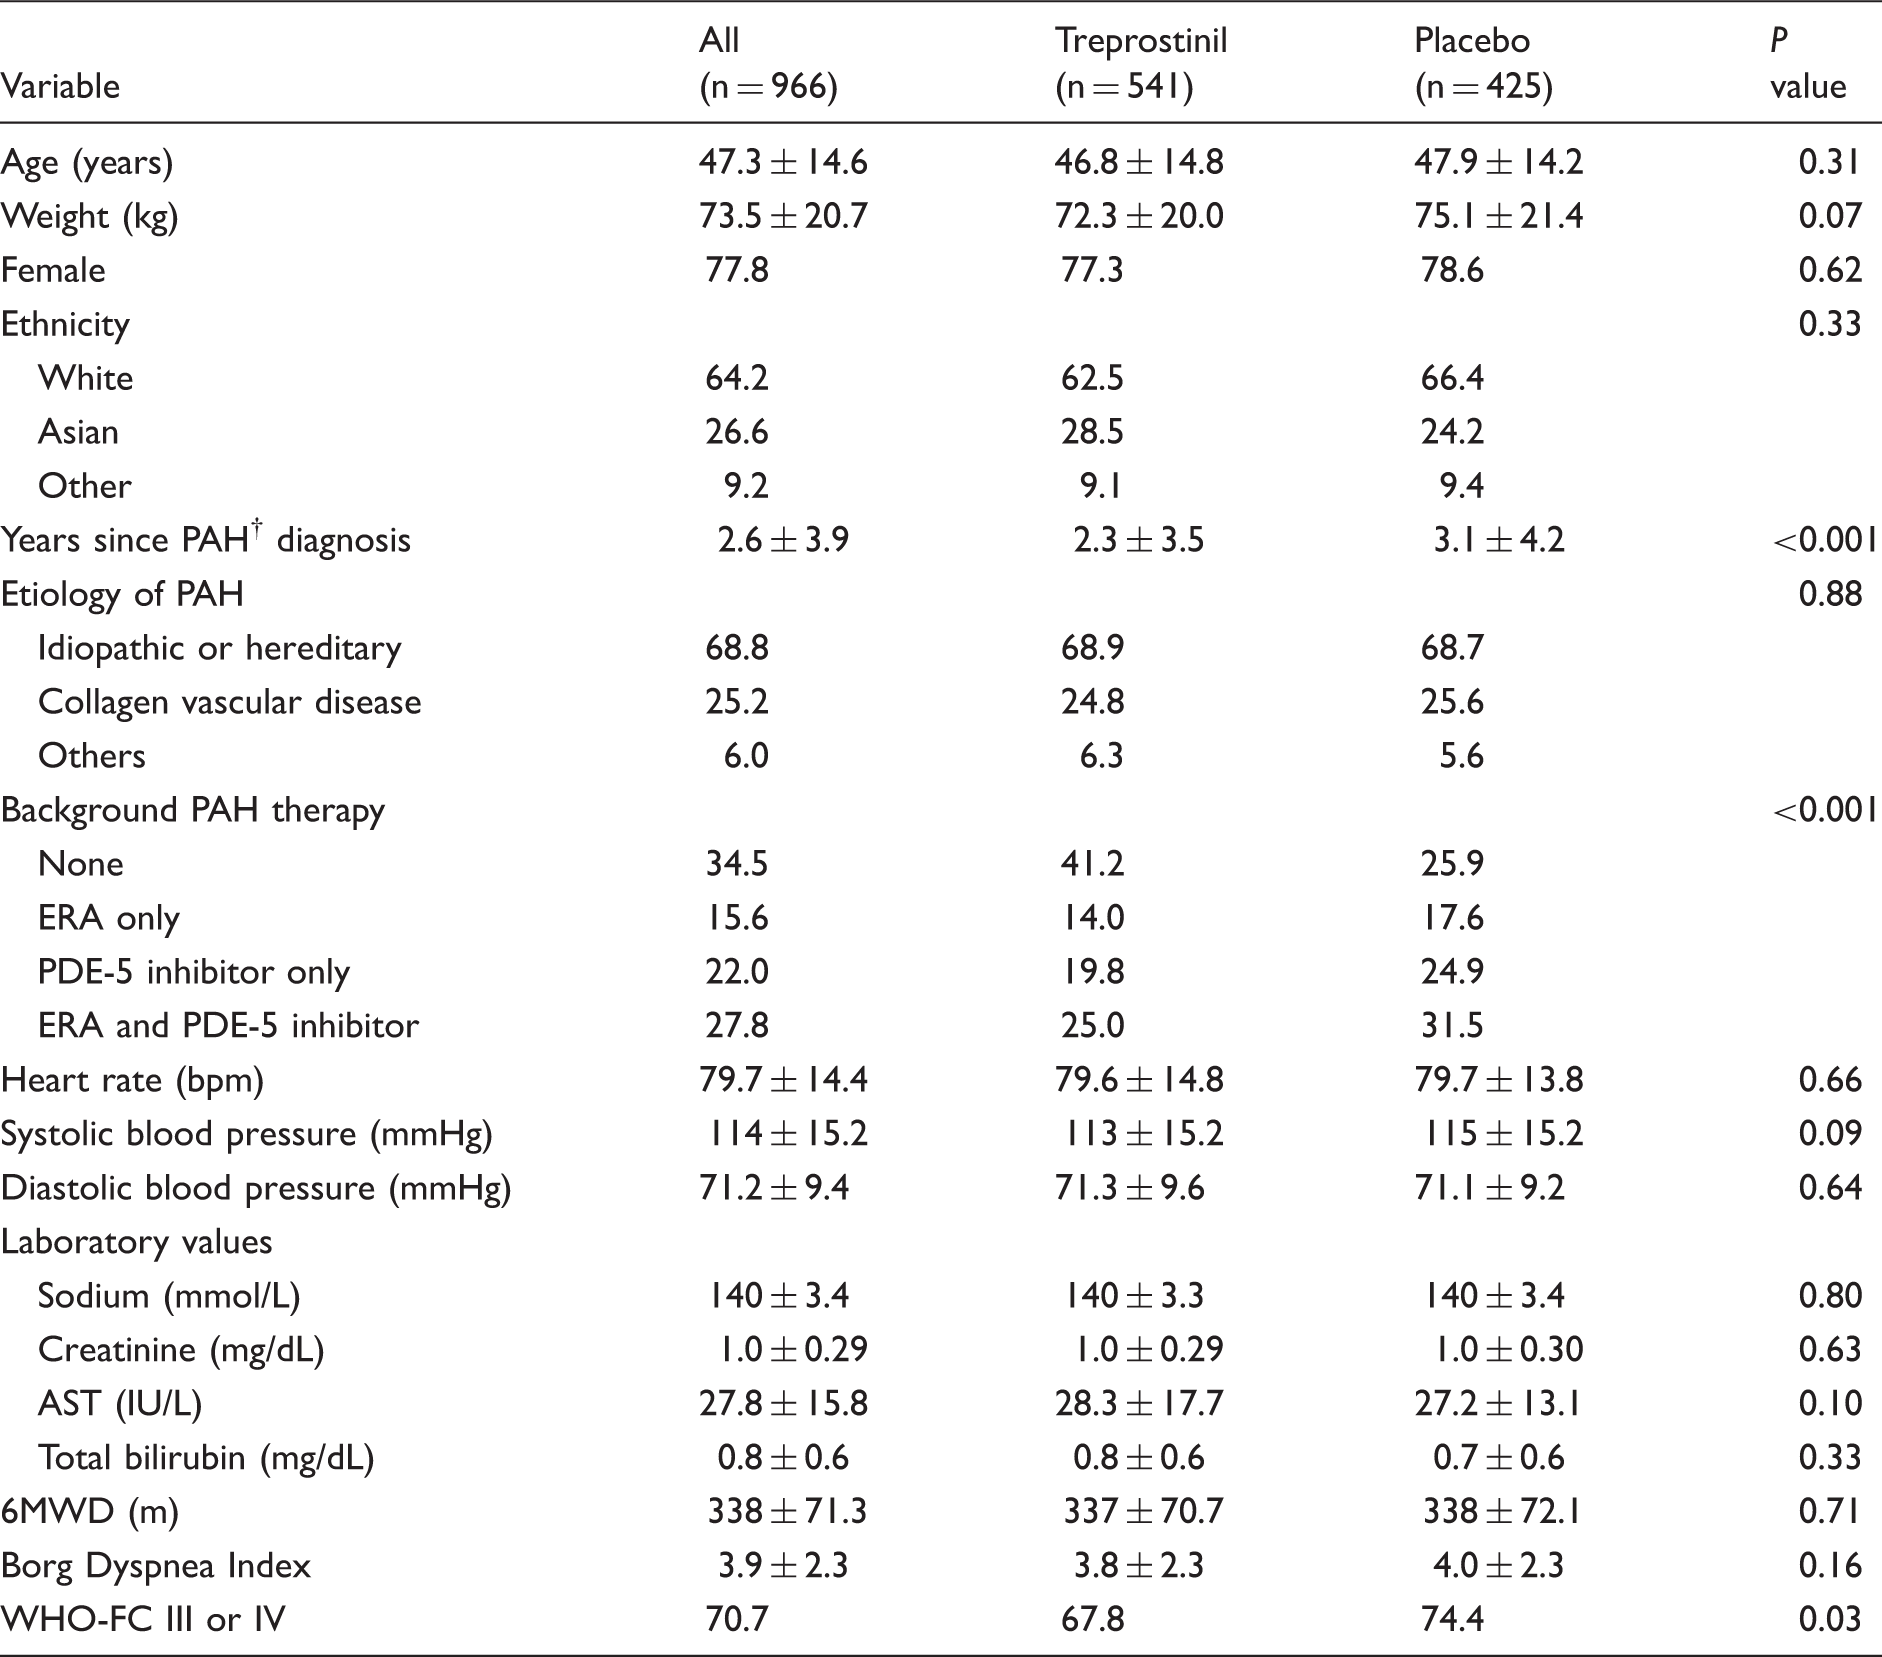
Variables shown as mean ± standard deviation or %. P values are for comparison of oral treprostinil vs. placebo groups.
6MWD, 6-minute walk distance; AST, aspartate aminotransferase; ERA, endothelin receptor antagonist; IU, International units; PDE-5, phosphodiesterase type-5; PAH, pulmonary arterial hypertension; WHO-FC, World Health Organization functional class.
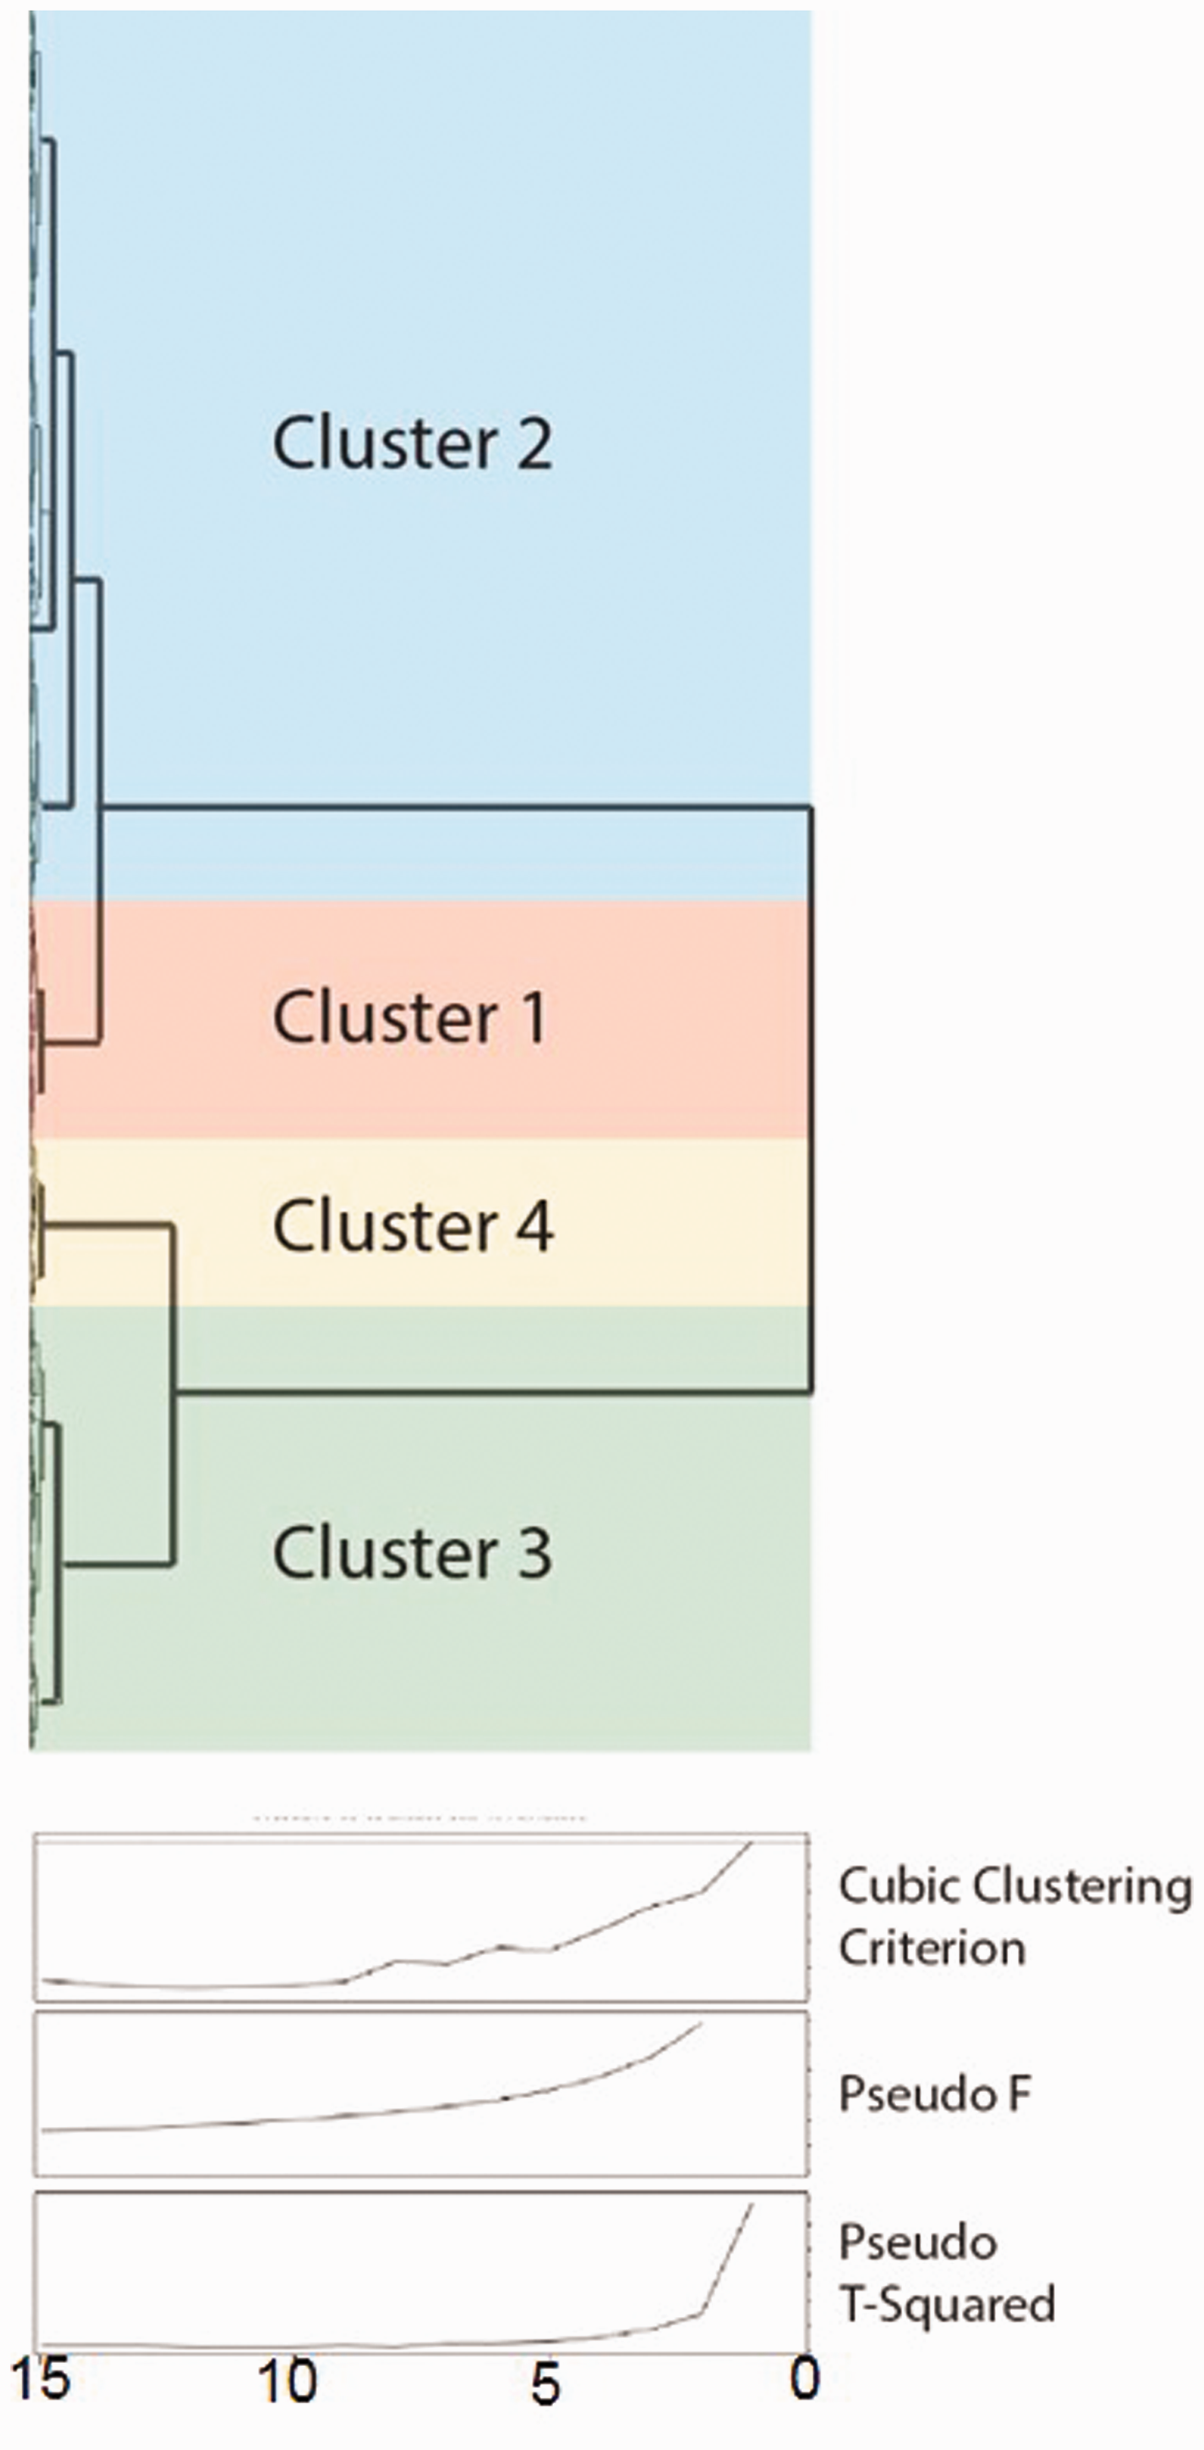
Cluster dendogram (top) and analysis to identify the optimal cluster number (bottom). The arrangement of the branches in the dendogram represents relative degree of similarity between participants (i.e., Euclidean distance). The greater the height of the branch points, the greater the differences between the branches. The cubic clustering criterion (CCC), pseudo-F statistic, and pseudo T-squared statistic suggest four clusters can be created from the study population.
Comparison of baseline data among clusters
Baseline patient characteristics according to patient clusters.*
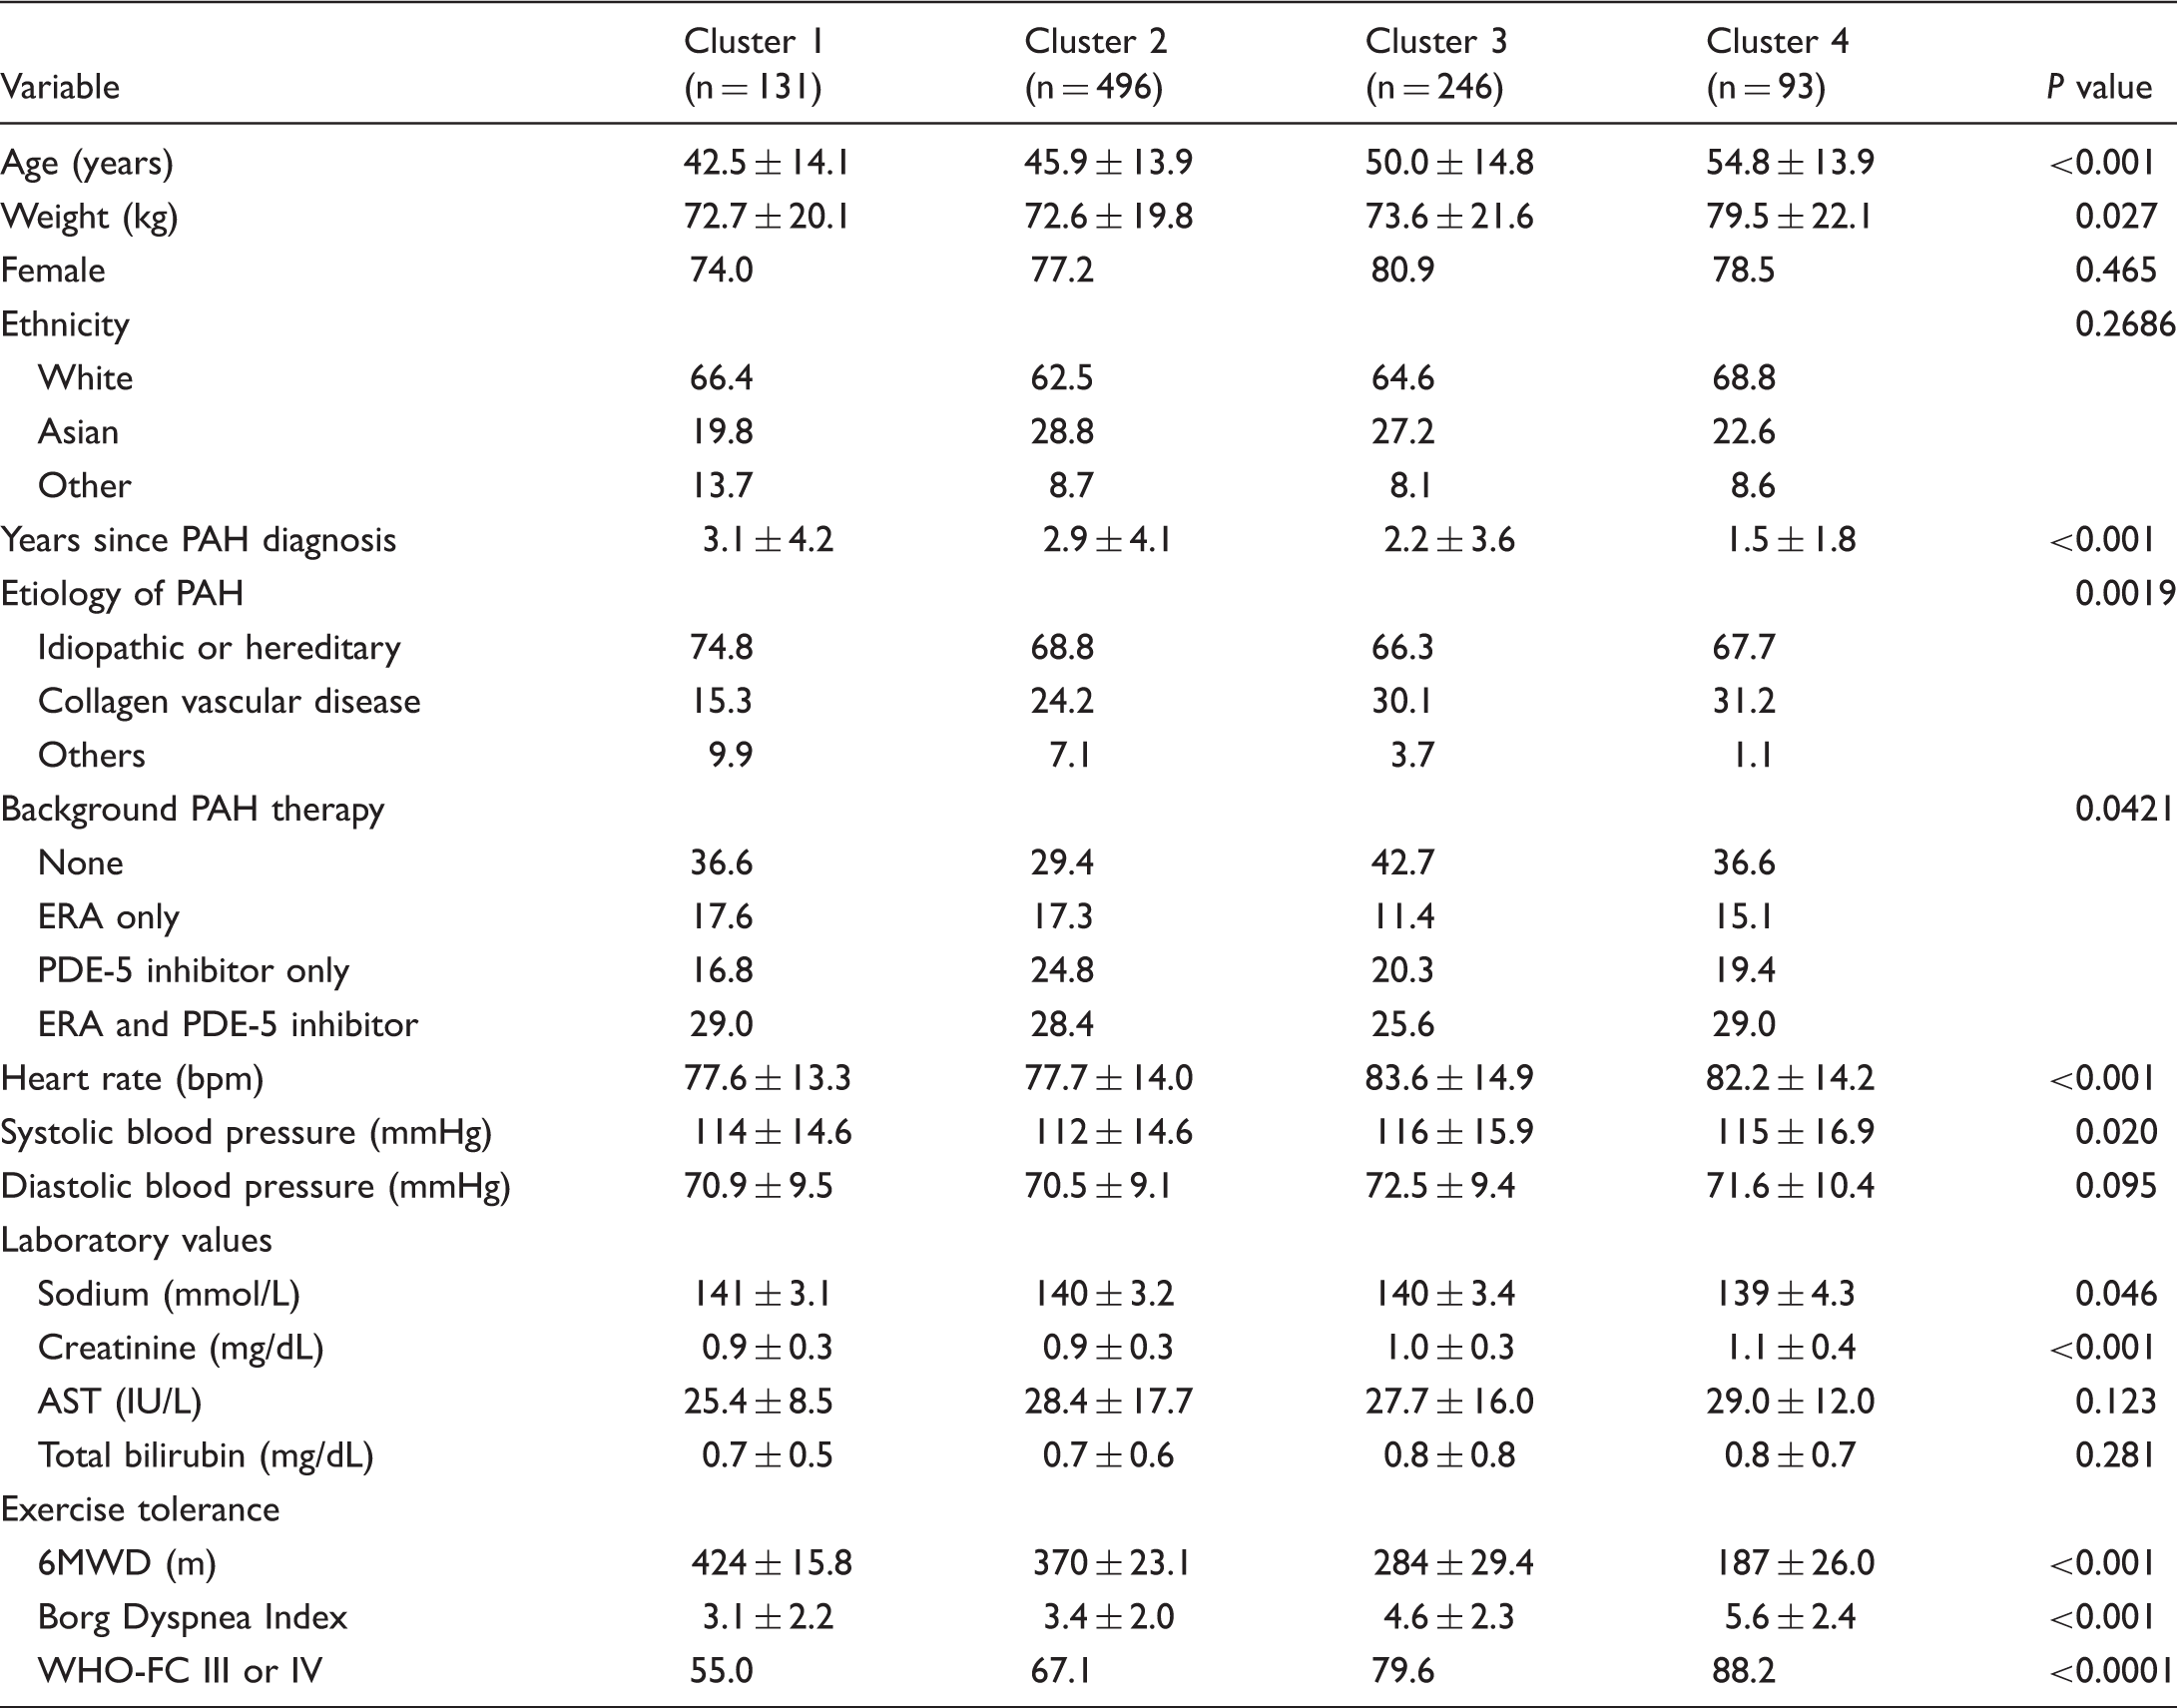
Variables shown as mean ± standard deviation or % unless stated otherwise. P values are for comparisons of variables across clusters.
6MWD, 6-minute walk distance; AST, aspartate aminotransferase; ERA, endothelin receptor antagonist; IU, International units; PDE-5, phosphodiesterase type-5; PAH, pulmonary arterial hypertension; WHO-FC, World Health Organization functional class.
Baseline functional capacity and dyspnea severity were assessed by 6MWD, Borg Dyspnea Index and proportion of patients identified as having WHO-FC III or IV symptoms. All three measures tracked together across clusters from best functional capacity (highest 6MWD, lowest Borg Dyspnea Index, and lowest proportion with WHO-FC III/IV symptoms) to worst functional capacity (lowest 6MWD, highest Borg Dyspnea Index, and highest proportion with WHO-FC III/IV symptoms) in the following order: Cluster 1 > Cluster 2 > Cluster 3 > Cluster 4 (P ≤ 0.001 for trend in all measures).
Follow-up
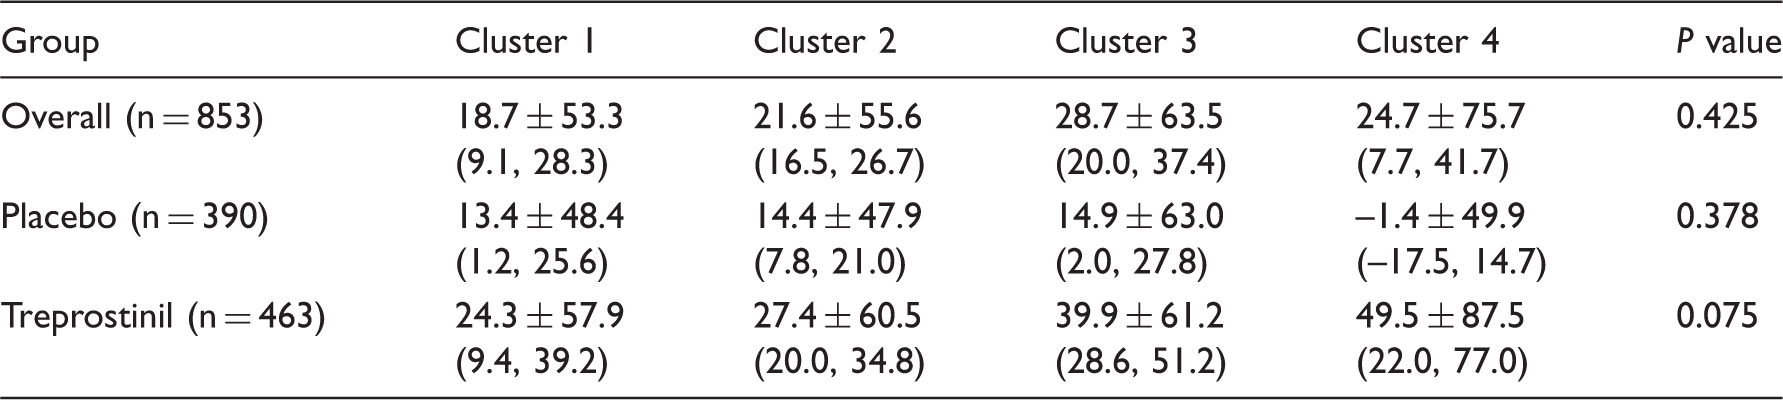
Mean change (SD) in 6MWD (m) from baseline by cluster.
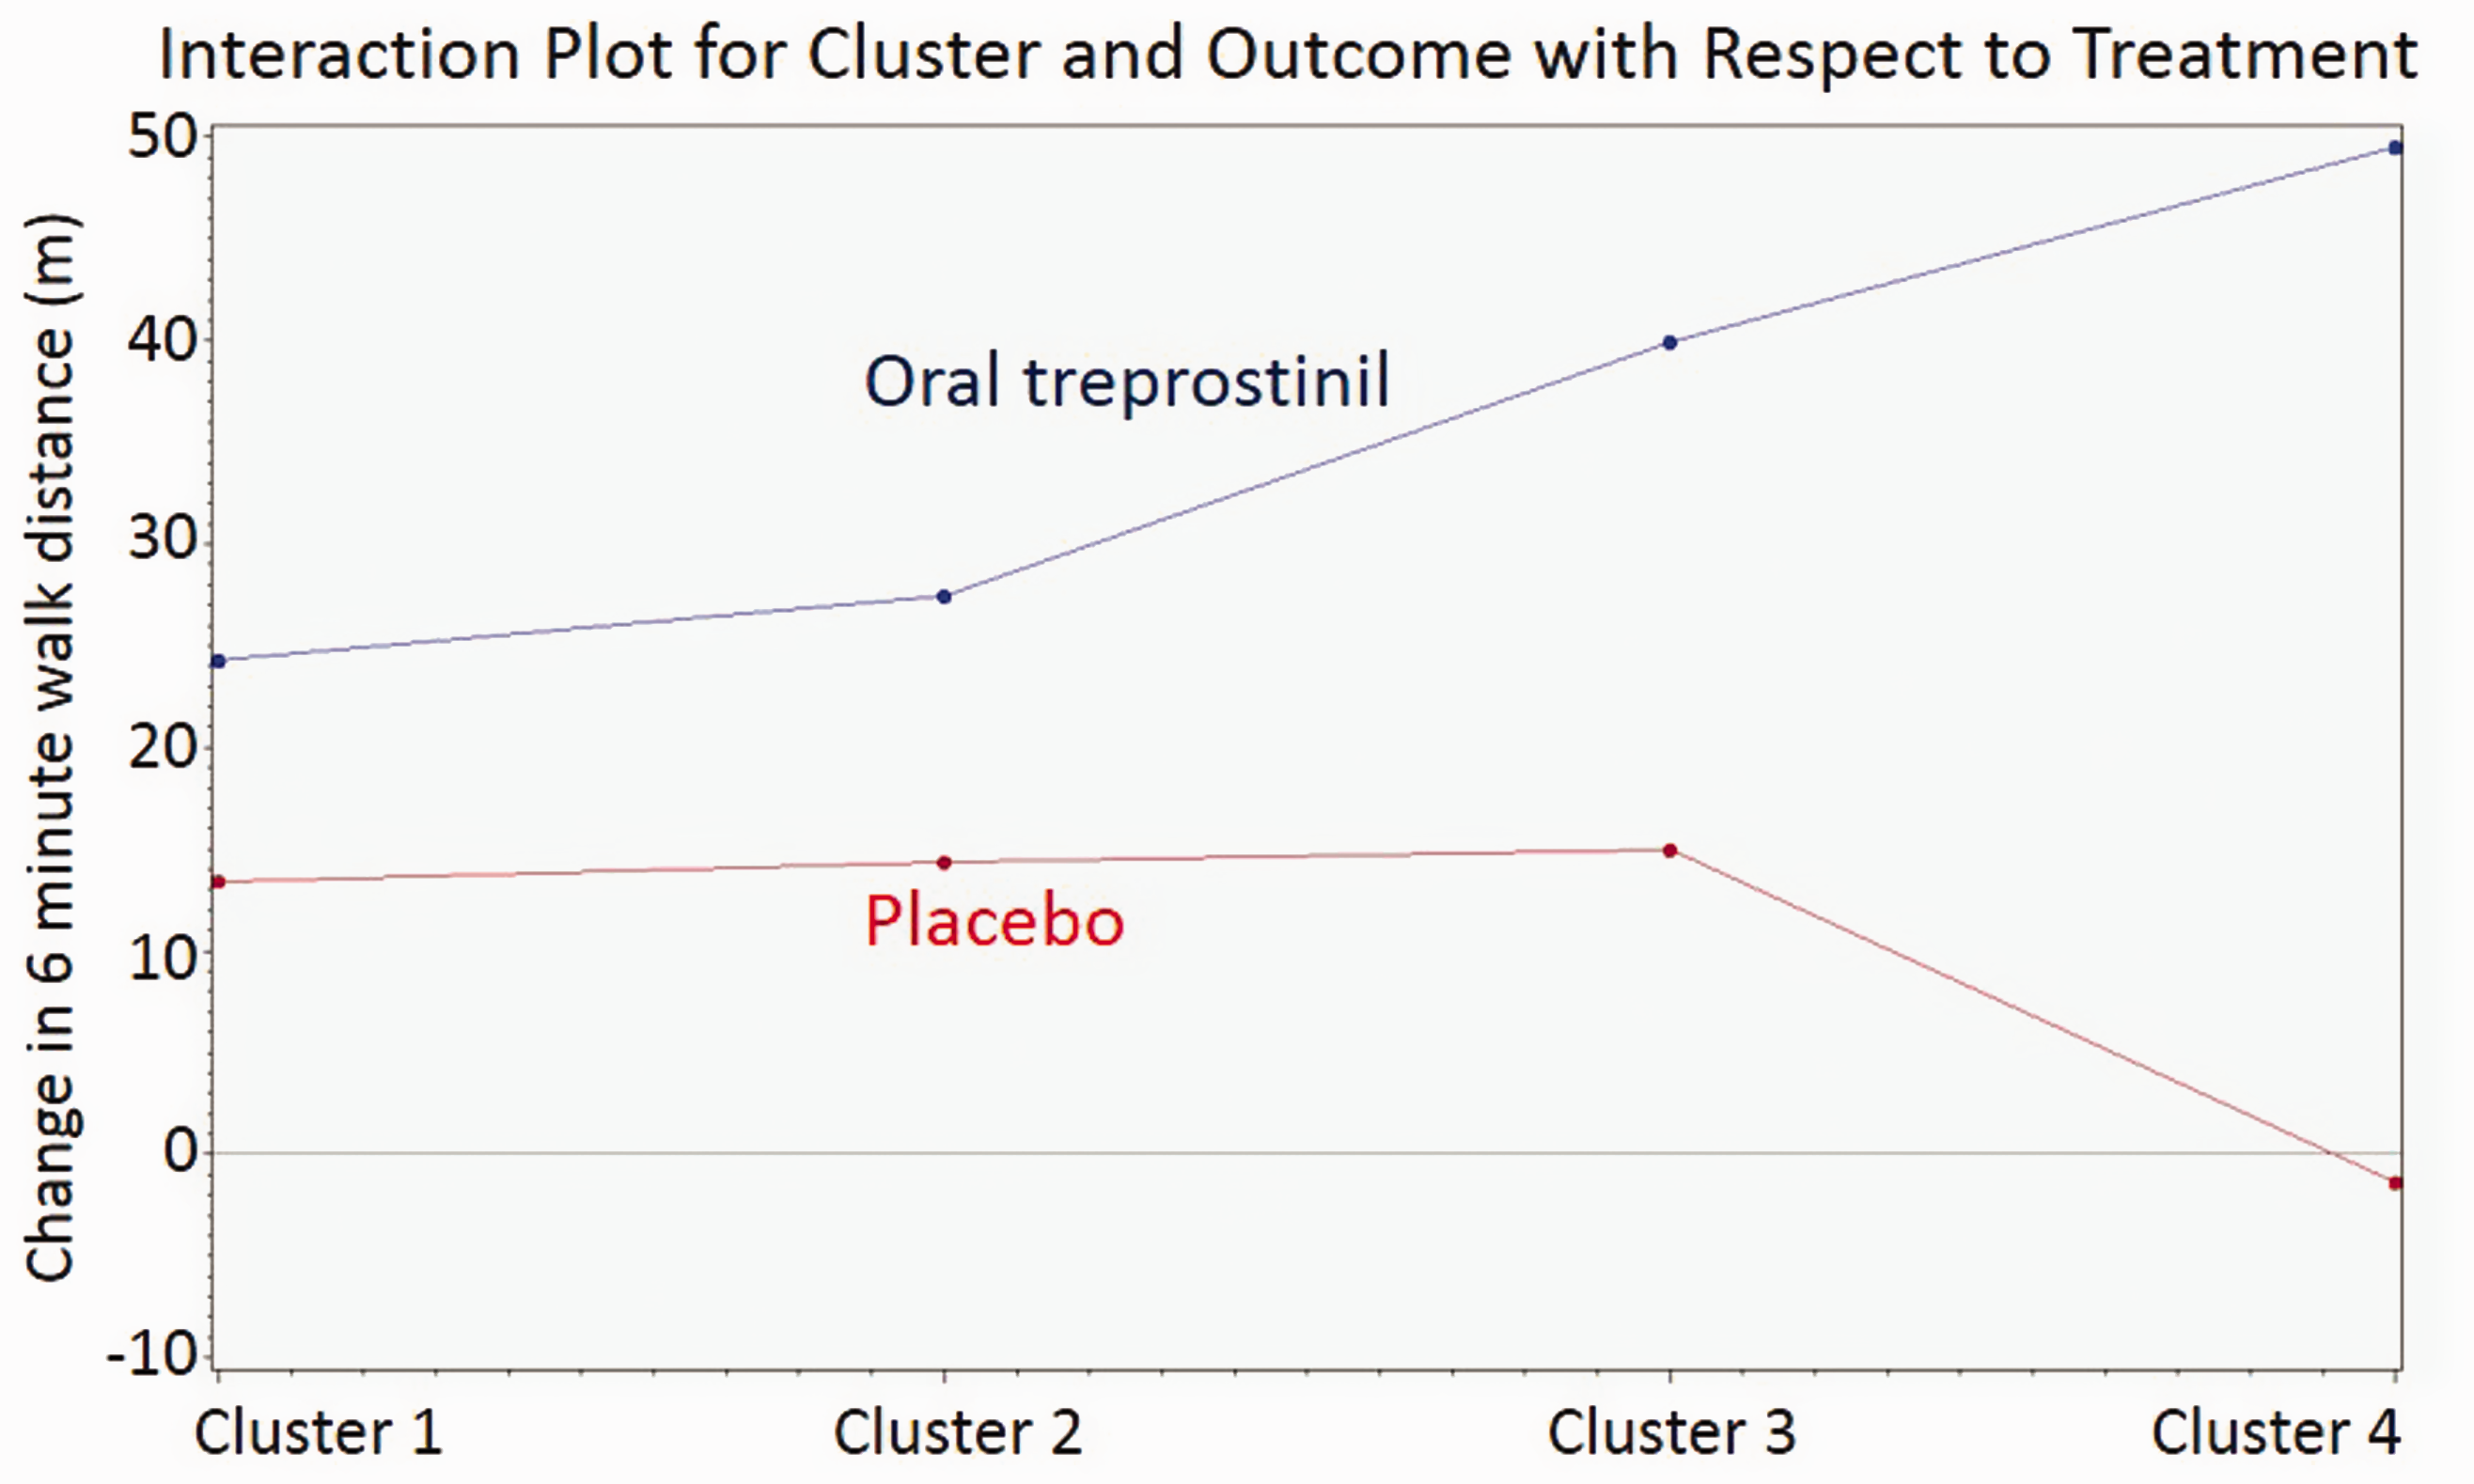
Interaction plot for cluster and mean change in 6MWD with respect to treatment. Treatment effect increased monotonically with cluster number, from Clusters 1 to 4.
Discussion
We used an unbiased approach to identify four phenotypically different clusters from a cohort of 966 PAH patients enrolled in clinical trials. We then looked for change in 6MWD in each cluster. The main findings of our study are the following: (1) cluster analysis can identify distinct profiles within a heterogeneous PAH cohort; (2) patients in the clusters have different functional capacity and symptoms; and (3) predicted change in 6MWD may differ based on the participant’s clinical phenotype. Our study highlights clinical variation among participants enrolled in PAH trials, a consideration that has implications for future clinical trial design and understanding what constitutes optimal therapy in patients with PAH.
To our knowledge this is the first published utilization of machine learning to phenotype patients with PAH. Cluster analysis has also been successfully applied to both acute and chronic HF patients in recent years.6–8 Like HF, a heterogeneous syndrome, PAH can vary by etiology, co-morbidities, and endotypes, resulting in a spectrum of limitations on physical activity and dyspnea. However, this range of patient-specific characteristics is not captured by hemodynamic definitions or the etiology-based WHO classification system alone. By combining data from three studies with study sites in the USA, Europe, and Asia, the composition of our cohort was diverse.
Phenotypes in PAH
Comparison of phenotypes between clusters reveals several points of interest. Broadly, patients at time of their study enrollment tend to be either younger and lighter, have longer-standing PAH diagnosis, and lower resting heart rate (Clusters 1 and 2, approximately two-thirds of the cohort) or older, heavier, with shorter time since their PAH diagnosis, and higher resting heart rate (Clusters 3 and 4, the remaining one-third of the cohort). Patients fitting into the younger two-thirds of the cohort were more likely to be assigned specifically to Cluster 1 if they were non-Asian, had idiopathic or hereditary PAH, and no background PAH therapy. These patients had the best functional capacity and symptoms across all clusters. Among the older third of the cohort (Clusters 3 and 4), patients in Cluster 4 were the heaviest, more likely to be White and on background therapy. Cluster 4 patients had the lowest 6MWD and almost 90% of these patients had WHO-FC III or IV symptoms. Interestingly, although time since PAH diagnosis decreased across clusters in concordance with worsening of functional capacity and symptoms, there was no corresponding trend in: (1) PAH etiology; (2) proportion of patients on no background therapy; or (3) frequency of combination regimens among patients on background therapy. Time since PAH diagnosis may represent a source of length time bias, where “less sick” patients were diagnosed earlier in their disease course than others due to more significant symptomatology or other work-up.
Cluster association with clinical outcome
We assessed response to therapy with oral treprostinil as a case study utilizing cluster analysis of PAH trial data. The Food and Drug Administration approved oral treprostinil in December 2013 for PAH patients to improve exercise capacity. The minimal 6MWD change yielding significant difference in quality of life approximates 33 m when standardized to quality of life assessments in PAH patients. 12 Although the mean improvement in 6MWD for all participants on study drug was less than 33 m, we observed that the treatment effect (i.e., the difference in 6MWD over time based on study intervention) varied with cluster membership. The PAH patients in Cluster 4 had the worst baseline functional capacity and obtained clinically meaningful improvement in 6MWD with treatment. Several potential reasons for this relationship may exist. A “ceiling effect” for additive treatment may exist in certain patients whose pulmonary vasodilation is already maximized by their current treatment. Also, the therapeutic pathway yielding the most profound response may be variable between patients (and clusters). Although the heavier weight of Cluster 3 and 4 participants may have suggested a potentially greater tolerability of twice daily dosing of oral treprostinil, these participants had nearly twice as high rates of premature discontinuation of study drug as participants in Clusters 1 and 2, suggesting a “high risk/high reward” phenotype. As a next step, the cluster analysis should be validated in another PAH population and with other therapies.
Our findings have important implications for PAH classification and trial design. Within the context of precision medicine, our cluster analysis is a pragmatic approach to phenotypic description that could guide therapeutic decisions.13–16 In an era with several classes of PAH drugs, with novel therapies in the pipeline, this is a necessary next step for management of PAH. The overall PAH population is evolving over time, becoming older and heavier, and having more co-morbidities, and has an increasing number of therapeutic regimen options.17,18 In-depth phenotyping of this population is needed to shift towards more efficient and effective future clinical trial design.
Limitations
Although we included a large sample size from three multi-center randomized controlled trials, a limitation of our study is the lack of validation of our clustering with an external cohort. Also, our predefined cluster variables did not include hemodynamic or echocardiographic data due to limitation of the data collected in the trials, which would have likely added depth to the phenotypic description of our clusters. Finally, we did not have long-term clinical outcomes data available for our analysis, which would have also aided in understanding similarities and differences between the clusters.
Conclusions
This is the first study to our knowledge that performed cluster analysis for PAH patients and showed distinct clinical phenotypes among participants enrolled in PAH clinical trials. Although this technique needs to be validated in other PAH populations, cluster analysis may be effective in developing more efficient clinical trials and informing the timing and selection of therapies in patients with PAH.
Footnotes
Conflict of interest
The author(s) declare that there is no conflict of interest.
Funding
This research received no specific grant from any funding agency in the public, commercial, or not-for-profit sectors.