
Abstract
Pulmonary arterial hypertension (PAH) is a chronic progressive disease that leads to right heart failure and death. Pulmonary arterial capacitance (PAC), defined as stroke volume divided by the pulmonary pulse pressure, has been identified as a prognostic factor in PAH. The impact of changes in PAC over time, however, is unclear. We evaluated changes in PAC over time to determine if such changes predicted transplant-free survival. A single-center retrospective study of consecutive group 1 PAH patients who had two or more right heart catheterizations (RHC) between January 2007 and June 2016 was undertaken. Hemodynamic data, clinical data, and outcomes were collected. Univariate and multivariate Cox proportional-hazards modelling to identify the contribution of risk factors for a composite outcome of death or lung transplantation was done. Mixed-effects logistic regression was performed to investigate the association between the change in PAC value over time and the composite outcome. A P value < 0.05 was considered significant. In total, 109 consecutive patients with a total of 300 RHC data were identified. PAC correlated inversely with functional status (P < 0.001) and inversely with pulmonary vascular resistance (P < 0.001). PAC values increased with the addition of new PAH-specific medications. Mixed effects logistic regression modeling using longitudinal data showed that a decrease in PAC over the study period was associated with increased mortality and transplantation (adjusted P = 0.039) over the study period. Change in PAC was a better predictor of outcome over the study period than baseline PAC or changes in other hemodynamic or clinical parameters. Decreases in PAC were predictive of increased mortality or transplantation in patients with group 1 PAH. There was a trend towards increased PAC in response to the addition of a PAH-specific medication. Our data support the use of PAC as a therapeutic target in PAH.
Introduction
Pulmonary arterial hypertension (PAH) is a progressive chronic disease that results in right heart failure and death. PAH is defined as a mean pulmonary artery pressure (mPAP) ≥ 25 mmHg as measured on right heart catheterization (RHC) in the presence of a pulmonary capillary wedge pressure (PCWP) ≤ 15 mmHg. 1 Despite advances in the treatment of PAH over the past two decades, mortality remains high. 2 Better understanding of responses to treatment is critical for reducing mortality. Current treatment guidelines recommend the use of multiple therapeutic targets including functional assessment, biomarker analysis, transthoracic echocardiography, and hemodynamic assessment to guide therapy. 3 These recommendations largely extrapolate the use of prognostic markers, which when measured on initial and subsequent assessment serve to predict mortality and outcome, derived from large registries.4,5
Indices of pulmonary artery (PA) stiffness have been used as prognostic markers in PAH.6,7 This approach was originally used in systemic hypertension, where aortic stiffening was demonstrated to be a marker of poor prognosis. 8 In a landmark study by Mahapatra et al., PA stiffness in PAH was evaluated by a pulmonary arterial capacitance (PAC) measurement, hemodynamically defined as stroke volume (cardiac output divided by heart rate) divided by pulmonary pulse pressure (PA systolic pressure minus PA diastolic pressure). 9 Results of this study, which included patients with PAH with a mPAP greater than 40, showed that PAC was an independent predictor of mortality, with a higher hazard ratio (HR) compared with other traditional hemodynamic prognostic factors such as mPAP or cardiac index. 9 The use of PAC as a predictor of mortality has been confirmed in subsequent studies.10,11 Measures of PA stiffness have been used in a number of subsets of pulmonary hypertension (PH) populations, including as a method of predicting outcome after pulmonary endarterectomy for chronic thromboembolic PH, in chronic obstructive pulmonary disease as a marker of abnormal hemodynamic response to exercise, in congenital structural heart disease, and in the optimization of patients with portopulmonary hypertension prior to liver transplant.12–15 PA stiffness has also been shown to be a predictor of mortality in patients with PH secondary to left heart disease. 16
Despite the potential of PAC as a prognostic factor in PAH, there is a paucity of information regarding PAC changes over the course of a patient’s disease. 7 Therefore, we evaluated the impact of PAC and change in PAC over time, as measured by RHC in group 1 PAH patients, on outcomes.
Materials and methods
Participants
After obtaining IRB approval, a comprehensive review was undertaken over the period January 2007 to June 2016 of outpatient RHCs performed at one outpatient catheterization facility. All patients were seen and assessed at the Pulmonary Hypertension Clinic at Baylor College of Medicine prior to the RHC. Patients who had two or more RHCs performed were included in the analysis. PAH was defined by mPAP ≥ 25 mmHg and PCWP ≤ 15 mmHg and included patients with the World Health Organization (WHO) group 1 PAH. 17 Hemodynamic variables from RHC were recorded, with additional parameters calculated as described below. For each RHC, information from the closest available clinic note was obtained including demographic data, type of PAH, WHO functional class (FC), six-minute walk distance (6MWD), physical exam findings, and current medications. If WHO FC was not assigned during the clinic visit, a single PH specialist (ZS) assigned a WHO FC in a blind fashion, if sufficient clinical information was available. Laboratory data closest to the times of the RHCs were extracted. In particular, B-type natriuretic peptide (BNP) values were recorded. Finally, for each patient, the most recent information regarding follow-up was recorded, including vital status, 6MWD, and WHO FC.
Hemodynamic variables
RHC performed by two PH experts (ZS and AF) at an outpatient catheterization laboratory were included. Hemodynamic information was obtained from end expiratory waveform analysis. Cardiac output was determined via thermodilution, using at least three readings within 10% of each other. Cardiac index (CI) was calculated based on height and body surface area. The PAC was defined as stroke volume (SV) divided by pulmonary pulse pressure (PP; PA systolic pressure minus PA diastolic pressure). Additional calculated parameters included the transpulmonary gradient (TPG; mPAP minus PCWP), diastolic pulmonary gradient (DPG; diastolic pulmonary artery pressure [DPAP] minus PCWP), pulmonary vascular resistance (PVR), right ventricular stroke work (RVSW; mPAP minus right atrial pressure multiplied by the stroke volume). The pulmonary artery pulsatility index (PAPi) was calculated as the pulse pressure divided by the right atrial pressure. 18
Statistical analysis
Demographic, clinical, hemodynamic, and laboratory data (including WHO FC and medications) were reported as median (interquartile range [IQR]) for continuous variables, and as frequencies and proportions for categorical variables. Correlations between PAC and hemodynamic variables were examined using Spearman correlation test. Box plots were used to describe the relationship between PAC and WHO FC. The percent change in PAC between serial RHC was calculated. Patient survival was presented by Kaplan–Meier curves. The difference in survival between the two groups of patients, those who had an increase in the PAC and those who had a decrease in the PAC over the study period, was compared using the log-rank test. Univariate and multivariate Cox proportional-hazards models were used to determine the contribution of potential risk factors to patient death or being transplanted versus being alive and not being transplanted. Mixed-effects logistic regression model was used to investigate the association between mortality or being transplanted and the change in PAC over time. Given multiple tests being done, multiple testing corrections were conducted using Simes method. 19 All analyses were performed on Stata version 13.1 (StataCorp LP, College Station, TX, USA). A P value < 0.05 was considered statistically significant.
Results
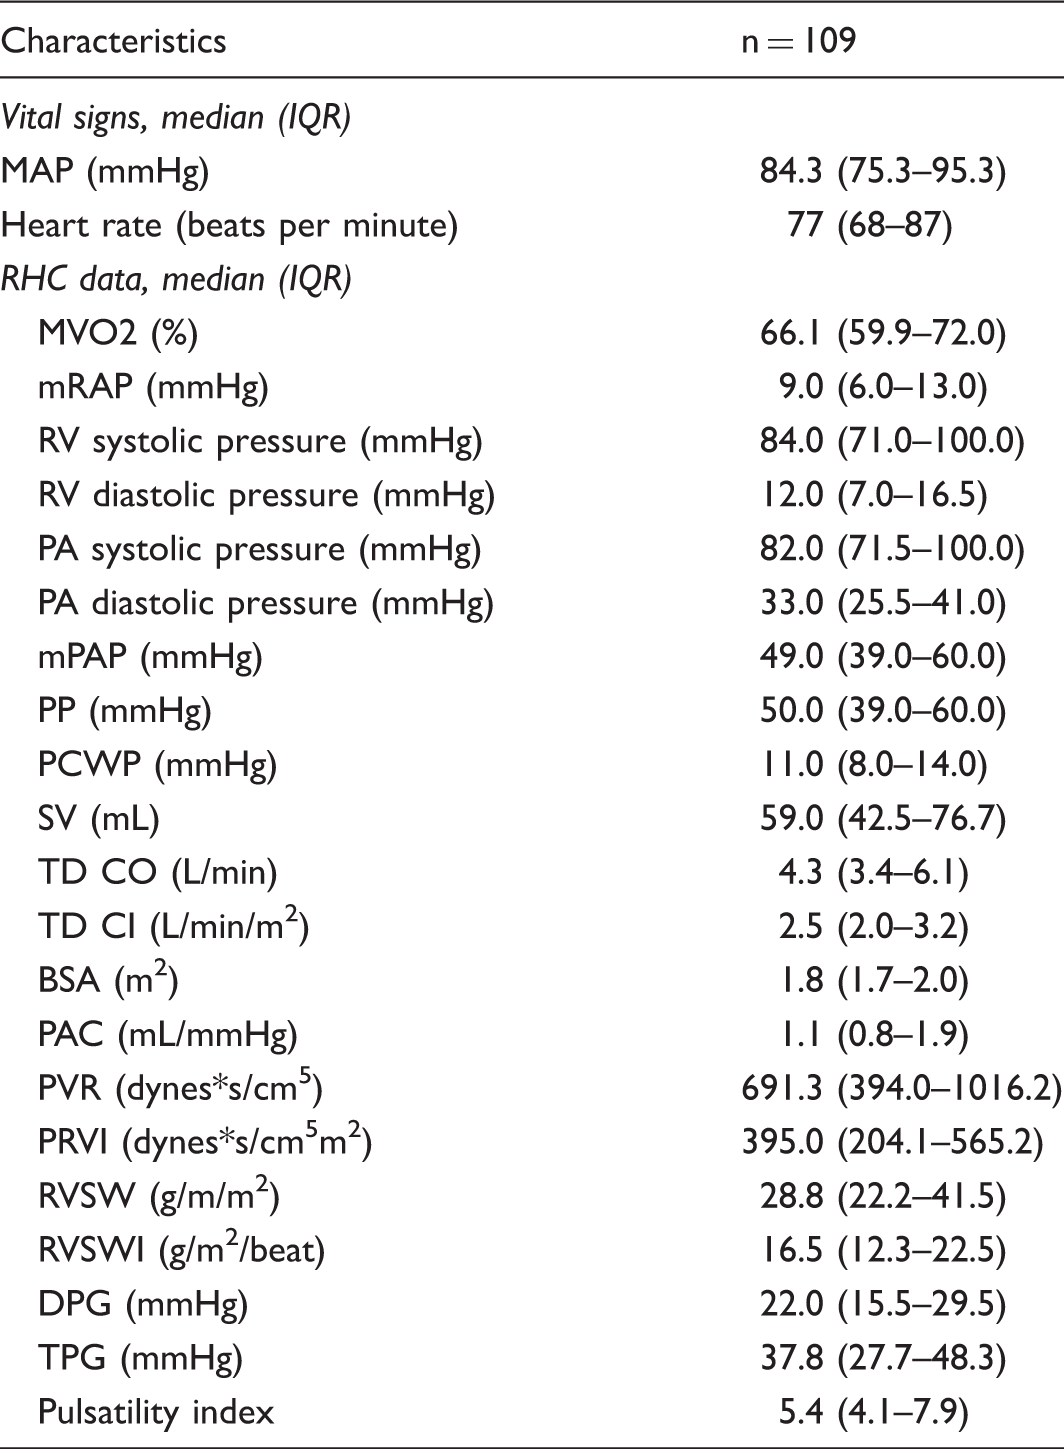
A total of 651 RHCs were reviewed: 333 had one RHC; 18 patients had WHO defined group 2, 3, 4, and 5 PH; and the remaining 109 patients were included in the analysis (Fig. 1). The mean number of RHCs was 2.7 per patient. The mean time between RHCs was 1.8 years (660 days). If a patient had more than two sequential RHC measures, data were collected for all time points and analysis was performed evaluating changes in parameters between sequential RHC (e.g. changes between the first and the second RHC, and then changes between the second and third RHC, etc.). The reason for performance of all subsequent RCHs was assessed: indications included 59.1% clinical worsening (including studies done to guide changes PAH-specific medications); 22.1% study protocol; 13.4% evaluation for liver transplant listing; and 5.4% other. The “other” category comprised various indications including evaluation prior to elective surgery, evaluation prior to heart/lung or lung transplant, and diagnostic uncertainty. Baseline clinical characteristics and laboratory data are outlined in Table 1. Note that 64% of patients were on PAH-specific medications at the time of initial RHC. Hemodynamic measurements are outlined in Table 2. A final outcome, namely vital status and whether or not transplantation was performed, was available for all patients.
Schema of patients included in the study. All outpatient RHC procedures performed by two PH specialists were screened for inclusion. Only patients with two or more RHCs over the study period were included for analysis. All patients met the hemodynamic definition of PAH with a mPAP ≥ 25 mmHg and PCWP ≤ 15 mmHg. Baseline patient characteristics. Numbers in parentheses are percentages unless otherwise indicated. BMI, body mass index; BNP, brain natriuretic peptide; ETRA, endothelin receptor antagonist; GFR, glomerular filtration rate; HIV, human immunodeficiency virus; INH, inhaled; IQR, interquartile range; i.v., intravenous; PAH, pulmonary arterial hypertension; PDE5-I, phosphodiesterase type 5 inhibitor; PG, prostaglandin; PO, per os; RHC, right heart catheterization; SC, subcutaneous; WHO, World Health Organization. Baseline hemodynamic data. Numbers in parenthesis are percentages unless otherwise indicated. BSA, body surface area; DPG, diastolic pulmonary vascular pressure gradient; IQR, interquartile range; MAP, mean arterial pressure; MVO2, mixed venous oxygen saturation; PA, pulmonary arterial; PAC, pulmonary arterial compliance; PADP, pulmonary artery diastolic pressure; PCWP, pulmonary capillary wedge pressure; PP, pulse pressure; PVR, pulmonary vascular resistance; PVRI, pulmonary vascular resistance index; RAP, right atrial pressure; RV, right ventricular; RVSW, right ventricular stroke work; RVSWI, right ventricular stroke work index; SV, stroke volume; TD CI, cardiac index by thermodilution; TD CO, cardiac output by thermodilution; TPG, transpulmonary gradient.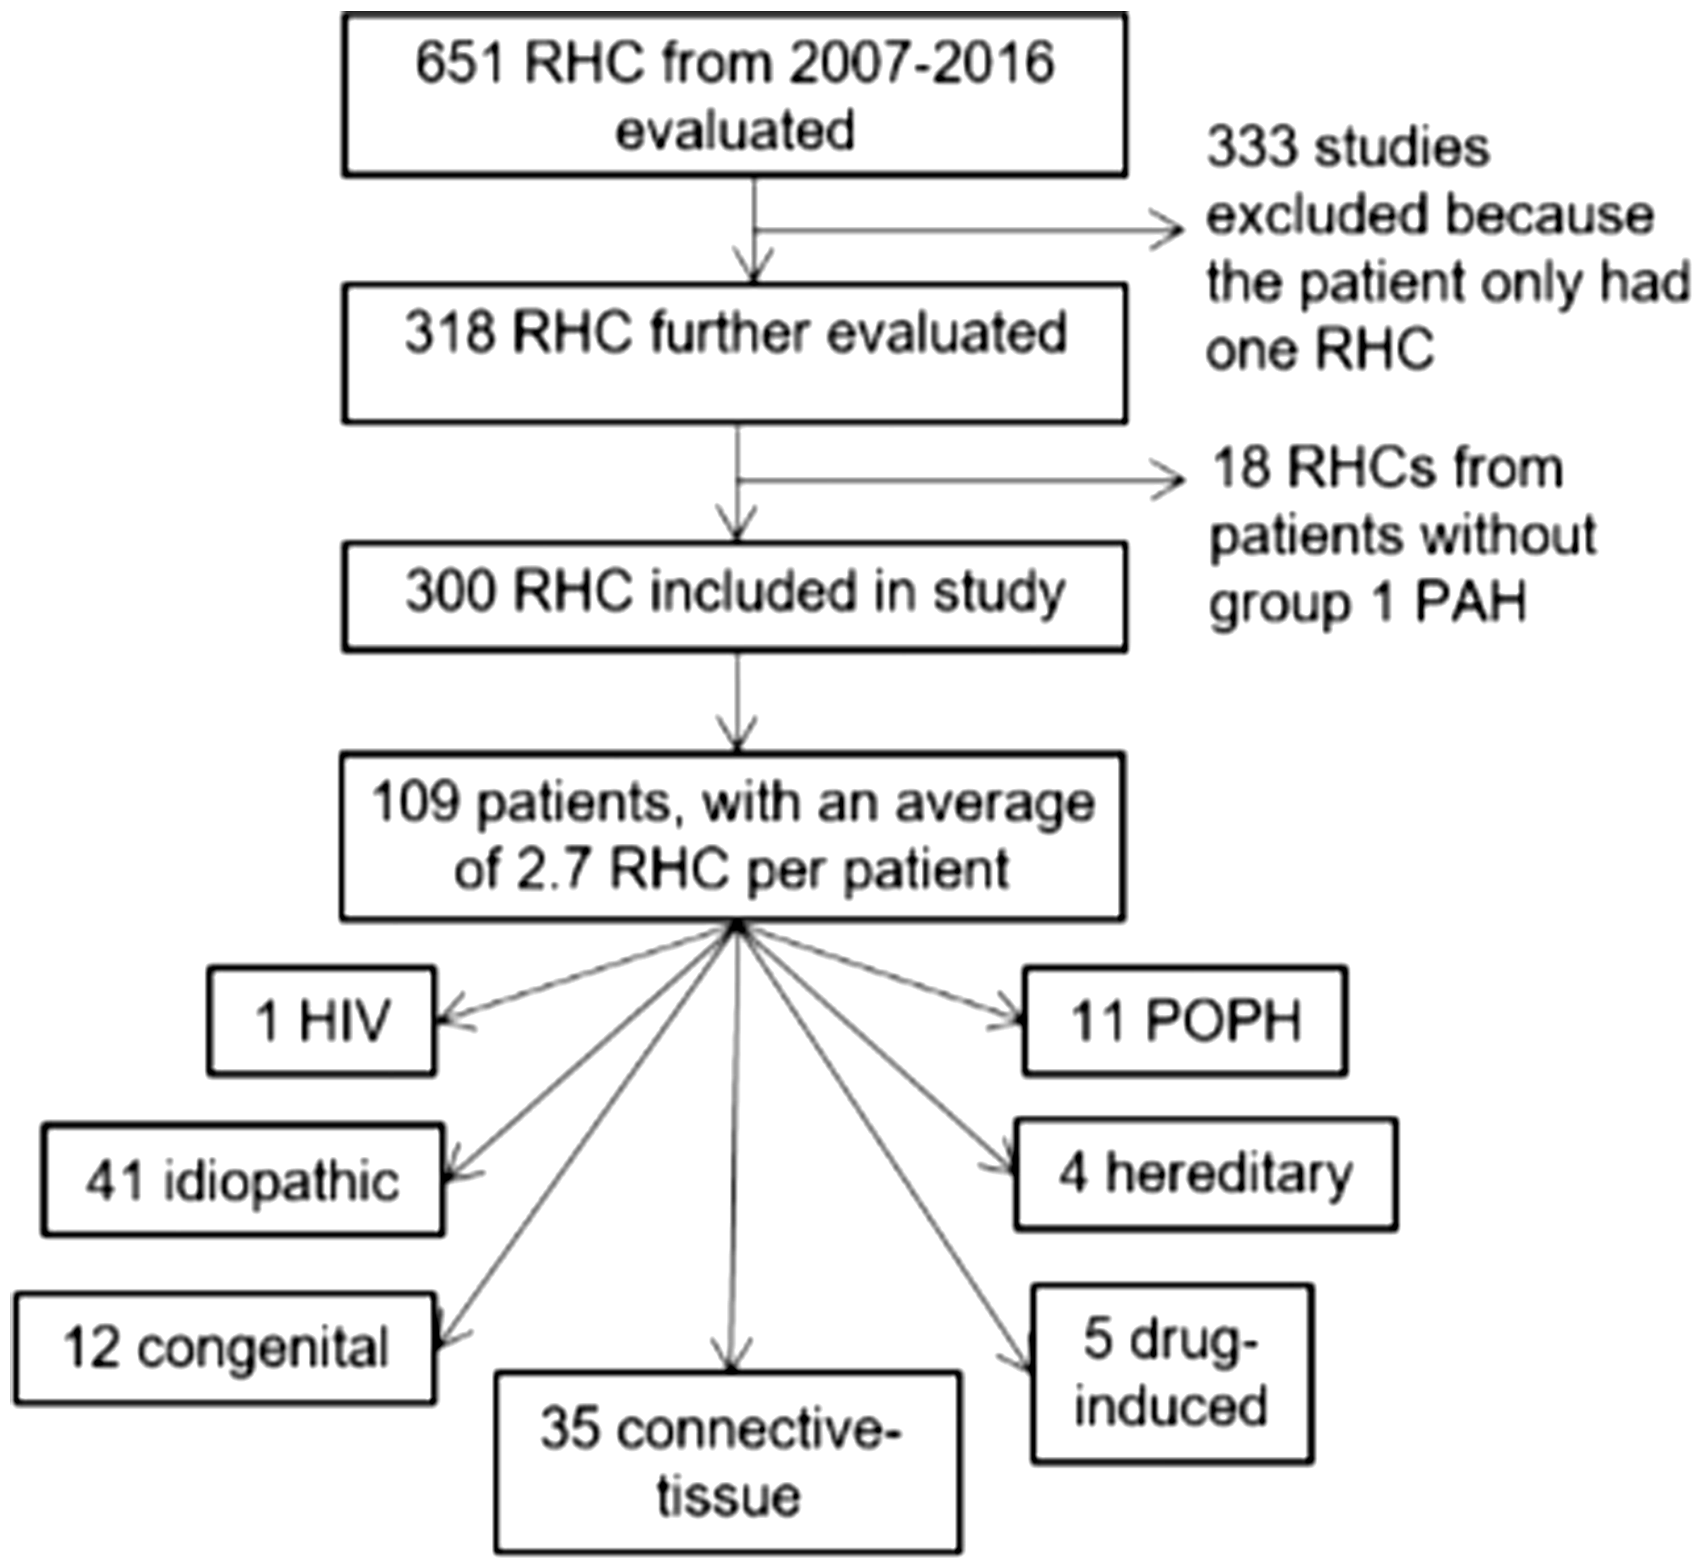

A number of correlations between the PAC and different clinical and hemodynamic data were found. The relationship between the WHO FC and PAC is shown in Fig. 2. The overall P value for PAC by WHO FC was significant (P < 0.001), suggesting patients with a lower FC had a higher PAC. With pair-wise comparisons, there were significant differences between classes 2 and 3, and between classes 2 and 4. The PAC showed a negative correlation with PVR based on the Spearman correlation (rho –0.767, P < 0.001).
Relationship between WHO FC and PAC. Results show that patients with a higher WHO FC tended to have lower PAC, The overall P value for PAC by WHO FC was significant (P < 0.001).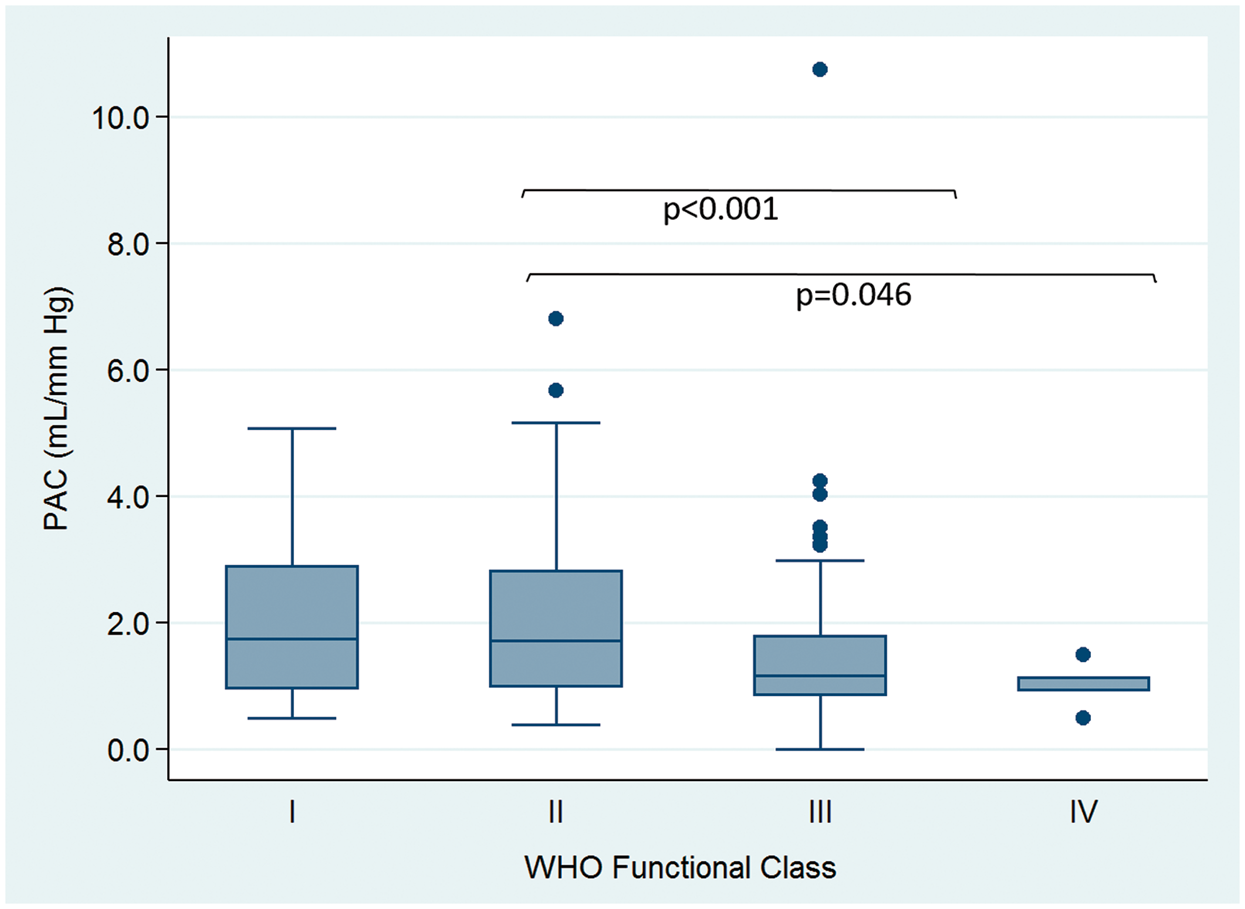
List of which medications were added, when patients had an escalation of their therapy between two serial RHCs.
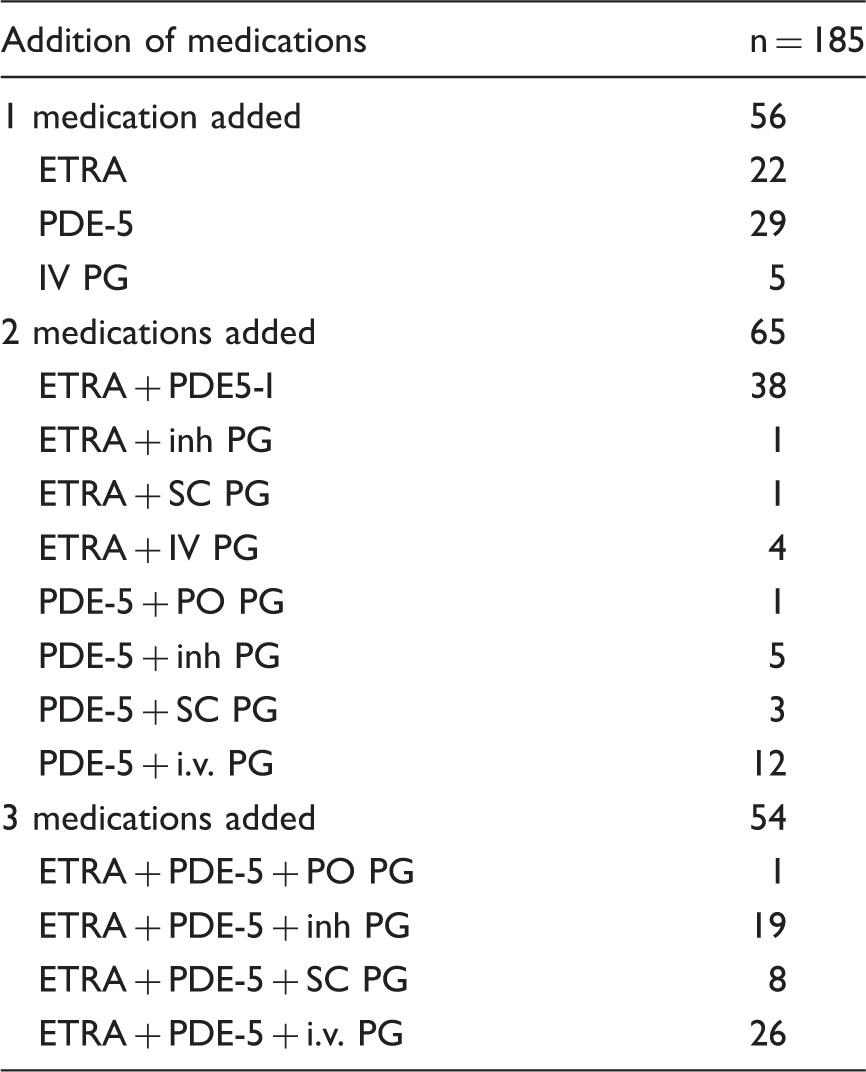
ETRA, endothelin receptor antagonist; i.v., intravenous; PDE5-I, phosphodiesterase type 5 inhibitor; PG, prostaglandin; PO, per os; SC, subcutaneous.
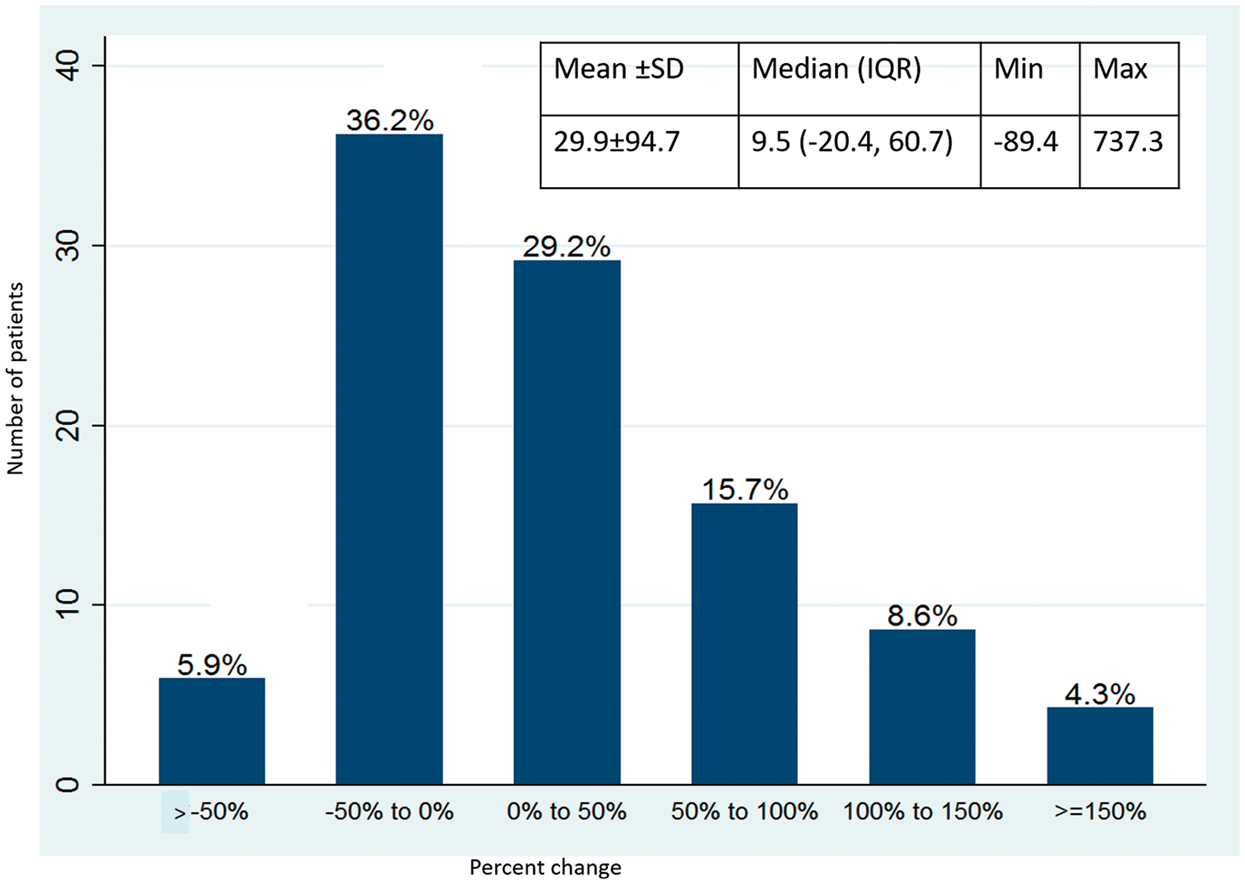
Percent change in PAC with the addition of a new medication.
Analysis was performed to see if changes in different parameters were predictive of mortality in terms of time to death or transplant. Patients were divided into two groups based on whether the PAC increased or decreased over the study period. There was a significant difference in mortality or transplantation between these groups using Kaplan–Meier survival analysis, with a log-rank test P value of 0.031 (Fig. 4). Using a similar strategy, the changes in PVR, CI, TPG, DPG, pulsatility index, BNP, and 6MWD were evaluated; however, the log-rank test value failed to reach significance for these values. Of note, the log-rank test P value for PVR was not significant (P = 0.508). Patients who experienced an increase in BNP over the study period had increased mortality (log-rank test P value of 0.051).
Kaplan–Meier survival curves for patients with an increase in PAC over the study period, as compared to those with a decrease in PAC.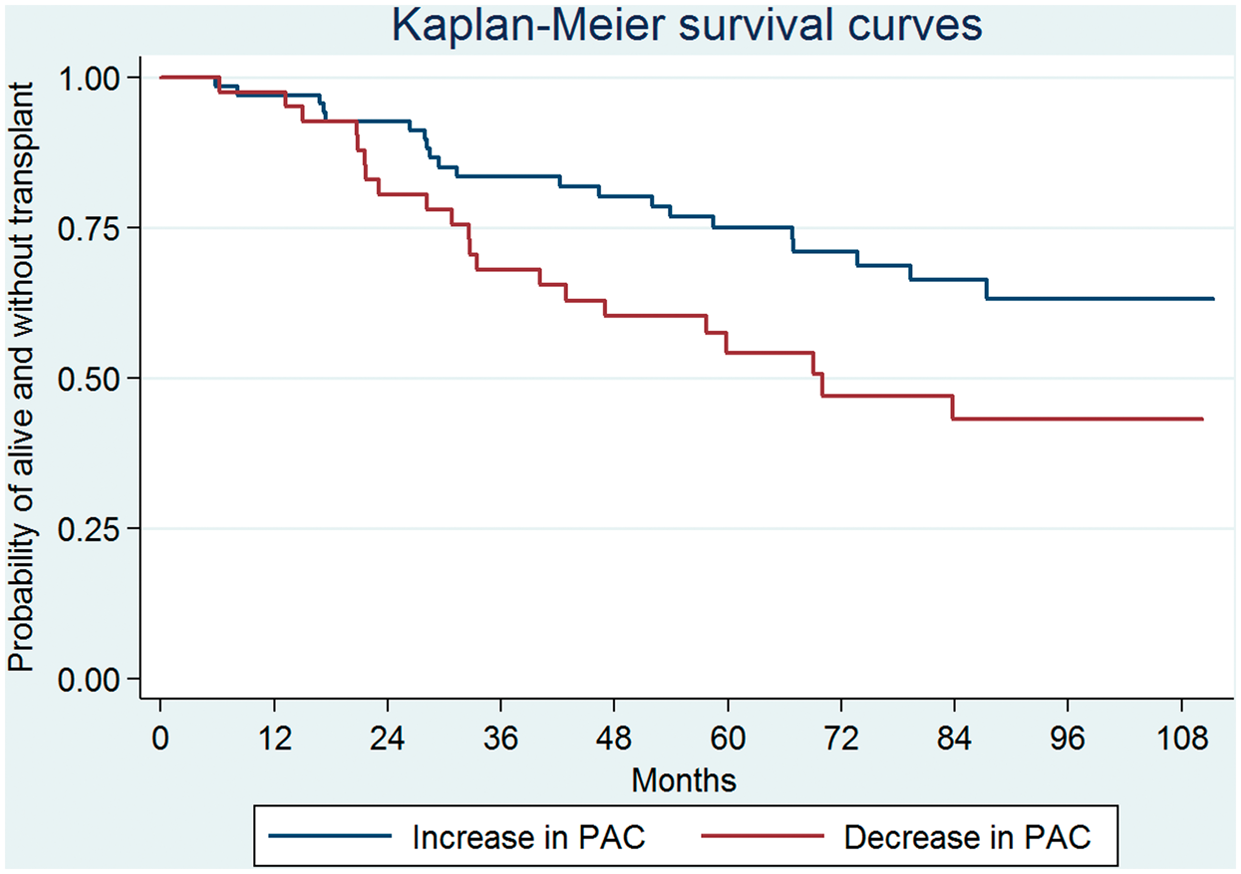
Multivariate Cox proportional hazards model.
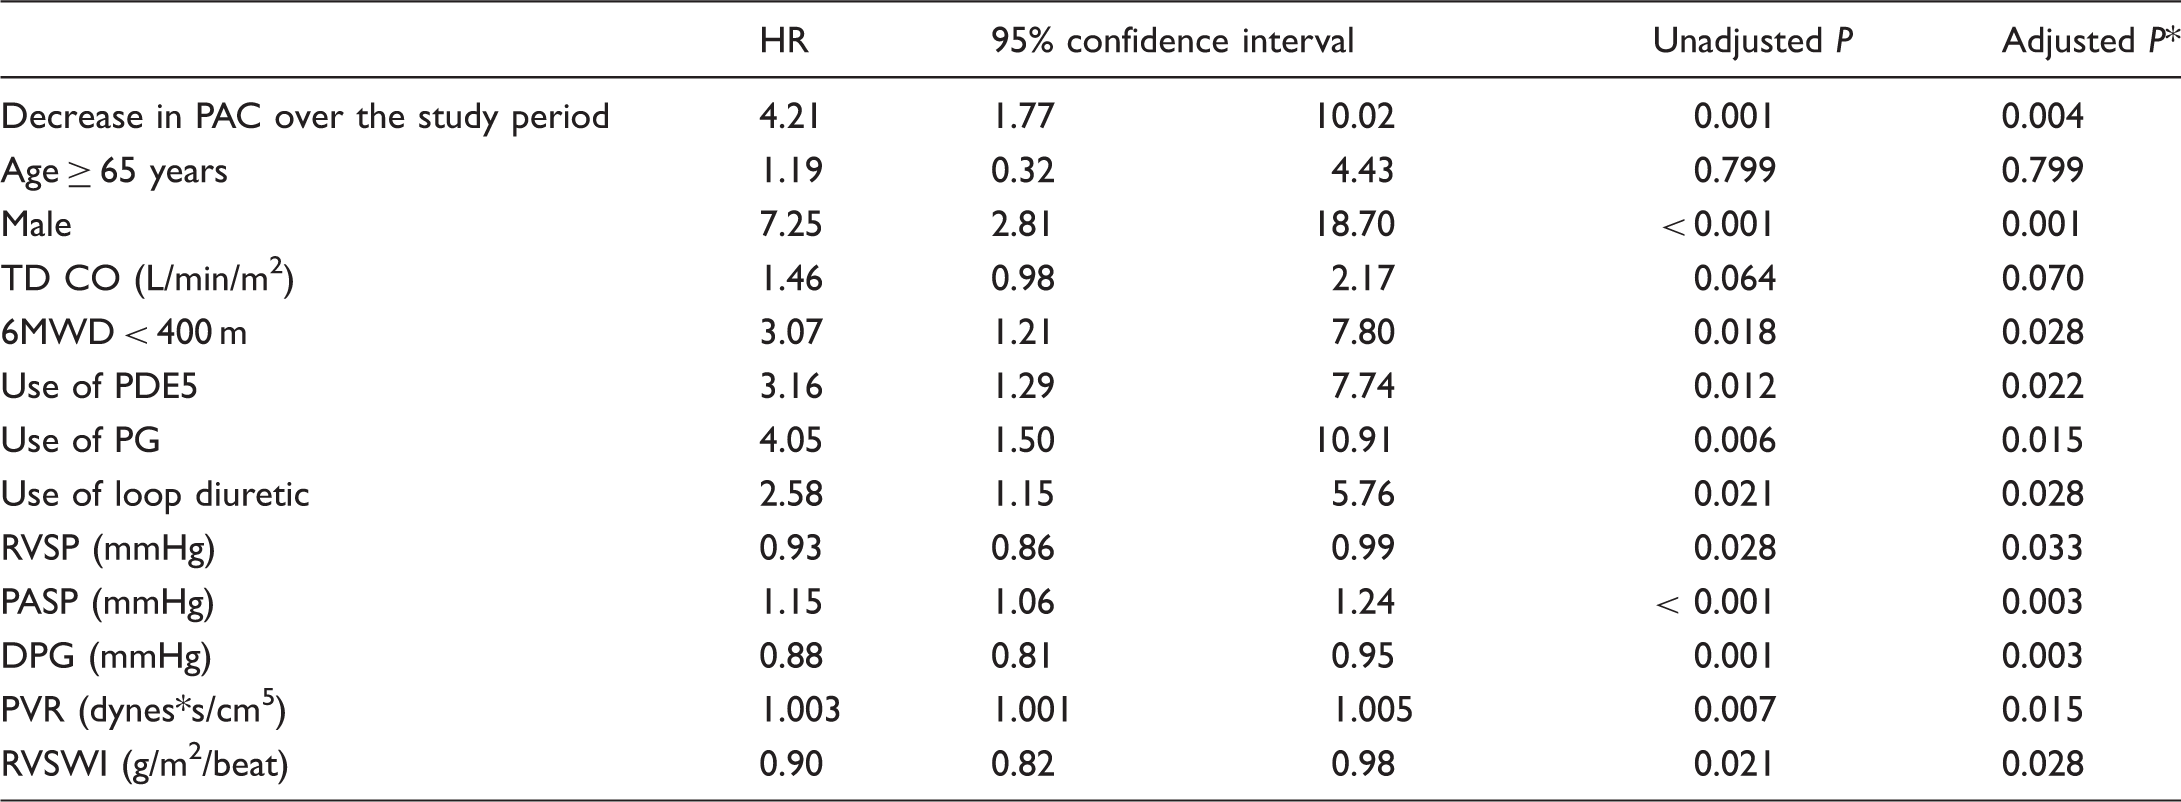
Factors which obtained statistical significance in the ability to predict the combined outcome of death or transplant are included.
Adjusted by multiple testing correction using Simes method.
6MWD, six-minute walk distance; DPG, diastolic pulmonary vascular pressure gradient; PAC, pulmonary arterial capacitance; PASP, pulmonary arterial systolic pressure; PDE5, phosphodiesterase-5 inhibitor; PG, prostaglandin; PVR, pulmonary vascular resistance; RVSP, right ventricular systolic pressure; RVSWI, right ventricular stroke work index; TD CO, cardiac output by thermodilution.
Mixed-effects logistic regression model.
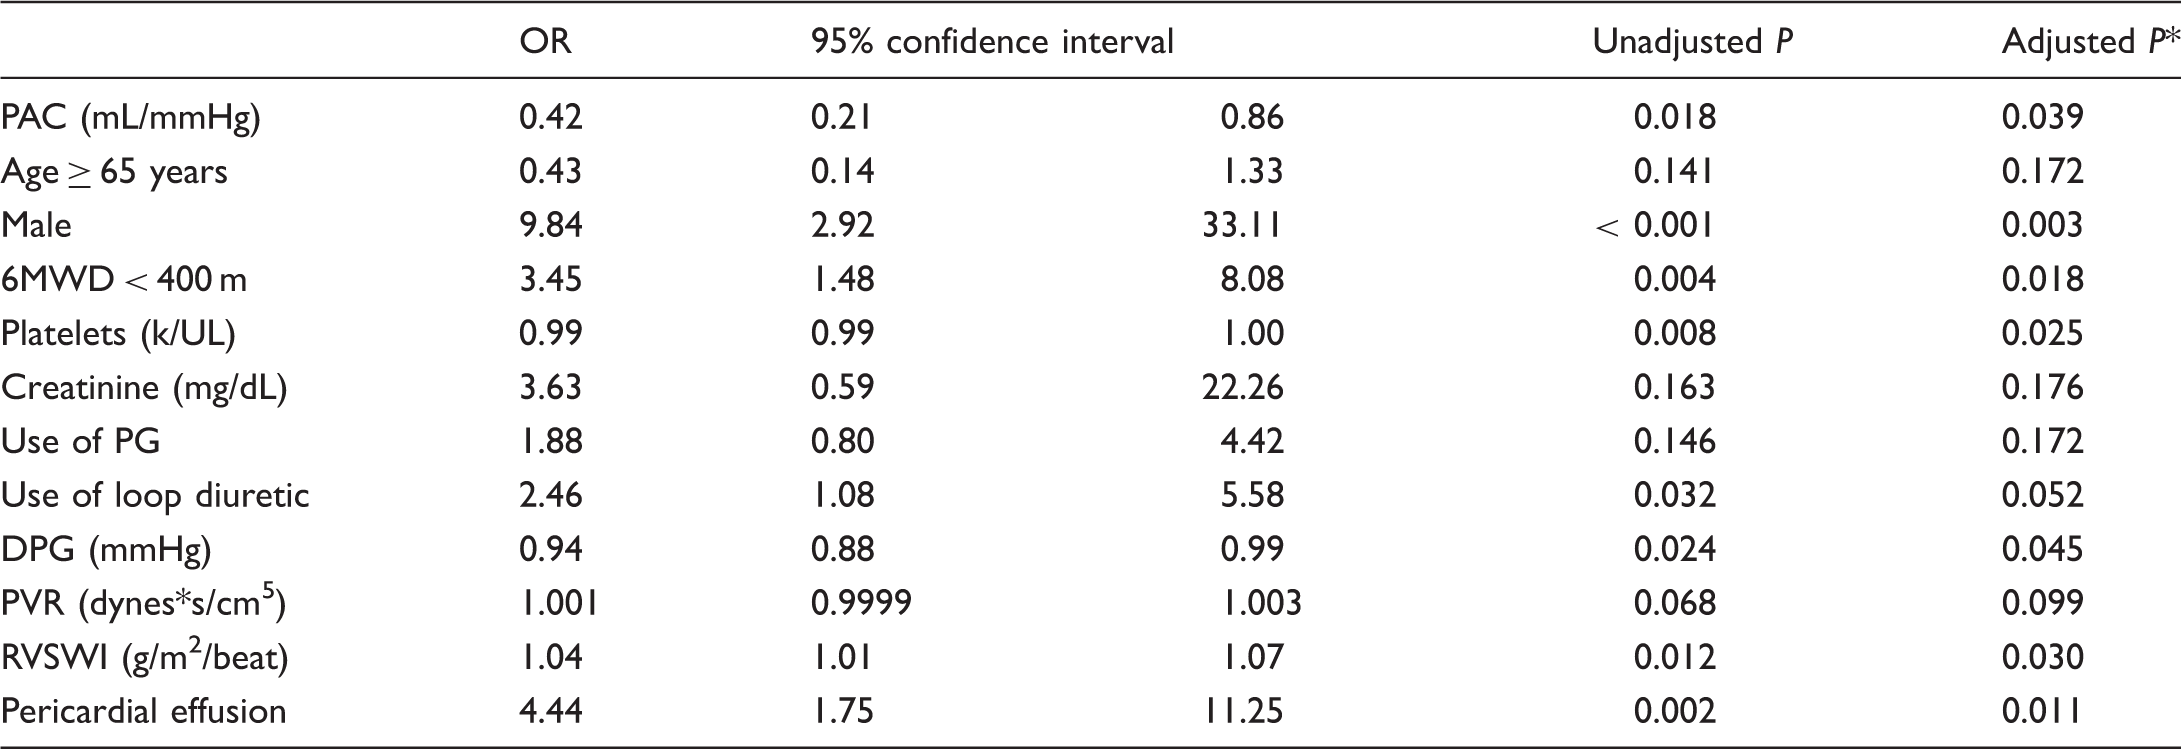
Analysis used longitudinal changes in various parameters to see if the change in the PAC over time was predictive of the combined outcome. Having a decrease in the PAC was associated with increased mortality or need for transplantation.
Adjusted by multiple testing correction using Simes method.
DPG, diastolic pulmonary vascular pressure gradient; PAC, pulmonary arterial capacitance; PG, prostaglandin; PVR, pulmonary vascular resistance; RVSWI, right ventricular stroke work index.
Discussion
Our study demonstrates that a decrease in the PAC over time was associated with an increased risk of death or lung transplantation. The change in PAC was a better predictor of outcome than baseline PAC or changes in other hemodynamic parameters including PVR, CI, and RVSWI. In addition, our assessment suggests that the PAC changes with the addition of PAH-specific medications. Our study population included patients with a mPAP ≥ 25 mmHg, which differs from another study using a cutoff > 40. 9 PAC was prognostically relevant throughout a range of PAH severity.
Based on our findings, using the PAC as a marker to evaluate the response to therapy in PAH appears promising. We showed that PAH patients who had a decrease in PAC had improved outcomes, and also that the addition of a PAH-specific medication tended to have a favorable effect on this value. Examining parameters of pulmonary arterial vascular stiffness to evaluate response to therapy has a solid pathophysiologic basis. Increased stiffness of the proximal PA increases the right ventricular (RV) afterload. Having increased stiffness of the PA also augments the vessel’s pulsatility: some research suggests that this increase in flow pulsatility also causes additional strain on the right ventricle. Moreover, this increased pulsatility is transmitted to the distal pulmonary vessels, which could induce endothelial dysfunction and lead to increased vasoconstriction. 6 In sum, increased pulmonary stiffness could work via multiple pathways to increase the load on the RV. Studies have investigated this link between PAC and RV function in humans. Using cardiac magnetic resonance imaging (CMRI), researchers correlated PA stiffness with measures of RV performance, both in patients with PAH 20 and in normal patients. 21 RV function is critically important to outcomes in PAH: markers of poor RV function have been shown to be poor prognostic indicators based on registry data.4,5 Even in otherwise healthy patients, poor RV function correlates with death. 22
Some studies have evaluated PAC changes with the administration of PAH-specific medications. One small study suggested that it increased with prostanoids, but not with oral therapies. 23 This is in line with the results of our study, which showed that, on the whole, PAC improved with the addition of PAH-specific medications. Another study evaluated the changes in a number of different parameters after treatment with 3–12 months of PAH therapy; although it found that changes in CI were predictive of mortality, it did not find that changes in PAC were significant. 24 Different results in our study could be due to the longer length of follow-up and/or the differences in pattern of medication administration: in the other study, baseline hemodynamics were done at diagnosis of PAH while patients were naïve to therapy, whereas many of our patients were already on therapy at the time of study initiation. Another study evaluated pooled hemodynamics from four randomized controlled trials and evaluated the change in hemodynamics after 12 weeks of therapy; it found that the changes in these parameters were not sufficient enough to explain the differences in clinical events with the intervention and control arms. This study included the PAC and showed that this did increase with active intervention. 25 It is possible that this analysis, given the relatively short study length, cannot be extrapolated to longer-term therapy.
In prior clinical practice and in other studies, PVR has been used to direct therapeutic interventions. Prior studies have shown that PVR does change with therapy, 25 and that a lack of fall in the PVR after three months of epoprostenol administration is predictive of mortality. 26 However, the use of this measurement has been questioned. A CMRI study evaluating parameters including right heart function, proximal PA stiffness, and PVR showed that the RV function could deteriorate despite a reduction in PVR. 27 Thus PVR, which primarily comprises the resistance provided from small vessels in the pulmonary vasculature, might not encompass a significant enough portion of the strain placed on the RV to make it as important a parameter as proximal arterial stiffness. 6 The PAC, in contrast, is more representative of the coupling between the pulmonary vasculature and the RV. This was borne out in our study, which showed that changes in PAC and not PVR was predictive of mortality.
Another explanation for why PAC might have outperformed PVR in our study stems from the relationship between PAC and PVR. In our analysis, we found PAC and PVR to be related: as described in prior work and in our analysis, this relationship was an inverse hyperbolic one.12,28–31 Patients with severe PAH and elevated PVR would be on a relatively flat part of the slope of the inverse hyperbolic PVR versus PAC relationship: in them, having a reduction in PVR could be associated with only small changes in PAC. These patients could be less equipped to deal with RV pulsatility since their capacitance was not significantly augmented. 28 It points to the PVR as an insensitive marker for evaluating clinically meaningful changes in patients with advanced PH. Although some recent work has suggested that the relationship between PVR and PAC could change according to different disease states, in these studies the PVR versus PAC curve is shifted, but maintains the same inverse hyperbolic relationship.30,32,33 It is possible that despite initial findings suggesting that the relationship between PVR and PAC remains constant over the course of treatment of PAH, 29 that in fact it could shift. This could introduce an element of uncertainty regarding the relative prognostic capabilities of PAC and PVR.
Although the gold standard for measuring PA compliance remains an invasive hemodynamic measurement, as was performed in our study, a number of other modalities have also been evaluated as methods to measure the PA compliance parameter. 34 Early work evaluated the pulmonary vasculature pulsatility and strain as measured by intravascular ultrasound, and found that there was a good correlation between these findings and hemodynamic measurements of PA compliance by RHC; they even found a mortality difference in patients with reduced pulsatility in the pulmonary artery. 11 The pulmonary artery capacitance as measured by non-invasive Doppler echocardiography correlated with RHC data, and was also a predictor of mortality. This modality, however, was limited because it relied on measuring the pulmonary regurgitant jet, which was only obtained in 60% of patients assessed. 35 Using Doppler tissue-wave echocardiography was successful in obtaining data from a larger fraction of patients, but relied on measurement of the tricuspid regurgitant jet. 36 Other modalities including computed tomography scanning and cine-angiography have been utilized, but with less success. 34
Results from CMRI have provided important information about PA stiffness, and this modality is perhaps the most promising non-invasive method of evaluating PAC. Studies using this technology have confirmed data from hemodynamic assessment, including the correlation of PA stiffness and mortality. 10 A subsequent study looking at same-day CMRI and RHC showed good correlation between the two methodologies. Importantly, it found a curvilinear relationship between CMRI measures of PA stiffness and systolic PA pressures, suggesting that the PA stiffness could be an early marker of developing PH. 37 CMRI-derived markers of stiffness have also been shown to correlated with functional capacity. 38 Although cardiac MRI is limited in terms of its cost and availability, it could offer a non-invasive alternative to hemodynamic assessments of the PA stiffness. This modality is also beneficial because it can quantitate markers of right heart dysfunction which are also prognostic in PAH.39-42
There are a few limitations of this study. The study was a retrospective review of data from sequential RHCs over a nine-year period. The indications for sequential RHC varied and were at the discretion of the PH physician and reasons for performing the test included clinical worsening, research study protocols, need for escalation of therapy, or pre-transplant evaluation. Although an assessment was performed to evaluate the change in PAC with the addition of PAH-specific medications, the change in medications was done at the discretion of the PAH specialist and was not performed in a controlled fashion. Clinical parameters other than the prescribed medications may have changed as well. Patients were excluded from analysis if they did not have two RHCs, so patients who worsened and died before obtaining a second RHC were excluded from analysis; this produces a survival bias in the patients evaluated. Although the majority of patients had subsequent RHC for clinical worsening or for titration of medications, overall the indications were heterogeneous.
Conclusions
Changes in PAC as measured by RHC were predictive of mortality in a heterogenous group of patients with WHO group 1 PAH. This hemodynamic parameter tends to increase with the addition of a new PAH-specific medication. Using the PAC as a therapeutic target in PAH has a physiologic basis due to the effect it has on RV workload; some data even suggest that early changes in PAC could precede measurable changes in RV function. Although in our study the PAC was measured using RHC, promising work suggests that CMRI can also accurately assess this parameter. While more work is needed, our data support the role of PAC as a therapeutic target in in patients with group 1 PAH.