Abstract
Drawing on the story of Aginic and its educational analytics platform edPortal, this teaching case study examines how applying agile methods and design thinking to analytics has helped unlock significant value for Aginic, its clients and the education sector overall. It describes key factors driving the successful integration of agile values and design approaches, allowing students to gain a deep understanding on how such integration can facilitate the development of innovative data analytics products.
Keywords
Setting the stage
‘Analytics is a discovery process, and discovery is naturally agile’ (Brett Thebault, Aginic Co-Founder)
In 2014, Brett Thebault and Marty Conneely, who had helmed a multinational consulting firm’s analytics division for over 3 years embarked on a new journey. The two had witnessed first-hand how the old ways of creating analytics solutions failed to meet decision-makers’ needs: the outputs were either too complex for real-world use or unable to shed light on the best course of action. After seeing large corporations wade through lengthy back-end processes of data extraction and transformation rather than focussing on their users and their needs to make sound decisions and competitive actions, the pair founded Aginic (for ‘Agile Analytics’) to address the deep-rooted problems in the analytics industry.
Fired by their passion to build agile and innovative approaches to harvesting value from data, they set out to build an analytics practice that itself showcased agility. The early years of their Brisbane, Australia, start-up focused on designing customer-facing processes that deliver value continuously from early on. For this, Thebault and Conneely attempted to steer clear of any particular type of solution or enabling technology – at the heart of their approach was the ‘how’ of developing high-value analytics solutions. They sought a flexible development approach, for putting users first and adapting to their needs in quick iterations. An agile approach was the perfect fit.
In the early years, Aginic’s focus was on analytics solutions that helped with performance improvements in areas such as health care. The founders quickly learned that Aginic had to turn to and focus on increasing analytics usage over time as a measure of their success. Increasing analytics usage required a product-development mindset: they strove for building exploratory interfaces that users genuinely enjoy. Experimenting with various approaches to meshing their technical analytics skills with creativity and user-centred approaches, they quickly saw positive results, as Thebault emphasised: ‘When we started Aginic, neither Marty nor myself were very good at making things look good, but we had a few folks who helped us with some of the creative content and to shift stuff around on a dashboard, and suddenly we saw the uptake.’
Merging agile capabilities with user-centred design approaches helped them carve out a distinct value proposition. While it still took discipline and persistence to actualise the founders’ vision, Aginic ultimately expanded to much larger markets, organically extending operations to Melbourne and Sydney. In 8 years, the company has grown to boast 130+ employees across Australia, and established a leading position in the domestic data analytics industry. It is known for building analytics solutions aimed at ‘Transforming the way people experience data’ (Aginic, 2022), and was identified as a top employer by Australian Financial Review (Best Places to Work, 2022). Seeking to increase their impact on the data industry, in August 2022, Aginic joined forces with Mantel Group, an award-winning technology consultancy group specialised in digital, data and, security and cloud solutions (Mantel Group, 2023). This is allowing Aginic to complement their design and agile capabilities with deep expertise in other areas to deliver end-to-end solutions at scale.
Building analytics solutions at Aginic
Embracing agile values
Seeking expertise in shaping companies’ values to follow principles of agile thinking, the founders called in Thebault’s long-time colleague James Hayes, a global ‘Agile coach’ and seasoned scrum master. Initially brought on as Aginic’s director of Agile Delivery, Hayes is Aginic’s CEO today. He knew from experience that the main difficulty with end users’ commitment to analytics projects is their unfamiliarity with the data and with what insights might lie buried within. Finding it vital to consider the user perspective from the outset, they used the agile approach to capture feedback, explore the data alongside users and co-create the analytics solutions from the start. This too involved awareness of cycles, as Hayes pointed out: ‘It’s very hard to articulate up front what you expect of the data until you start to see some results. And so, by its nature, it’s a feedback loop, and what you need there, therefore, is a set of principles for guiding those feedback loops’.
Close interaction in continuous iterations helped shift users from initially abstract, generic questions. Soon sensing how analytics could benefit them, they engaged in the process enthusiastically. Users’ focus systematically sharpened as data exploration progressed.
Also, Aginic’s managers knew they had to implement agile approaches successfully across multiple projects. While agile thinking can be implemented in a myriad of ways, they found that the key lay in making sure all workforce fully embraced Agile values. 1 Practice had shown Hayes that these are more crucial than any particular method: ‘the point is the values and principles. You kind of change those methods and frameworks as you need […]. A lot of people don’t know that, and they get hung up on the methods, they get hung up on the frameworks, or they outright don’t believe in some of those values’.
Therefore, rather than formulate strict, detailed project plans, the managers opted to cater for the entire organisation’s needs via a disciplined approach focused on technical practices. Hayes explained: ‘You’ve got to have the underlying discipline in the work. And a lot of that does come down to also sorts of technical practices. So you have to build things well; you have to have well-architected solutions. You have to test really well. You have to write automated tests if you possibly can do. You have to do continuous integration if you possibly can’.
Commitment, the right mindset and discipline do not guarantee that an agile tack to analytics development and delivery will be smooth sailing. One important factor Aginic’s founders pinpointed is the need to break a complex business problem into smaller pieces – a crucial task that tends to get short shrift – ‘the absolute beating heart of agile thinking is figuring out how you’re going to chop up a really big, complex project into increments. The single most important conversation you’re going to have about that project is what that first increment is. And it’s really hard, and people underestimate that all the time’ (Hayes).
Inertia is another bugbear the leaders recognised. They encouraged all employees to grow comfortable with continuous change. Hayes stressed: ‘If you outright really struggle with responding to change over following a plan, you’re going to have a hard time with Agile because all of those methods are designed around the idea of responding to change. So, if you are in a place where you don’t want to do that, then maybe Agile’s not going to work’. These remarks again highlight that the agile approach is one tool among many, not a panacea.
Though agile thinking helped Aginic focus on swift, early delivery of value, the leaders still felt that it takes more to guarantee user-pleasing analytics solutions that solve users’ and business problems.
Integrating the work of creatives
For Thebault and Conneely to solve long-standing problems in the analytics industry via solutions that get pervasively used, they needed the right crew. They concluded that hiring and integrating creative people who specialise in design-thinking approaches could help address the problem. Among the first ‘creatives’ brought aboard was Emma Freya. Alongside the management team and others, she had detected design practices’ potential for unpacking user needs to shed light on business problems, a critical task in analytics development. Freya, now Senior DesignOps Manager at Aginic, was tasked with building a capability around design thinking. One of the first projects was a solution to monitor students and schools’ performance for the Department of Education (DoE)
2
– the edPortal project. Through it, she and the team established design-thinking practices in Aginic that facilitate creative problem-solving by exploring users’ needs and pain points, while also gathering feedback on the work in progress. She explained the approach thus: ‘Design is about problem-solving. We don’t go straight to the solution. We understand a business problem, try to set a goal and vision for where we want to go, then really unpacking the user needs and their pain points, and marry them with the business problem when problem-solving’.
Freya and her team uncovered several elements that make design thinking the perfect complement to agile analytics development. By helping to integrate ideas that represent a diverse group’s points of views, the process inspires more creative solutions in the end. In particular, ‘when we get to the ideation part of the project, we get everyone to sketch and then we get everyone’s ideas together and we vote on them’. She highlights the interactivity brought by design thinking also helps render the analytics solutions customisable for each user group and thus improving users’ experience of exploring the data: ‘It’s interactive. You can click through, and the focus is around what type of user this is. The way we design is to have that in mind, making sure that, depending on the user and what they need, the user experience is customised and easily accessible’. In addition, design-based processes fit well with agile thinking in that they are flexible in nature: techniques are chosen with the client and users in mind, and this leads to more personalised engagement. As Freya stated, ‘every engagement is different, so, depending on what it is we deliver, we might have different types of artefacts’. 3
These different types of artefacts and tools vary across each activity comprising the design process. Inspired by the Stanford Design School’s five components of design thinking (Stanford University, 2023), Aginic practices a design process with the following steps: Define the vision; understand people and processes; define user opportunities; ideate better experiences; prototype/build solution increment and test the solution. Descriptions of the activities comprising each step are presented in the Appendices section, as well as a collection of design artefacts and visual aids used for the development of edPortal. Each activity requires either divergent thinking (emphasising discovery and exploration), or convergent thinking (emphasising focused action). The tools used in each activity facilitate these modes of thinking (Ball, 2019). For instance, to support the ‘understanding people and process’ activity, Aginic uses stakeholder and empathy mapping – methods that facilitate exploration, while to support the ‘test the solution’ activity, Aginic uses low/high-fidelity prototyping and user testing – methods that facilitate focused action.
Assembling expertise via the one team structure
A key question facing Aginic ever since its launch has been how to structure the company simultaneously for top-notch service and with an eye toward growth. To implement its dual focus on design and agile practices in each analytics project, the company needed not just the right mindset but a team structure expressing the value proposition that sets Aginic apart from competitors. This has entailed years of tuning the ‘One Team’ approach, in which teams are organised to bring together diverse skillsets in work alongside the client as a single cohesive unit. With this structure and mentality, all team members explore, learn and make decisions together along the path to delivering the final analytics product.
To draw on the power of cross-function teamwork, Thebault and Conneely established ‘squads’ that mix together employees from four ‘chapters’ – Design, Analytics, Agile Delivery and Engineering. The chapters provide nurture to key capabilities (e.g. for design-based and agile thinking), while the squads are tight-knit groups within which the varied team members look after each other more closely and share experiences and lessons. Team of teams completes the One Team picture with the client’s staff. The ‘teams of teams’ approach allows to operate as a constellation of teams that come together around specific projects, integrating members from the multiple capability areas across Aginic and across Mantel Group as needed. Figure 1 illustrates this organisational structure. Aginic’s working architecture for analytics delivery, showing how the One Team approach connects with the chapter, squad, and team of teams’ levels.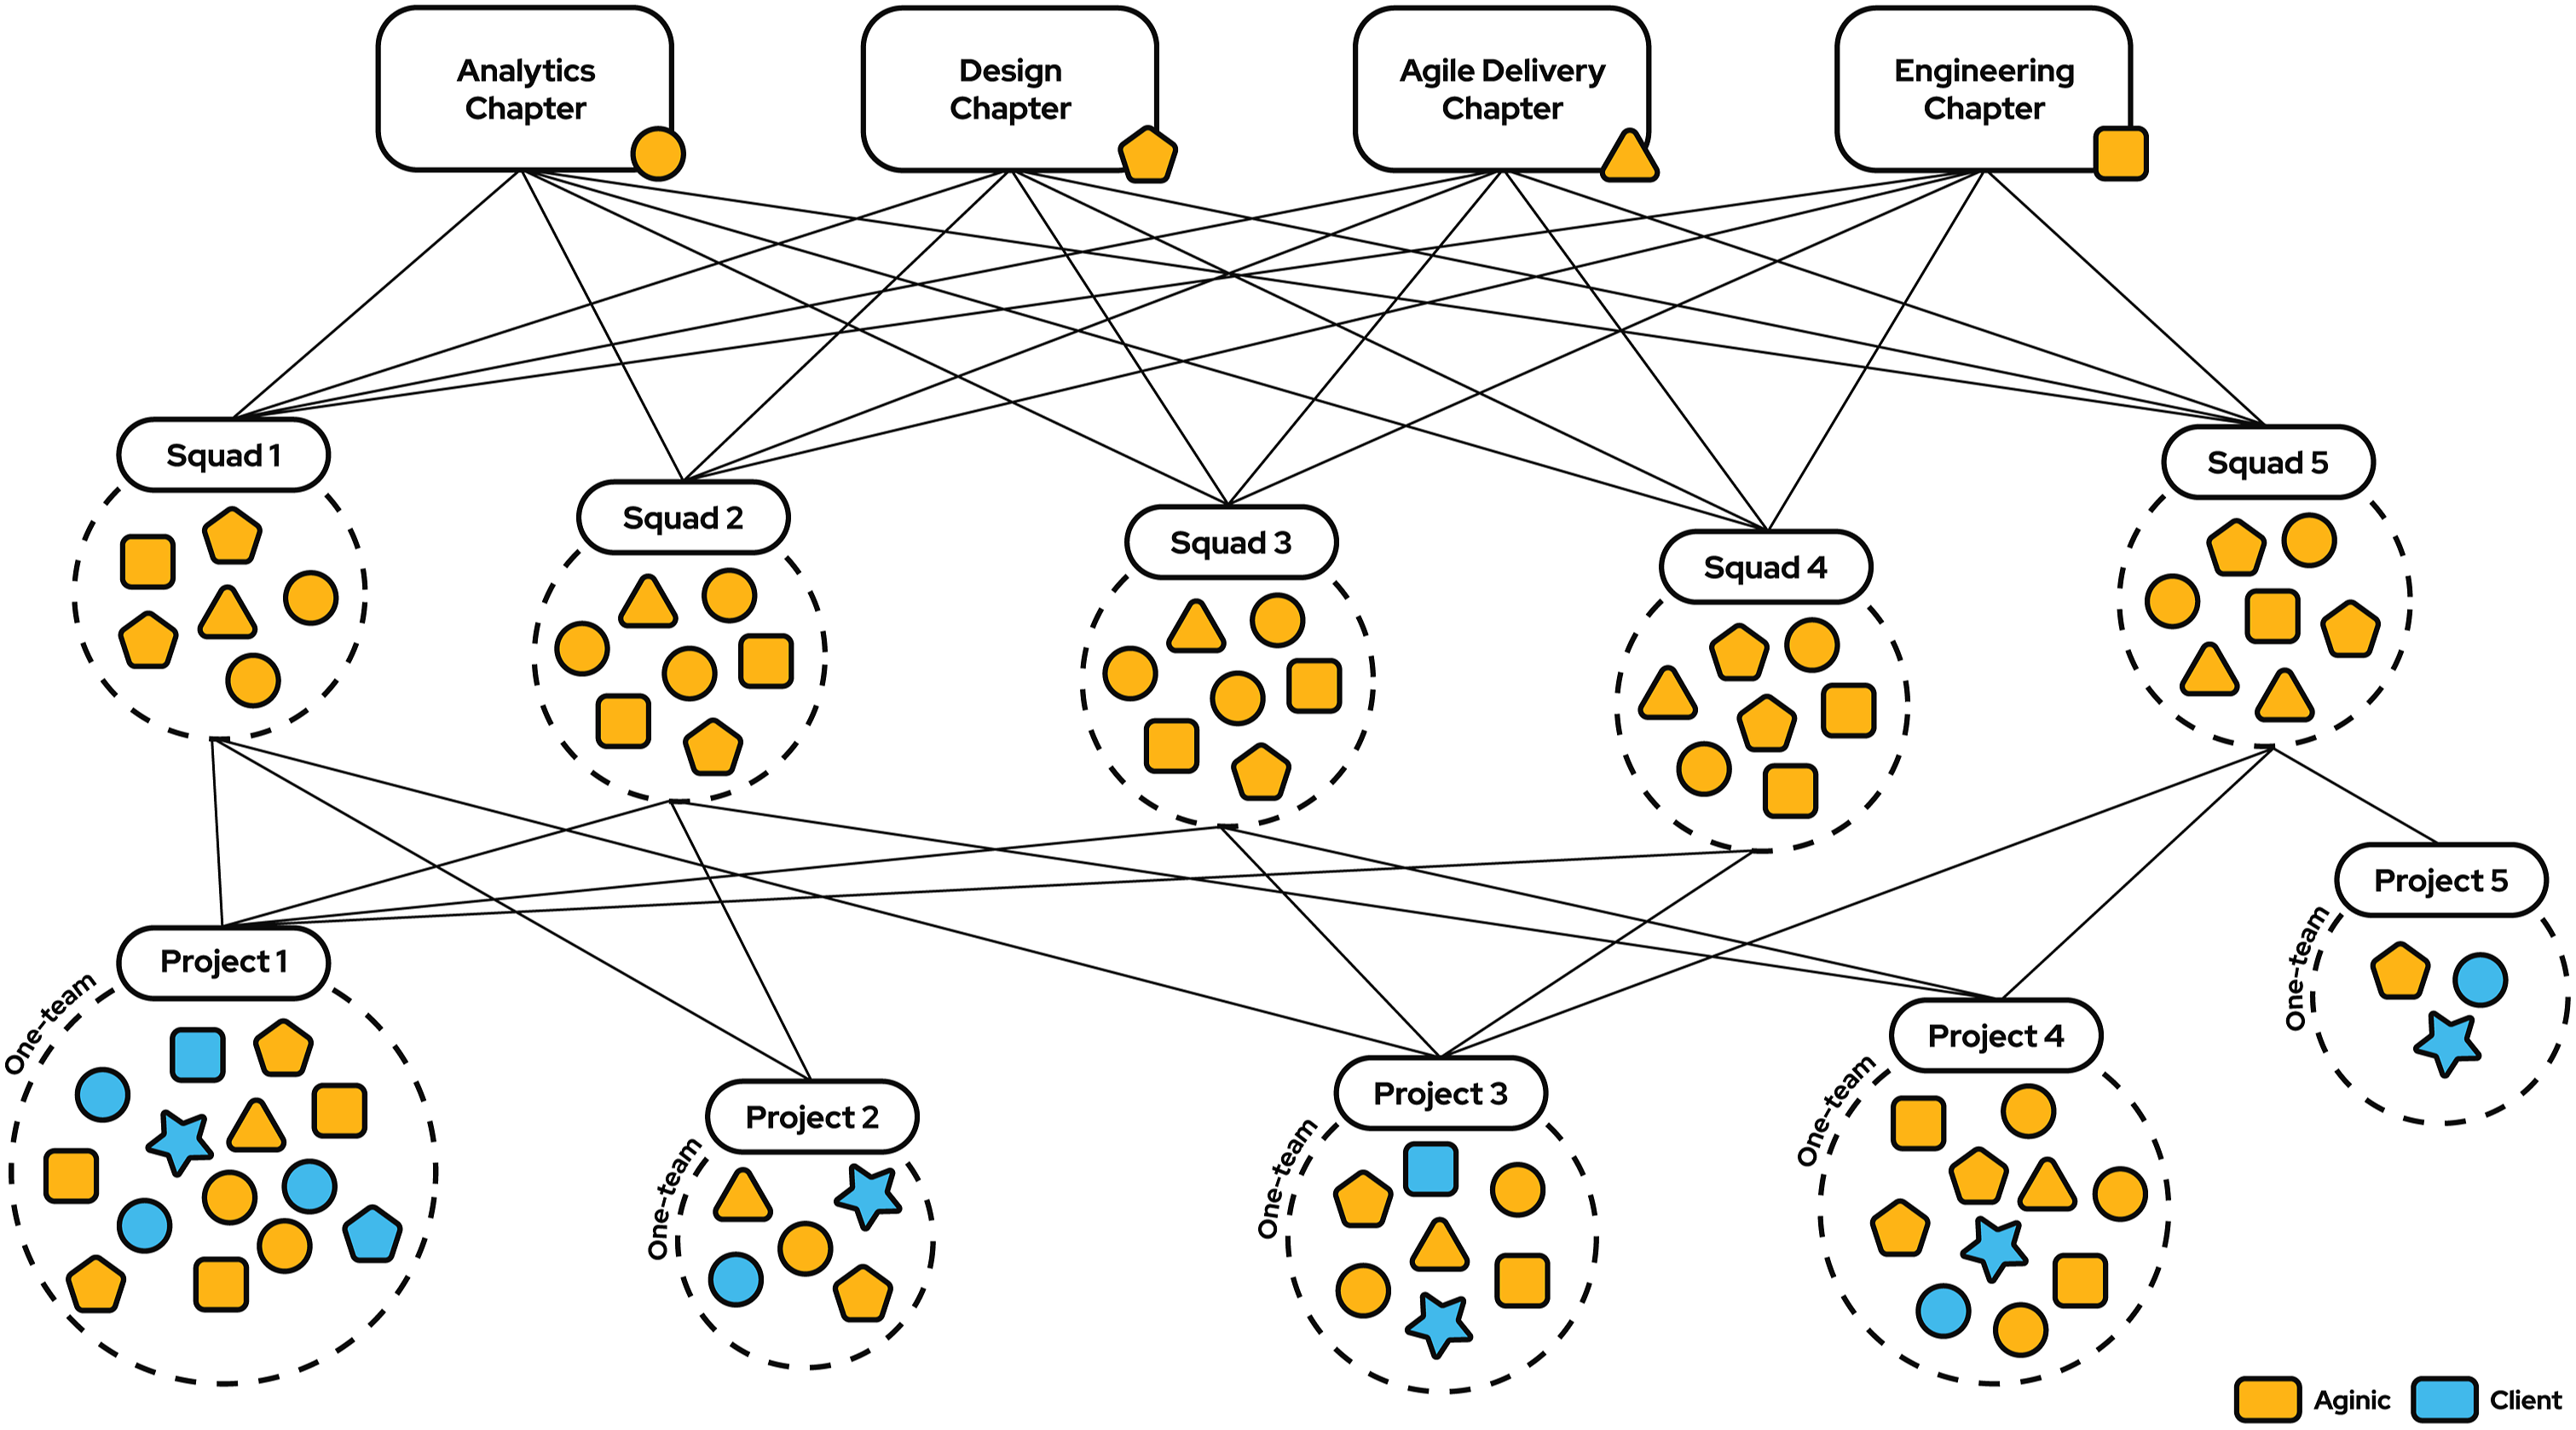
One team’s response to client needs: edPortal
The Department of Education (DoE) case
In 2018, Aginic seized an opportunity for large-scale formalisation of its capabilities to exploit design and user-centred approaches for analytics development: the DoE faced the problem of helping teachers form holistic understanding of who each student is. To enhance the education process, Department executives wanted an analytics solution that could help teachers understand student performance. Aginic Analytics Manager Vivian Shih explained that the client commissioned the system, later known as edPortal, ‘to understand their students in a more effective way. Initially they would have to go to, say five, six different systems to be able to have a full picture around a student’. Significant student mobility in the schools involved complicated matters: as many students attend multiple schools over a year, teachers were finding it hard to establish a connection with them. For instance, as Freya discovered in the project’s early phases, they did not always know the history of the student sitting in front of them in the classroom. This influenced the ability to provide a high-quality education experience and risked putting some learners at a disadvantage.
Aginic’s founders saw this project as an ideal testbed for the two-pronged approach. Their first step was to arrange the One Team structure as a basis for cultivating shared understanding of user needs and problems. Freya explained: ‘When we work as one team, it includes the client, and we all have different roles inside that. Together we help unpack the business problems, the user pain points, what their needs are, and in that process we get to understand the users better’. Shih, one of the first members of the edPortal project, stressed that including DoE staff in combination with Aginic employees afforded highly effective and seamless interaction with the client. With ‘a tester and an architect from [the Department’s] side and, on our part, a delivery lead and also developers’, the One Team way of working enabled faster sharing of information and helped avoid communication silos: ‘When we collaborate, our team is fairly harmonised and then it makes it a lot easier for us to integrate well with the client’. (Shih). This close interaction created a strong vehicle for transfer of analytics knowledge and for upskilling the client’s team members especially. As for the client’s goals, the edPortal project vividly showed Aginic how continuous involvement throughout the process helped DoE develop solid analytics and design capabilities in the longer term. A key part of this was the organic shift in responsibility as the client took on leadership of such activities as workshops with end-users.
That smooth trajectory was enabled by nurturing design thinking via multiple techniques, applied in clear phases. For the edPortal project, Freya and her team implemented this systematic approach by starting with a ‘discovery’ phase (supported by divergent thinking) focused on understanding the user. She used techniques that emphasise understanding the project goal, vision and framing of the business problem, alongside conducting user research. The techniques included doing user workshops, stakeholder mapping to identify the entities relevant for the business problem, creation of personas and mapping user groups, and empathy mapping to identify user pains and gains. Next, after user opportunities were defined, activities in the ‘development’ phase focused on generating, integrating and refining ideas for the final solution, involving: sketchstorming (to solicit illustrations of how the individuals would like the data visualised), voting (to select the most fitting views of the data) and collaborative storyboarding (to link the various views together) – see Appendices for corresponding illustrations. Digital tools facilitated several aspects of these activities, as Freya elucidated: ‘We use digital whiteboarding tools, so we set up boards with different activities, and then we timebox each activity and we get everyone to jump in. People writing down their thoughts, we pick up on what they write down, ask further questions, and try to get that information out of them’.
Ideation was followed by a ‘delivery’ phase oriented toward rapidly developing solution prototypes, relying on convergent thinking and in line with the ‘fail fast’ principle – quickly testing ideas to discard bad ones and iterate on the good ones. Prototyping involved visual mock-ups and crafting of various dashboard views, all of which contribute to validating the options and extracting feedback from the client and ultimate users. The team mock up ‘a dashboard showing graphs in different cuts of the data and then play it back to the users; then you get that quick feedback from users before you even start building out the dashboard’ (Freya). Collecting feedback for edPortal and testing the ideas initially utilised focus groups and surveys. Today, Freya and her team rely on a diverse toolbox of methods and digital solutions for this and the other activities along the design process, as explained previously.
The analytics solution
The artefact solving the department’s dilemma took the form of a dashboard-based platform synthesising data from multiple sources for advanced analysis, visualisation and reporting. The basis was a system connecting DoE’s various data warehouses and displaying the aggregate information so that teachers, principals, other school staff and DoE’s corporate staff all can exploit the data in response to their specific needs. Aginic’s methods and One Team mentality sharpened attention to those needs from day 1. Freya noted that they brought together the department and the Aginic team early in the project: ‘we did some workshopping, and we did personas. We got the directive from the board for [edPortal] to start helping the teachers in particular to understand their students’. Since then, edPortal has evolved to a full suite of dashboards to monitor students’ and schools’ performance alike and a host of risk and quality factors. It started with static student-level information and now covers trends and performance metrics to identify at-risk students, thus informing potential intervention. Today, thousands of educators and government employees apply edPortal in their day-to-day decision-making. Figure 2 shows a snapshot of edPortal with dummy data. A sample dashboard from the edPortal prototypes, showing the principal view.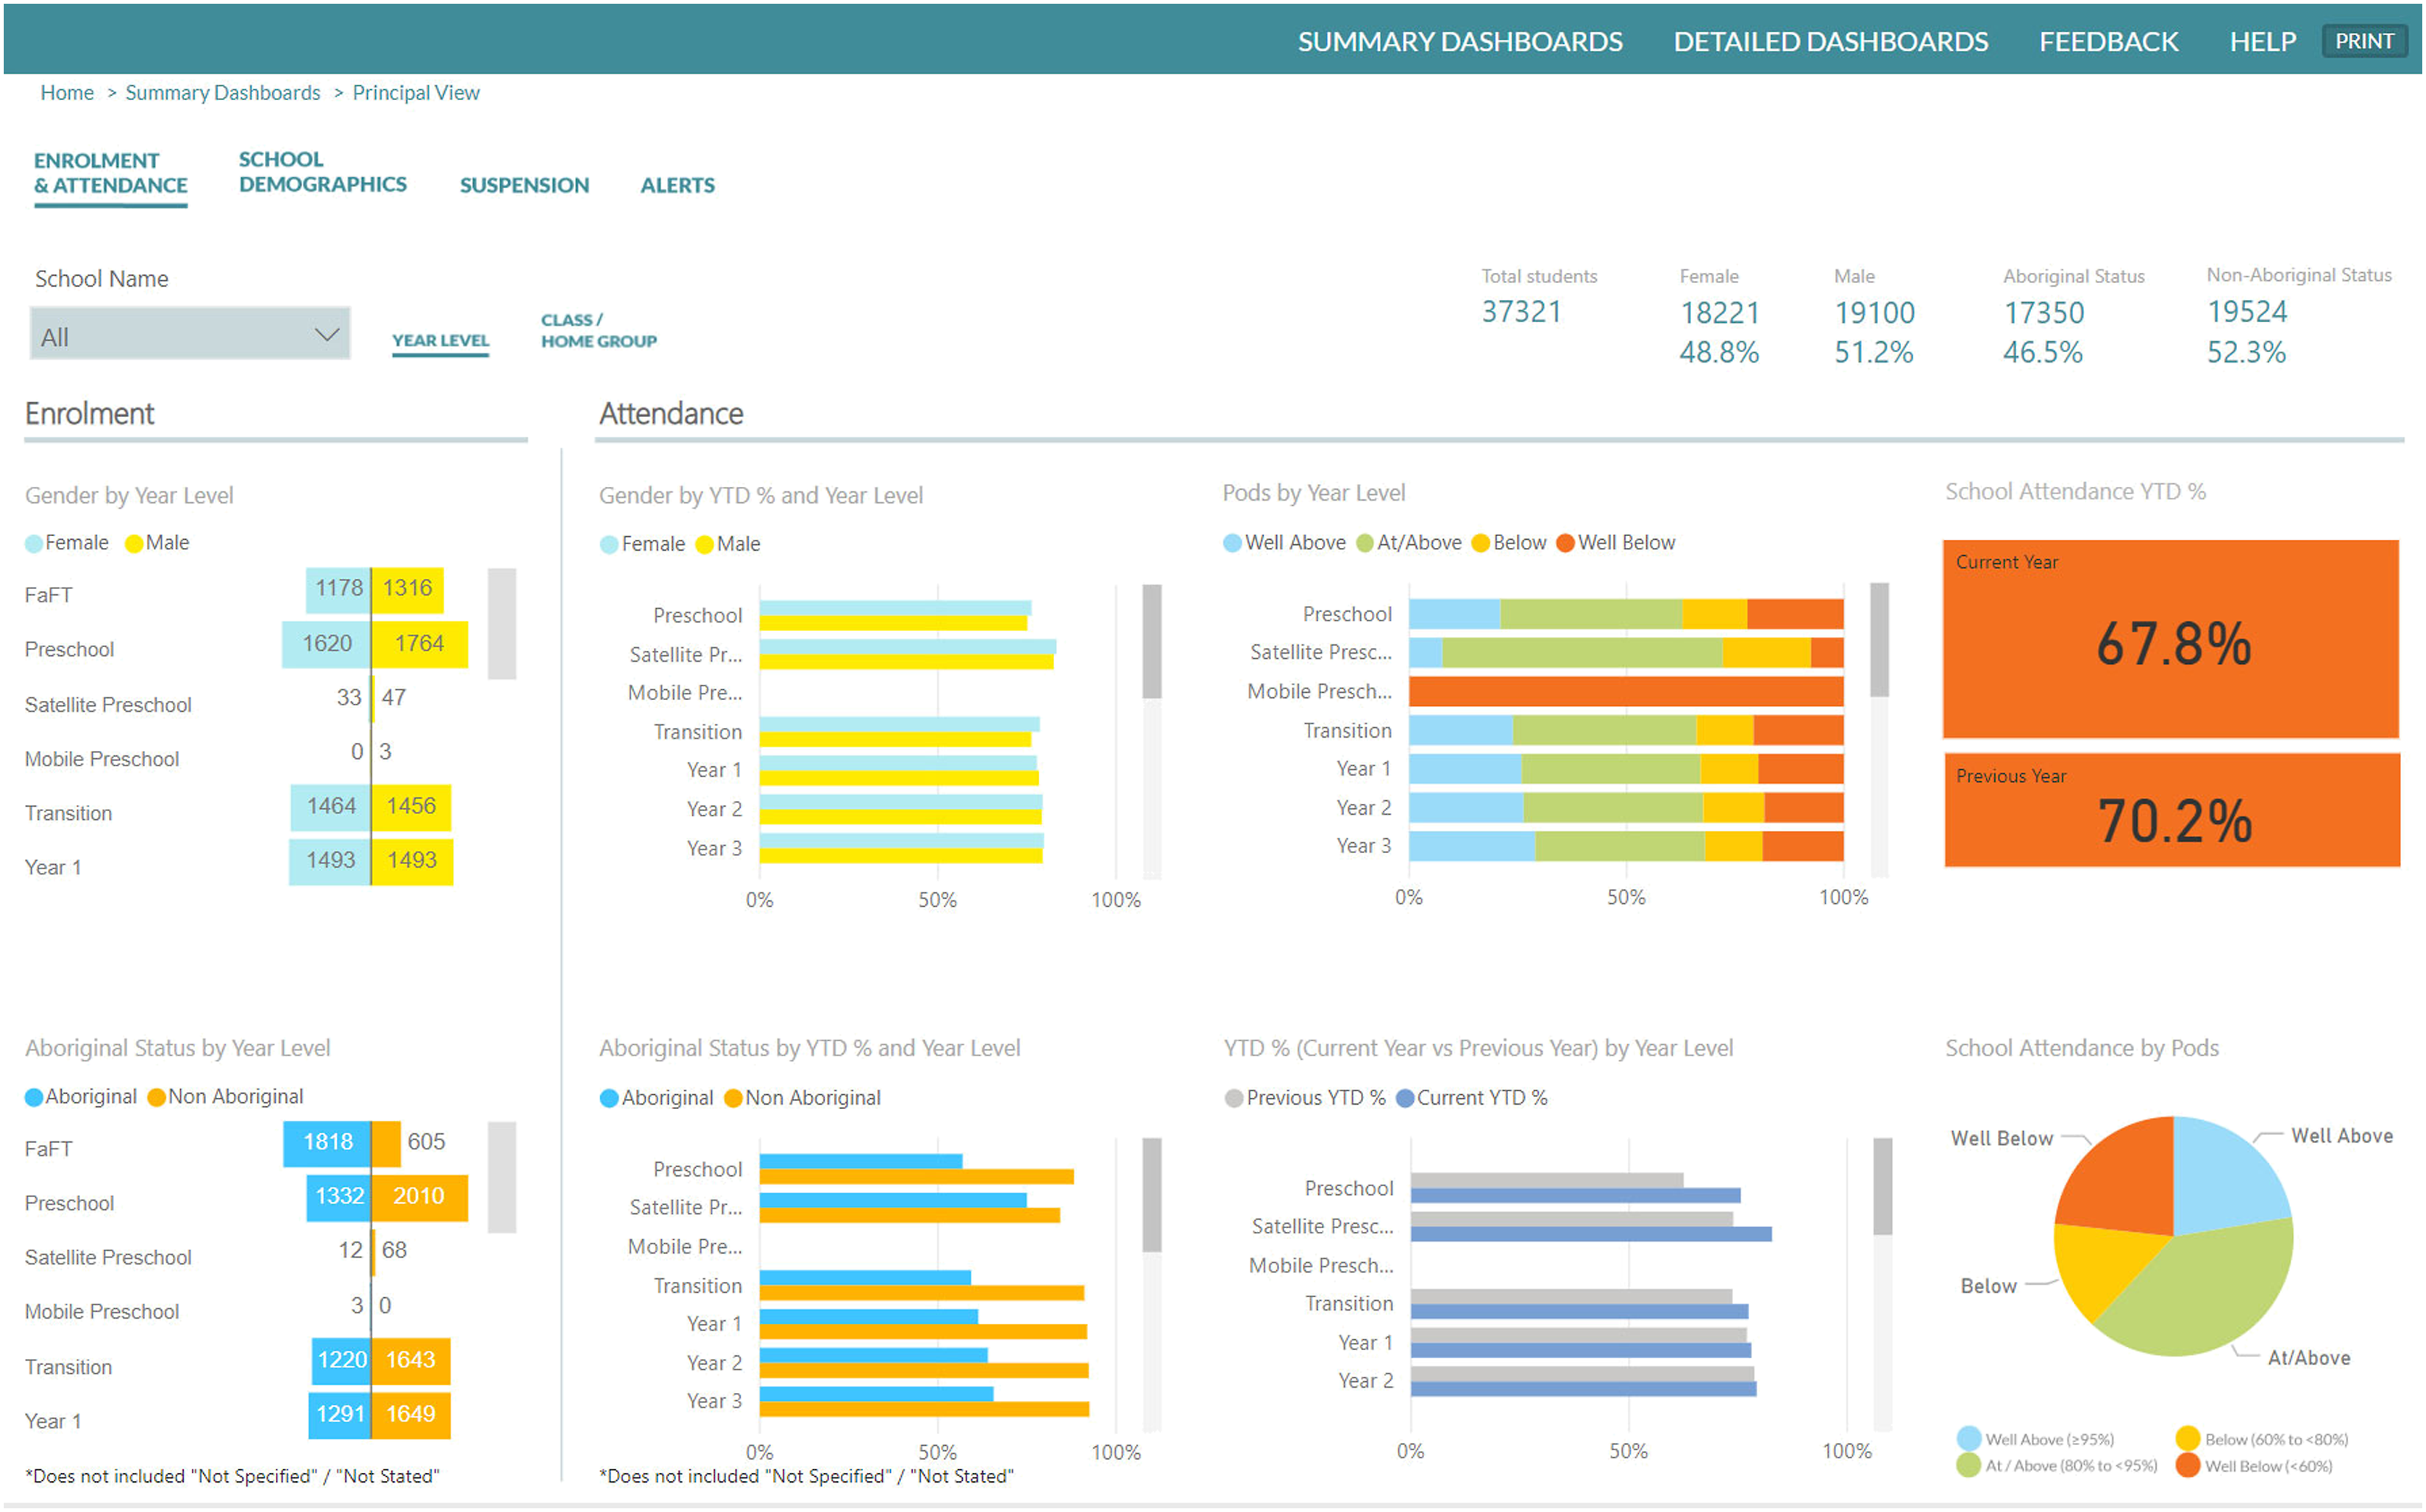
As part of this study’s aim to share knowledge on the design practices used by Aginic to develop edPortal for educational purposes, we have prepared a public-facing Miro board that can be accessed via this link: https://aginic.co/design-thinking-analytics. (Password: design-thinking-analytics).
Capturing value from edPortal
edPortal has unlocked significant value for DoE and the education system at large. As its functionality has expanded, the department has extended the scope of data-driven decision-making to the entire education sector. Freya describes this process as starting with student-level focus for teachers and moving to larger entities, ultimately to support ministerial-level reporting. Government employees, teachers, principals, students, and others all have benefited. She characterised its benefits thus: ‘[edPortal] helps inform not just the school staff, teachers, and principals. It is used as well to help inform the parents around how the students are going. So they're able to improve the teaching and the support that the corporate’s side need to provide to the school. So no-one falls through the cracks.’
At a still more profound level, edPortal has supported lasting societal benefits via data. Rachel Fox, the edPortal Product Owner on the DoE side, recalls that, as soon as the solution was rolled out, ‘people spoke about the benefits [edPortal] will have for generational change and brighter futures not just for kids but for society as a whole’.
Developing a solution does not automatically translate into value, however. For good, agile analytics practices to unlock data-driven transformation, the client must be ready for change, as Hayes noted: ‘[Agile] brings with it a change in ways of working and a change in mindset around data delivery, but there has to be a level of readiness in the organisation for that’, including commitment to learning new methods/tools and to redesigning processes. Aware that value arises only through consuming the insight and undertaking informed actions at the right time, Aginic had to cultivate user-side mindset and process change. To do more to close the value loop by transforming the department’s mindset, managers decided to make investments in client education and upskilling, centred on a ‘home-grown’ DoE analytics team. Hayes stressed that ‘if it’s going to live on past our involvement and live on past a small unit of people in the team that we deal with, there’s got to be some sort of wider organisational desire or imperative for change’. And it has, to such an extent that the department now solves business problems itself in an iterative manner.
Becoming genuinely data-driven required substantial change. This process started with DoE’s commitment to transformation via edPortal, with the aid of Aginic and a design-focused agile approach, the organisation has since built a large portfolio of analytics solutions. More importantly, it has helped transform the department’s very way of working. Hayes summarised this well: ‘The other element of transformation is around the how rather than the what. And I think that's relevant in [edPortal] certainly. That's been really well-received […] in particular. It's a kind of alignment of Agile and design thinking with good analytics, software practices.’
Becoming a serial analytics innovator
Aginic’s journey continues, taking the agile approach and design-thinking capabilities further with Aginic Ventures, a sister brand focused on supporting early business ideas around data and analytics. This is propelled by Thebault and Conneely’s entrepreneurial spirit and fuelled by agile- and design-approach expertise from Hayes, Freya and their teams. Among the business problems addressed are the same public-health issues that created the initial impetus for Aginic. Hayes described its position thus: ‘We want to be in a place where we’re really showing to the market and to other potential founders that this is a really good place to be. It’s a really supportive environment for getting your product to market and making a success of it’.
As design-focused approaches get more popular and accessible to competitors, Aginic leaders are thinking to maintain its unique value proposition around design and agile thinking through making data science products more user friendly. As the number of projects and client engagements increase, together with the numbers of functions, views and personas in current projects such as edPortal, Aginic will need to review their approach to organising (e.g. its chapters, squads, and team of teams) and ensure they have further capacity to grow and can solve more complex user problems with data.
Questions for discussion
1. What is the specific role of design thinking practices in the development of business analytics solutions? 2. What are the key elements needed to successfully integrate design thinking and agile methodology for analytics software development? 3. What do you like/do not like about how Aginic organise their teams and work to implement design thinking in analytics projects? 4. How did the integration between design and Agile approaches help Aginic deliver an innovative solution to DoE? 5. How did design thinking practices facilitate data-driven transformations both at the DoE and education system levels?
Footnotes
Declaration of conflicting interests
The author(s) declared no potential conflicts of interest with respect to the research, authorship, and/or publication of this article.
Funding
The author(s) received no financial support for the research, authorship, and/or publication of this article.
Notes
Appendix
Design thinking activities used by Aginic.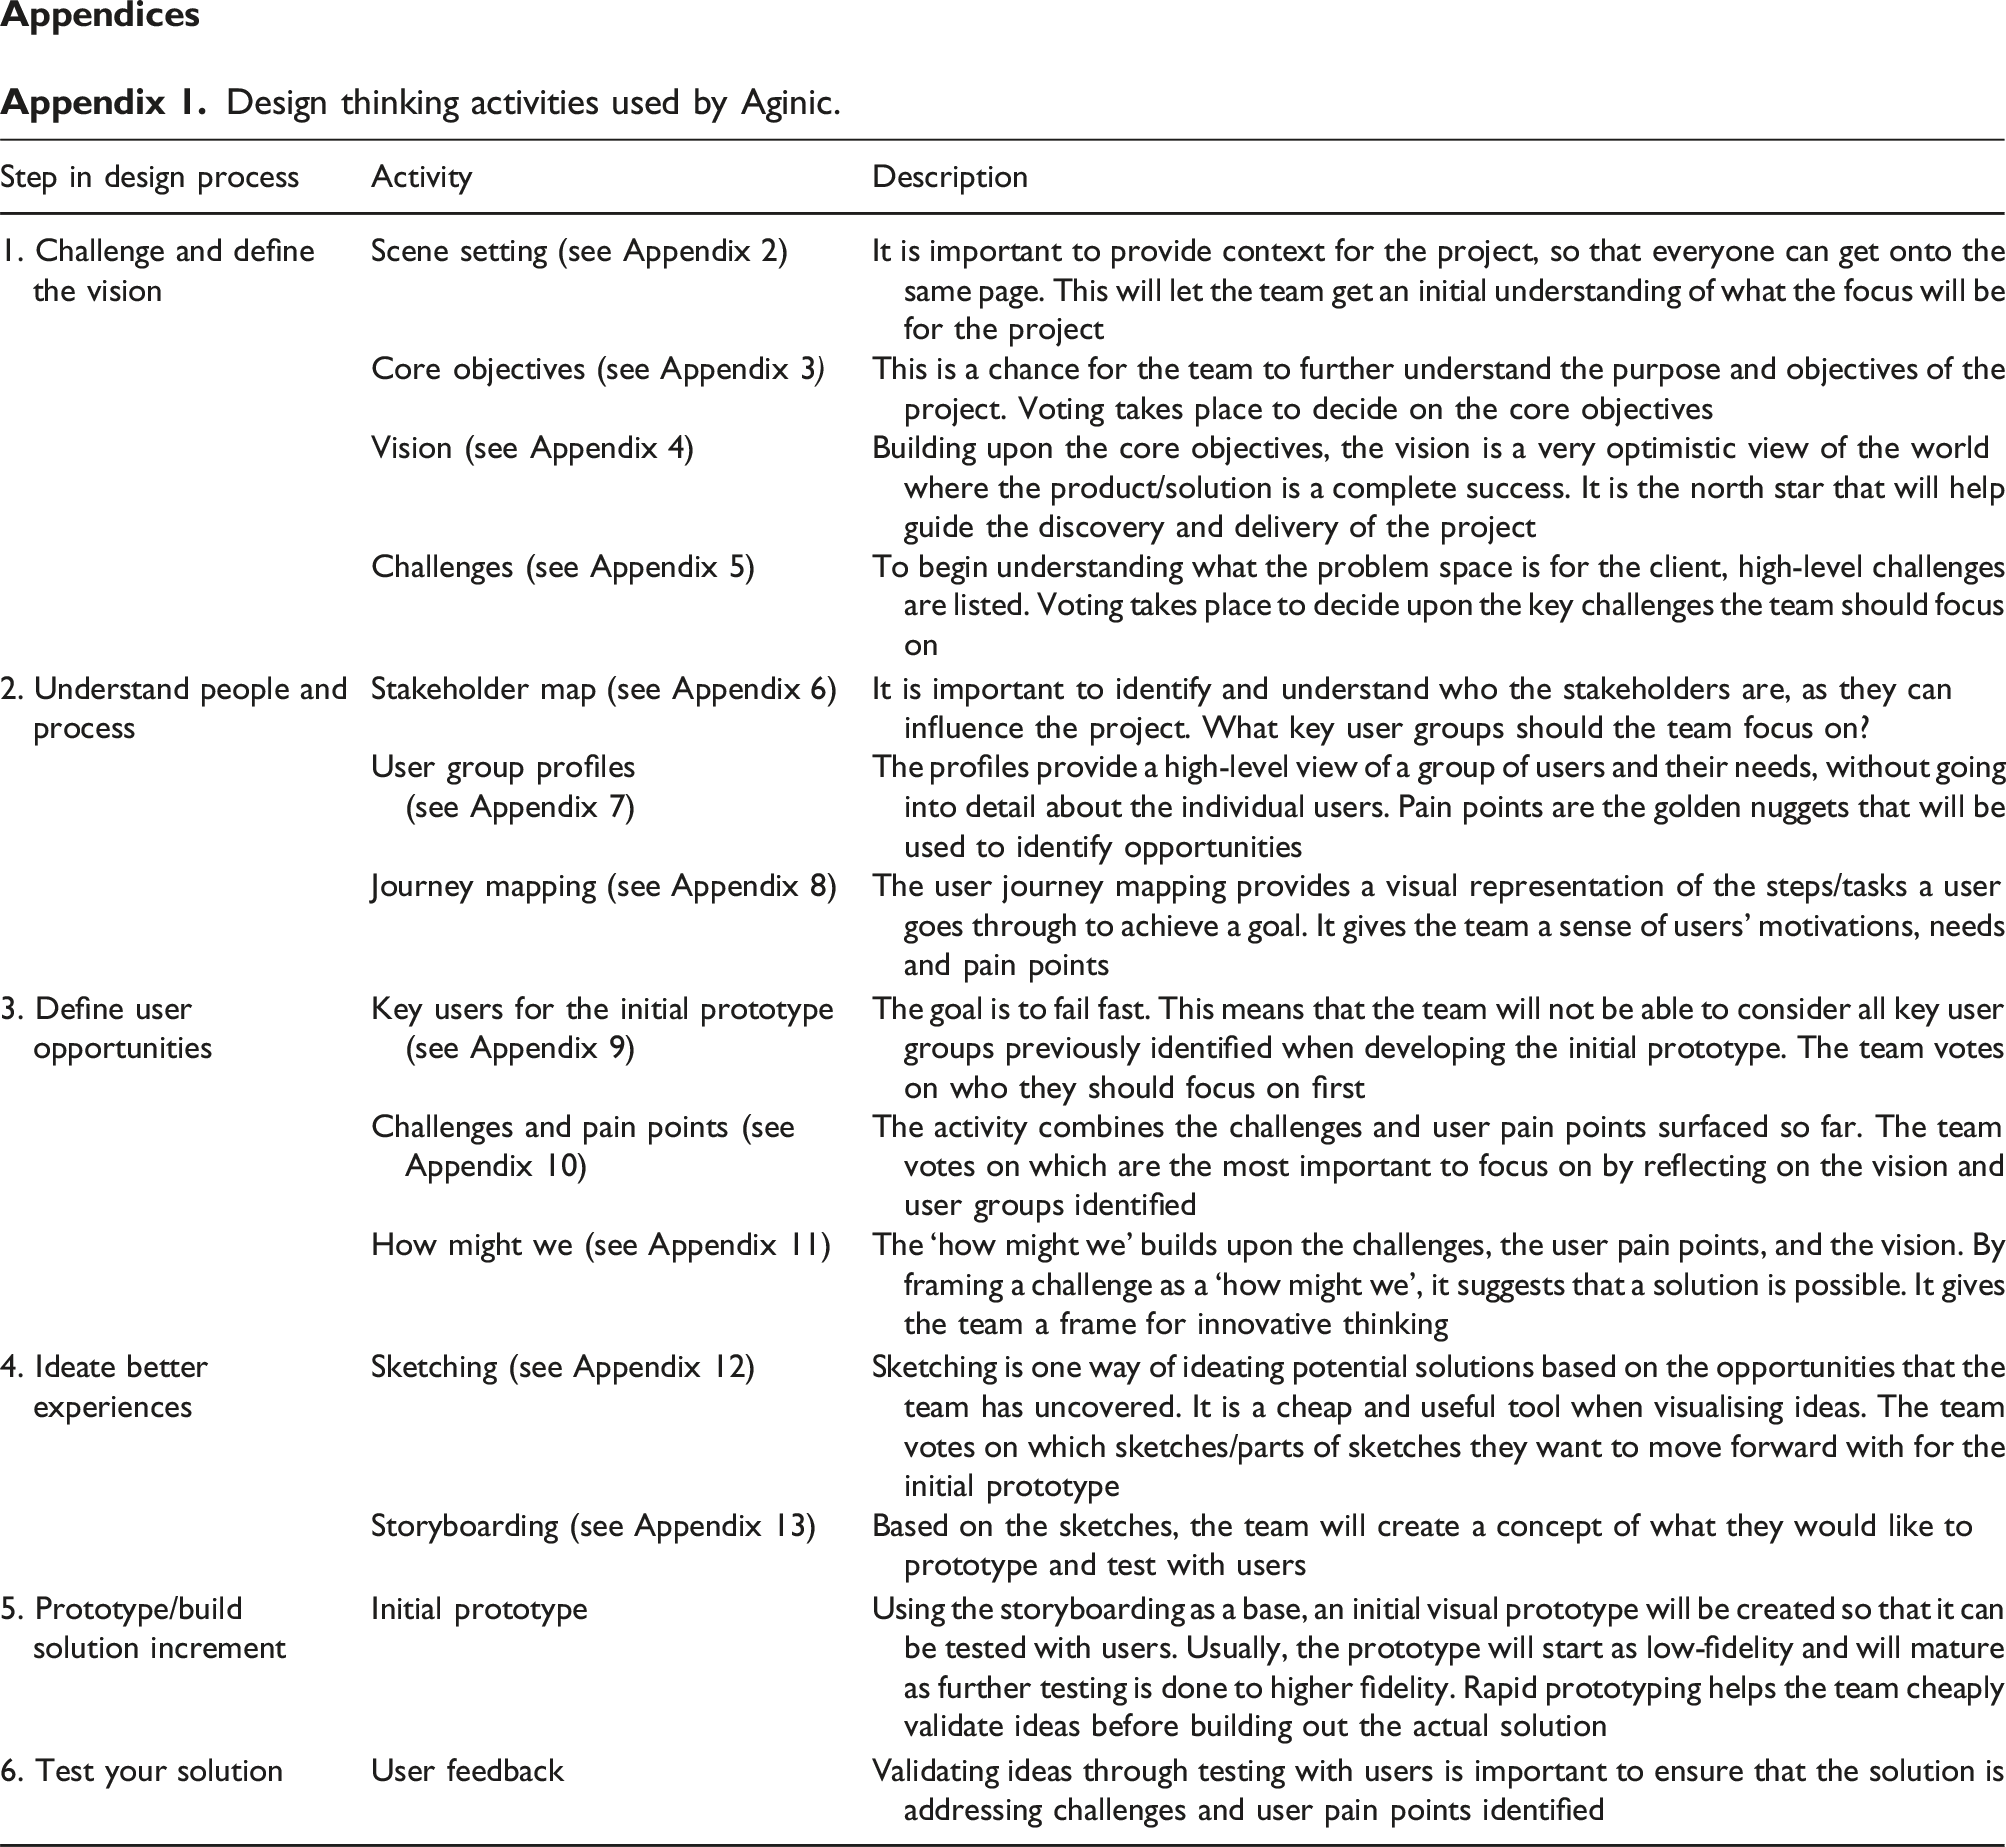
Step in design process
Activity
Description
1. Challenge and define the vision
Scene setting (see Appendix 2)
It is important to provide context for the project, so that everyone can get onto the same page. This will let the team get an initial understanding of what the focus will be for the project
Core objectives (see Appendix 3)
This is a chance for the team to further understand the purpose and objectives of the project. Voting takes place to decide on the core objectives
Vision (see Appendix 4)
Building upon the core objectives, the vision is a very optimistic view of the world where the product/solution is a complete success. It is the north star that will help guide the discovery and delivery of the project
Challenges (see Appendix 5)
To begin understanding what the problem space is for the client, high-level challenges are listed. Voting takes place to decide upon the key challenges the team should focus on
2. Understand people and process
Stakeholder map (see Appendix 6)
It is important to identify and understand who the stakeholders are, as they can influence the project. What key user groups should the team focus on?
User group profiles (see Appendix 7)
The profiles provide a high-level view of a group of users and their needs, without going into detail about the individual users. Pain points are the golden nuggets that will be used to identify opportunities
Journey mapping (see Appendix 8)
The user journey mapping provides a visual representation of the steps/tasks a user goes through to achieve a goal. It gives the team a sense of users’ motivations, needs and pain points
3. Define user opportunities
Key users for the initial prototype (see Appendix 9)
The goal is to fail fast. This means that the team will not be able to consider all key user groups previously identified when developing the initial prototype. The team votes on who they should focus on first
Challenges and pain points (see Appendix 10)
The activity combines the challenges and user pain points surfaced so far. The team votes on which are the most important to focus on by reflecting on the vision and user groups identified
How might we (see Appendix 11)
The ‘how might we’ builds upon the challenges, the user pain points, and the vision. By framing a challenge as a ‘how might we’, it suggests that a solution is possible. It gives the team a frame for innovative thinking
4. Ideate better experiences
Sketching (see Appendix 12)
Sketching is one way of ideating potential solutions based on the opportunities that the team has uncovered. It is a cheap and useful tool when visualising ideas. The team votes on which sketches/parts of sketches they want to move forward with for the initial prototype
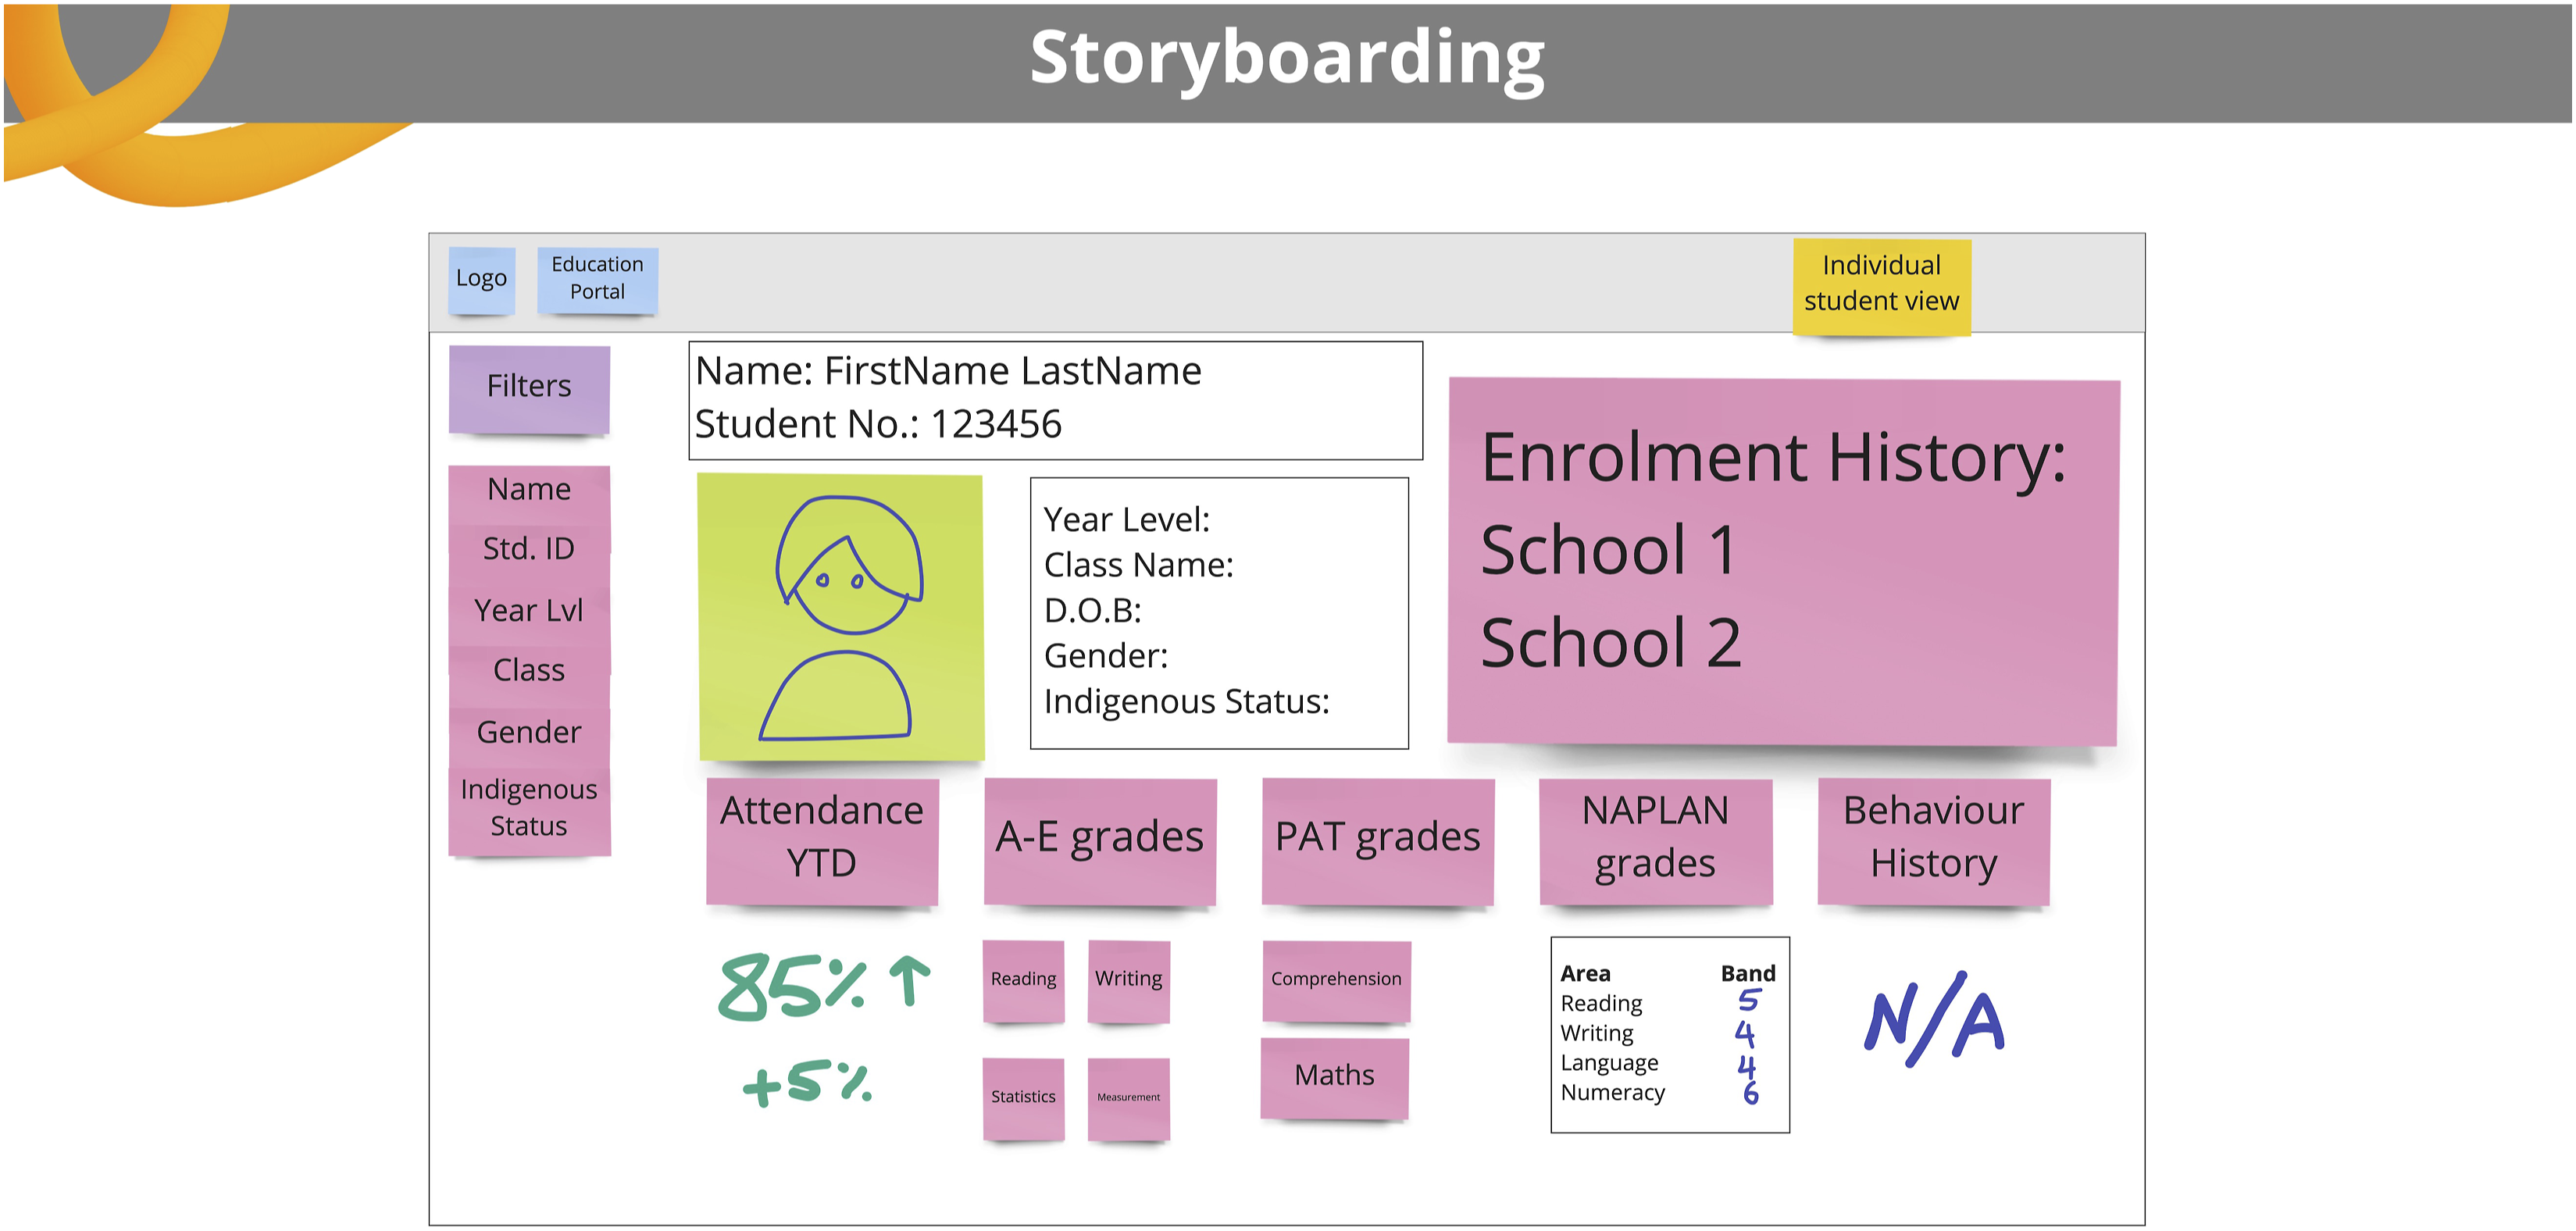
Storyboarding (see Appendix 13)
Based on the sketches, the team will create a concept of what they would like to prototype and test with users
5. Prototype/build solution increment
Initial prototype
Using the storyboarding as a base, an initial visual prototype will be created so that it can be tested with users. Usually, the prototype will start as low-fidelity and will mature as further testing is done to higher fidelity. Rapid prototyping helps the team cheaply validate ideas before building out the actual solution
6. Test your solution
User feedback
Validating ideas through testing with users is important to ensure that the solution is addressing challenges and user pain points identified
Scene setting.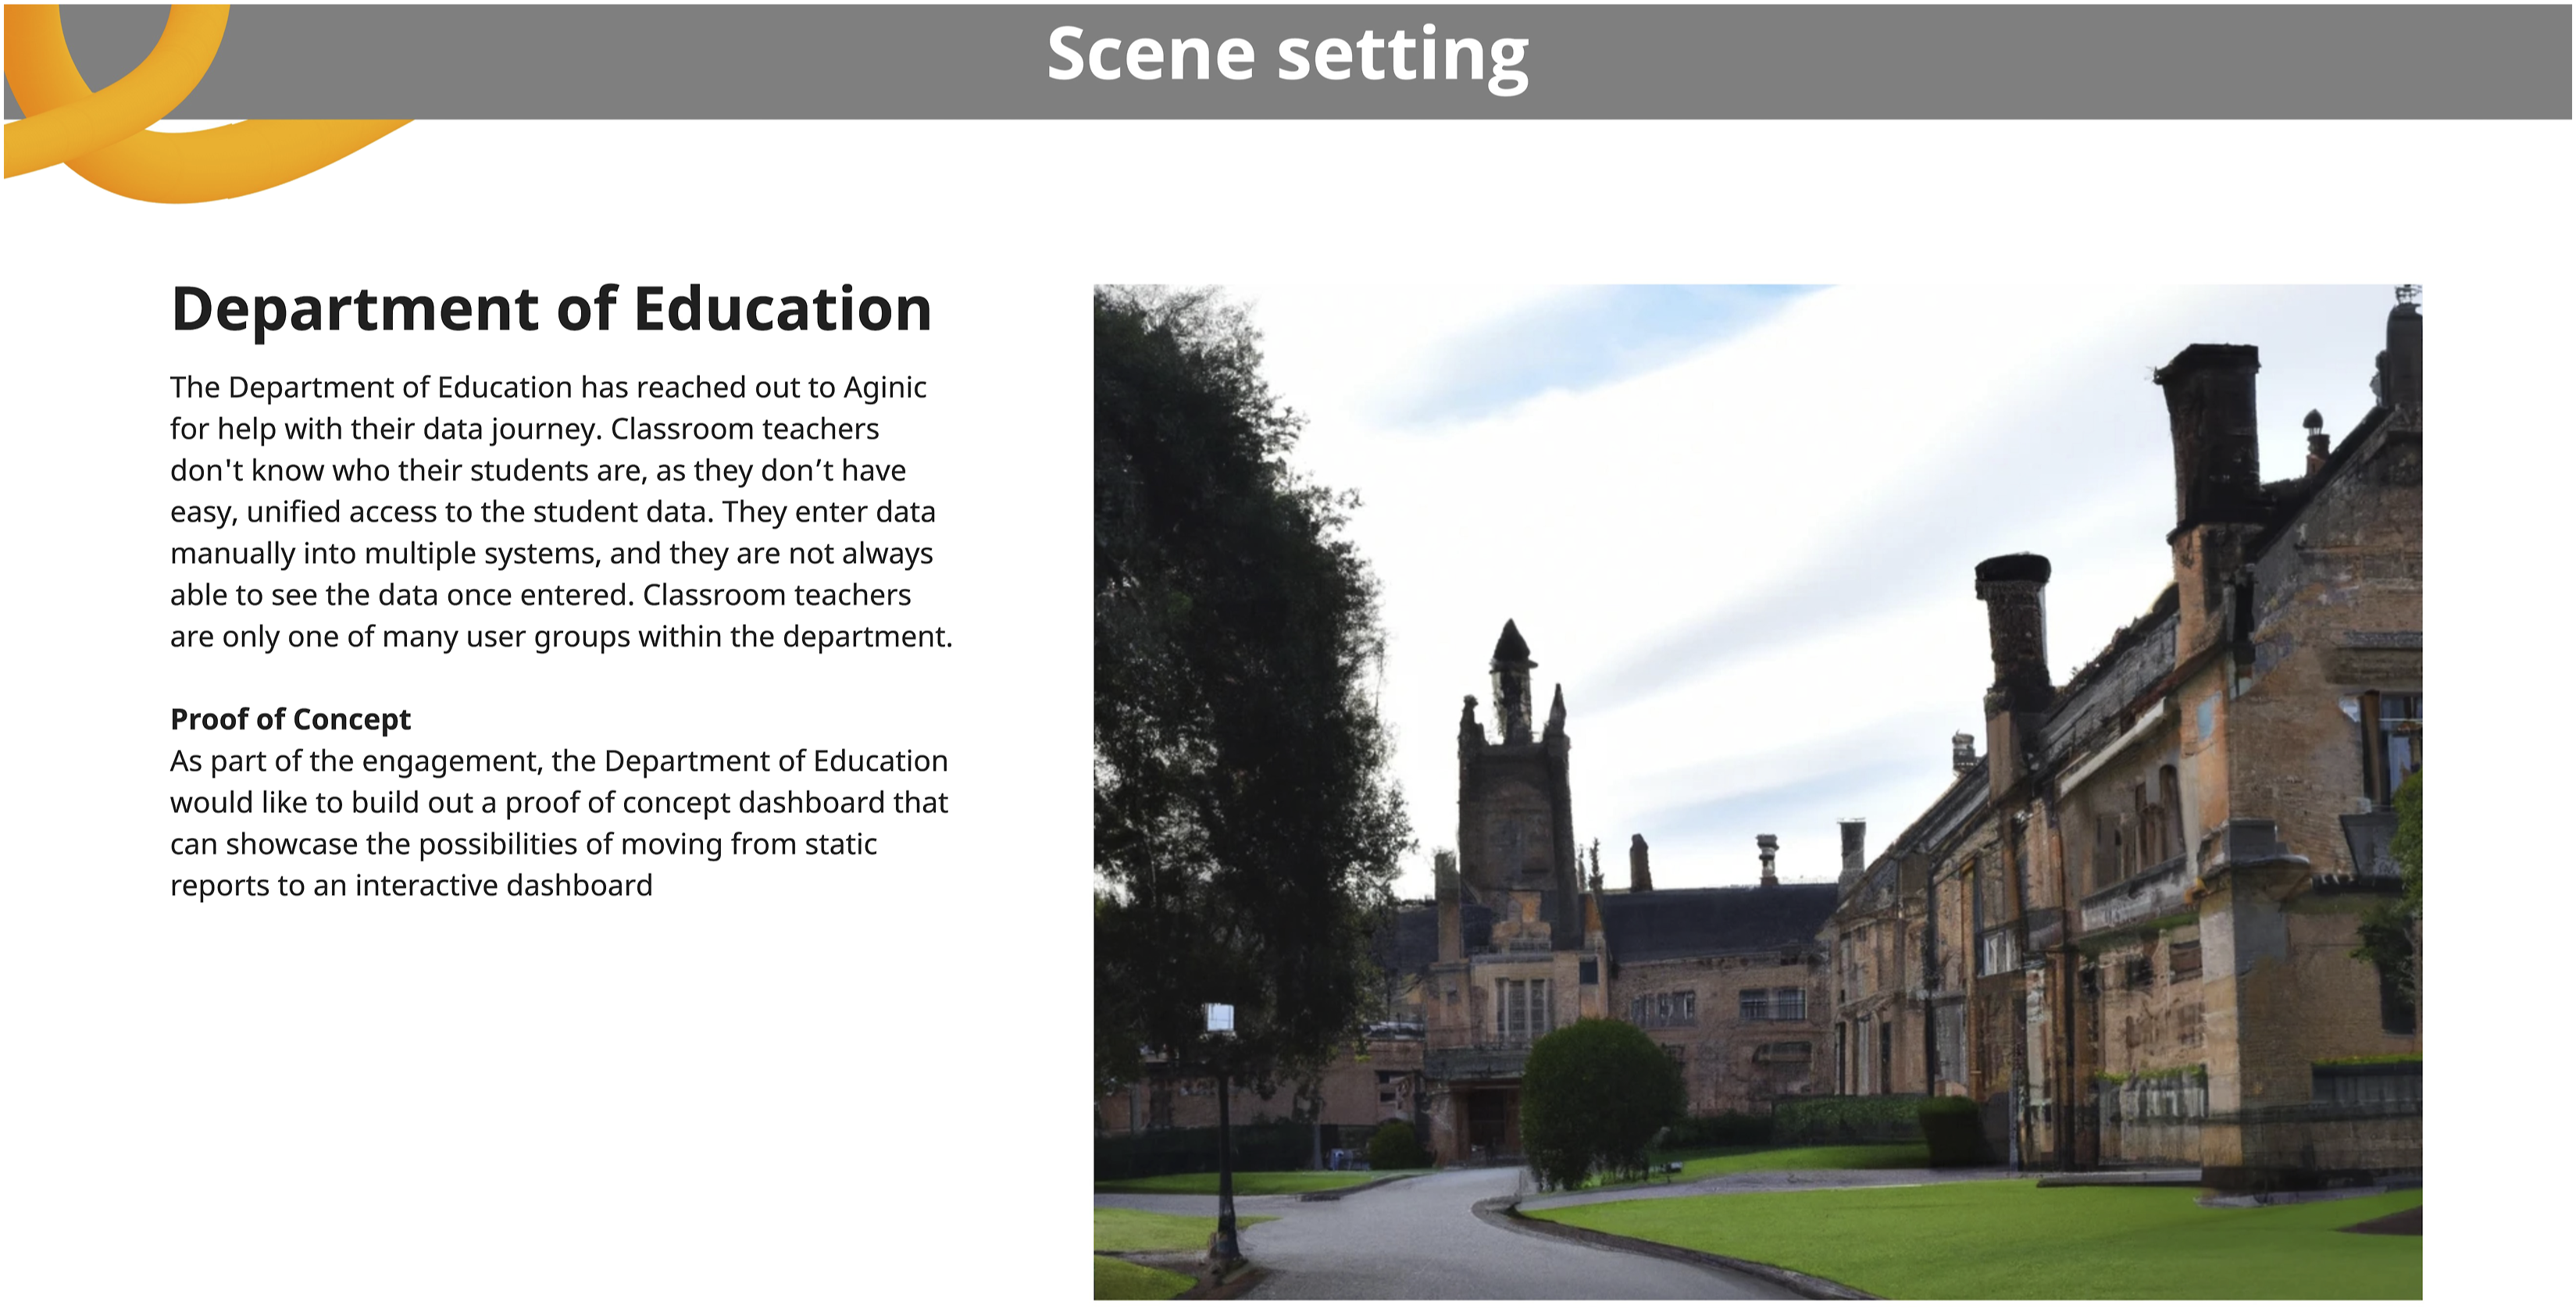
Core objectives.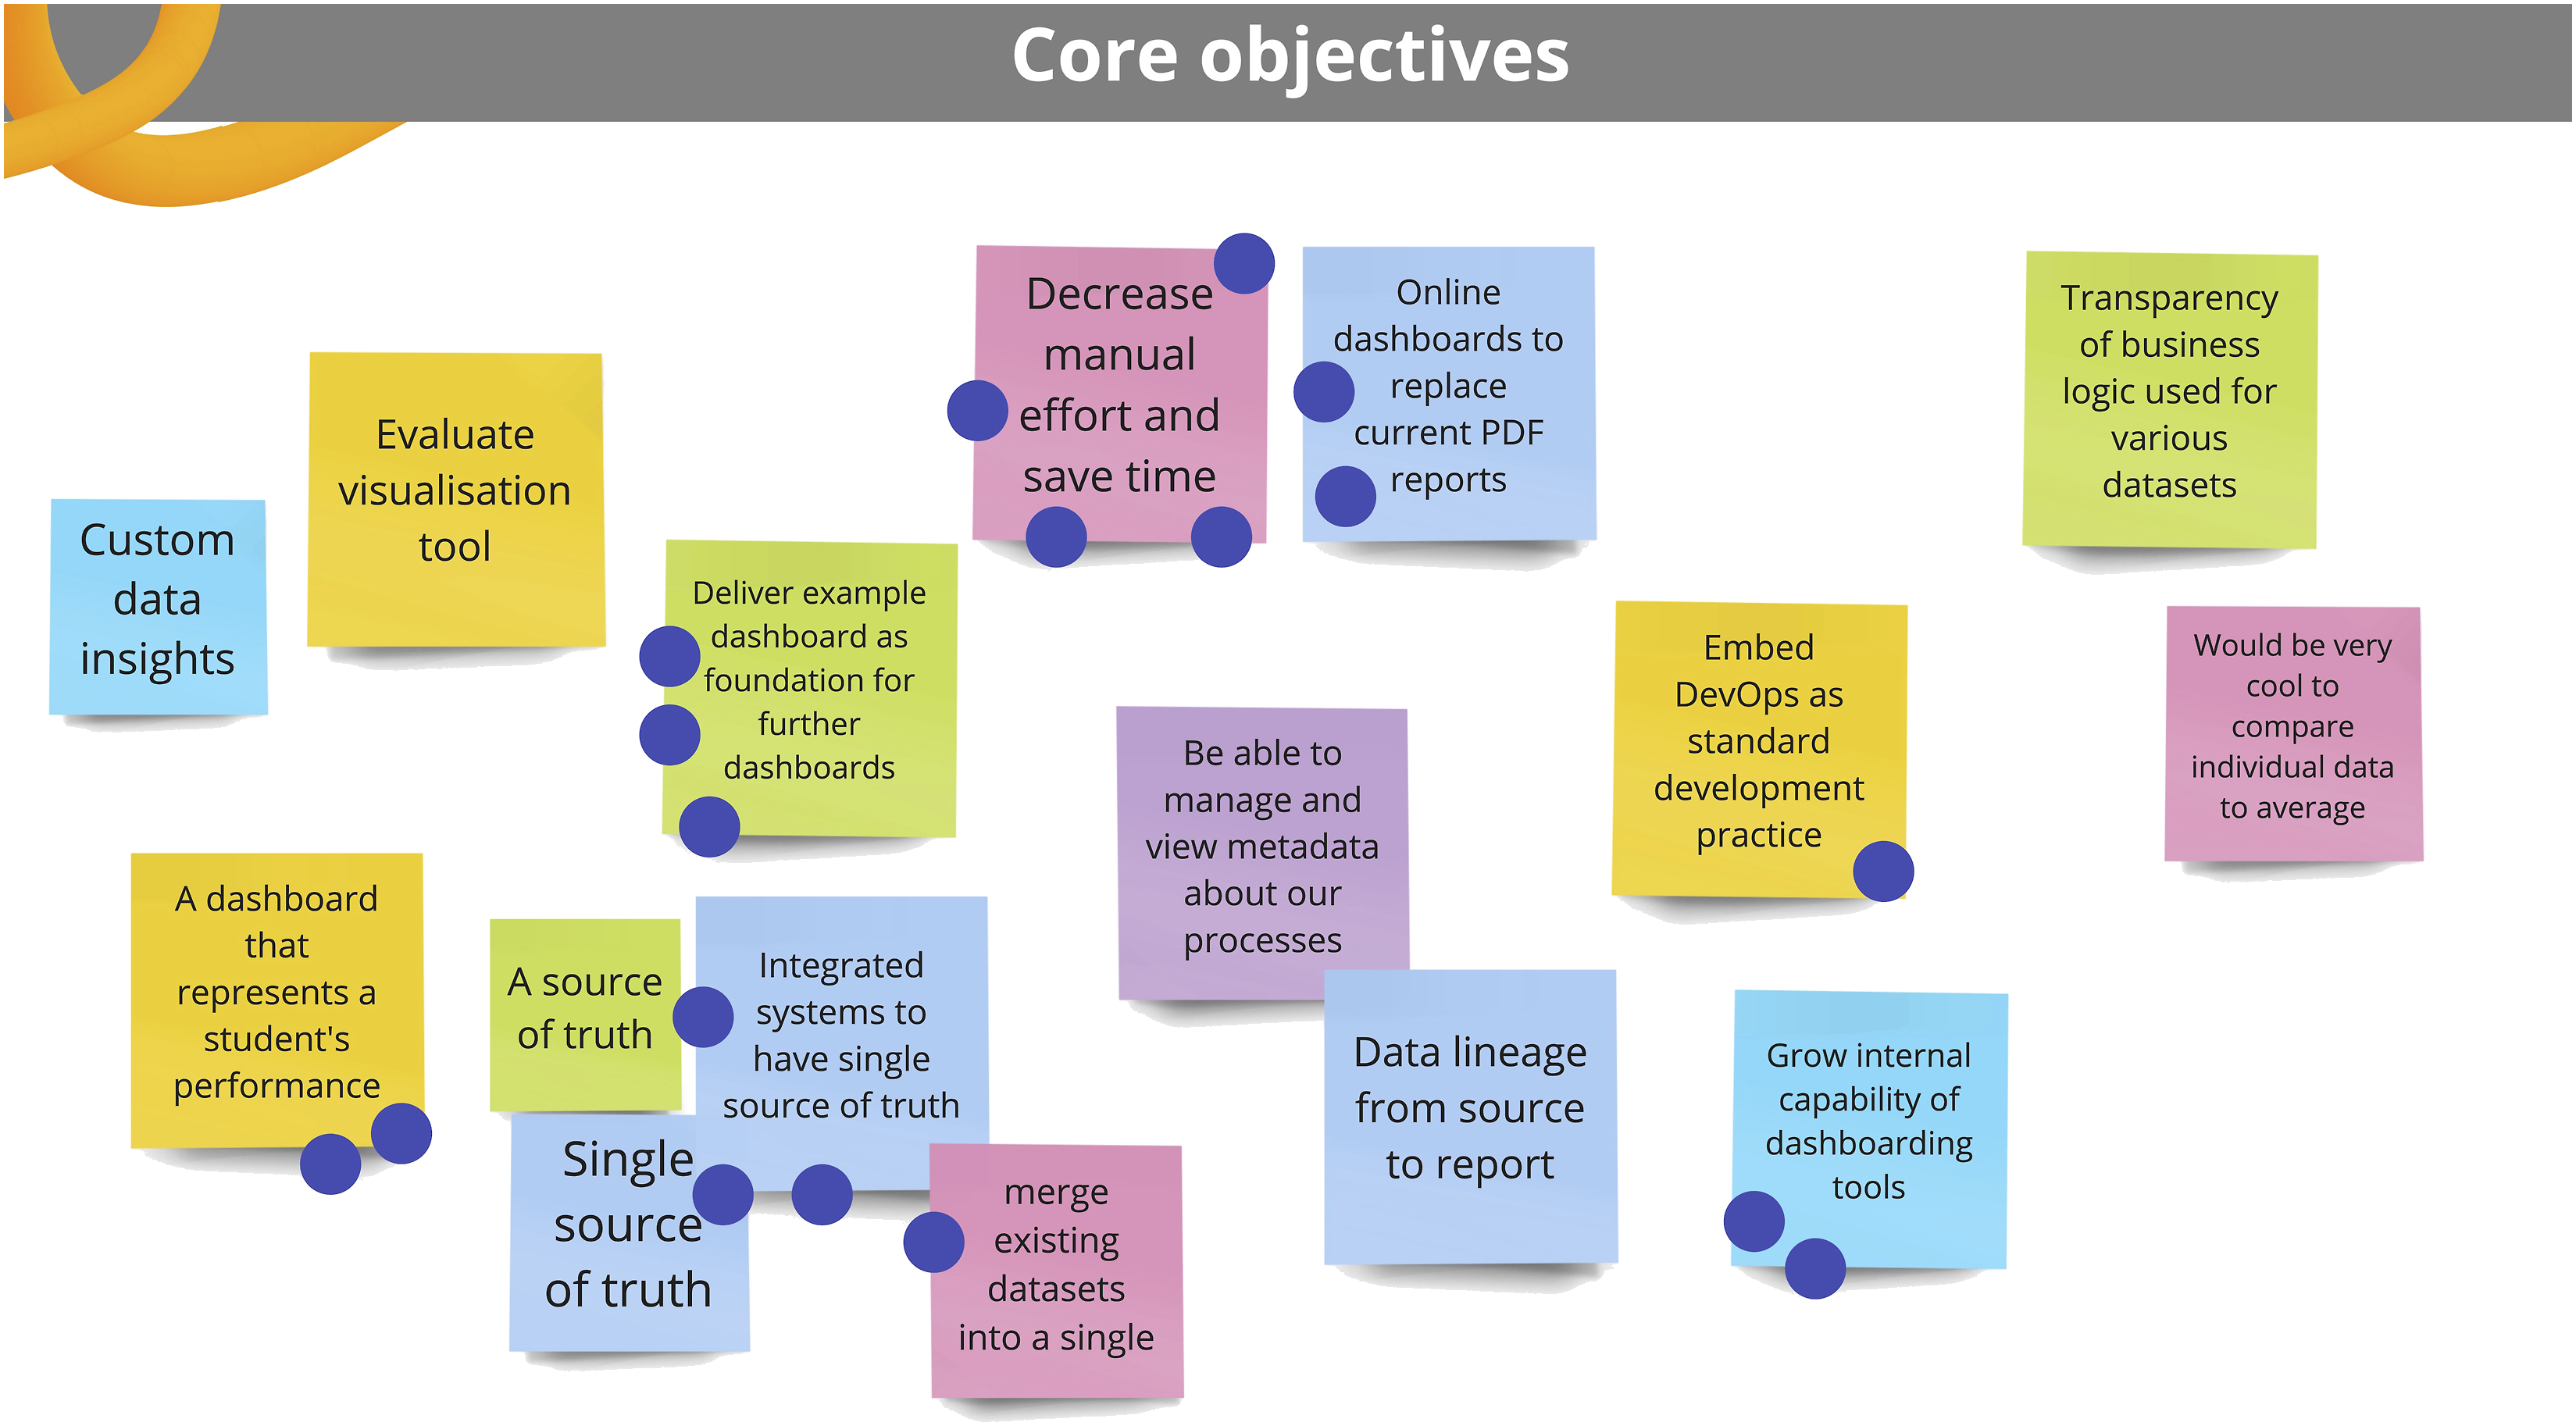
Vision.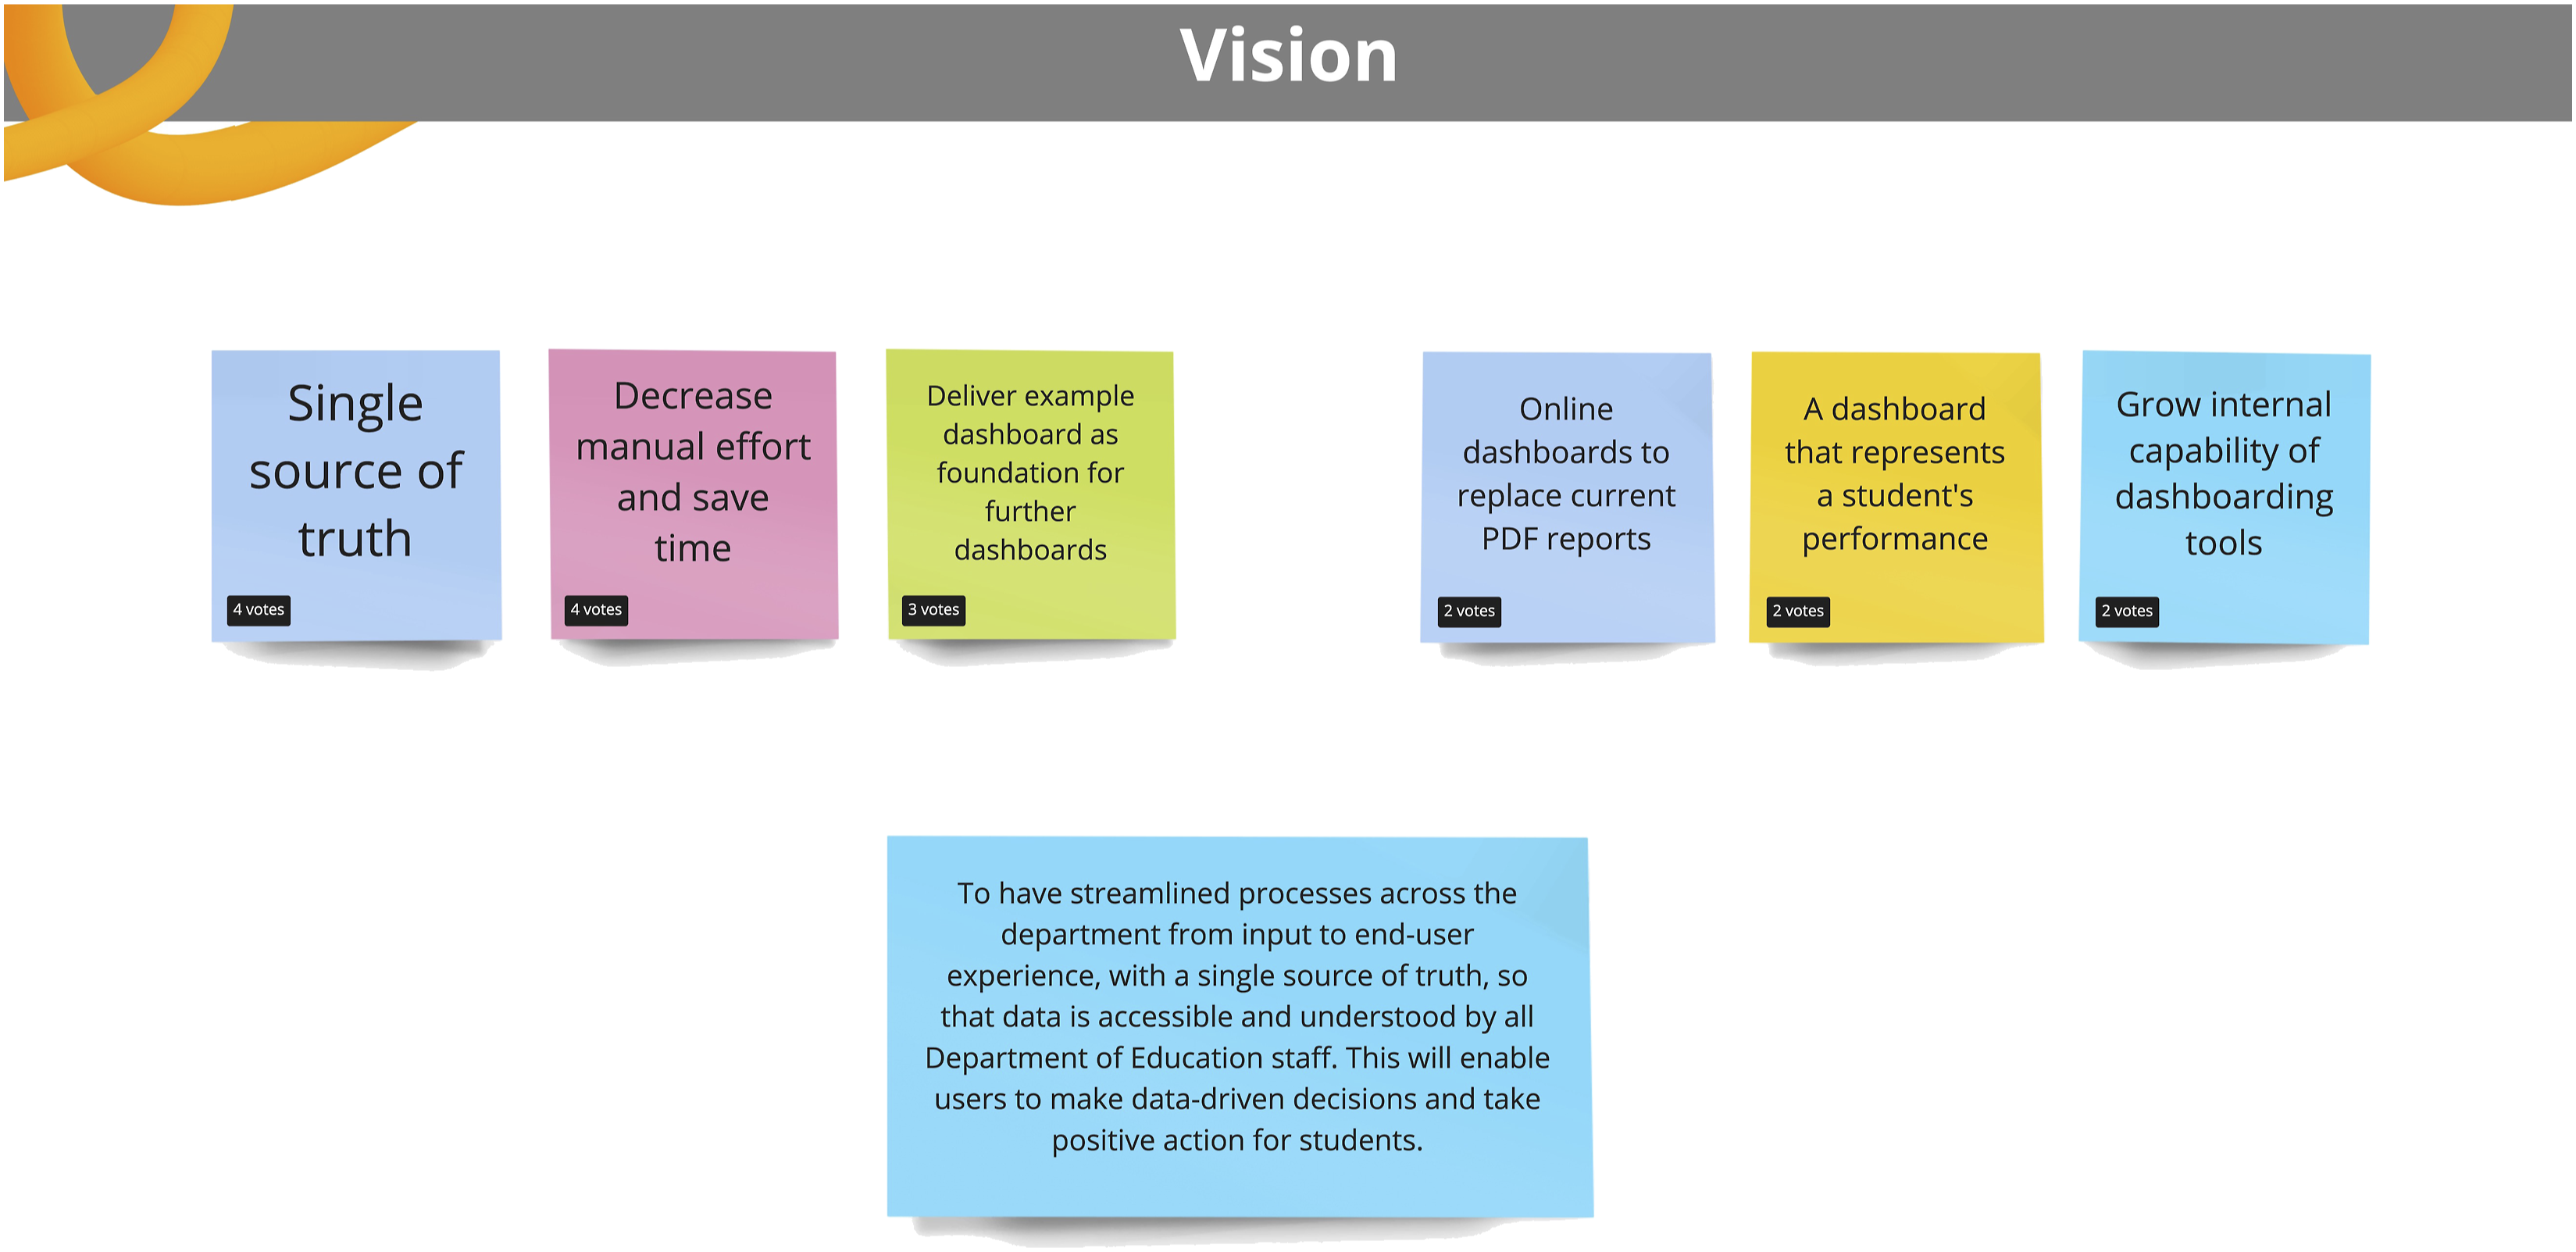
Challenges.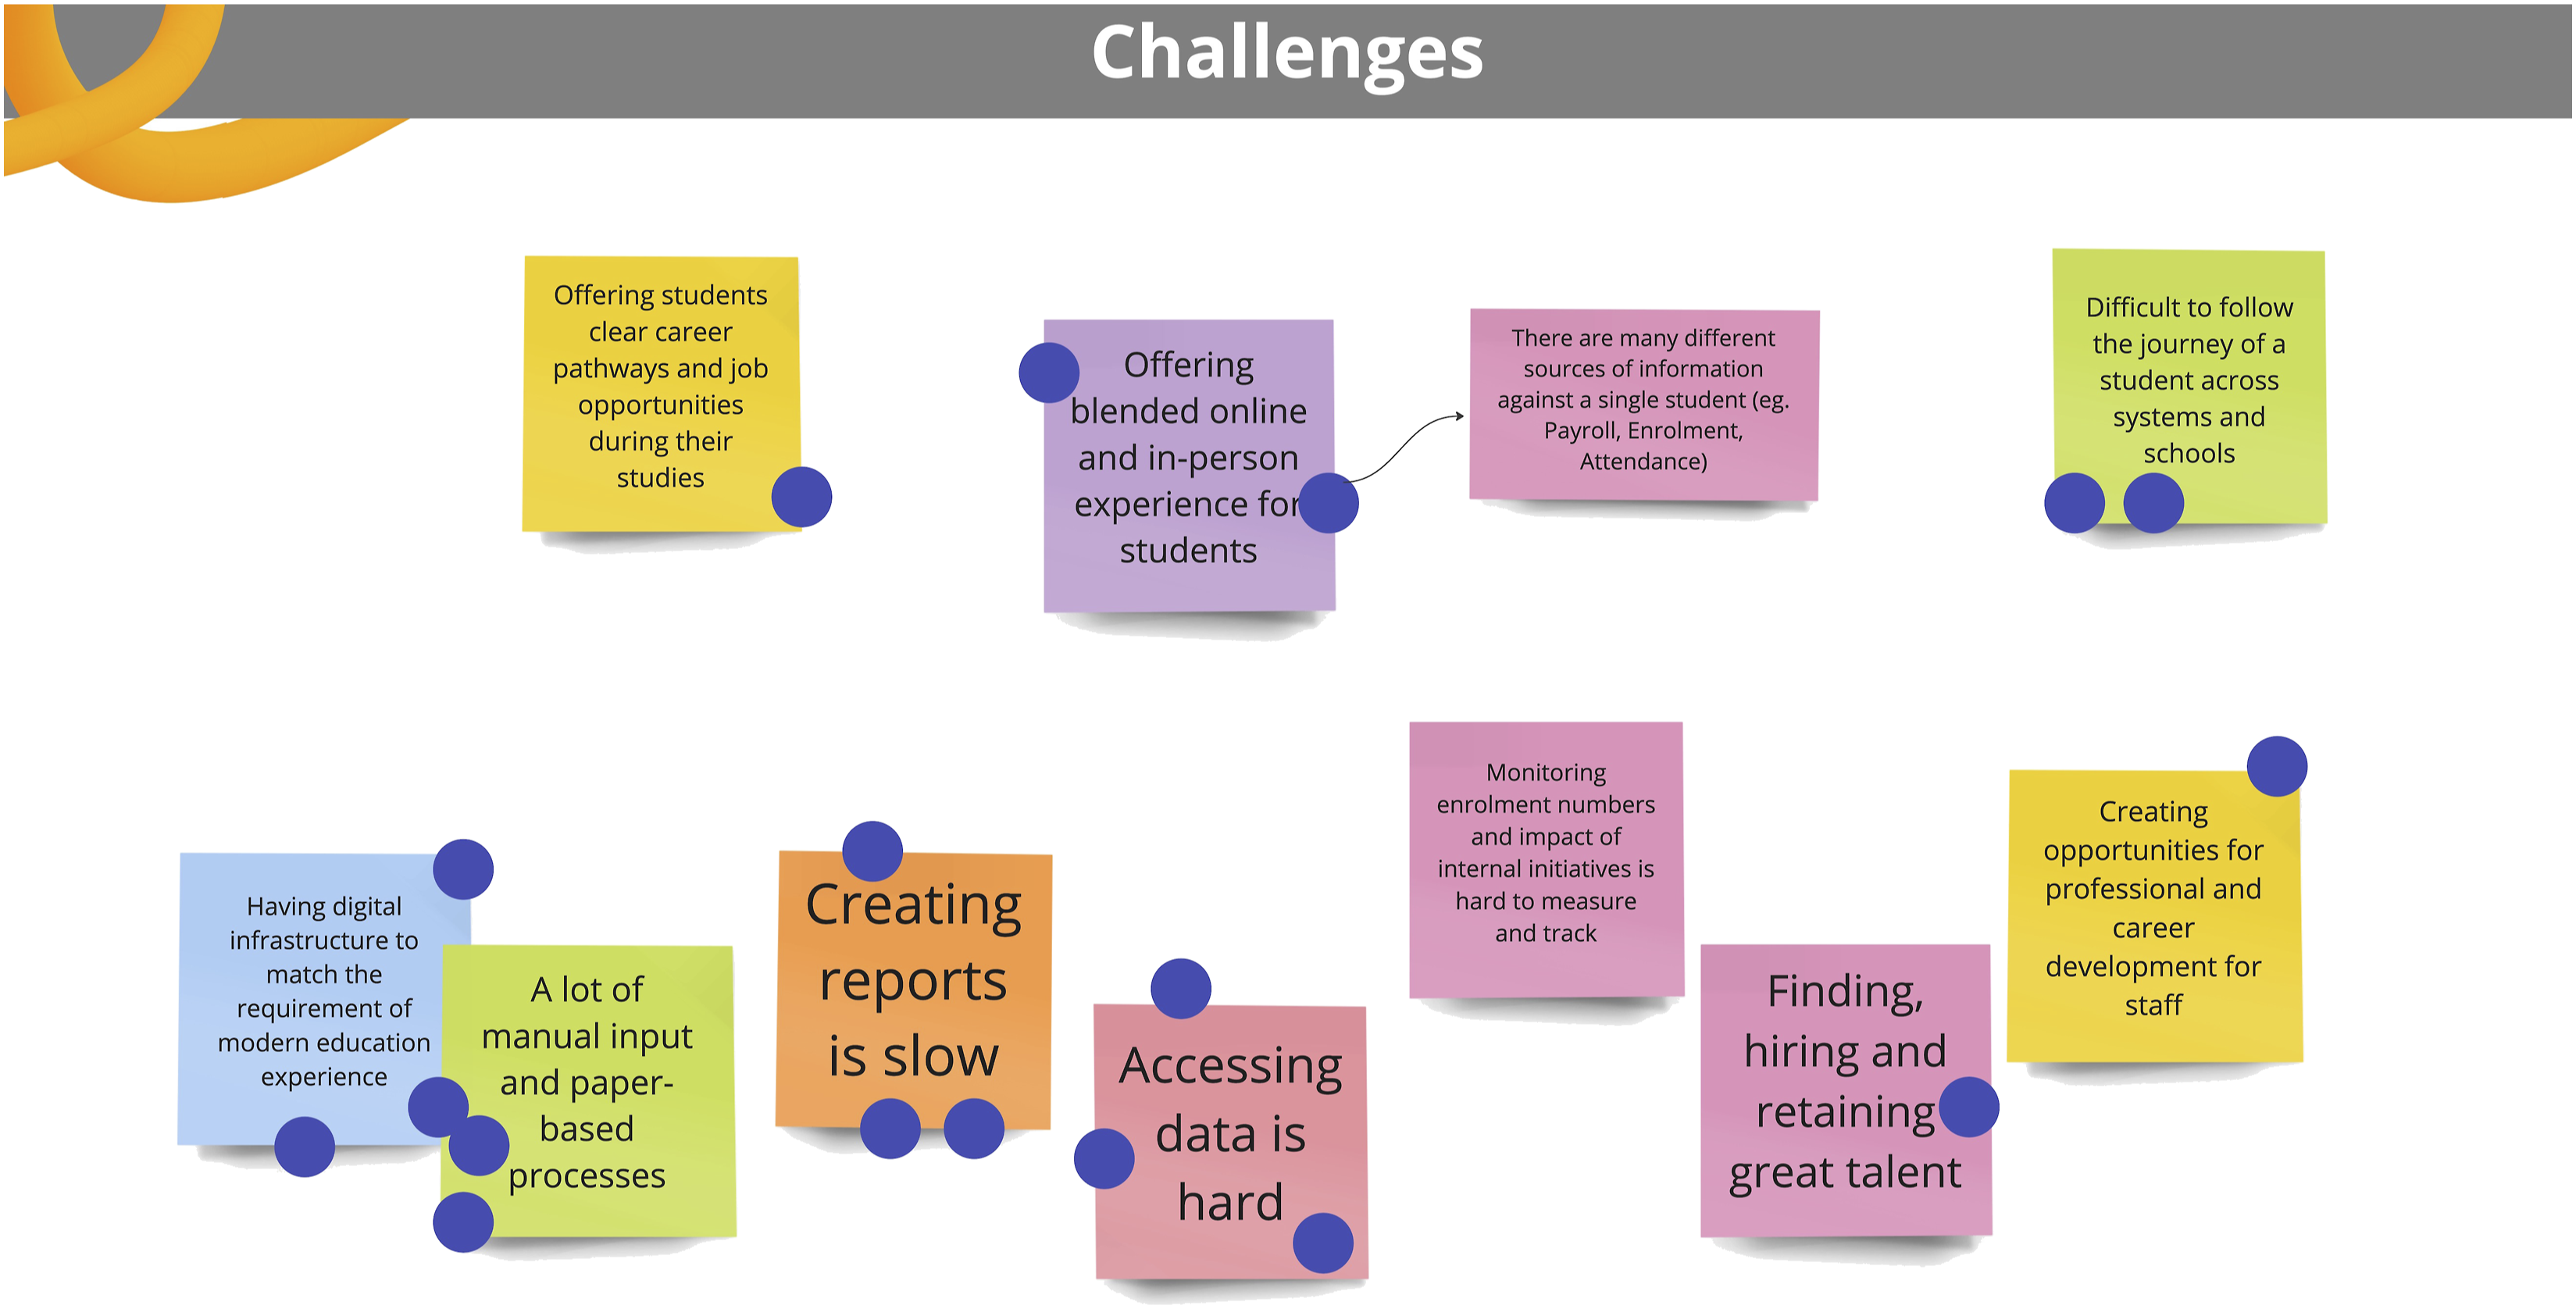
Stakeholder map.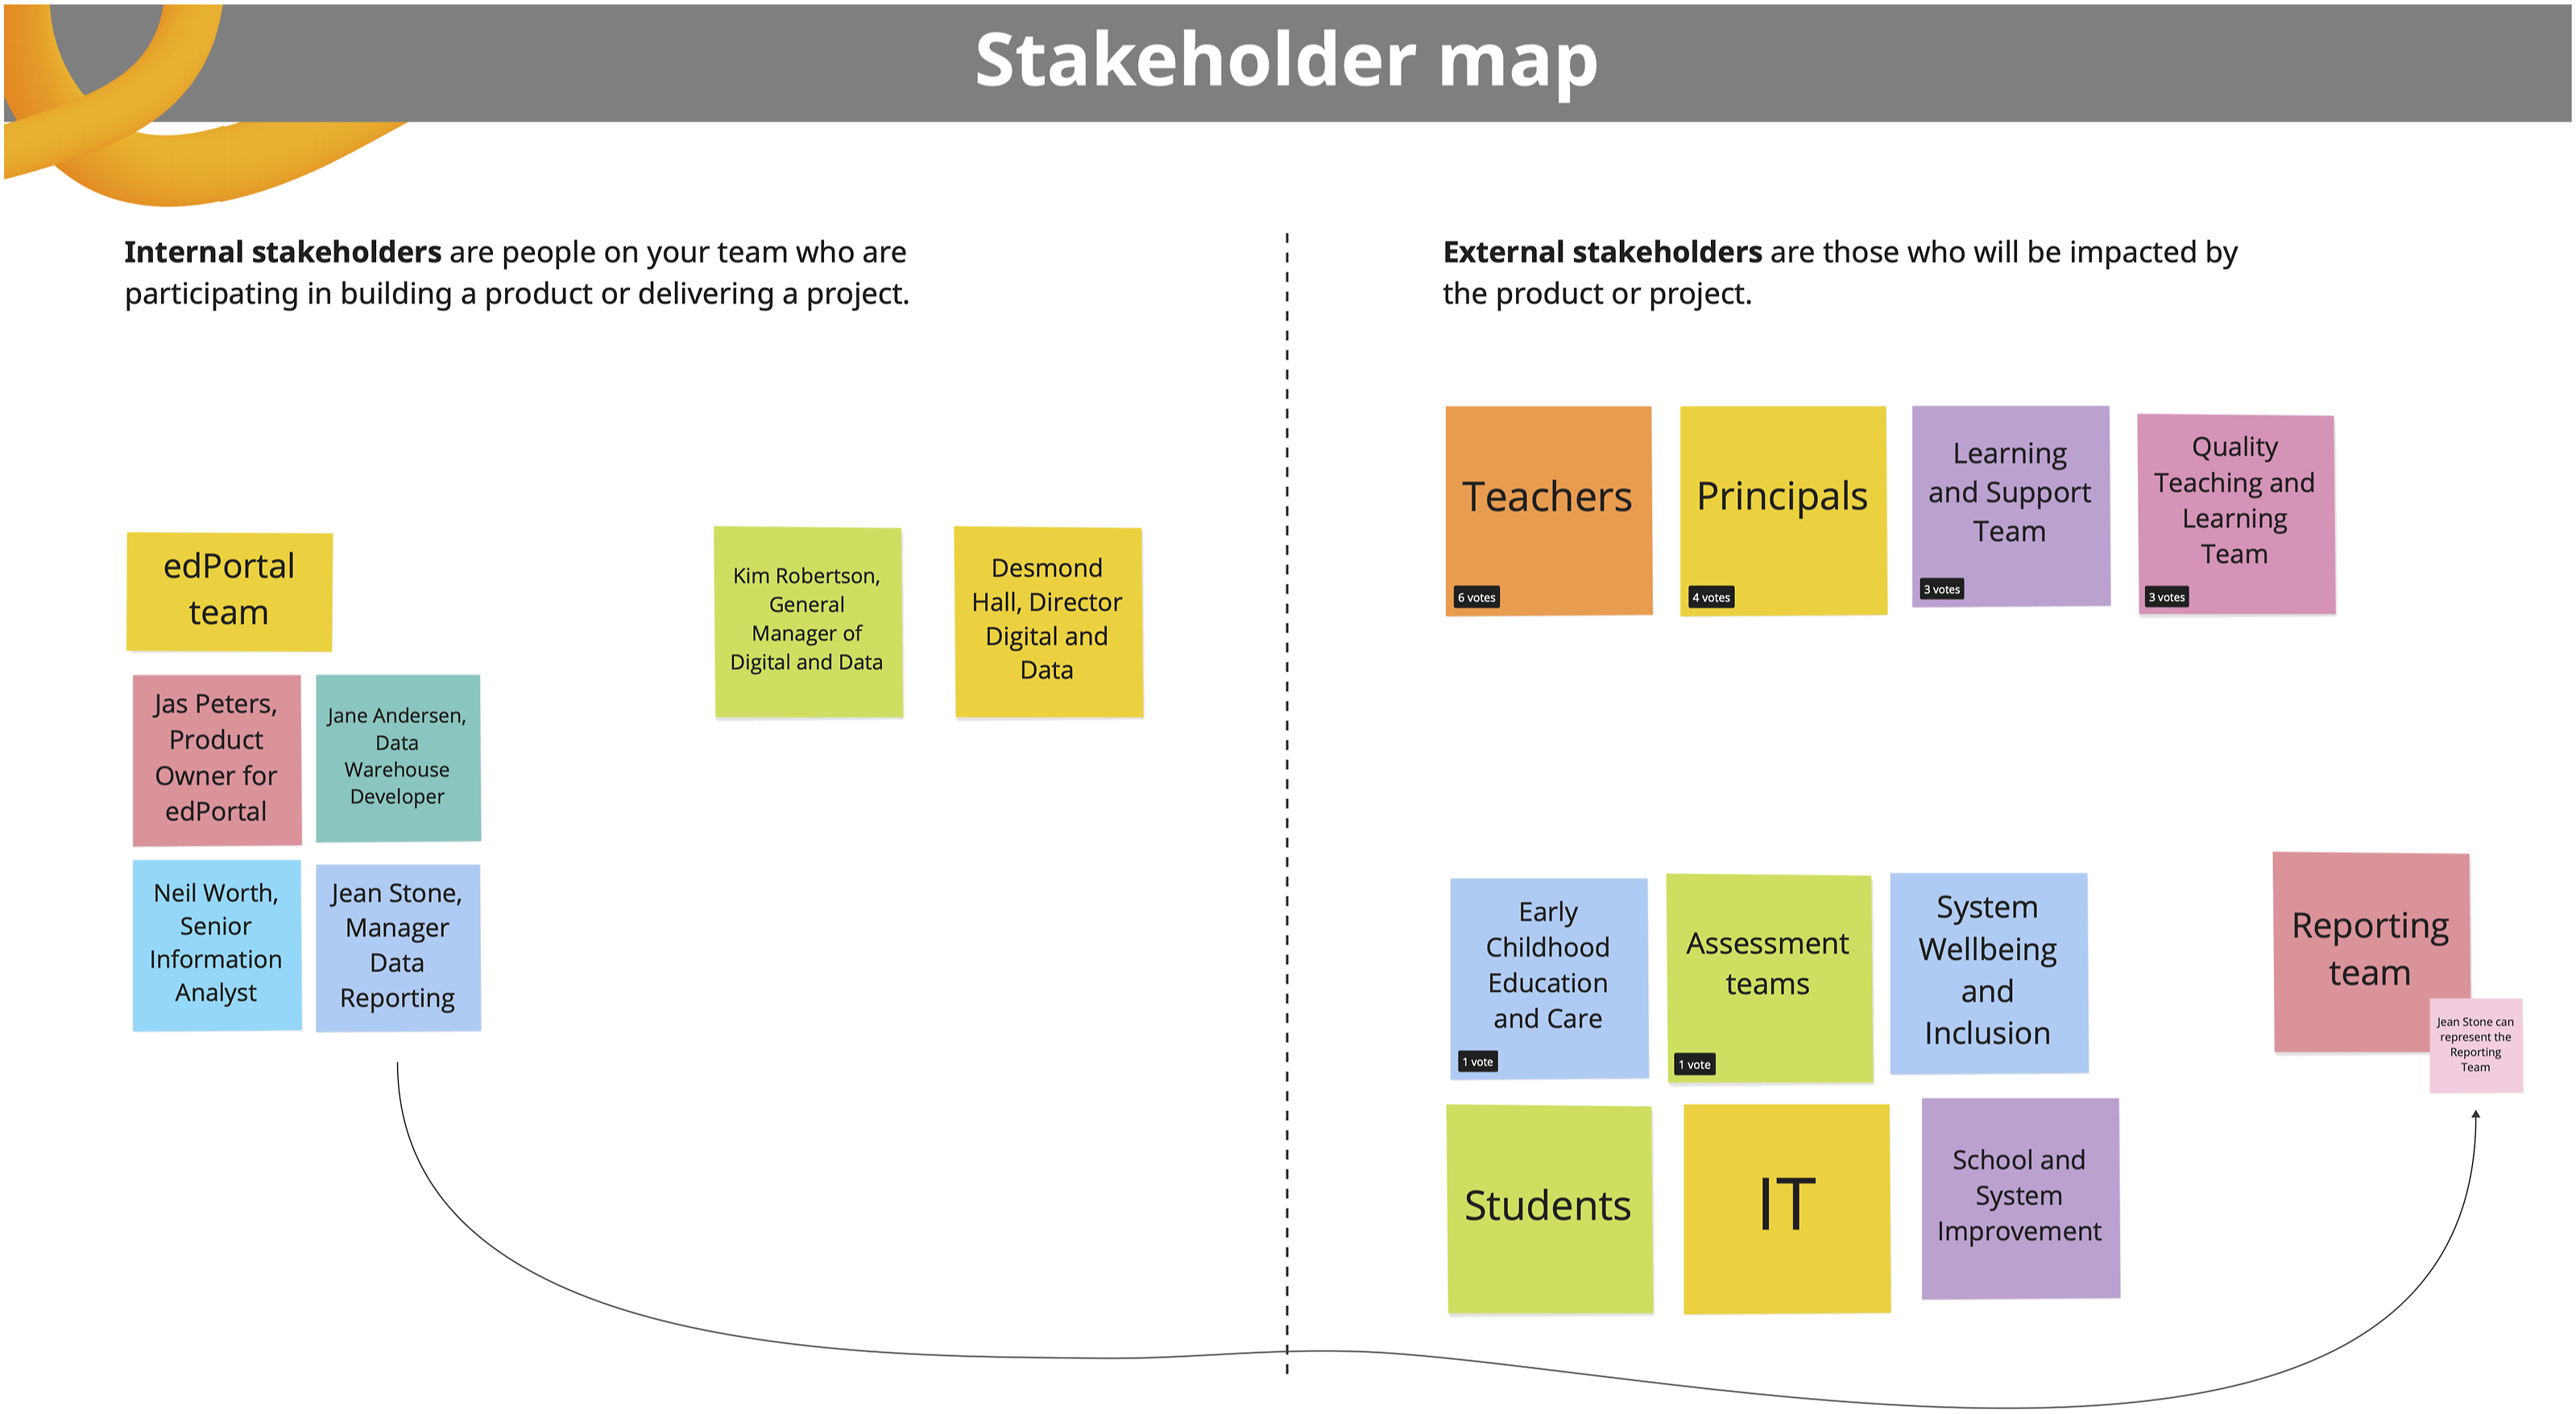
User group profiles.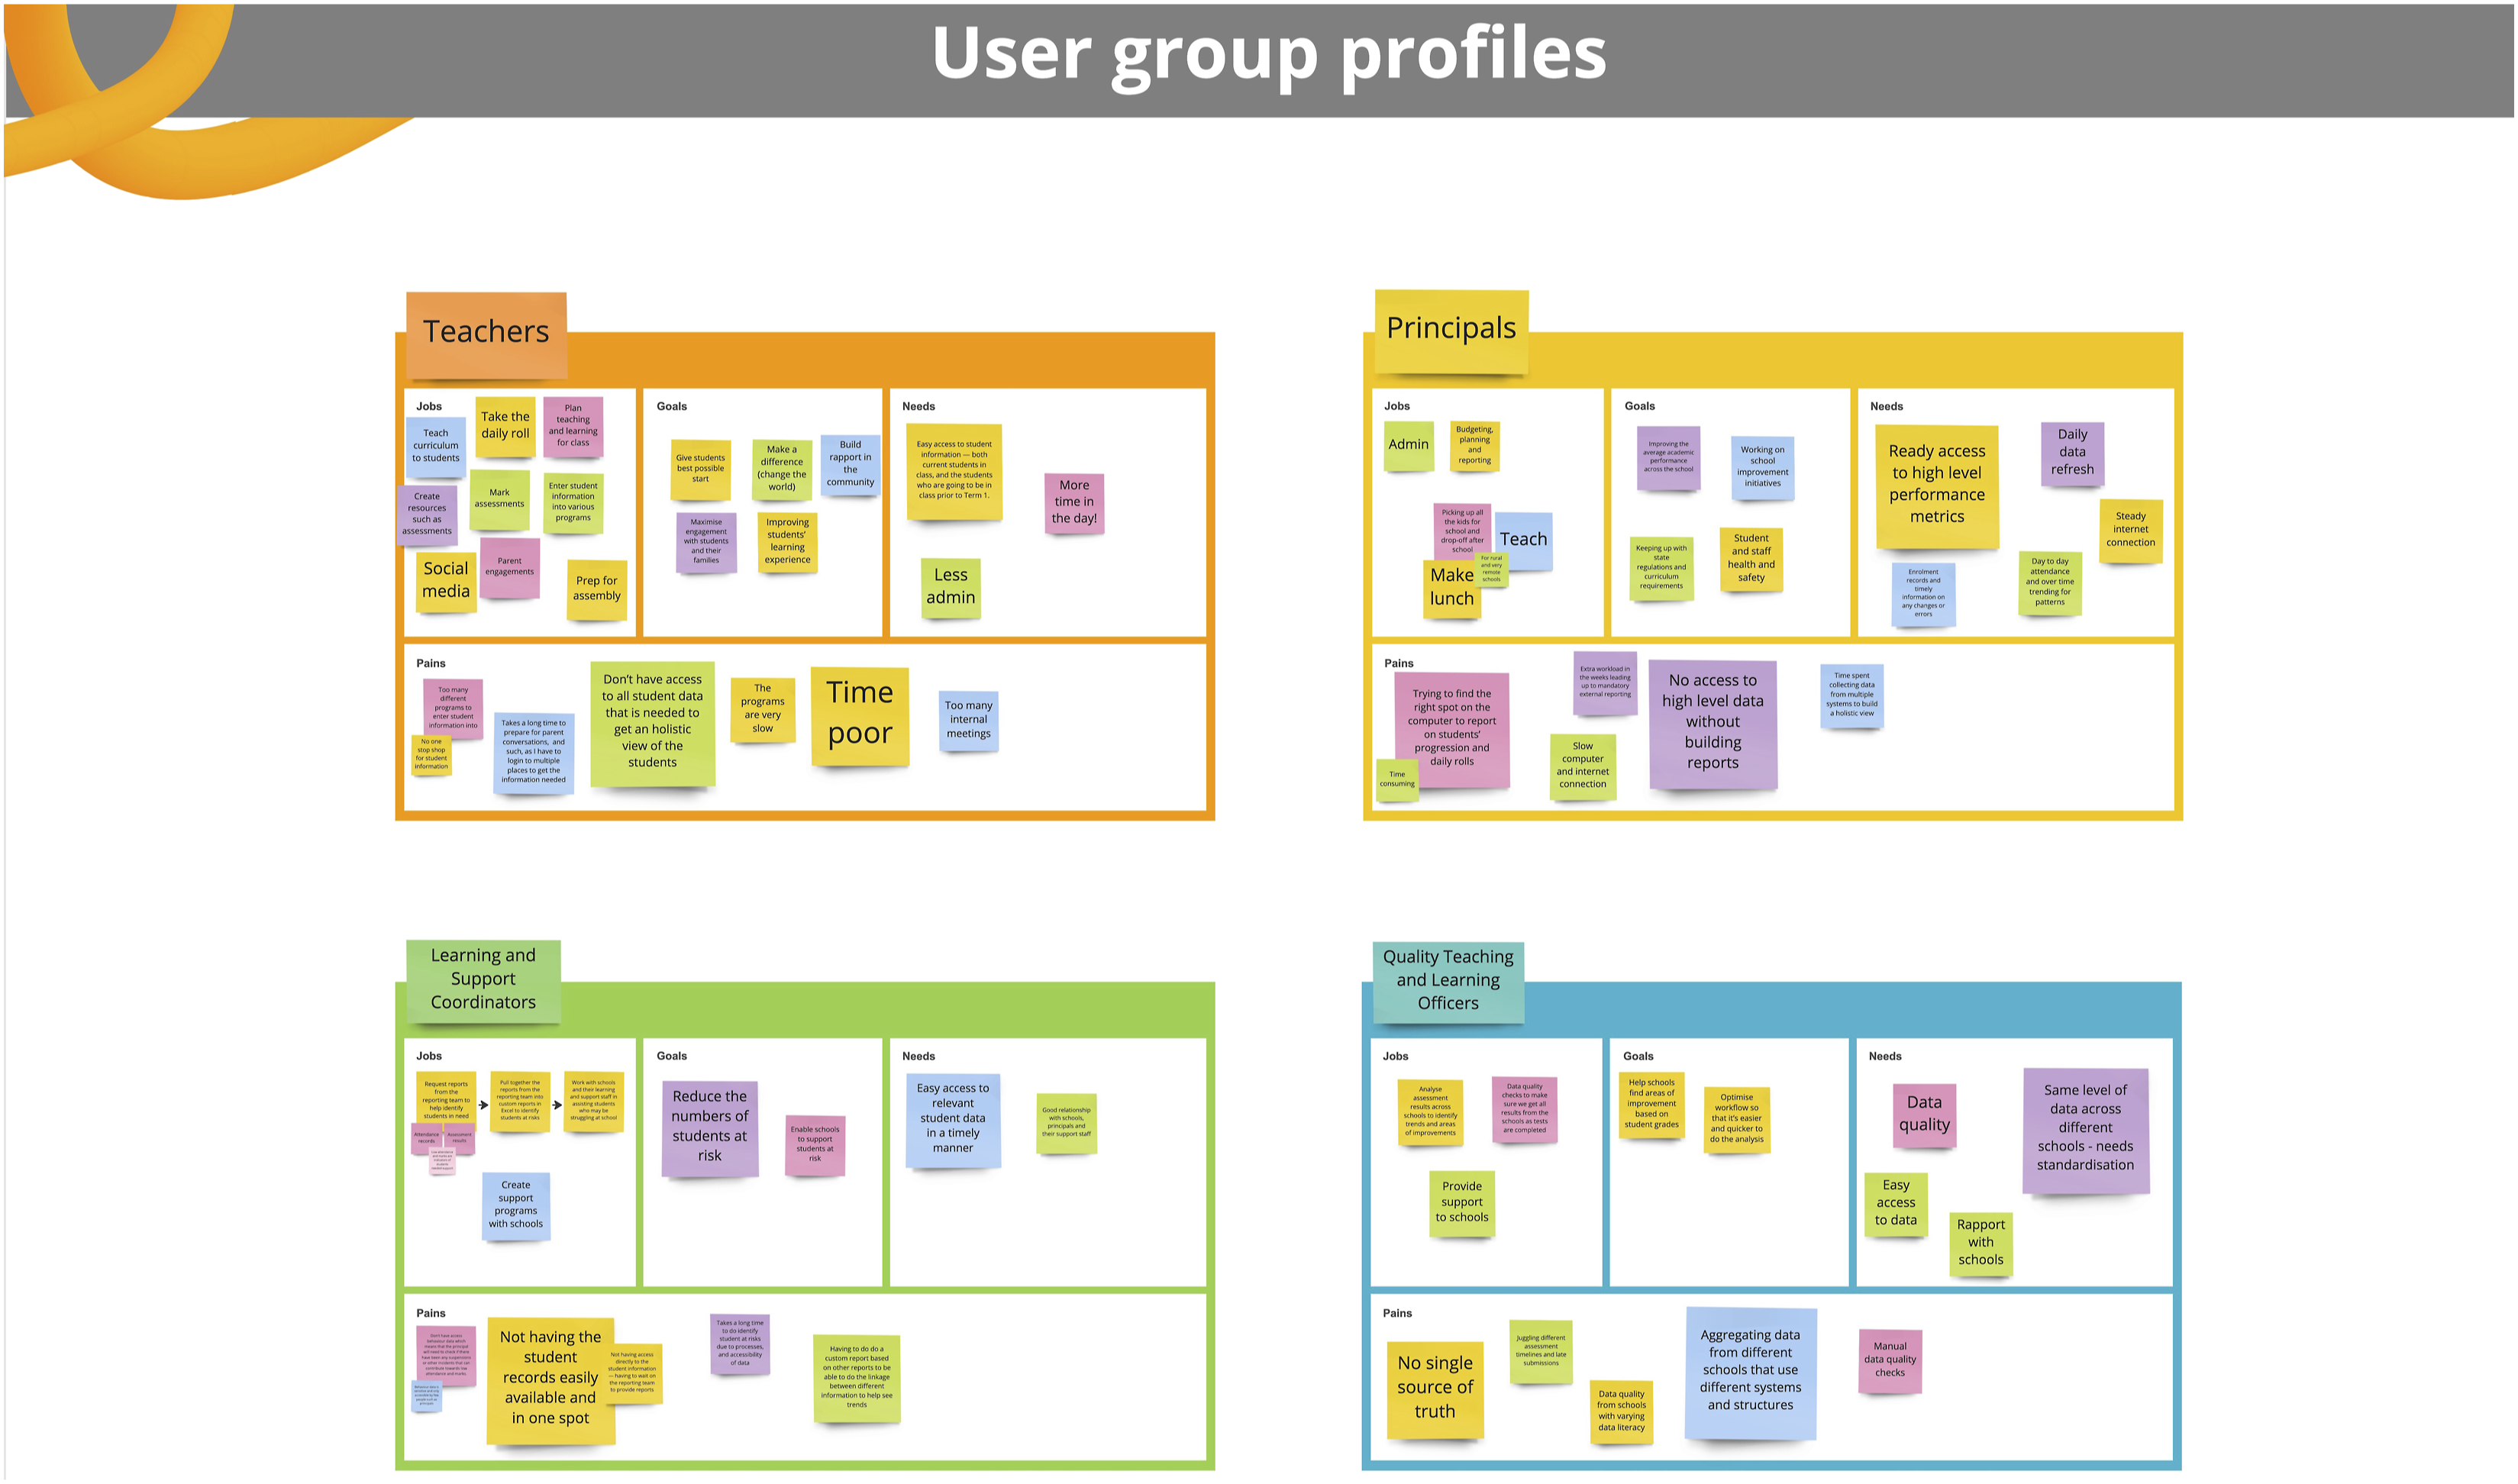
Journey mapping.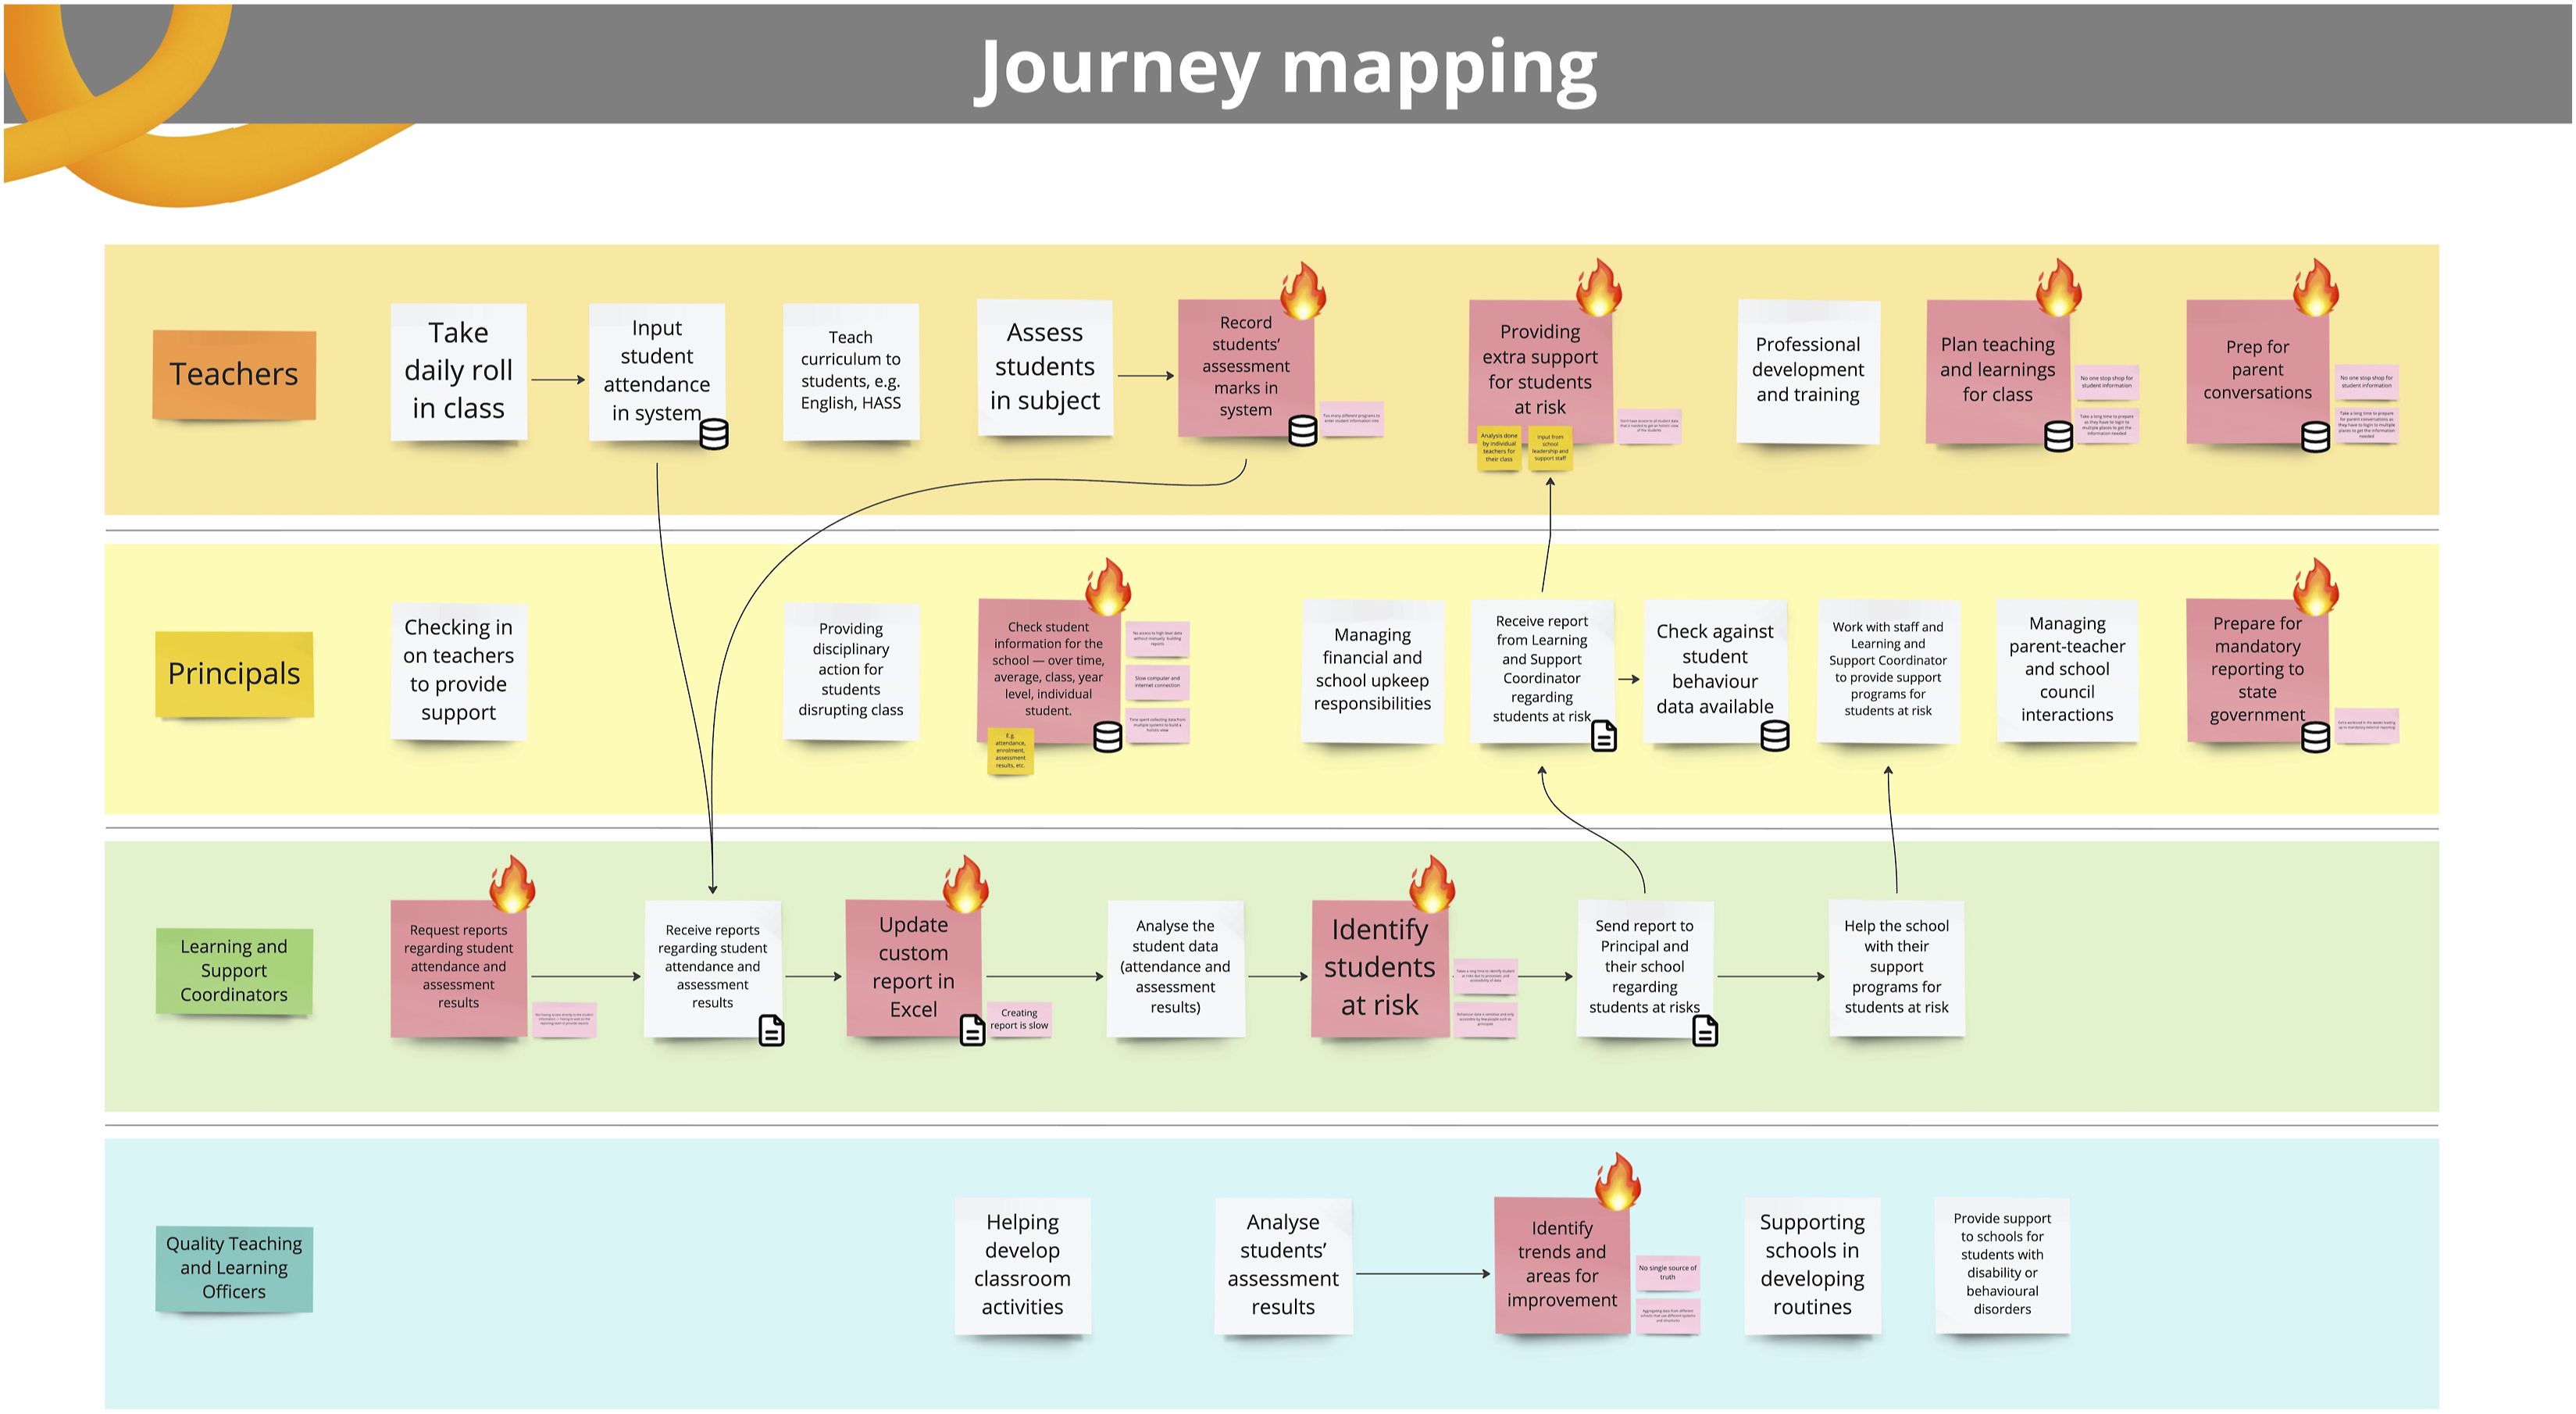
Key users for the initial prototype.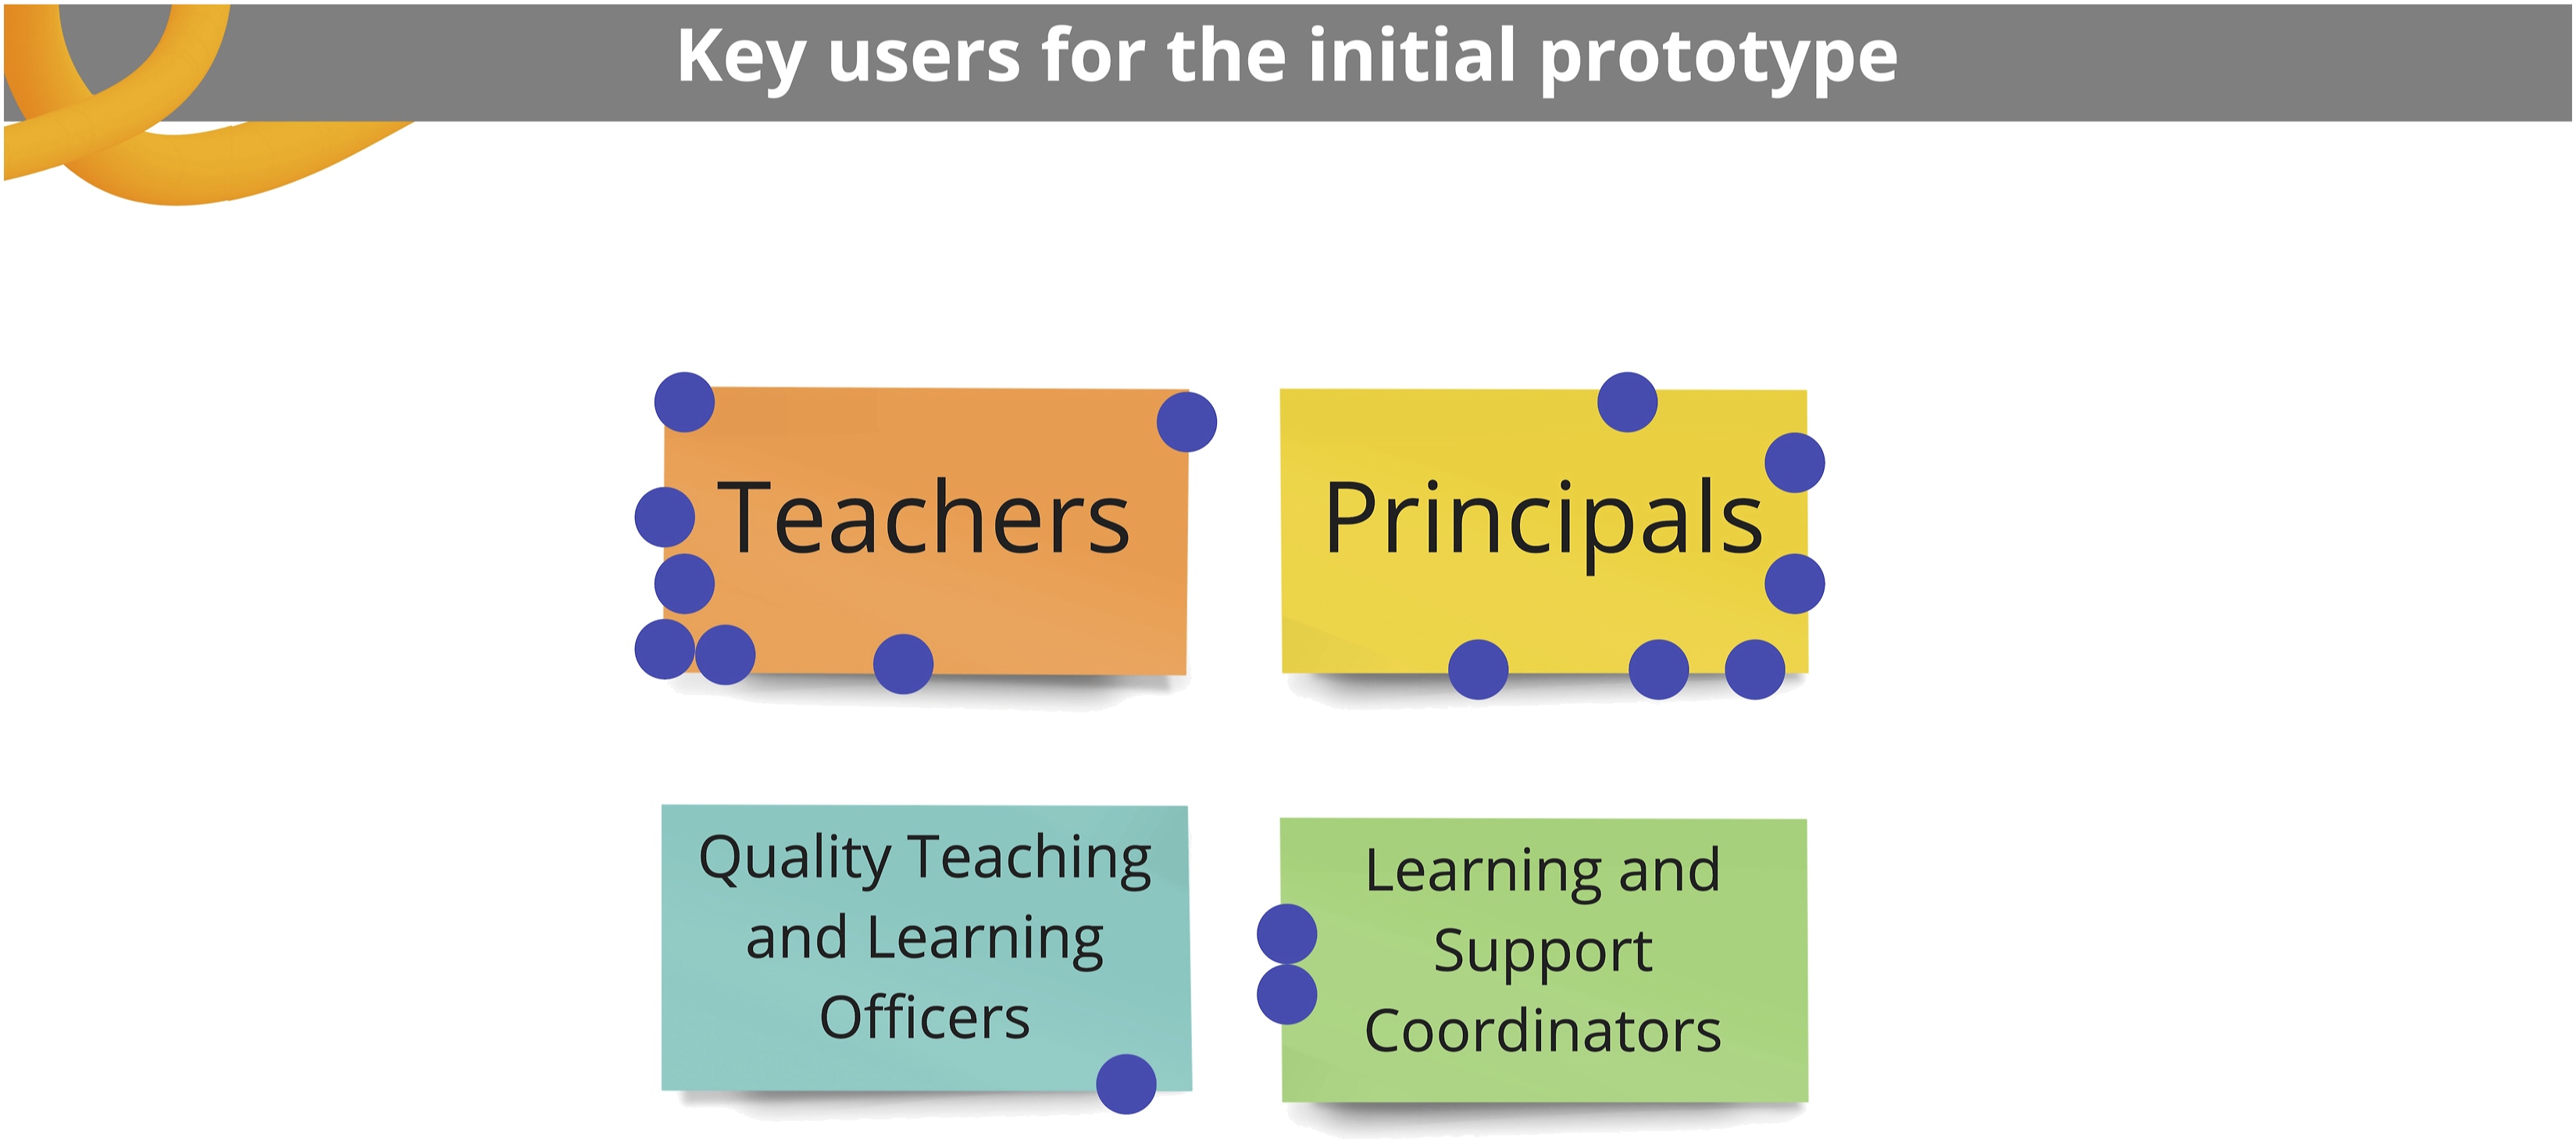
Challenges and pain points.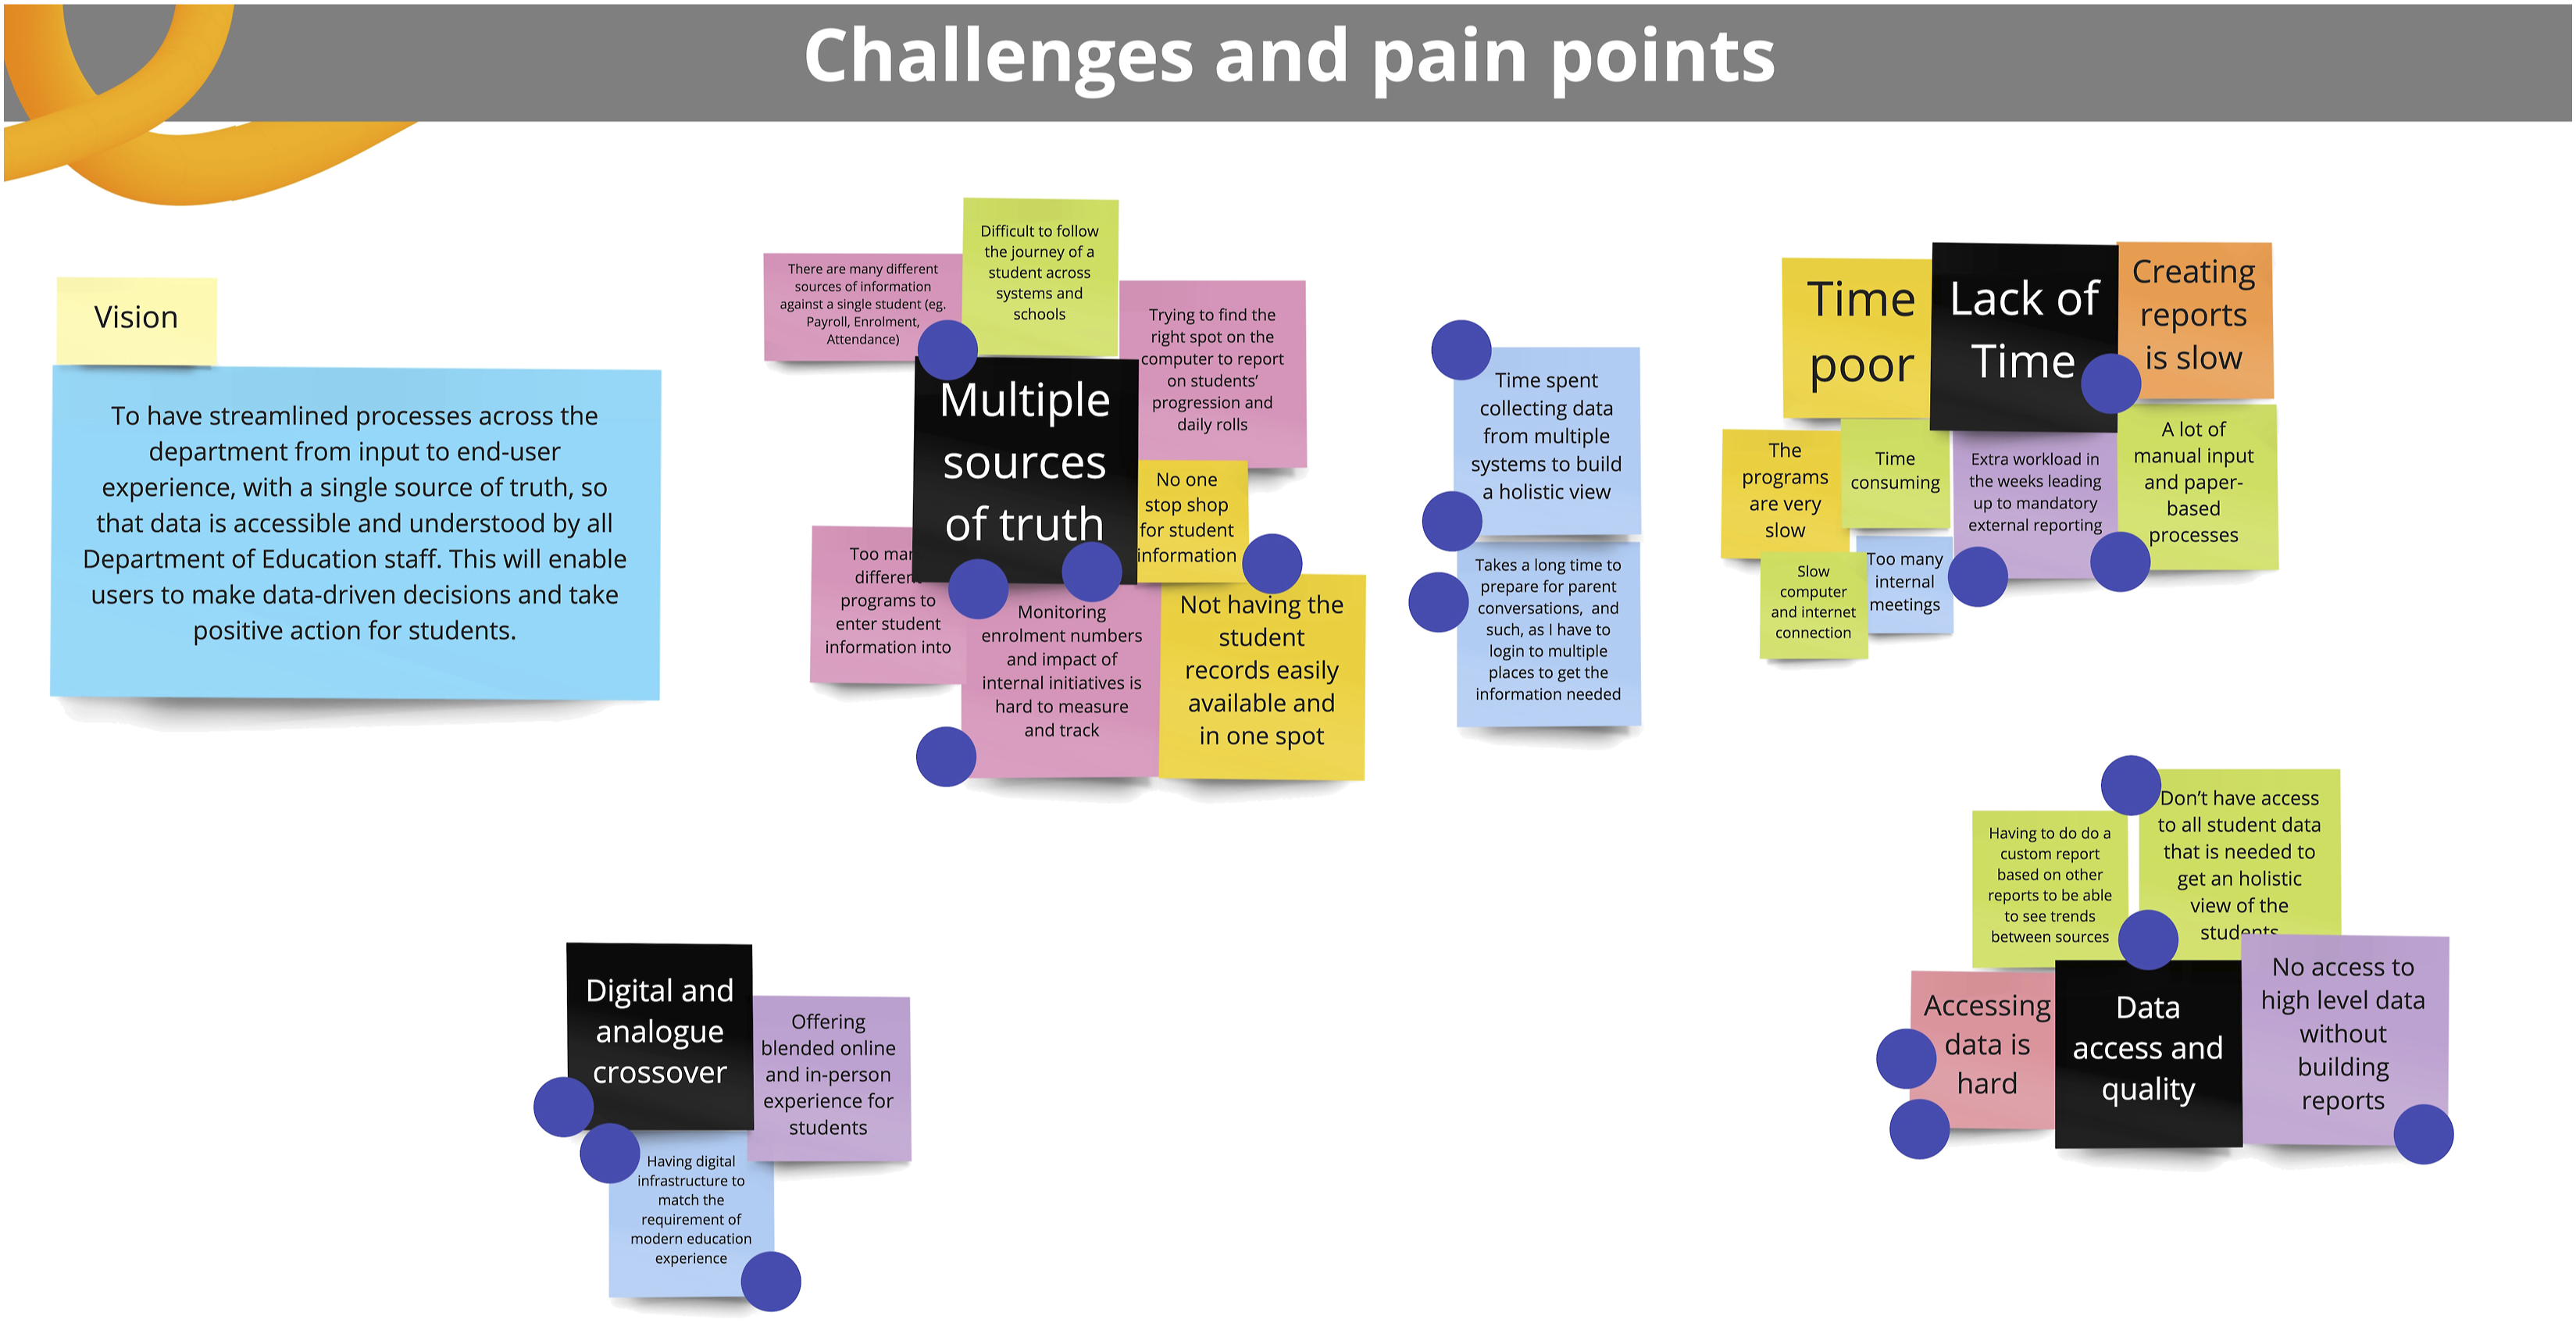
How might we.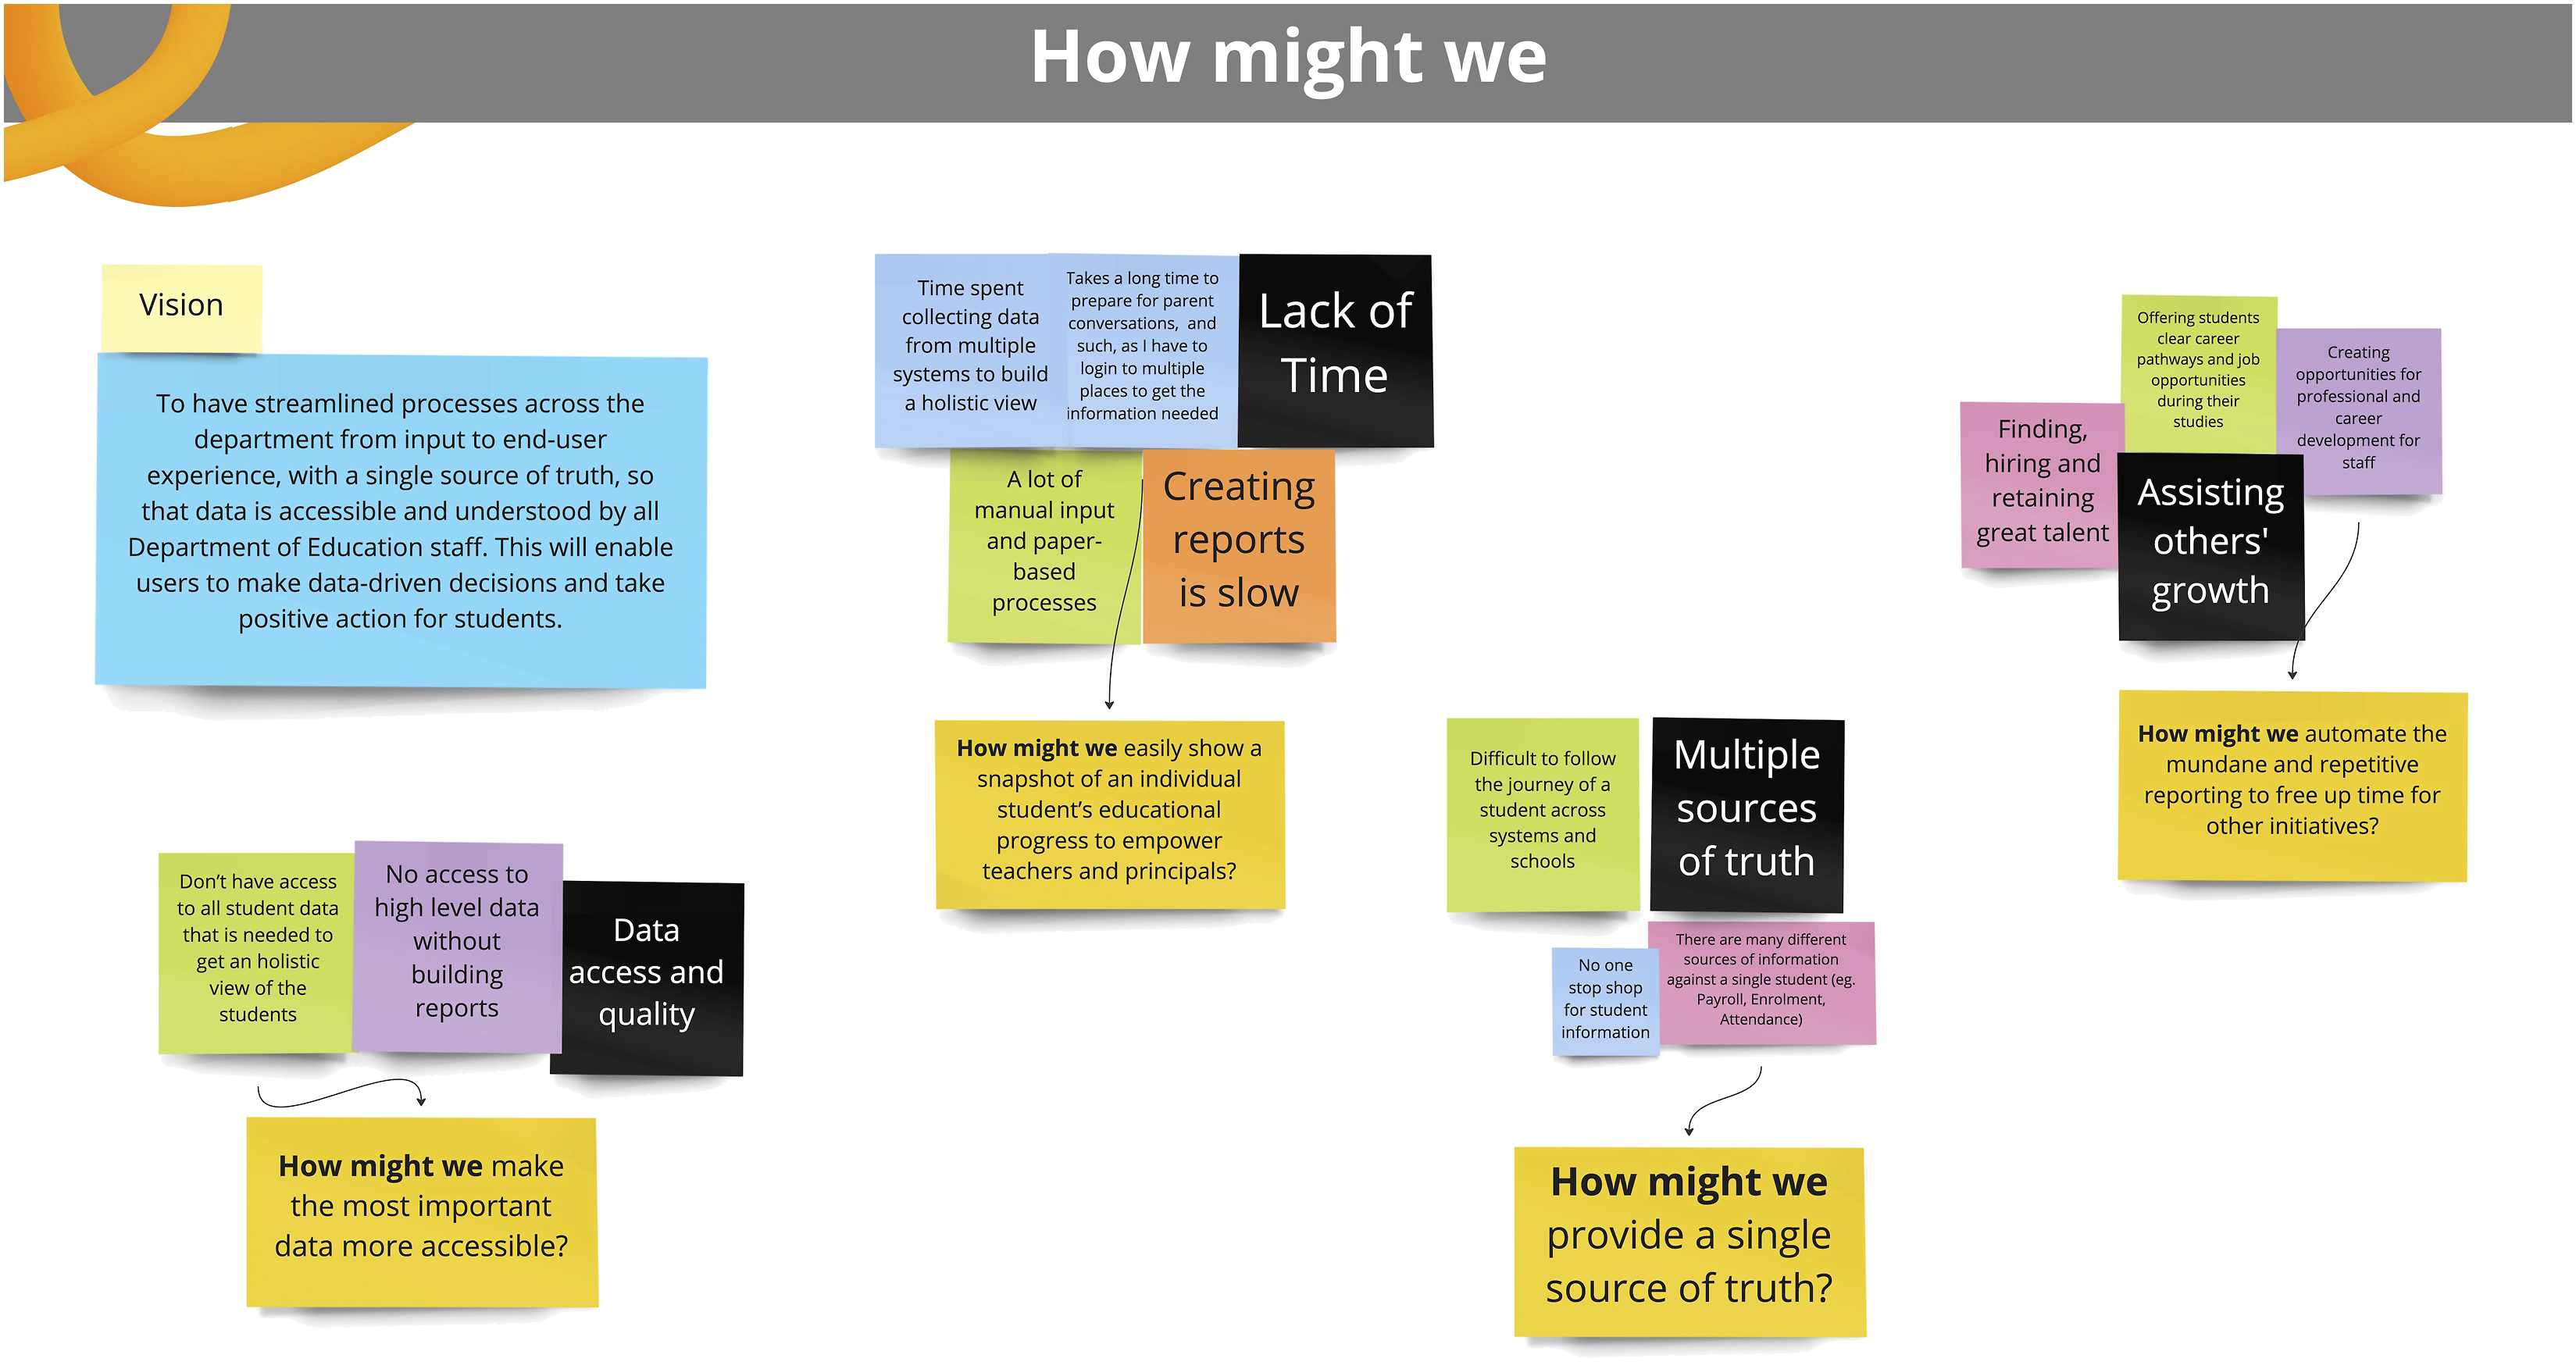
Sketching.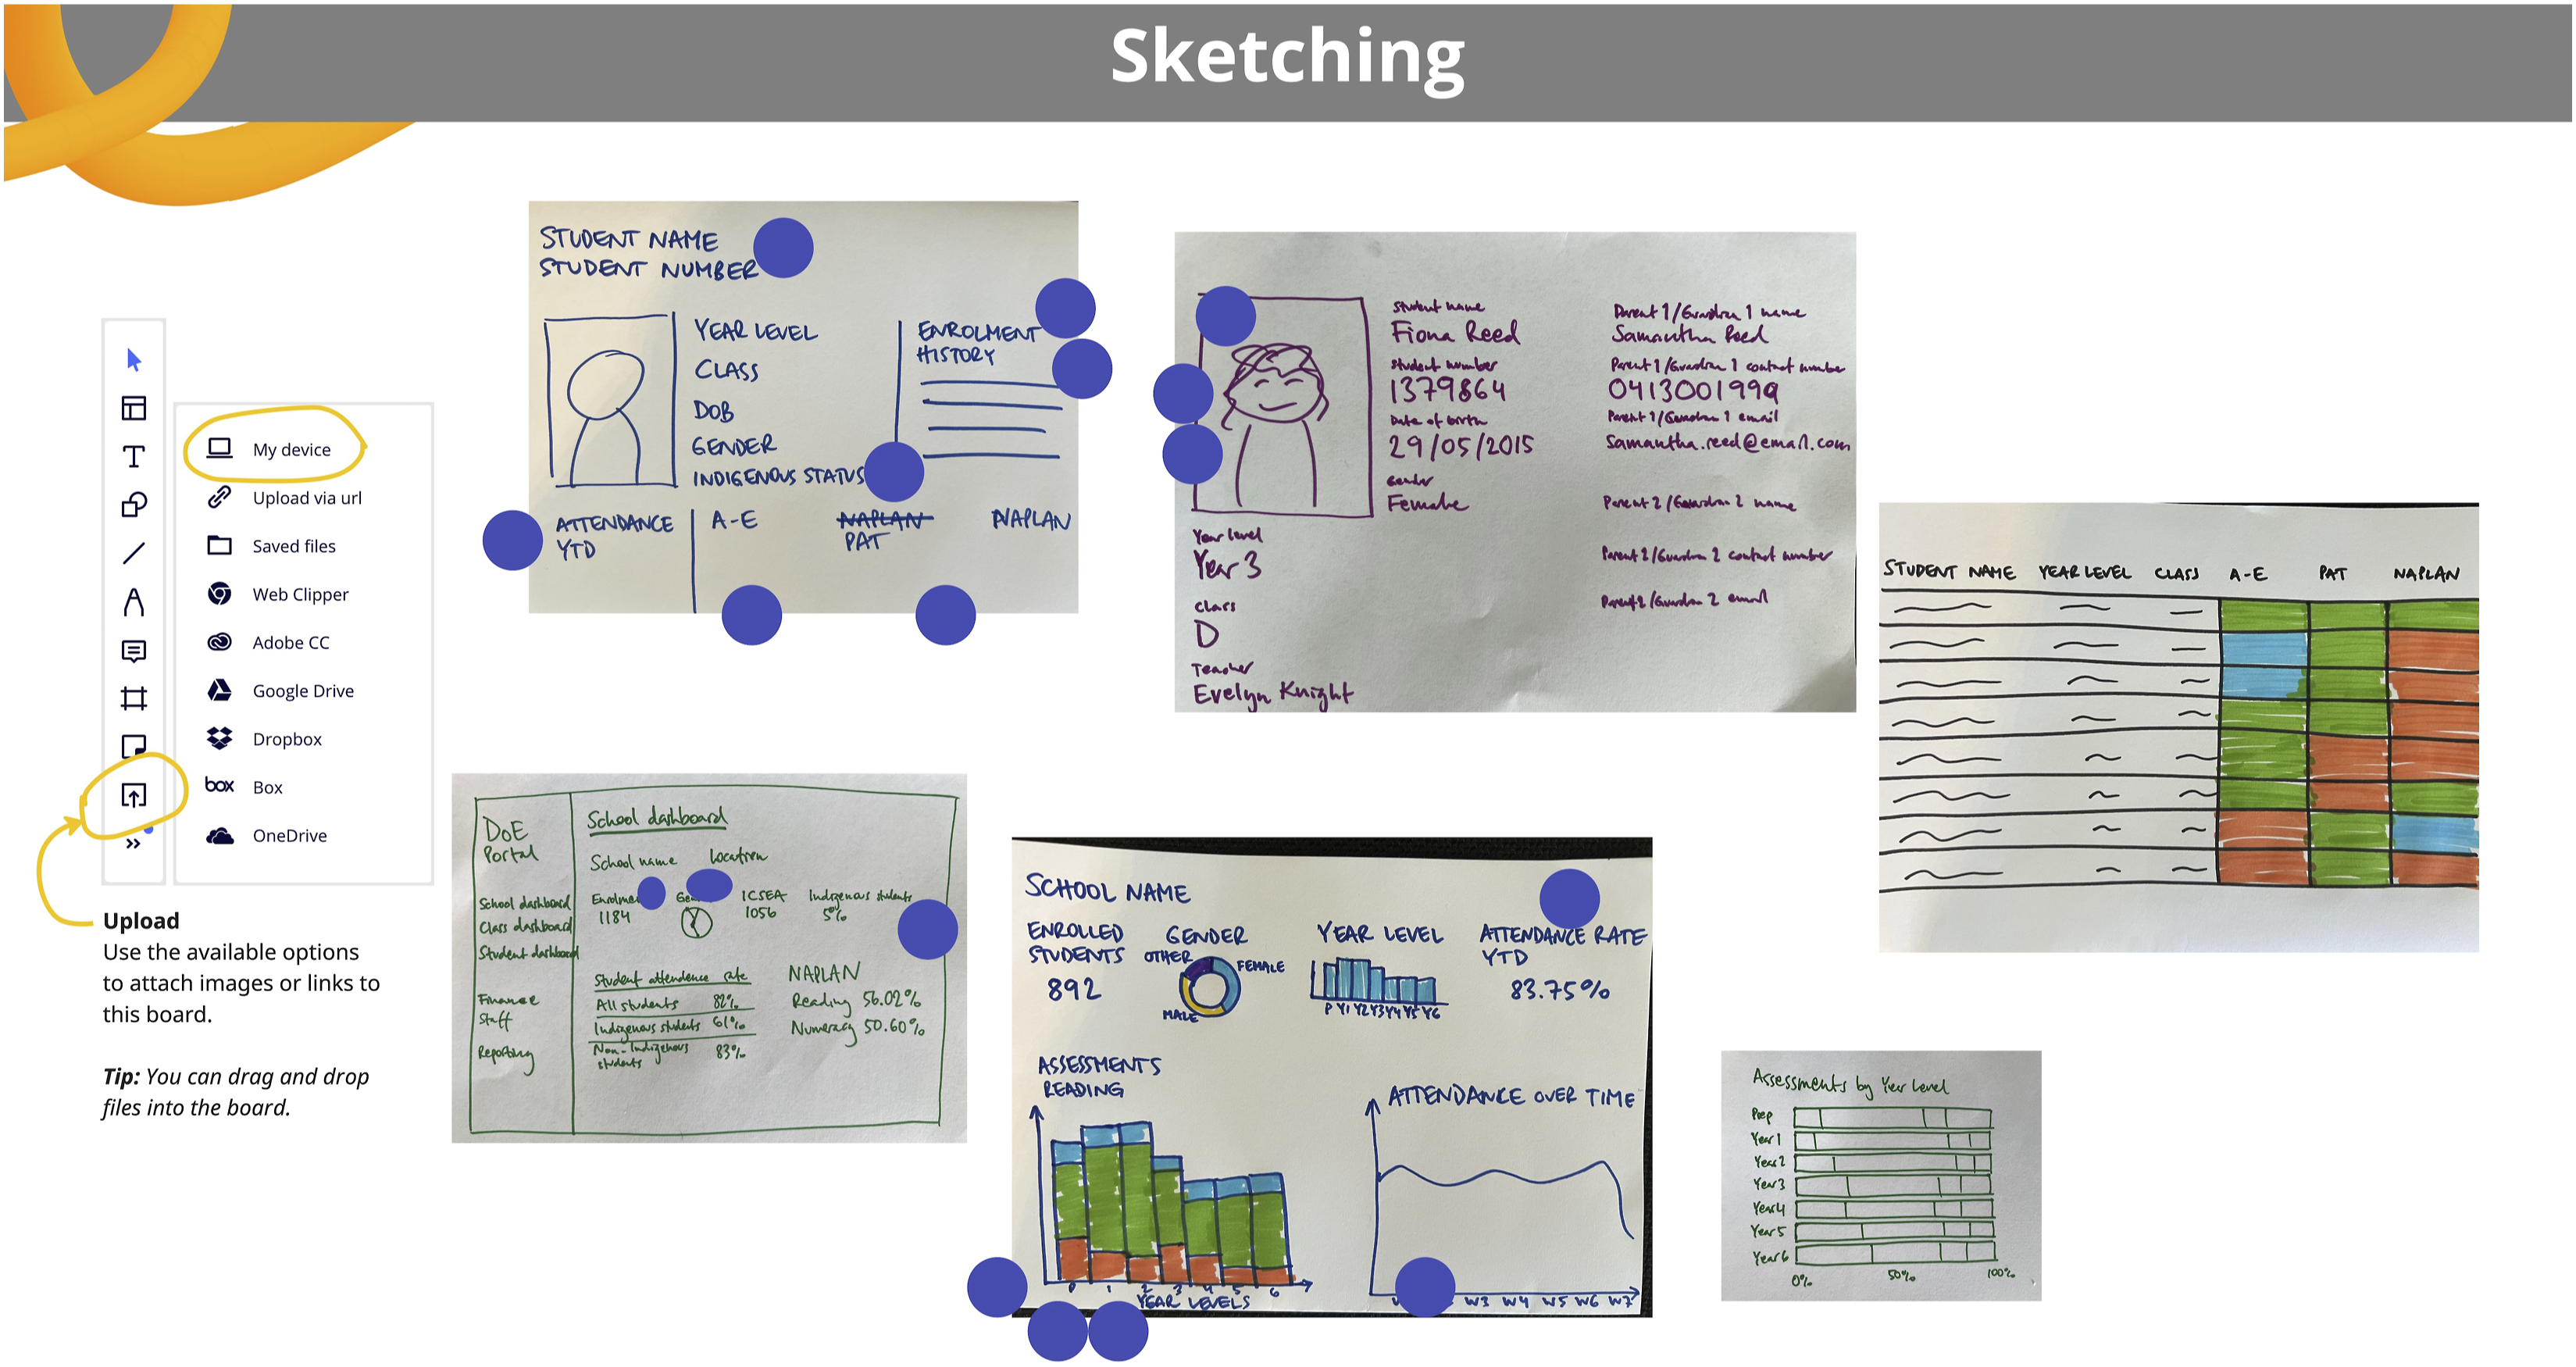
Storyboarding.