
Abstract
Among individuals with schizophrenia, paranoia has been linked to increased resting cerebral blood flow (CBF) in amygdala, suggesting that amygdala hyperactivity may be a mechanism for paranoid ideation. The present study tested this possible mechanism by assessing whether experimentally inducing paranoia in non-clinical, healthy participants resulted in increased amygdala CBF. Sixty-three undergraduates completed initial measurements of paranoia and resting CBF, via pseudo-continuous arterial spin labeling (pCASL) imaging, and were then randomly assigned to either a paranoia induction (n = 32) or control (n = 31) condition before completing a second pCASL scan and another paranoia assessment. Following the induction procedure, individuals in the paranoia induction condition reported fewer positive perceptions of others and greater state anxiety. Resting relative CBF values extracted from right amygdala also demonstrated an increase in CBF over time for individuals in the paranoia induction condition but a decrease in CBF over time for individuals in the control condition. Left amygdala showed no significant effects. These results support the idea that increased resting activity of the amygdala may be a neurobiological mechanism for paranoia.
Keywords
Introduction
Paranoia can be defined as the “unfounded fear that others intend to cause you harm” (Freeman et al., 2008) and includes a number of distressing thoughts characterized by mistrust, suspiciousness, persecutory beliefs, and delusions—the extreme end of this spectrum in which beliefs are incorrect but still held with strong conviction and certainty (Freeman, 2016). Paranoid beliefs are the most commonly reported delusion among individuals diagnosed with schizophrenia spectrum illnesses (Bentall et al., 2009), and paranoia is evident in almost 50% of individuals seeking initial help for a psychotic disorder (Sartorius et al., 1986; Veling et al., 2007). Paranoia occurs in several other psychiatric disorders as well including major depression (Lattuada et al., 1999), bipolar disorder (Goodwin & Jamison, 2007), and PTSD (Kozaric-Kovacic & Borovecki, 2005), demonstrating its transdiagnostic nature. Conservative estimates indicate that 10–15% of the general population also regularly experience paranoid thoughts (Freeman, 2007), suggesting that paranoia exists on a continuum spanning both sub-clinical and clinical levels.
Importantly, across this continuum, paranoia is linked to significant distress and functional impairment. In clinically diagnosed conditions, paranoia is associated with reduced social engagement (Fan et al., 2022), reduced social acceptability (Hajdúk et al., 2019), poorer interpersonal relationships (Pinkham et al., 2016), and increased perceptions of hostility and rejection from others (Januška et al., 2021). At sub-clinical levels, increased paranoia has been linked to reduced relationship satisfaction (Springfield, Ackerman et al., 2021), less social engagement (Hajdúk et al., 2019), and more conflict in relationships and greater vocational difficulties (Rossler et al., 2007). Increased paranoia is also linked to greater suicidality in both clinical (Freeman et al., 2019) and non-clinical samples (Carrillo de Albornoz et al., 2021). The clear impact of paranoia on quality of life underscores the need to understand this phenomenon mechanistically so that interventions can be optimized.
Psychological models of paranoia are relatively well developed and support bi-directional relations between paranoia and negative affectivity (e.g., depression and anxiety), negative self-beliefs, anomalous experiences, and cognitive biases such as blaming others and jumping to conclusions (Bentall et al., 2009; Freeman, 2016). Recent work also implicates neurobiological mechanisms and specifically highlights functioning of the amygdala as a potential causal factor in the etiology and maintenance of paranoia. The amygdala is thought to be critical for processing salience and detecting threat (Adolphs, 2010), and in both clinical and sub-clinical samples, increased resting functional connectivity between amygdala and frontal/visual cortices has been linked to increased paranoia, suggesting that hyperactivity of amygdala may lead to increased perceptions of threat and subsequent paranoid thinking (DeCross et al., 2020; Fan et al., 2021; Walther et al., 2021). Further, in our own work, we found that paranoid individuals with schizophrenia showed increased resting cerebral blood flow (CBF) in amygdala relative to both non-paranoid patients and healthy controls (Pinkham et al., 2015). Related work also reported increased amygdala CBF in individuals with schizophrenia who were higher on an affectivity dimension that included suspiciousness (Stegmayer et al., 2017). Taken together, these findings also support the hypothesis that increased baseline activity of the amygdala may serve as a mechanism for paranoia.
Although these early studies provide strong evidence for the role of amygdala and related circuits in paranoia, the current work is entirely cross-sectional and has largely relied on categorical comparisons between paranoid and non-paranoid groups with clinical diagnoses. In order to move toward causal inference, stronger evidence of temporal dependency is needed and the dimensionality of this potential mechanism must be tested. The current project therefore sought to experimentally induce paranoia in healthy individuals with varying levels of pre-existing paranoid ideation and examine the resulting effects on amygdala resting CBF. Such a design represents a relatively rare opportunity to experimentally manipulate the clinical variable of interest (i.e., paranoia) rather than relying on the more typical passive experimental design based on group membership, and in our opinion represents a much riskier test (see Vaidyanathan et al., 2015) than is typically able to be conducted in psychopathology research.
Participants completed an initial measurement of amygdala CBF and then were randomly assigned to either a paranoia induction condition or a control condition, both of which were followed by another measurement of amygdala CBF. Resting levels of amygdala CBF were obtained using pseudo-continuous arterial spin labeling (pCASL) imaging, which uses magnetically labeled arterial blood water as an endogenous tracer to provide quantitative measurements (Detre et al., 1992; Williams et al., 1992). We hypothesized that participants completing the paranoia induction procedure would show increased resting CBF in amygdala relative to both their pre-induction levels (i.e., a within-subject effect) and relative to individuals in the control condition (i.e., a between subject effect).
Methods
Participants
Healthy undergraduate students participating in The University of Texas at Dallas (UTD) Psychology Subject Pool were screened for level of subclinical paranoia using the Paranoia Scale (described below). These scores were then used to identify 70 individuals who were invited to participate in the study. This approach ensured that individuals with a range of pre-existing paranoia levels were recruited into the study and allowed for matching individuals on levels of paranoia prior to randomly assigning them to study conditions.
To be included, participants had to be: (1) between the ages 18 and 55, (2) proficient in English, (3) able to provide informed consent, and (4) have no contraindications for MRI. Participants were ineligible if they reported: 1) diagnosis of any DSM-5 disorder or taking any psychotropic medications, 2) experience of head trauma with loss of consciousness of >15 minutes, 3) diagnosis of neurological (e.g., stroke, epilepsy) or neurodegenerative disorder (e.g., dementia, Parkinson’s Disease), 4) sensory impairments that preclude assessments, 5) a diagnosis of intellectual disability (IQ < 70), or 6) were unable to arrive for screening or assessment in a non-intoxicated state.
Measures
The Paranoia Scale (PS; Fenigstein & Vanable, 1992) is a self-report measure of paranoia that was originally developed for use in healthy populations and that is geared toward quantifying trait levels of paranoid thinking. Individuals are asked to indicate how strongly each of 20 statements (e.g., “It is safer to trust no one”) applies to them on a scale from 1 (not at all applicable to me) to 5 (extremely applicable to me). Scores range from 20–100 with higher scores indicating greater levels of paranoid thinking.
The State Social Paranoia Scale (SSPS; Freeman et al., 2007) is a 20-item self-report measure of current paranoia. Items are rated on a 5-point scale from 1 (do not agree) to 5 (totally agree). The scale includes three subscales: Persecution (e.g., “Someone wanted me to feel threatened”); Neutral (e.g., “I wasn’t really noticed by anybody”), and Positive (e.g., “Everyone is trustworthy”). The Persecution subscale has 10 items with scores ranging from 10–50 with higher scores indicating greater paranoia. The Neutral and Positive subscales have 5-items each, with scores ranging from 5–25.
The state portion of the State-Trait Anxiety Inventory (STAI-S; Spielberger, 1983) was administered to quantify current anxiety, which was used as a control variable. The measure includes 20 items rated by the participant on a 4-point scale from 1 (not at all) to 4 (very much so). Higher scores indicate more anxiety (range = 20–80).
Design and procedure
As noted above, healthy undergraduate students were screened with the PS, and 35 matched pairs were selected and enrolled in the study. Following provision of written informed consent and before entering the scanner, participants completed the PS again, as well as the SSPS and the STAI-S. Participants then entered the scanner and completed the first of two resting arterial spin labeling acquisitions (ASL-pre). They then were randomized to receive either the paranoia induction procedure (n = 35) or the control condition (n = 35), both lasting approximately 30 minutes and described below. Following the experimental manipulation, participants completed their second ASL acquisition (ASL-post), which concluded the imaging session. Once participants were removed from the scanner, they again completed the SSPS and the STAI-S and were then fully debriefed. The study design is shown in Figure 1. The study protocol was approved by the institutional review boards of UTD (IRB # 17–44) and the University of Texas Southwestern Medical School (STU 112016-078) (UTSW), where imaging took place. Study design and procedures. Note. PS = Paranoia Scale; STAI-S = State Trait Anxiety Inventory – State; SSPS = State Social Paranoia Scale; ASL = Arterial spin labeling.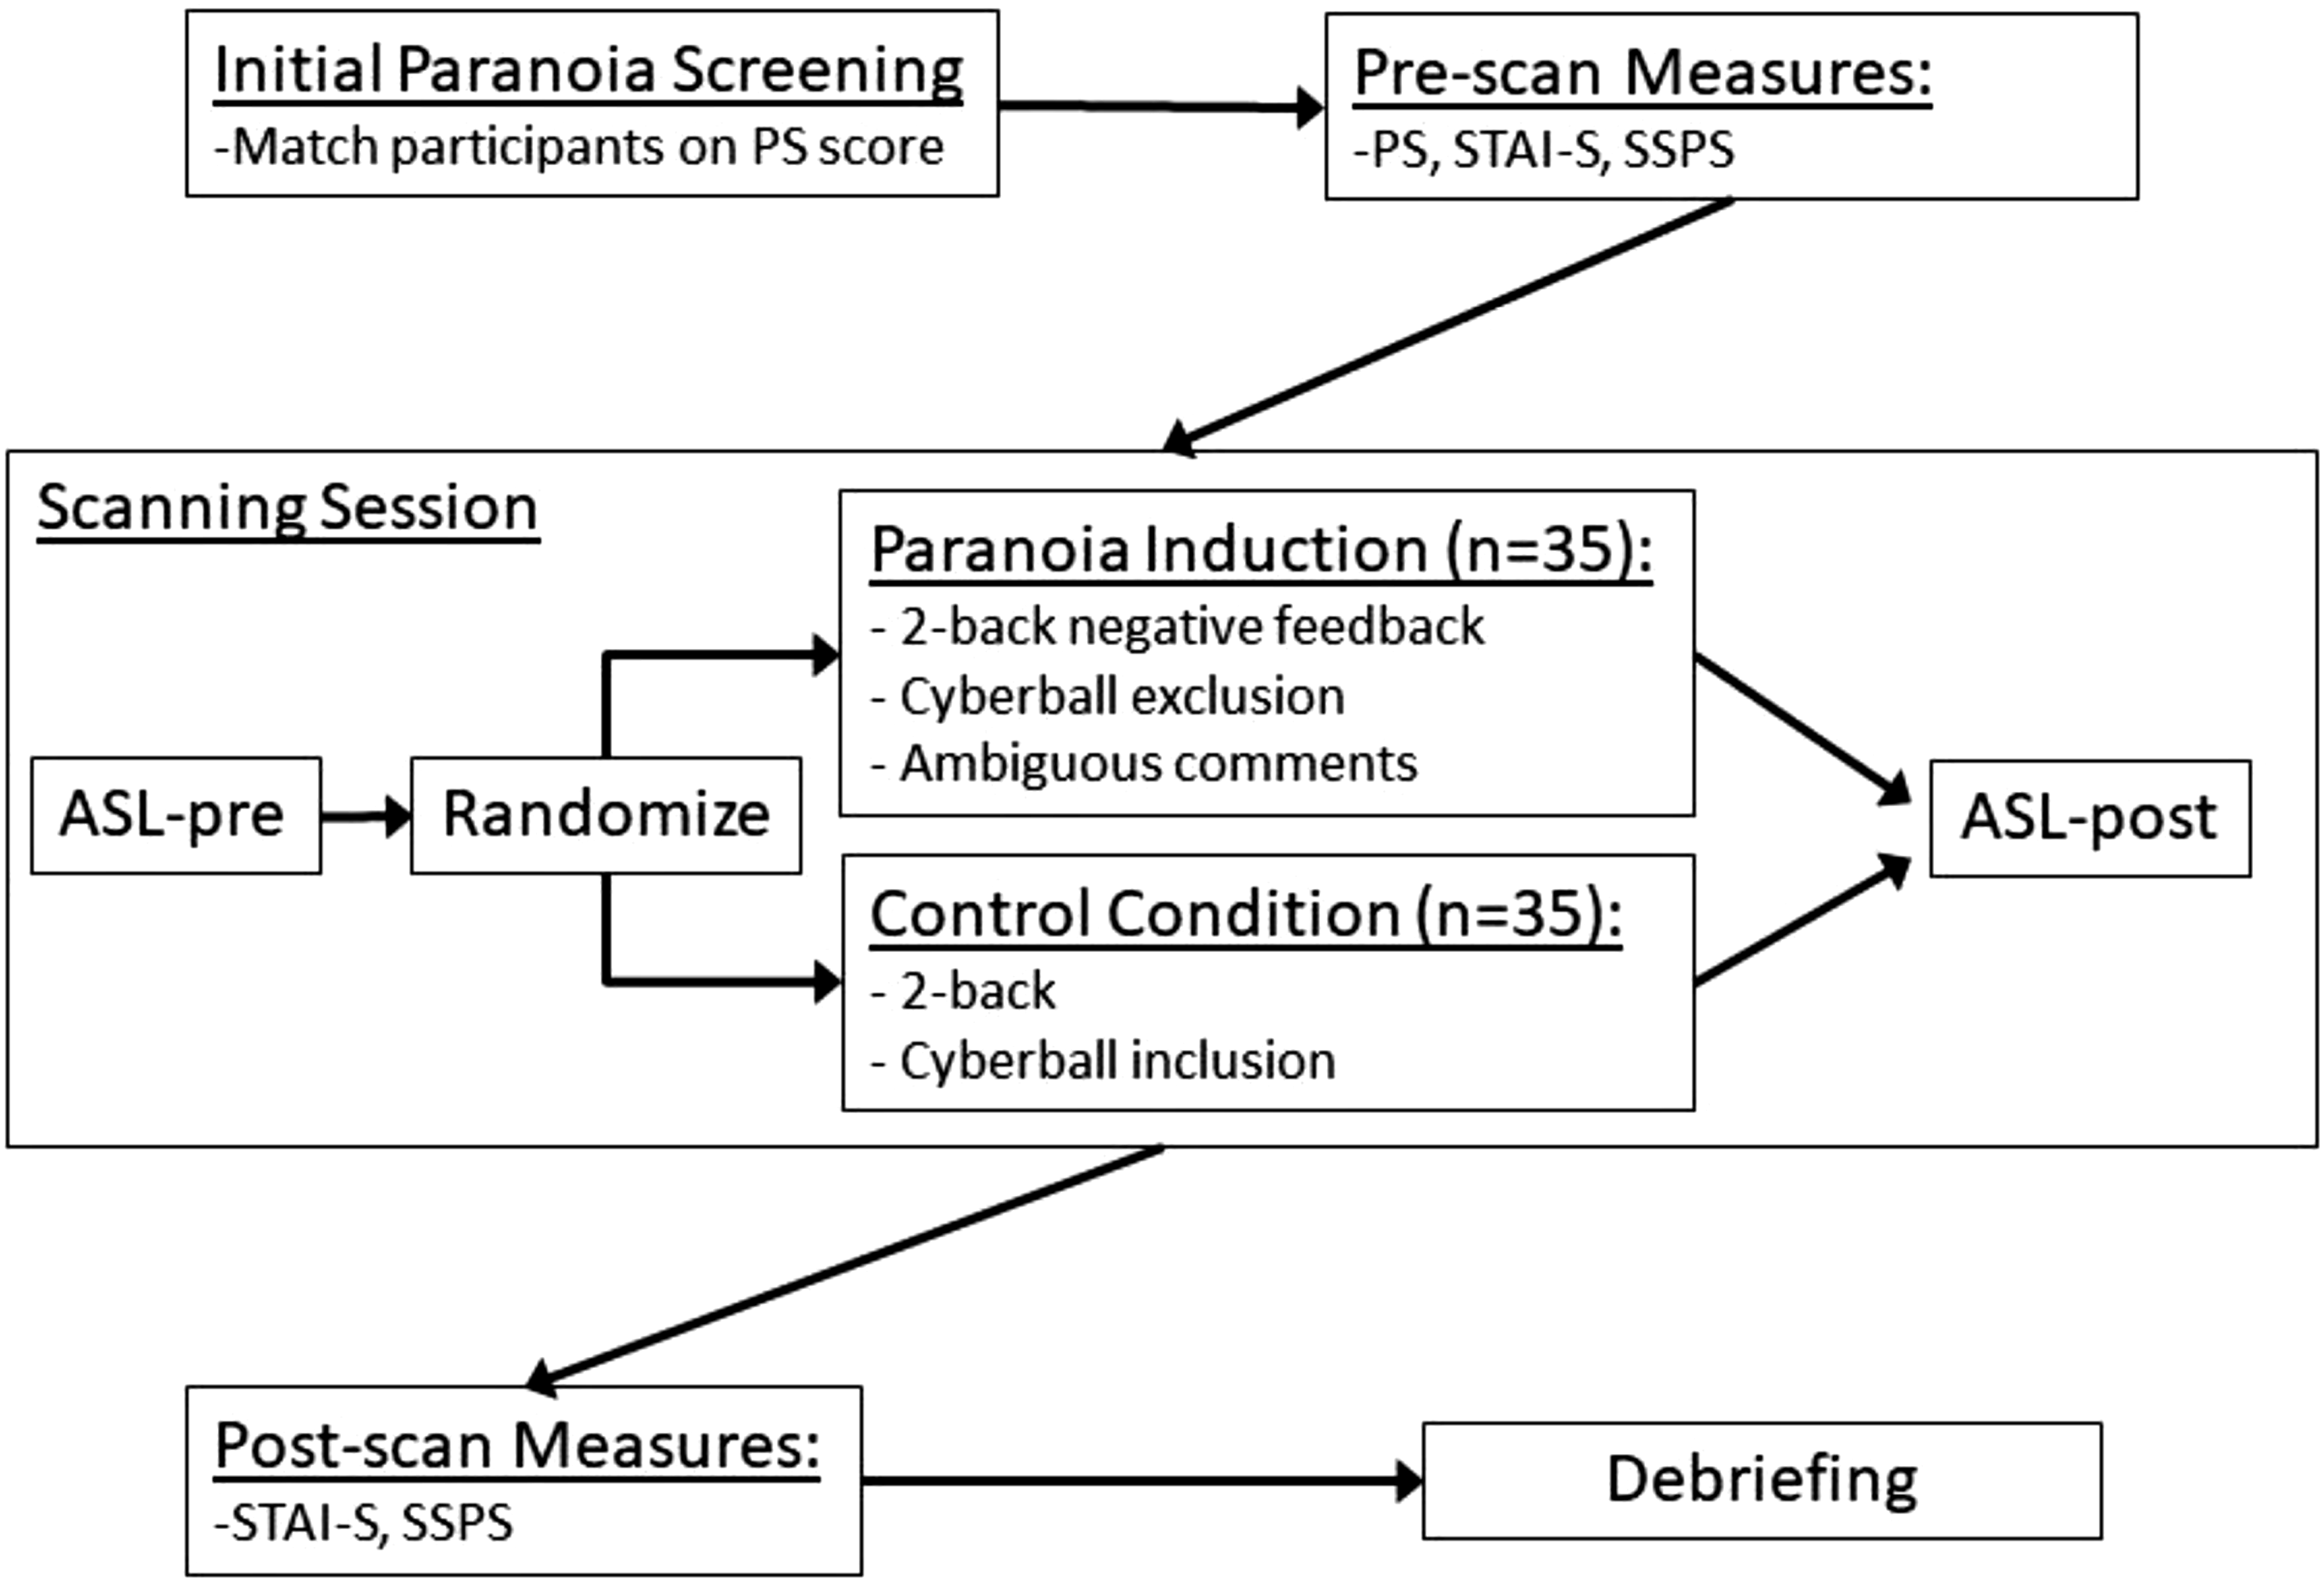
Paranoia induction procedure
Capitalizing on work demonstrating that paranoia is increased by negative feedback and social exclusion (Kesting et al., 2013), as well as ambiguous experimenter behavior (Lincoln et al., 2009), our induction paradigm utilized all three strategies. Participants first completed a complex fractal 2-back working memory task (Ragland et al., 2002) and upon completion, verbally received negative feedback about their performance. Specifically, the experimenters said, “Did you understand the task? People tend to do better on it.” Once a response was given, the experimenter went on to say, “Okay, people usually do really well on the task so we were just checking if there were any issues.” Next, participants completed the exclusion version of the Cyberball task (Williams et al., 2000). In this virtual ball tossing game, participants were instructed that they would play over the internet with another participant and another research assistant who were completing the study at the second scanner in the facility. The game consisted of 30 throws, and the participant received two ball tosses early in the game but was then excluded by the other two players and did not receive any more tosses for the remainder of the game. Of note, the other players were actually fictional. Finally, after the Cyberball task, participants were asked to wait while the experimenter “worked something out on their end.” During this brief pause (<2 min), the intercom remained on so that participants could hear the experimenter mumble some words to the MRI technician followed by laughter.
Control condition procedure
Participants also completed the fractal 2-back task but did not receive any feedback regarding their performance, and they completed an inclusion version of the Cyberball task in which they received 33% of the tosses in a pre-programmed order.
Imaging parameters and procedures
Scans were obtained on a clinically approved high-field (3T) Philips Achieva scanner with an eight-channel SENSE head coil housed within the Advanced Imaging Research Center at UTSW. Following safety screening and task instruction/practice, participants were placed in the scanner, wearing earplugs to muffle the scanner noise. Head fixation was assured using standard procedures (i.e., foam-rubber device mounted on the headcoil and adjustable foam cushions clamped against MRI-compatible headphones). Stimuli were rear projected to the center of the visual field using a high-resolution video projector (Epson 7000 series) and viewed through a mirror mounted on the head coil. A fiber optic button box placed in the right hand was used to register behavioral responses to the n-back and Cyberall tasks. Scans were performed in a single 1-hour session.
A 4 minute magnetization-prepared, rapid acquisition gradient echo (MPRAGE) image (160 slices, voxel size 1x1x1 mm, field of view = 256 × 204, time to repeat/echo time = 8.1 ms/3.7 ms) was first acquired for high-resolution anatomic overlays of functional data and spatial normalization. pCASL acquisitions were then used to obtain estimates of resting CBF (Aslan et al., 2010; Dai et al., 2008) both pre- and post-experimental manipulation by using the body coil for transmission and the head coil for reception. 60 control and label pairs of images were acquired with the following parameters: (labeling duration = 1800 ms, post-labeling delay = 1525 ms, TR/TE = 4460/17 ms, flip angle = 90°, matrix size = 64x64, voxel size = 3.4x3.4x5 mm3, 29 slices, no gap, number of dynamics = 120, duration = 544.1 sec). During ASL scanning, participants were instructed to relax, lie still, and keep their eyes open and focused on a small white cross that was presented in the middle of a black screen. BOLD fMRI (Bandettini et al., 1992; Kwong et al., 1992) was acquired during the n-back and Cyberball tasks but is not presented here as the goal was merely to obscure the true intent of the study.
Data processing
CBF was calculated from the ASL data with custom scripts utilizing SPM12 (University College London, UK). Images were realigned to the first volume followed by pair-wise subtraction between the label and control images to yield 60 difference images that were then averaged to create one CBF image per participant using the following perfusion kinetic model:

Here, w is the post-labeling delay time (1525 ms), λ is the blood–brain partition coefficient (0.9 mL/g) (Herscovitch & Raichle, 1985), and α is the labeling efficiency (0.86) (Aslan et al., 2010). T1 (1279 ms) is the averaged T1 value of blood and tissue (Lu et al., 2004; Lu et al., 2005) as the labeled spins will spend some time in the blood and some in tissue. M0 is the equilibrium magnetization of the tissue estimated from the control image while accounting for the T1 relaxation of the static spins (Thomas et al., 2013). To reduce the potential influence of individual physiological differences, CBF values at each voxel were normalized against the whole-brain gray matter value for each participant (Aslan et al., 2010). Thus, CBF values are provided as relative CBF (rCBF). These averaged rCBF images were then coregistered to their corresponding structural image and normalized to MNI space using the standard template provided by SPM12.
Data analysis
Behavioral measures
Independent samples t-tests and chi-square tests were used as appropriate to compare groups on demographic factors and both screening and pre-scan PS scores. To evaluate the effects of the experimental manipulation, a series of repeated measures ANOVAs were conducted using the SSPS subscale and STAI-S scores as the dependent variables. Time (pre-vs. post-experimental manipulation) was used as the within-subjects factor, and group (paranoia induction vs. control condition) was the between-subject factor.
Primary rCBF analyses
To specifically examine activation in our a priori region of interest, right and left amygdala were first anatomically defined using the Wake Forest University PickAtlas. Averaged estimates of rCBF within right and left amygdala were then extracted and entered into a repeated-measures ANCOVA with hemisphere (right vs. left) and time (pre-vs. post-experimental manipulation) as the within-subject factors and group (paranoia induction vs. control condition) as the between-subject factor. As in our previous work (Pinkham et al., 2015), age and sex were entered as covariates. Pre-scan PS scores were also used as a covariate given the higher scores among participants assigned to the control condition (see below). The threshold for statistical significance for all analyses was set at p < .05.
Supplemental analyses
Given the link between anxiety and amygdala activation (Adhikari, 2014), we also repeated the CBF region of interest analysis while controlling for change in state anxiety over time. We also examined correlations between change in rCBF over time, PS pre-scan scores, and change in our other variables of interest (SSPS subscales and STAI-S).
Results
Participant demographics and characteristics
Demographic characteristics for individuals assigned to the control and paranoia induction conditions.

Note. PS = Paranoia Scale.
Pre-post manipulation behavioral data
Repeated-measures ANOVAs on the SSPS Persecution and Neutral subscales revealed no significant main effects of time or group nor any significant interactions. For the SSPS Positive subscale, the main effect of time was not significant, but there was a significant main effect of group such that the CON group endorsed more positive statements than the PI group (F(1,61) = 5.25, p = .025, d = .58). The group x time interaction was also significant (F(1,61) = 5.19, p = .026, η p 2 = .078). Prior to the manipulation, groups did not significantly differ (t(1,61) = 1.56; p = .125, d = .39), but post-manipulation, the CON group scored higher than the PI group (t(1,61) = 2.76; p = .008, d = .69). Additionally, while the amount of change over time was not significant in the CON group (t(1,30) = 1.12; p = .27, d z = .20), individuals in the PI group showed significantly decreased positivity after the experimental manipulation (t(1,31) = 2.10; p = .044, d z = .37).
Pre- and post-manipulation social paranoia and state anxiety.
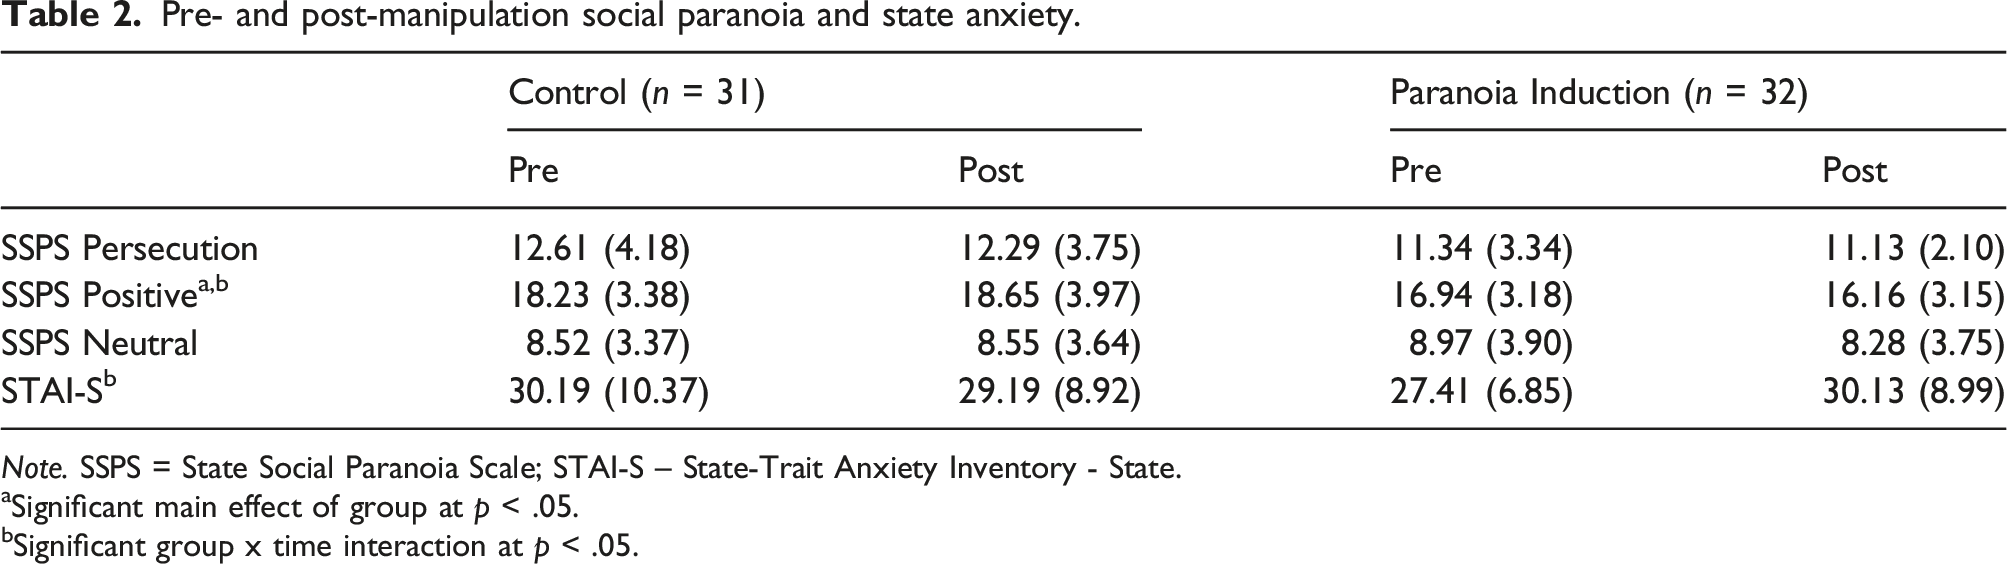
Note. SSPS = State Social Paranoia Scale; STAI-S – State-Trait Anxiety Inventory - State.
aSignificant main effect of group at p < .05.
bSignificant group x time interaction at p < .05.
Resting amygdala rCBF
The repeated-measures ANOVA on amygdala rCBF revealed a statistically significant three-way interaction between group, time, and hemisphere (F(1,57) = 4.64, p = .036, η
p
2
= .075). No effects were significant for rCBF in left amygdala. In right amygdala, only the group x time interaction was significant (F(1,57) = 5.03, p = .029, η
p
2
= .081). The CON and PI groups did not significantly differ from each other at pre- (t(1,61) = 1.72, p = .091, d = .44) or post-manipulation (t(1,61) = .106, p = .912, d = .03) nor did either group show a significant change over time (CON: t(1,30) = 1.24, p = .225; PI: t(1,31) = 1.30, p = .203). Instead, the differential direction of change appeared to be driving the significant interaction (see Figure 2). Whereas the CON group showed decreased rCBF post-manipulation (d
z
= .22), the PI group showed an increase in rCBF over time (d
z
= .23), and these effects were comparably sized. rCBF in right amygdala Pre- and post-manipulation. Note. Left – For visualization of results, voxel-wise analyses of the group x time interaction in right amygdala shown masked by ROI and uncorrected at p < .01, k > 50. Right: Averaged rCBF values extracted from the right amygdala region of interest. CON = control group; PI = paranoia induction group; SE = standard error; dz = Cohen’s d for within subject effect sizes.
Supplemental analyses
Given the significant increase in anxiety within the PI group over time, we re-examined right amygdala rCBF while controlling for change in state anxiety. The group x time interaction remained significant (F(1,56) = 4.06, p = .049, η p 2 = .068), demonstrating that the amygdala response is not primarily due to changes in anxiety over time or differences in anxiety levels between the groups. Correlations between rCBF change, PS prescan scores, and changes in SSPS subscales and STAI-S were not statistically significant in the overall sample or in either group individually (all p > .07).
Discussion
The current study investigated whether increased resting activity of the amygdala, a brain region involved in processing threat, may co-occur with increased paranoid thinking. To experimentally test this association, we randomly assigned healthy individuals to undergo either a paranoia induction condition or a control condition. Arterial spin labeling functional magnetic resonance imaging was used to measure resting CBF in amygdala both before and after participants completed their assigned condition. Somewhat contrary to our hypotheses, participants in the paranoia induction condition did not show significantly increased CBF relative to their pre-induction values or relative to individuals in the control condition after the experimental manipulation. However, individuals in the paranoia induction condition did show an increase in right amygdala CBF over time that was in direct contrast to the decrease in amygdala CBF seen among individuals in the control group. Given the considerable body of literature demonstrating that amygdala responses tend to normatively habituate (for a summary, see Plichta et al., 2014), the increase seen in the paranoia induction group provides some support for a mechanistic link between hyperactivity of amygdala and increased paranoia. The lateralization of this response to right amygdala is also consistent with theories linking the right hemisphere to negative emotion (Lee et al., 2004; Roesmann et al., 2019) or those emotions associated with withdrawal responses (Harmon-Jones, 2003).
Participants also completed measures of social paranoia and state anxiety before and after the experimental manipulation. The paranoia induction procedure evoked only limited change in endorsements of clearly persecutory statements (e.g., “Someone wants me to feel threatened” and “Someone will harm me in some way if they can”); however, individuals in this condition did report significantly fewer positive perceptions of social others. As many of the positive items tap into persecuorty ideas (e.g., “Everyone is trustworthy” and “I feel safe in the company of others”), lower scores on this subscale following the induction are consistent with an experimentally induced increase in paranoid thinking. Further, individuals in the paranoia induction condition also reported significantly greater state anxiety at post-induction as compared to their pre-induction levels. Previous work demonstrates that increasing anxiety results in greater paranoia (Lincoln et al., 2010) and as noted previously, links between paranoia and anxiety are bidirectional, which provides further support for the validity of our experimental manipulation.
While still somewhat tentative, the combined results of this study indicate that paranoia induction resulted in both behavioral changes consistent with increased paranoia and increased amygdala CBF. These findings support a causal link between amygdala hyperactivation and paranoia but cannot yet directly determine the exact temporal ordering of this effect. Here, we sought to change behavior in order to test the effects on brain, but given the length of our induction paradigm (∼30 minutes), it is impossible to determine whether changes in amygdala CBF may have started before changes in feelings of paranoia or vice versa. Different work from our lab demonstrates that altering neural function via neurostimulation can reduce paranoid thinking (Springfield, Isa, et al., 2021), which suggests that neural changes may precede behavioral ones. Additional work will be needed to further specify the precise directionality of these effects.
Despite the study’s novelty of being the first to examine a neural mechanism of paranoia within-subjects by combining an experimental manipulation of paranoia with ASL imaging, there are a number of limitations that require consideration. First, the paranoia induction condition did not yield any changes in the endorsement of overtly paranoid statements. It is possible that the induction may not have been potent enough to evoke this type of change, and we therefore recommend that future studies work to develop and validate stronger induction procedures. Virtual reality paradigms have been used successfully to induce paranoia (Freeman et al., 2008; Pot-Kolder et al., 2018; Veling et al., 2016) and may be particularly useful in studies focusing on neural mechanisms as they can be integrated into the imaging environment. Second, we did not correct for multiple comparisons in our analyses. Importantly, however, effect sizes for all of the significant interactions were large, suggesting that the results are not due to Type I error. Finally, our sample was primarily female, and while we controlled for gender in our analyses, it is not clear how this may have impacted our findings. Future studies should strive to recruit larger and more representative samples.
Notwithstanding these limitations, the present findings demonstrate that experimentally inducing paranoia in healthy individuals resulted in increased resting activity of the amygdala that was opposite the normative reduction seen in the control condition. These findings, paired with our previous work showing increased resting CBF in paranoid individuals with schizophrenia (Pinkham et al., 2015), suggest that amygdala hyperactivity may be a mechanism for paranoia across the continuum from healthy to pathological.
Footnotes
Declaration of conflicting interests
The author(s) declared no potential conflicts of interest with respect to the research, authorship, and/or publication of this article.
Funding
The author(s) disclosed receipt of the following financial support for the research, authorship, and/or publication of this article: This work was supported by the National Institute of Mental Health (grant number R21 MH112930 to AEP). All authors report no conflicts of interest.