
Abstract
Schizotypal and autistic traits have both been implicated in the development of conspiracy theory (CT) beliefs. However, there are both similarities and differences between these traits that may increase an individual’s susceptibility to CT beliefs. Past research has often taken a variable-centred approach which assumes that the relationships among distinct variables (i.e. schizotypy, autistic traits) are homogenous. Given these circumstances, Latent Profile Analysis (LPA) was used to assess the extent to which within-individual variation in schizotypal, autistic traits and associated socio-cognitive tendencies are associated with CT beliefs, cognitive flexibility, and scientific reasoning performance. In a sample of 565 adults, five distinct classes were identified. Those with the lowest clinical scores (Class 1) had the highest scientific reasoning and lowest level of CT beliefs, whilst those with the highest clinical scores (Class 4 and 5), had the lowest scientific reasoning and highest CT belief scores. Further analysis revealed some evidence for mixed groups (e.g. Class 4) in which higher analytical reasoning scores co-occurred with higher CT beliefs, but lower scientific reasoning scores. The results did not provide evidence that higher autistic traits independently predicted CT beliefs, but the results support the view that scientific reasoning appears to better differentiate variation in CT beliefs across groups than differences in analytical reasoning.
Keywords
Introduction
Conspiracy theory (CT) beliefs and conspiracy culture have become a growing topic of interest to researchers over the past decade (Butter & Knight, 2020). Previous research has identified a range of factors that explain how conspiracy beliefs emerge and how they are promulgated within society. Studies have examined how these beliefs often emerge during major events or crises such as the COVID-19 pandemic (Douglas, 2021; Van Bavel et al., 2020); the role of group belief systems (Cichoka et al., 2016; Douglas, 2021); and, importantly, what individual differences encourage greater acceptance and adoption of conspiracy beliefs (Furnham & Grover, 2021; Georgiou et al., 2020; Gligorić et al., 2021). Much of this individual difference research has focused on the role of psychopathological traits and socio-cognitive factors (e.g., education, critical reasoning and cognitive style) associated with CT beliefs (Barron et al., 2018; Georgiou et al., 2019; Goreis & Voracek, 2019; van Prooijen & Douglas, 2018).
The role of psychopathological factors in conspiracy beliefs
Several studies support the view that schizotypal personality traits are a significant predictor of belief in conspiracy theories (Barron et al., 2018; Denovan et al., 2020; Georgiou et al., 2019; Swami et al., 2016). Schizotypy is a complex, multidimensional psychological construct that possesses positive, negative and disorganised dimensions that resemble the factorial models of schizophrenia (Balzan et al., 2016; Barron et al., 2014; Bentall et al., 1989; Dagnall et al., 2016). Although different researchers propose alternative models of schizophrenia/psychosis-proneness (Claridge & Beech, 1995; Grant et al., 2018; Kwapil et al., 2012), research that has examined conspiracy beliefs and other related paranormal beliefs in non-clinical populations have focussed on the dimensional approach to schizotypy (Barron et al., 2014; Dagnall et al., 2015; Drinkwater et al., 2021, 2022; Georgiou et al., 2021b). This approach suggests that schizotypy is a latent personality organisation on the lower end of a spectrum, which reflects the propensity to develop schizophrenia-spectrum disorders (Gross et al., 2014). Thus, the dimensional approach acknowledges that schizotypal traits may influence cognitive-perceptual processing in the general population, and, so doing, contribute to the formation/maintenance of shared unorthodox beliefs such as conspiracy theories (Barron et al., 2014; Denovan et al., 2020; Georgiou et al., 2019). As a result, Barron et al. (2018) claimed the dimensional model acts as a coherent conceptual framework for investigating conspiracy beliefs in the general population.
Following the seminal work of Darwin et al. (2011), a robust number of studies have reported a moderate significant positive association between schizotypy and conspiracy beliefs (Barron et al., 2014; Georgiou et al., 2019; Swami et al., 2016; van der Tempel & Alcock, 2015). A particular focus has been upon the potential role of perceptual oddities (i.e. illusions to hallucinations); disruptions in the content of thought (odd beliefs and magical ideation though to delusions (Balzan et al., 2016; Georgiou et al., 2019); and suspiciousness or paranoia (Brotherton et al., 2014; Galliford & Furnham, 2017; Moritz et al., 2013). Schizotypy is seen to have a direct association with conspiracy beliefs (Barron et al., 2014; Georgiou et al., 2019; Swami et al., 2016), but also an indirect influence arising from a lower propensity to process information analytically or critically (Barron et al., 2018; Georgiou et al., 2019; Lantian et al., 2021). Attempts to capture these differences in information processing have involved the study of differences in performance on of a range of problem-solving tasks (e.g. Bias Against Disconfirmatory Evidence Task; Balzan et al., 2016; Georgiou et al., 2021d, 2021d, in press) or the administration of measures that capture individual ability to assess the validity of information (i.e. Scientific Reasoning; Cavajova et al., 2020a; Georgiou et al., 2021d, in press).
Whilst research concerning the relationship between schizotypy and CT beliefs has been well acknowledged, much of this work holds the assumption that schizotypal characteristics are the principal predisposing factor to conspiracist beliefs. However, as shown in recent research by Georgiou et al. (2021d), it may also be important to consider other potentially influential conditions, including autism spectrum disorder (ASD) which was shown to be a significant predictor of conspiracy beliefs after controlling for schizotypy in statistical models. These findings follow a larger body of research that has recognised the significant overlap between traits of schizotypy and autism in the domains of social cognition (i.e. cognitive mentalising, probabilistic reasoning; Barlati et al., 2016; Barlati et al., 2020; Claridge & McDonald, 2009; Fernandes et al., 2018; Pinkham & Sasson, 2020; Williams et al., 2014; Zhang et al., 2015). In the context of unorthodox beliefs, like schizotypy, autistic traits can feature a rigid, inflexible thinking style which may involve an abnormal intensity or focus on specific details and points of interest when interpreting information (Georgiou et al., 2021d; Sommer et al., 2018). Thus, schizotypy and autistic traits may similarly promote CT beliefs as they both encourage a less adaptable thinking style which, in turn, is less receptive to disconfirmatory evidence (Georgiou et al., 2021a, 2021b).
Georgiou et al. (2021a, 2021d, in press) suggest, however, that autistic traits may promote CT beliefs through a potentially different mechanism from what is observed in schizotypy. Although both measures of schizotypy and autistic traits were positively associated with CT beliefs and lower performance on cognitive flexibility (i.e., BADE task; Woodward et al., 2006) and scientific reasoning tasks (i.e., Scientific Reasoning Scale; Drummond & Fischhoff, 2017), different associations were found across self-report measures of analytical thinking, open-mindedness, and information seeking behaviour (Georgiou et al., 2021b, 2021d, in press). Specifically, people scoring higher on ASD and CT beliefs were also found to engage in greater analytical thinking and information searching, which is generally considered to be a protective factor against CT beliefs. The findings raised the possibility that it is not the style of thinking that is always important (i.e. analytical vs. emotive), but whether people apply analytical thought process in an unbiased and scientific way. Hence, it may be that merely engaging in a lot of information searching could be a risk factor for stronger CT beliefs in some individuals if it was framed by confirmation bias.
The present study
Schizotypy and autistic traits are both associated with a susceptibility to CT beliefs. This relationship is suggested to arise from a poorer ability to engage in critical thinking skills that enable a person to accept disconfirmatory evidence to counter CT beliefs. In previous studies, a consistent positive association has been observed between schizotypy, autistic traits and conspiracy beliefs (Georgiou et al., 2021b, 2021d, 2021d). Conclusions have been based on variable-centred approaches using correlations, regressions, or mediation-based models to examine how both constructs relate to conspiracy beliefs (Georgiou et al., 2021a, 2021d). A variable-centred approach assumes that results from any analysis is an estimate of the relationships among the distinct variables (i.e. autistic traits, schizotypy), are average across the whole population, and, are expected to be homogeneous (Denovan et al., 2018; Orri et al., 2017). In contrast, person-centred approaches assume populations are heterogeneous, and in relation to autistic traits and schizotypy, allow one to examine whether there may be subgroups (i.e. latent profiles) not identified by the previous approaches of Georgiou (2021a, 2021c, 2021d, in press). As suggested by previous research concerning the overlap of schizotypal and autistic traits in the domain of social cognition (Barlati et al., 2020; Pinkham & Sasson, 2020), subgroups may be easily differentiated based on psychopathological traits (i.e. there may be significant overlap between those scoring high on autistic and schizotypal traits across latent profiles). However, such analytical approaches may provide further insights into whether there are individuals who do not follow the expected clustering of variables usually observed in studies of schizotypy; namely, higher schizotypy associated with lower scores on analytical reasoning and higher scores on CT beliefs (Barron et al., 2018). Using a more case-centred approach might help to elucidate whether there are individuals who score higher on ASD, CT beliefs and analytical thought, but lower on scientific reasoning.
Accordingly, in recognition of the potential limitations of the traditional individual differences approach, the present paper adopted a person or case-centred perspective. This, via Latent Profile Analysis (LPA), used class membership as a method to examine whether certain individuals appear to display different risk profiles for susceptibility to CT beliefs (Denovan et al., 2018). Profiles were developed based upon scores on ASD and schizotypy traits, cognitive flexibility (as measured by the BADE and active open-minded thinking; Balzan et al., 2016; Georgiou et al., 2021b); scientific reasoning (Cavajova et al., 2020a; Georgiou et al., 2021d, in press); analytical thinking, and CT beliefs. Based on the methodology of Georgiou et al., (2021a), a measure of active open-minded thinking has: (a) been previously used to capture belief inflexibility alongside the BADE, and, (b) has previously shown a positive association to analytical thinking and conspiracy beliefs. Given the novelty of this approach, the researchers did not specify a priori the number of latent profiles in advance. Nevertheless, based on previous work (Georgiou et al., 2019, 2021a, 2021b, 2021c, 2021d, in press) it was hypothesised that profiles would indicate that individuals with high CT beliefs would have high clinical scores (high schizotypy/ASD traits), lower scientific reasoning scores, and demonstrate the strongest bias against disconfirmatory evidence. The study also examined the role of level of education across latent profiles due in part to its association socio-cognitive factors previously discussed (i.e. analytical thinking, active open-mindedness, scientific reasoning scores) and, previous research which has suggested it as a protective factor against CT beliefs (Darwin et al., 2011; Swami et al., 2016; van Prooijen & Douglas, 2018).
Method
Participants
The study involved a total of 565 participants (M = 355, F = 208, Prefer not to say = 2). The majority lived in the United Kingdom (38%), other countries from continental Europe (20%) and the United States of America (16%). The majority (about 80%) received a formal education beyond secondary level. It was found that 136 (24.1%) of the sample had received a formal diagnosis of a mental health disorder; only 3 (.02%) reported receiving a previous diagnosis of ASD. Schizotypy (MSS – B) scores generally were in the middle range of the scale, with negative schizotypal traits above the midpoint, whilst, disorganised and positive schizotypal traits fell below the midpoint of the scale. Full details are presented in Georgiou et al. (2021a).
Sampling procedure
The online research participation Website Prolific.Inc was used to recruit participants and the study was advertised as being about people’s individual differences in interpreting real-world events. There was a small monetary fee (around three UK pounds). Participants were provided and completed written consent before begging the study.
Study design
Demographic information and other measures, (including the measurement of Autism Spectrum Disorder and a screening for prior clinical diagnosis), and, two cognitive assessments, were completed online. The study was approved by the Human Research Ethics Subcommittee in the University of Adelaide’s School of Psychology.
Measures
Demographic background and situation
Participants were asked to provide demographic information, including: gender, age, country of residence, highest education level, current employment status, and prior history of clinical diagnosis.
The autism-spectrum quotient short-form (AQ – 10)
The AQ – 10 is a shortened, 10-item version devised by Hoekstra et al. (2011) of the original 50-item, self-administered instrument by Baron-Cohen et al. (2001), designed to measure the degree to which an adult with normal intelligence has the traits associated with the autistic spectrum. Each item allows the participant to indicate ‘definitely disagree’, ‘slightly disagree’, ‘slightly agree’ or ‘definitely agree’. Only 1 point could be scored for each item, with 1 point for the answers ‘definitely or slightly agree’ on items 1, 7, 8 and 10, or for the answers ‘definitely or slightly disagree’ on items 2, 3, 4, 5, 6 and 9. Scores of above 7 out of 10 were considered to be individuals likely to be on the autistic spectrum. Cronbach’s alpha was 0.77.
Multidimensional schizotypy scale – brief
The MSS-B is a 38-item assessment developed by Gross et al. (2018) as an abbreviated form of the 77-item original scale formed by Kwapil et al. (2018) which measures positive, negative and disorganised traits of schizotypy. All items were rated from 1 (Completely Disagree) to 5 (Completely Agree). Previous research concerning CT Beliefs has shown the MSS – B to have very good psychometric properties in diverse populations (Georgiou et al., 2021b, 2021a; Kemp et al., 2020). Cronbach’s alpha for the present study was 0.93.
Analytical thinking (REIm – R)
The REIm is a 42-item self-report measure developed by Epstein and Norris (2011), which contains a 12-item subscale that measures tendencies to engage in analytical thinking (REIm-R), and a 30-item subscale that measures tendencies towards the use of an experiential and intuitive thinking style (REIm-E/I). Within the current study, solely the REIm-R will be used for reasons previously mentioned in Georgiou et al. (2021d, in press). All items are rated on a 5-point scale from 1 ‘Strongly disagree’, to 5 ‘Strongly Agree’. The REIm- R has been shown to have good psychometric properties (Epstein & Norris, 2011; Georgiou et al., 2019; Swami et al., 2017). Cronbach’s alpha for the present study was 0.80.
The generalised conspiracy beliefs scale (GCBS)
This measure, developed by Brotherton et al. (2013), captures whether people tend to perceive the world from a conspiratorial perspective and focuses less on specific beliefs (Brotherton et al., 2013; Swami et al., 2017). Items are scored from 1 (Definitely not true) to 5 (Definitely true) to yield an overall score between 15 and 75 (higher scores reflect greater conspiracy ideation). Cronbach’s alpha for the present study was 0.92.
COVID-19 conspiracy beliefs (COVID – 9)
Developed by Georgiou et al. (2020), the COVID – 9 Conspiracy Belief Scale measures an individual’s beliefs in conspiracy theories particularly focussed on the COVID-19 pandemic. This scale contains theories that are more current compared to other available psychometric measures (i.e. BCTI; Swami et al., 2017). Participants responded on a 7-point scale ranging from 1 = strongly disagree to 7 = strongly degree, the extent to which they endorsed each statement. Statements included items relating to whether the virus had escaped from a lab and was a bioweapon, whether bodies had been secretly burned in China, the involvement of Bill Gates, the availability and suppression of an existing vaccine. Cronbach’s alpha for this scale was .89.
Cognitive task: The scientific reasoning scale (SRS)
As in Georgiou et al. (2021, in press), scientific reasoning skills were measured using the SRS developed by Drummond and Fischhoff (2017) which comprises 11 short scenarios designed to test participants’ knowledge of basic scientific concepts. This includes concepts such as confounding variables, control group effects, or random assignment to conditions. For example, a scenario measuring a person’s understanding of the concept of confounding variables states: ‘A research project has subjects put together a jigsaw puzzle either in a cold room with a loud radio or in a warm room with no radio. Subjects solve the puzzle more quickly in the warm room with no radio’. Each scenario is then followed by a statement, and participants are asked to indicate whether it is true or false: ‘The scientist cannot tell if the radio caused subjects to solve the puzzle more slowly’. In this study, we included a third option ‘I don’t know’ to reduce the probability of randomly guessing at the correct answer. The SRS score was computed by summing the correct answers to 11 items. Cronbach’s alpha for these items was .88.
Belief flexibility: Active open-minded thinking beliefs (AOT – 7) scale
The AOT is a 7-item short-form abbreviation of the original 41-item scale developed by Stanovich and West (2007) that assesses the tendency of an individual to weigh new evidence against a favoured belief, to spend sufficient time on a problem before giving up, and, to consider carefully the opinions of others in forming one’s own belief. As in Georgiou et al. (2021a), it has also served as a secondary measure of cognitive flexibility alongside the BADE 16-item assessment. The 7-item short form developed by Haran et al. (2013), best suited the current study with consideration of the overlap of questioning with other related measures used (i.e. the REIm- 42). Cronbach’s alpha for the present study was .80.
Belief flexibility: The bias against disconfirmatory evidence (BADE) 16-item task
Originally devised by authors Woodward, Moritz, and Chen (2006) and Woodward, Moritz, Cuttler, and Whitman (2006), the BADE consists of a possible 16 written delusion-neutral scenarios which can assess an individual’s persistence to hold certain beliefs in the face of disconfirmatory evidence. As in Georgiou et al., (2021d, in press), eight scenarios were used in the current study (for full details of BADE assessment, see Georgiou et al., 2020; 2021d, in press). Of interest to the present study, BADE scores were calculated by examining the difference between the first lure ratings and final lure ratings across the scenarios (Neutral Lure 1 – Neutral Lure 3 and Emotional Lure 1 – Emotional Lure 3). The values capture the decrease in endorsement of the lures following the presentation of additional evidence. A greater decrease indicate a smaller BADE effect. One would therefore expect a negative association between these scores and other measures that are hypothesised to capture a greater BADE effect. Scores were converted down to a range of 0–10 when conducting LPA.
Statistical analysis
Preliminary analysis
Analyses used version 27 of IBM SPSS Statistic software, apart from the Latent Profile Analysis (LPA), which required version 17 of the program STATA. Following the initial data screening and preliminary analysis within SPSS, Pearson r correlation analysis was conducted as shown in Georgiou et al. (2021a). AQ-10 cut-off scores were then used to establish independent groups within the sample (those likely to demonstrate autistic traits compared to those below the suggested cut-off score) across all psychometric measures, scientific reasoning scores, and belief flexibility measures (i.e. AOT and BADE scores) via independent samples t-tests. As shown in Georgiou et al (2021a), BADE calculations followed the methods recommended in the meta-analysis by McLean et al. (2017), Eisenacher et al. (2016), and Georgiou et al. (2021b).
Latent profile analysis
For the purposes of exploratory LPA, in accordance with the recommendations of previous research (i.e. Deleuze et al., 2015; Denovan et al., 2018; Hussain et al., 2015), psychometric measures using Likert scales were recoded. On both measures of CT beliefs ratings of 0–4 were coded as ‘0’ (indicating uncertainty or disagreement) and ratings of 5–7 were coded as ‘1’ (agreement). MSS-B and REIm – R scores across each subscale of 0–3 were coded as ‘0’ (indicating disagreement or uncertainty) and ratings of 4–5 coded as ‘1’ (agreement). Scoring for both Scientific Reasoning and the BADE task were not recoded.
Next, based on scores of MSS-B, AQ-10, REIm-R, AOT-7, SRS, CT beliefs (i.e. COVID – 9, GCBS) and BADE scores, an exploratory LPA determined the potential latent group membership of the sample. The optimal number of latent classes was determined by considering a range of indices; the Akaike Information Criterion (AIC; Akaike, 1987), the Bayesian Information Criterion (BIC; Schwarz, 1978) the sample-size adjusted BIC (ssaBIC; Sclove, 1987), the Lo–Mendell–Rubin–adjusted likelihood radio test (LMR-A-LRT; Lo et al., 2001), and a standardised measure of entropy (Ramaswamy et al., 1993). For AIC, BIC and ssaBIC scores, smaller value indicates a better fit of the model. The LMR-A-LRT score does not rely on chi-square distribution for the difference in model likelihood values and normally occur alongside an associated p-value. Progressive class solutions are computed until a LMR-A-LRT value is found that is non-significant, which indicates the model cannot be improved for fit. Lastly, entropy ranges from 0 to 1, with higher values suggesting a better classification of participants. According to Ramaswamy et al., (1993), an entropy value of above 0.80 reflects a sound separation of identified classes in relation to the data. Once LPA exploratory analysis has been conducted, Latent Class membership acted as a group variable for assessing whether differences existed on scientific reasoning and BADE scores.
Results
Fit of competing latent profile models.

Note. AIC, Akaike Information Criterion; BIC, Bayesian Information Criterion; ssaBIC, sample-size adjusted BIC; LMR-A, Lo–Mendell–Rubin–adjusted likelihood ratio test.
Mean score (standard deviations) of all psychometric measures as a function of latent class.
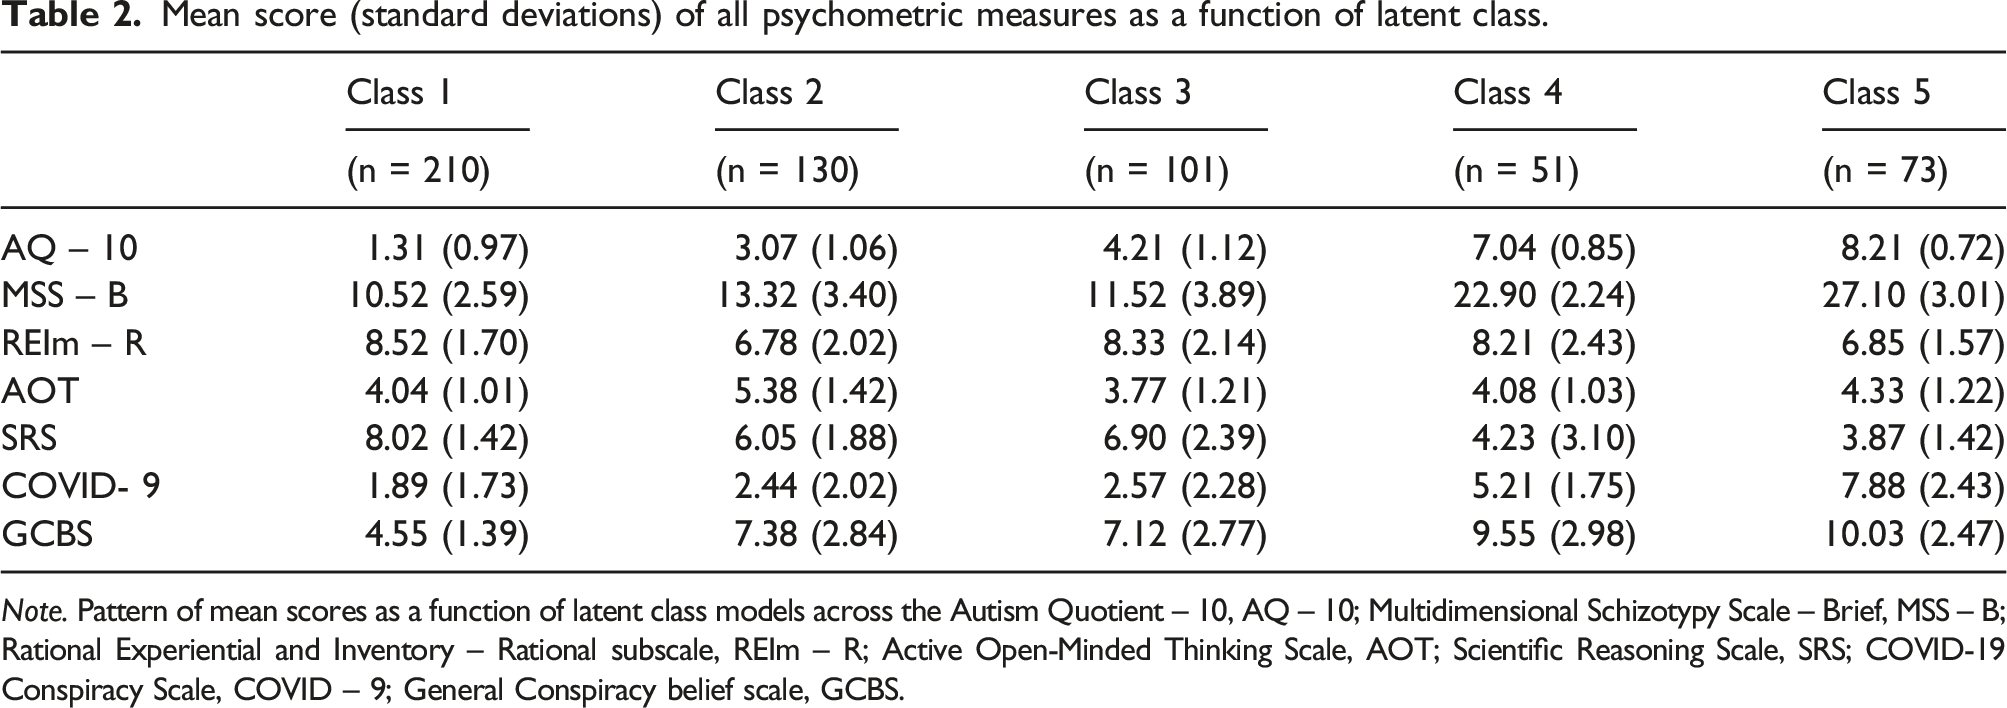
Note. Pattern of mean scores as a function of latent class models across the Autism Quotient – 10, AQ – 10; Multidimensional Schizotypy Scale – Brief, MSS – B; Rational Experiential and Inventory – Rational subscale, REIm – R; Active Open-Minded Thinking Scale, AOT; Scientific Reasoning Scale, SRS; COVID-19 Conspiracy Scale, COVID – 9; General Conspiracy belief scale, GCBS.
Mean score (standard deviations) of all psychometric measures as a function of a four latent class model.
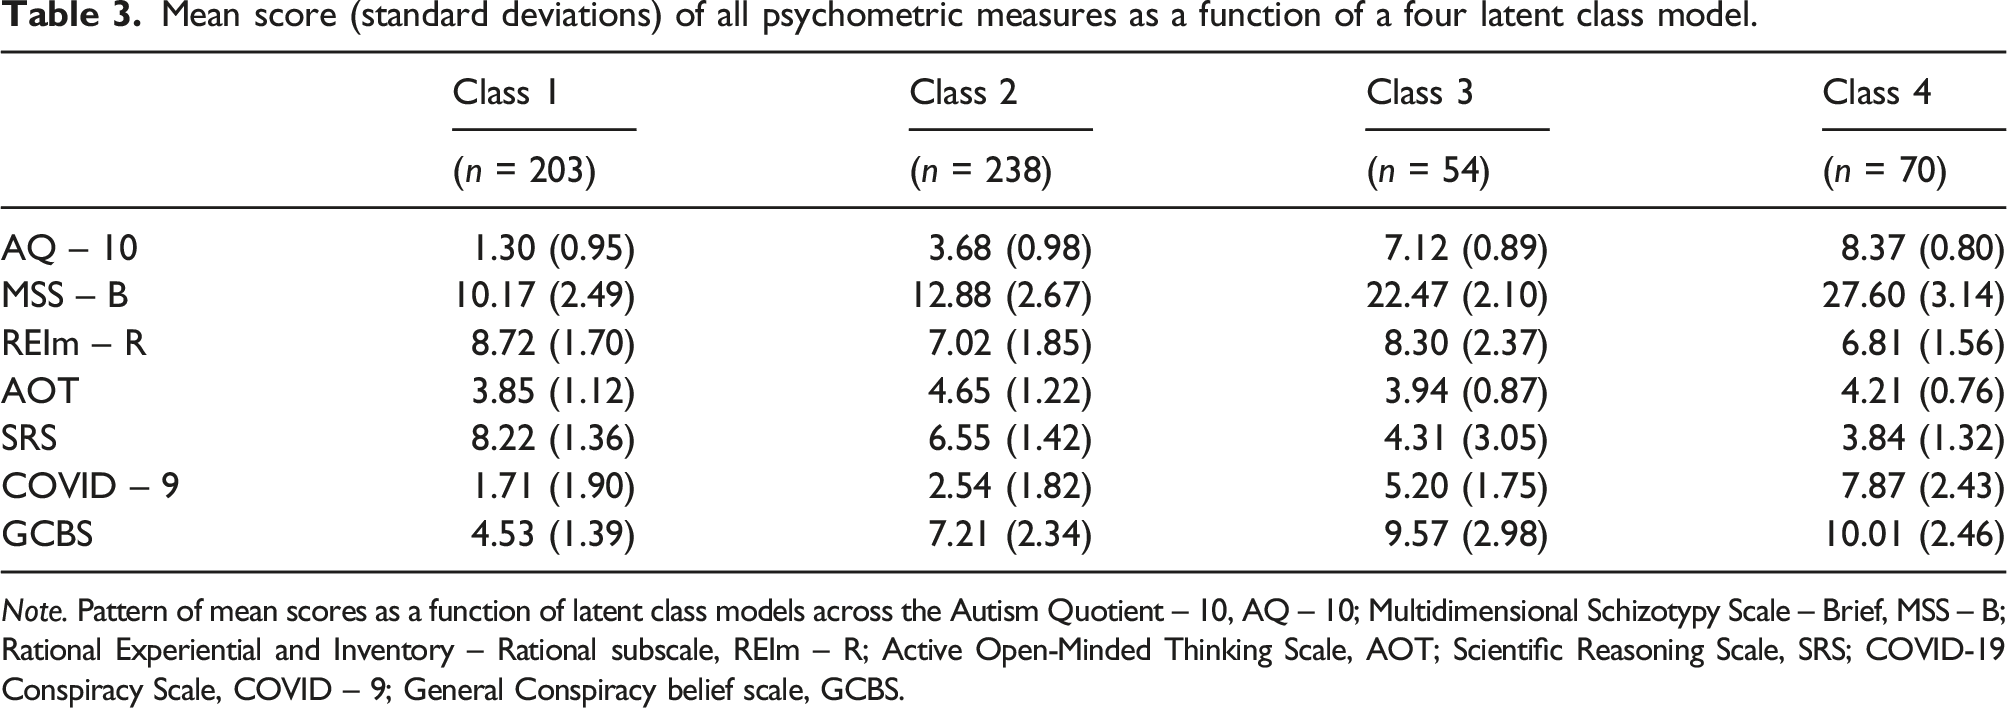
Note. Pattern of mean scores as a function of latent class models across the Autism Quotient – 10, AQ – 10; Multidimensional Schizotypy Scale – Brief, MSS – B; Rational Experiential and Inventory – Rational subscale, REIm – R; Active Open-Minded Thinking Scale, AOT; Scientific Reasoning Scale, SRS; COVID-19 Conspiracy Scale, COVID – 9; General Conspiracy belief scale, GCBS.
Latent profile analysis
Prior to conducting LPA, potential covariates of CT beliefs as suggested in van Prooijen (i.e. level of education, 2016: 2018), such as level of education and gender were examined for their potential influence on scores across measures of psychopathological (i.e. AQ-10, MSS-B scores), socio-cognitive factors (i.e. REIm – R, AOT scores) and CT beliefs. An independent samples t-test revealed no significant gender differences for all measures, while a one-way ANOVA indicated no significant differences across the reported level of education.
An initial comparison of 1-class and 2-class models was undertaken. AIC, BIC and ssaAIC indices suggested superior fit of the 2-class model, and the LMR-A-LRT for the 2-class model indicated significant improvement over the 1-class model (see Table 1). A further comparison of 2-class and 3-class solutions then revealed that the 3-class solution was superior, due to lower AIC, BIC, ssaBIC statistics, higher entropy scores (0.79 vs. 0.76), and a significant LMR-A-LRT p-value. Next, a 4-class solution designated superior fit in comparison to the 3-class solution, again, evident from lower AIC, BIC, ssaBIC values, higher entropy scores (0.84 vs. 0.79), and a significant LMR-A-LRT p-value. A 5-class model then indicated a slightly superior fit in comparison to the 4-class solution, with lower AIC, BIC, ssaBIC values, higher entropy value (0.86 vs. 0.84), and a significant LMR-A-LRT p-value. Finally, a six-class model did not indicate a significant improvement from a 5-class solution; hence, no further consideration of solutions was conducted.
The 5-class solution represented the model most likely to be of best fit. In this model (see Table 2), 37.1% (n = 210) of the sample were assigned into class 1, scoring low on schizotypy, autistic traits, conspiracy beliefs and intermediate on analytical thinking, active open-minded thinking and scientific reasoning. Class 2 represented 23.0% (n = 130) of the sample, demonstrating low scores on schizotypy, autistic traits, analytical thinking, scientific reasoning and intermediate scores on active open-minded thinking and conspiracy beliefs. Class 3 represented 17.8% (n = 101) of the sample, demonstrating low scores of schizotypy, active open-minded thinking, and moderate scores of autistic traits, analytical thinking, scientific reasoning and conspiracy beliefs. Class 4 represented 9.0% (n =51) of the sample, with low scores on scientific reasoning and active open-minded thinking, high/intermediate scores on schizotypy, autistic traits and conspiracy beliefs. Finally, Class 5 represented 12.9% (n = 73) of the sample, with low scores on scientific reasoning, analytical thinking, intermediate scores on autistic traits and active open-minded thinking, and high scores on schizotypy and conspiracy beliefs. Average latent class probabilities for most likely latent class membership were 0.93 for class 1, 0.91 for class 2, 0.83 for class 3, 0.80 for class 4, and 0.93 for class 5, which indicates good overall discriminate validity between most classes.
The mean score of all psychometric measures as a function of Latent Class was presented in Table 2. Consistent with our hypotheses and previous work of Georgiou et al., (2021b), those within Class 4 and Class 5 who scored highest on both psychopathological measures (i.e. AQ – 10, MSS – B) and CT belief measures, had the lowest SRS scores of all classes. Further, those within Class 1, who scored highest on SRS scores, had scored the lowest on both measures of CT beliefs and psychopathological measures. However, scores on measures of Analytical thinking (i.e. REIm – R) and open-mindedness (AOT) did not follow a distinct pattern as a function of Latent Class.
Pairwise comparisons (mean differences) and BADE performance as a function of class membership.

Within a 4-Class Latent model, Class 1 represented 203 (25.9%) of the sample and alike the previous model presented, scored low on schizotypy, autistic traits, conspiracy beliefs and intermediate on analytical thinking, active open-minded thinking and scientific reasoning. Class 2 represented 238 (42.1%) cases, scoring low on schizotypy, COVID-19–related conspiracy beliefs and scientific reasoning, and intermediate on autistic traits, general conspiracy beliefs, analytical thinking and active open-minded thinking. Class 3 represented 54 (9.5%) of the sample with low scores on scientific reasoning and active open-minded thinking, high/intermediate scores on schizotypy, autistic traits and conspiracy beliefs. Class 4 represented 70 (12.3%) of the sample, with low scores on scientific reasoning, analytical thinking, intermediate scores on autistic traits and active open-minded thinking, and high scores on schizotypy and conspiracy beliefs. Average latent class probabilities for most likely class membership was once again 0.92 for Class 1, followed by 0.92 for Class 4, 0.83 for class 3, and 0.79 for class 3 which again, indicates good discriminant validity between most classes.
Pairwise comparisons (mean differences) and BADE performance as a function of the 4-class model.

Discussion
The present study assessed the extent to which latent class membership, combining scores on autistic and schizotypy traits, along with associated socio-cognitive factors, was related to CT beliefs and related performance measures (i.e. scientific reasoning, cognitive flexibility). LPA analysis identified five latent profiles as based on the variable combinations within the present sample. As hypothesised, it was found individuals with high CT beliefs, would have the highest clinical scores, lower scientific reasoning scores and a stronger bias against disconfirmatory evidence. No significant group differences were found for socio-demographic factors such as education and gender.
Latent profile analysis outcomes
In terms of overall 5-class structure, the emergence of Class 1 (37.1%) which had low clinical scores and conspiracy beliefs, intermediate analytical thinking, but high scientific reasoning is consistent with previous variable-centred approach of Georgiou et al (2021a). Specifically, this supports the notion that individuals who possess higher scientific reasoning ability and lower clinical scores appeared to be less likely to hold CT beliefs. These findings are consistent with the findings of Cavajova et al. (2020b) Lantian et al. (2021) and Pennycook et al. (2021) who have argued that increasing critical reasoning skills within the general population could help to debunk and reduce the influence of conspiracy beliefs. The second group of participants, or Class 2 (23.0%), appeared to support this logic quite well. This group had low clinical (AQ or schizotypy) scores but had lower scientific reasoning scores and higher levels of CT beliefs, which indicates that the absence of good scientific reasoning skills (as opposed to other clinical characteristics) may have been influential (Cavajova et al. 2020b; Georgiou et al., 2021a).
The identification of Classes 4 and 5 in the 5-Class structure possessing intermediate to high scores on both clinical measures (i.e. autistic and schizotypal traits) and with the lowest scores on scientific reasoning and highest conspiracy belief scores supports previous CT literature that has found a consistent positive association between schizotypy, autistic traits and conspiracy beliefs (see Barron et al., 2014, 2018; Denovan et al., 2020; Georgiou et al., 2019, 2021c; Orri et al., 2017). The LPA also highlighted the co-occurrence of autistic and schizotypal traits as indicated by Class 4 and 5, but some support was also obtained for the diametrical model of autism (Abu-Akel & Bailey, 2000; Salice & Henriksen, 2021). Class 4 represents individuals who scored above the clinical threshold for autism spectrum disorder, who reported engaging in analytical thought but who were still prone to stronger CT beliefs, whereas Class 5 contained highly schizotypal individuals with higher CT beliefs, and were more susceptible to cognitive biases as indicated by their poor performance on the BADE task (Barron et al., 2014, 2018; Denovan et al., 2020; Georgiou et al., 2019; Georgiou et al., 2021b). This evidence of mixed groups, in which higher analytical reasoning scores co-occurred with higher CT beliefs, also supports the suggestions of Georgiou et al. (2021a, 2021c) that multiple avenues may exist to CT beliefs in neurodivergent individuals. Moreover, alike the findings of Class 2, the results of Class 4 support Georgiou et al. (2021a) as those with relatively intact analytical thinking still demonstrated poor scientific reasoning skills, which, in turn, suggests that a lack of scientific reasoning is the more accurate antecedent to endorsing CT beliefs.
In terms of the 4-Class structure, the emergence of Class 2 (42.1%), which could be considered a borderline group with intermediate scores on autistic traits and moderate levels of CT beliefs, demonstrates that CT beliefs are not exclusive to the higher ends of psychopathology (Georgiou et al., 2021a, 2021c, 2021d). This finding aligns with the dimensional approach to CT beliefs in the general population put forth by Barron et al. (2018) as individuals below the clinical threshold for autism demonstrated a similar propensity to adopt erroneous beliefs as those potentially in the more extreme groups (i.e. likely to have received a formal diagnosis). In this context, future research using latent profiles could provide a more sophisticated understanding of interactions between socio-cognitive factors and conspiracy beliefs to better understanding potential borderline groups (i.e. subclinical levels of autistic traits).
Limitations
It is important to acknowledge the several limitations of the current study. First, the relative distributions of belief in conspiracy theories, schizotypy and autistic traits are a potential limitation on the current study. As respondents came from a general, non-clinical population, measures of schizotypy and autism tended toward scores below the clinical cut-off and may not be generalisable to clinical cases. Further, the distinctions made between analytical thinking and scientific reasoning performance are based upon self-report. Hence, the use of a behavioural measure of analytical thinking would benefit future research. Although LPA may acknowledge the co-occurrence of schizotypy and autistic traits, it does not account for all potential psychological comorbidities. The latent profiles might also differ in more diverse samples, in that most people in the current study were highly educated. Further, although a case-centred approach has many benefits as previously discussed, LPA results need to be interpreted with caution. It is important to acknowledge that LPA merely identifies categories across dimensions included within the model not categories of individuals present within the population (see Lanza & Rhoades, 2013).
Conclusion
In sum, the current study contributes to the previous variable-centred research that debate what may be predictive of CT beliefs. When accounting for the co-occurrence of autistic and schizotypal traits, we did not find support that higher autistic traits independently predicted CT beliefs, but the results did support the view of Georgiou et al. (2021a) that scientific reasoning appears to better differentiate variation in CT beliefs across groups than differences in analytical reasoning. As in Georgiou et al. (2021a), LPA analysis has affirmed that the ability to process large amounts of evidence, in conjunction with logical and scientific reasoning skills, are the likely protective factors against CT belief formation. As LPA offers a heterogenic approach to CT beliefs, future studies using latent profiles could provide a more sophisticated understanding of the interactions between socio-cognitive factors that may be important barriers to conspiracy beliefs (i.e. scientific reasoning ability, adaptable thinking styles) within potential borderline groups (i.e. subclinical levels of schizotypy and autistic traits), particularly in the context of future CT research focussed on an intervention approach.
Footnotes
Declaration of conflicting interests
The author(s) declared no potential conflicts of interest with respect to the research, authorship, and/or publication of this article.
Funding
The author(s) received no financial support for the research, authorship, and/or publication of this article.
Ethical approval
This project received ethics approval by the Human Research Ethics Subcommittee in the University of Adelaide’s School of Psychology as a low risk application.
Data availability statement
The data that support the findings of this study are available from the corresponding author.