
Abstract
Depression is a common problem with debilitating effects. Both negative interpretation biases and rumination are related to depression, but how these factors interact to produce depression is unclear. Prior cross-sectional research indicates that negative interpretation biases have an indirect effect on depression symptoms through rumination, but to date, no longitudinal studies have examined this indirect effect, and prior studies have not differentiated between rumination subtypes. To examine these questions, data were collected online at three time points from undergraduates. Simple mediational models examined whether negative interpretation bias had an indirect effect on depression symptoms through rumination and rumination subtypes (brooding and reflection), and reverse models examined direction of effects. Cross-sectional analysis supported prior findings that interpretation bias had an indirect effect on depression symptoms through rumination, β = −.19, 95%CI [−.23, −.14], through both brooding, β = −.14, 95%CI [−.18, −.10], and reflection subtypes, β = −.09, 95%CI [−.12, −.05]. However, longitudinal analyses found no indirect effects of interpretation bias on depression symptoms through rumination, β = −.02, 95%CI [−.07, .02]; brooding: β = −.02, 95%CI [−.06, .01], reflection: β = .01, 95%CI [−.02, .04]. These longitudinal results contradict findings that cognitive biases lead to depression symptoms through rumination. The complex interplay between cognitive biases, rumination, and depression remains an important direction for future research.
The experience of a sad mood is a common phenomenon, yet most individuals do not experience long-lasting states of dysphoria or become clinically depressed. In contrast, others are more liable to depression symptoms, resulting in significant disruptions to daily functioning (Morrow & Nolen-Hoeksema, 1990; Nolen-Hoeksema, 1991). Why might this variability exist among individuals? Both negative cognitive biases and rumination are factors associated with the onset, severity, and duration of depression, but the way in which these cognitive factors interact to confer risk for depression is unclear. Prior cross-sectional research suggests that rumination may play the role of a mediator, causing negative cognitive biases to lead to the development and maintenance of depression. To date, however, few studies have examined these associations longitudinally.
Negative interpretation bias
Studies have consistently shown maladaptive cognitive biases to be closely associated with depression symptoms (Cowden Hindash & Rottenberg, 2017; Everaert, Podina, et al., 2017; Lawson et al., 2002; Lee et al., 2016; Teasdale, 1983; Wisco & Nolen-Hoeksema, 2010). Individuals prone to depressed mood display negative biases in memory and attention, showing an increased focus on negatively valenced information and exaggerated recall of distressing memories compared to non-dysphoric individuals (Everaert, Podina, et al., 2017; Wisco et al., 2014). Those highly vulnerable to, and suffering from, depression also engage in exceedingly negative evaluations of themselves and hold dismal views of possible future events (Pyszczynski et al., 1987; Wisco, 2009), and such negative biases often result in more debilitating depressive symptoms (Lee et al., 2016).
Negative interpretation bias, a specific type of bias in the interpretation of ambiguous information, is of interest to the present study. Situations are often ambiguous in nature and can be interpreted in a multitude of ways. Consider a scenario in which you are asked to give a presentation to a group of colleagues. As the presentation concludes, you examine the expressions on the faces of your audience, looking for some indication of their evaluation of the presentation. They show no clearly discernable expressions. If you have a negative interpretation bias, you might mistakenly imagine the audience is harboring harsh criticisms of your work and you must have done a poor job. Dysphoric individuals exhibit patterns of evaluating and assigning emotionally relevant meaning to ambiguous information in a manner that is decidedly negative (Lee et al., 2016) and do so to a higher degree than non-dysphoric persons (Everaert, Podina, et al., 2017; Krahe et al., 2019). It should be noted that these negative interpretation biases appear most pronounced when situations are directly relevant to oneself (Cowden Hindash & Rottenberg, 2017; Wisco, 2009; Wisco & Nolen-Hoeksema, 2010). A bias toward negatively interpreting information that may be both highly self-relevant and emotionally meaningful is thought to contribute to the development and maintenance of depression (Lawson et al., 2002; Wisco & Nolen-Hoeksema, 2010). Negative cognitive content alone, however, may not invariably lead to a state of persistent and debilitating depression (Wisco et al., 2014). It has been unclear whether a pattern of holding negative interpretation biases of ambiguous stimuli can be said to precede and predict the development of depression symptoms. Differences can be found in the methods used to study the relationship between these variables and the way interpretation bias is measured. The question has been raised whether negative interpretation biases occur prior to, or are a result of, depression symptoms, indicating the need for longitudinal studies (Everaert, Podina, et al., 2017).
Rumination as a risk factor
Although negative cognitive content is often closely related to dysphoria, the way in which individuals respond to negative thoughts and moods is of central importance (Nolen-Hoeksema, 1991). A distinction has been made in the literature between the negative cognitive content that accompanies depression and the processing of that content (Ciesla & Roberts, 2007; Nolen-Hoeksema, 1991; Nolen-Hoeksema et al., 1993; Wisco et al., 2014). Rumination is a maladaptive style of processing the distress associated with depressed mood (Nolen-Hoeksema, 1991; Nolen-Hoeksema et al., 2008). The ruminative response style is characterized by engaging in thoughts and behaviors that facilitate a focusing of one’s attention on experienced distress, as well as potential causes or consequences of those distressing symptoms. Rumination is essentially perseverative in nature, creating great difficulty disengaging, or separating oneself, from the negative cognitive content (Nolen-Hoeksema, 1991).
Rumination is viewed as being a self-focused and symptom-focused process (Lyubomirsky & Nolen-Hoeksema, 1993; Nolen-Hoeksema et al., 1993; Wisco et al., 2014). When ruminating, individuals dwell on problems repetitively and passively, neglecting an active approach to resolving problems, which perpetuates depressed mood (Lyubomirsky & Nolen-Hoeksema, 1993; Nolen-Hoeksema, 1991; Nolen-Hoeksema et al., 1993, 2008). Rumination affects both the severity and duration of depression and predicts individuals’ proneness to future depressive episodes (Ciesla & Roberts, 2007; Kuehner & Weber, 1999; Morrow & Nolen-Hoeksema, 1990; Nolen-Hoeksema et al., 1993, 2008; Spasojevic & Alloy, 2001).
Rumination as a mechanism
Given that interpretation biases appear to be strongly associated with depression and rumination is a vehicle for processing negative cognitive content, rumination may be a mechanism through which interpretation biases and depression symptoms are linked. In fact, others have proposed this very idea and supporting evidence has been found. Rumination is significantly associated with negative cognitive styles (Krahé et al., 2019; Spasojevic & Alloy, 2001), and negative cognitive styles moderate the association between rumination and depression symptoms, such that this association is stronger as negative cognitive styles increase. Additionally, predictable changes in depressive symptoms have been observed via the processing of negative cognitive biases through rumination (Ciesla & Roberts, 2007). Not only has an association consistently been found between cognitive biases, rumination, and depression (Nolen-Hoeksema et al., 2008; Spasojevic & Alloy, 2001; Treynor et al., 2003; Wisco et al., 2014), but studies have also demonstrated that rumination mediates the relationship between those biases and the resulting depression symptoms (Everaert, Grahek, et al., 2017; Lo et al., 2008; Wisco et al., 2014). To gain insight into this process, rumination itself must be carefully operationalized and understood.
Views of rumination as a construct and the way it contributes to depression are now more nuanced than before. Rumination has been reconceptualized and a two-factor model proposed with two distinct subtypes: brooding and reflective pondering (Nolen-Hoeksema et al., 2008; Treynor et al., 2003). Brooding, viewed as the passive and maladaptive form of rumination, can be contrasted with reflective pondering, seen as an active and potentially adaptive ruminative subtype. A stronger association appears between passive brooding and depression symptoms than reflection and depression symptoms (e.g., Marroquin et al., 2010). When comparing non-depressed individuals with those experiencing a current major depressive episode, currently depressed individuals show significantly higher levels of brooding, as do individuals with remitted depression (Joormann et al., 2006). An association between brooding, bias in attention to negatively valenced stimuli, and depression has also been demonstrated (Joormann et al., 2006). A significant indirect effect of negative cognitive biases on depression through brooding has been observed (Everaert, Grahek, et al., 2017). When compared to reflection, brooding appears to be the mediating factor that links negative styles of thought to the development of depression (Lo et al., 2008).
Although prior research has examined associations between negative interpretation biases, rumination, and depression, the current literature is limited due to reliance on cross-sectional data and little consideration of rumination subtypes. When assessing rumination as a potential mediator linking interpretation biases and depression symptoms, all studies to date have been cross-sectional in design (Davis & Nolen-Hoeksema, 2000; Everaert, Grahek, et al., 2017; Lo et al., 2008; Wisco et al., 2014). The use of cross-sectional designs to examine complete or partial mediation has been criticized because cross-sectional studies may not provide accurate representations of processes that unfold over time. In tests of mediation and the search for causal explanations, longitudinal designs are considered most appropriate (Maxwell & Cole, 2007; Maxwell et al., 2011). Additionally, brooding and reflection have only been directly compared as a mediator of the association between negative cognitive styles and depression in one study to date (Lo et al., 2008). The aim of the current study was to extend prior theories and research by examining the role of rumination in the relationship between interpretation biases and depressive symptoms using a longitudinal design, while differentiating between brooding and reflection. Given the evidence found in the literature thus far, we hypothesized that negative interpretation bias would have a significant indirect effect on depression symptoms through rumination, and more precisely through brooding. We predicted there would be no significant indirect effect through reflection. By assessing this process longitudinally, causal conclusions may be drawn with greater confidence.
Method
Participants
Study participants were undergraduates taking part in an online survey at a large university in the Southeastern U.S. The survey was administered at three time points over the course of one semester (∼14 weeks). Seven hundred and fourteen participants provided informed consent and completed a mass screening at the beginning of the semester. The mass screening is administered to all participants in the pool and is used by researchers to prescreen potential participants into other studies. For the purpose of this study, all participants who provided mass screening data were invited to participate in two follow-up surveys. Those who elected to participate in the follow-up provided consent to link their mass screening data to their responses on the Time 2 and Time 3 surveys. Of the 714 participants who completed the Time 1 assessment, 334 (46.8%) elected to participate in the follow-up study and provided data at Time 2. Of those who elected to participate in the follow-up surveys, 56 (20.1%) were lost to follow-up and 278 (83%) completed the Time 3 assessment. Thus, the final sample for longitudinal analyses consisted of the 278 who elected to participate in the follow-up surveys and completed measures at all three assessment time points. This rate of recruitment into follow-up studies is consistent with previous research using mass screening procedures (Clapp et al., 2019; Pugach et al., 2021), as almost all students in the participant pool complete the mass screening, but only a subset participate in any one of the many studies offered to the pool each semester. All participants were aged 18 or older and demographic data for both groups is available in Table 1, along with the percentage of each sample who reported depressive symptoms. Compared to participants who did not provide follow-up data, the 278 individuals who participated in the follow-up did not differ on Time 1 depression symptom severity, F(1, 714) = 0.9, p = .34, but were significantly more likely to be female, χ2 (1, N = 278) = 14.8, p < .001, and white, χ2 (6, N = 278) = 17.9, p = .007. In terms of anxiety symptoms, participants reported a mean score of 31.6 (SD = 10.6) on the Anxious Arousal subscale of the Mood and Anxiety Symptom Questionnaire at Time 1 (Watson et al., 1995). Of the participants who reported at least mild depression symptoms at the Time 3 assessment (BDI-II score ≥ 14, n = 66), 36 were “new onsets” (had reported BDI-II scores < 14 at Time 1) and 30 were “continuing cases” (reported scores ≥ 14 at Time 1 and 3). Of the participants who reported moderate-to-severe depression symptoms at Time 3 (BDI score ≥ 20, n = 42), 22 were new onsets and 20 were continuing cases.
Participant characteristics.

Note. The Time 3 assessment time point was used for BDI-II scores for the follow-up sample. BDI-II: Beck Depression Inventory-II.
Measures
Demographics
A survey querying sex, race, and other demographic variables was used to provide descriptive information about the sample.
Ambiguous Scenarios Test relevant to Depressed Mood-II (AST-D-II)
The AST-D-II is an index of how prone individuals are to negatively biased interpretations of everyday situations and was designed to measure negative interpretation biases as they relate specifically to depressed mood (Rohrbacher & Reinecke, 2014). The AST-D-II is a revised version of the original 24-item AST-D (Berna et al., 2011). A unique feature of the AST-D-II is that two parallel 15-item forms were developed, making it ideally suited to repeated assessment; in this study, Form A was administered at Time 1 and Form B was administered at Time 2. In each form, participants are presented with 15 descriptions of ambiguous scenarios, situations that can be evaluated in multiple ways (e.g. “You give a speech at your friend’s wedding. When you have finished, you observe the audience’s reaction”). Instructions are given to visualize each situation as if one were personally experiencing it, then rate how pleasant the scenarios are imagined to be. Pleasantness ratings for each scenario follow a Likert-type scale from −5 (extremely unpleasant) to 5 (extremely pleasant). Lower pleasantness ratings, a marker of negative interpretation biases, are associated with higher levels of dysphoria. This measure has been well-validated and shown to possess good psychometric properties (Rohrbacher & Reinecke, 2014). In this study, the AST-D-II demonstrated good internal consistency (Time 1 Cronbach’s α = .78; Time 2 α = .81)
Response Styles Questionnaire (RSQ)
The RSQ evaluates patterns of responding to depressed mood. The Ruminative Responses Scale (RRS) of the RSQ was used for this study and measures participants’ tendency to engage in a ruminative coping style that is both self- and symptom-focused in response to depressed mood. This 22-item self-report measure has shown good test–retest reliability, as well as predictive and convergent validity (Nolen-Hoeksema, 2000). Respondents rate each item on a scale ranging from almost never (1) to almost always (4). In addition, the RRS can be further broken down into distinct subscales: brooding and reflection. Five items are representative of brooding (e.g., “Think ‘Why can’t I handle things better?’”) and 5 items capture reflection (e.g., “Write down what you are thinking and analyze it”) (note that 12 RRS items are not included in either subscale). Although these subscales are each composed of a relatively small number of items, they have demonstrated good internal consistency. The brooding and reflection scales of the RRS show good concurrent and predictive validity (Treynor et al., 2003). In this study, the total score and both subscales demonstrated good internal consistency at both time points (αs ranged from .83 to .96).
Beck Depression Inventory-II (BDI-II)
The BDI-II is a self-report measure consisting of 21 items used to assess symptoms and severity of depression. Responses for each item are provided on a 4-point scale (from 0 = Not at all to 3 = Severely). A total score reflecting individuals’ depression severity is derived from the sum of all answers. The BDI-II is commonly used and well-validated as a measure of depression symptoms for both psychiatric and outpatient populations (Beck et al., 1996). In this study, the BDI-II demonstrated good internal consistency at all three time points (αs of .90, .91, and .94).
Mood and Anxiety Symptom Questionnaire–Anxious Arousal (MASQ-AA) subscale
The anxious arousal subscale of the MASQ-AA was administered to get descriptive data on anxiety symptoms (Watson et al., 1995). The MASQ-AA scale consists of 17 items assessing physical symptoms of anxiety (e.g., “heart was racing or pounding”), that are scored on a 5-point Likert-type scale from Not at all (1) to Extremely (5). Possible scores range from 17 to 85, with higher scores reflecting higher anxiety. The MASQ-AA has demonstrated good psychometric properties in prior work and has demonstrated particularly good divergent validity with depression measures (Watson et al., 1995).
Procedure
An undergraduate participant pool was used to recruit participants, who were given course credit as compensation for taking part in the study. Participants completed online surveys at three time points over the course of one semester. Data were collected at the beginning (Time 1), middle (Time 2), and end (Time 3) of the semester through Qualtrics survey software. Specifically, the number of days that elapsed between completion of the Time 1 and Time 2 surveys ranged from 26 to 61 (M = 43.78, SD = 8.48), and the number of days between Time 2 and Time 3 surveys ranged from 27 to 56 (M = 39.49, SD = 6.78). The online surveys consisted of self-report measures including the BDI-II, Ruminative Response Scale of the RSQ, and Ambiguous Scenarios Test relevant to Depressed Mood (AST-D-II). Participant scores on all three measures at Time 1, on the RSQ and AST-D-II at Time 2, and BDI-II at Time 3 were analyzed. Means and standard deviations for study measures, and bivariate correlations between measures, are provided in Table 2. All study procedures were approved by our university’s Institutional Review Board.
Bivariate associations between study variables. Measures of interpretation bias, rumination, and depression symptoms at three time points.

Note. AST-D-II = Ambiguous Scenarios Test relevant to Depressed Mood and measured INTERPRETATION bias; RSQ = Response Styles Questionnaire and measured rumination; BDI-II = Beck Depression Inventory-II and measured depression symptoms; M = mean; SD = standard deviation.
**p < .01.
Data analytic plan
All analyses were run using SPSS version 26. Models were run using the PROCESS macro (version 3; Hayes, 2018) with the following model specifications: model 4 (simple mediational models), 95% CIs, and 5000 samples for bootstrapping. We first analyzed cross-sectional data to replicate and extend prior research. Our cross-sectional analyses included data from the 714 participants who completed all measures of interpretation bias, rumination, and depression symptoms at Time 1. In the initial cross-sectional analysis, we examined the indirect effect of interpretation bias (predictor) on depression symptoms (outcome) through rumination (mediator). A reverse cross-sectional model was next used to investigate any indirect effect of rumination on depression symptoms through interpretation bias. We also reran this cross-sectional model (and reverse model) with brooding and reflection separately.
We also planned longitudinal analyses using data from the 278 participants who completed all three assessment time points from Time 1 to Time 3. Data were again analyzed with simple mediational models including AST-D-II Form A scores at Time 1 as the predictor, RSQ scores at Time 2 as the mediator, and BDI-II scores at Time 3 as the outcome variable, with RSQ and BDI-II scores at Time 1 entered as covariates. We used the default setting for covariates, which controls for the paths from each covariate to the mediator and for the paths from each covariate to the outcome variable. When testing the reverse model longitudinally, we used RSQ scores at Time 1 as the predictor and the AST-D-II Form B at Time 2 as the mediator (again predicting BDI-II scores at Time 3 and including AST-D-II Form A and BDI-II scores at Time 1 as covariates). Finally, we ran separate longitudinal analyses examining brooding and reflection as mediators as well as reverse models testing both as the predictors, using the same specifications.
Results
Cross-sectional model
In our first cross-sectional analysis using interpretation bias as the predictor, rumination as a mediator, and depression symptoms as the outcome, there was a significant association between interpretation bias and rumination, a = −.24, p < .001, 95% CI [−.29, −.19]. A significant association was also found between rumination and depression symptoms, controlling for interpretation bias, b = .36, p < .001, 95% CI [.32, .39]. A significant indirect effect of interpretation bias on depression symptoms through rumination was seen, ab = −.09, 95% CI [−.11, −.06], and the proportion of the total effect explained by the indirect effect was 0.61. This finding replicates prior cross-sectional studies suggesting an indirect effect of interpretation biases on depression symptoms through rumination. The direct effect of interpretation bias on depression symptoms was also significant, c′ = −.06, p < .001, 95% CI [−.09, −.03], indicating that rumination only partially mediated this association. Results are presented in Figure 1.

Indirect effect of interpretation bias on depression symptoms through rumination (cross-sectional analysis). Note. ***p < .001. Standardized coefficients are presented. The total effect of interpretation bias on depression symptoms is provided, with the direct effect of interpretation bias on depression symptoms given in parentheses. The completely standardized indirect effect was −.19, 95% CI [−.23, −.14].
In the reverse model, rumination was used as the predictor variable, interpretation bias as the mediator, and depression symptoms as the outcome. A significant association was found between rumination and interpretation bias, a = −.39, p < .001, 95% CI [−.49, −.31]. A significant association was also seen between interpretation bias and depression symptoms, controlling for rumination, b = −.06, p < .001, 95% CI [−.09, −.03]. The direct effect of rumination on depression symptoms, was significant, c′ = .36, p < .001, 95% CI [.32, .39]. The indirect effect of rumination on depression symptoms through interpretation bias was also significant, ab = .02, 95% CI [.01, .04] (see Figure 2), although the proportion of the total effect explained by the indirect effect was small (.06). The outcome of this reverse model is not consistent with the results of prior cross-sectional research, which found no significant indirect effects of rumination on depression symptoms through interpretation bias (Wisco et al., 2014). 1

Indirect effects of rumination on depression symptoms through interpretation bias (reverse cross-sectional analysis). Note. ***p < .001. Standardized coefficients are presented. The total effect of rumination on depression symptoms is provided, with the direct effect of rumination on depression symptoms given in parentheses. The completely standardized indirect effect was .04, 95% CI [.02, .06].
Longitudinal model
All longitudinal models controlled for Time 1 scores of the mediator (rumination for main models, interpretation bias for reverse models) and Time 1 scores of the outcome variable (depression symptoms in all models) by entering those variables as covariates in the model (which includes the paths from each covariate to the mediator and from each covariate to the outcome variable). In our main longitudinal analysis, interpretation bias at Time 1 did not predict rumination at Time 2, a = −.05, p = .225, 95% CI [−.12, .03]. However, rumination at Time 2 did significantly predict depression symptoms at Time 3, controlling for interpretation bias at Time 1, b = .28, p < .001, 95% CI [.19, .37]. There was no significant direct effect of interpretation bias at Time 1 on depression symptoms at Time 3, c′ = .03, p = .222, 95% CI [−.02, .09], and no significant indirect effect of interpretation bias on depression symptoms through rumination, ab = −.01, 95% CI [−.04, .01]. The proportion of the total effect explained by the indirect effect was 0.50. Results are presented in Figure 3.

Indirect effect of Time 1 interpretation bias on Time 3 depression symptoms through Time 2 rumination (longitudinal analysis). Note. ***p < .001. Standardized coefficients are presented. The total effect of interpretation bias on depression symptoms is provided, with the direct effect given in parentheses. The completely standardized indirect effect was −.02, 95% CI [−.07, .02]. Not pictured, but included in the model, were two covariates: Time 1 rumination and Time 1 depression symptom scores.
The reverse longitudinal model was tested using rumination at Time 1 as the predictor variable, interpretation bias at Time 2 as the mediator, and depression symptoms at Time 3 as the outcome variable, including Time 1 interpretation bias and depression symptom scores as covariates. Rumination at Time 1 significantly predicted interpretation bias at Time 2, a = −.21, p = .03, 95% CI [−.39, −.03] (see Figure 4). Interpretation bias at Time 2 also significantly predicted depression symptoms at Time 3, controlling for Time 1 rumination, b = −.07, p = .02, 95% CI [−.13, −.01]. Rumination at Time 1 had a significant direct effect on depression symptoms at Time 3, c′ = .15, p = .001, 95% CI [.06, .24]. There was no significant indirect effect of rumination on depression symptoms through interpretation bias, ab = .02, 95% CI [−.002, .04], and the proportion of the total effect explained by the indirect effect was .09.
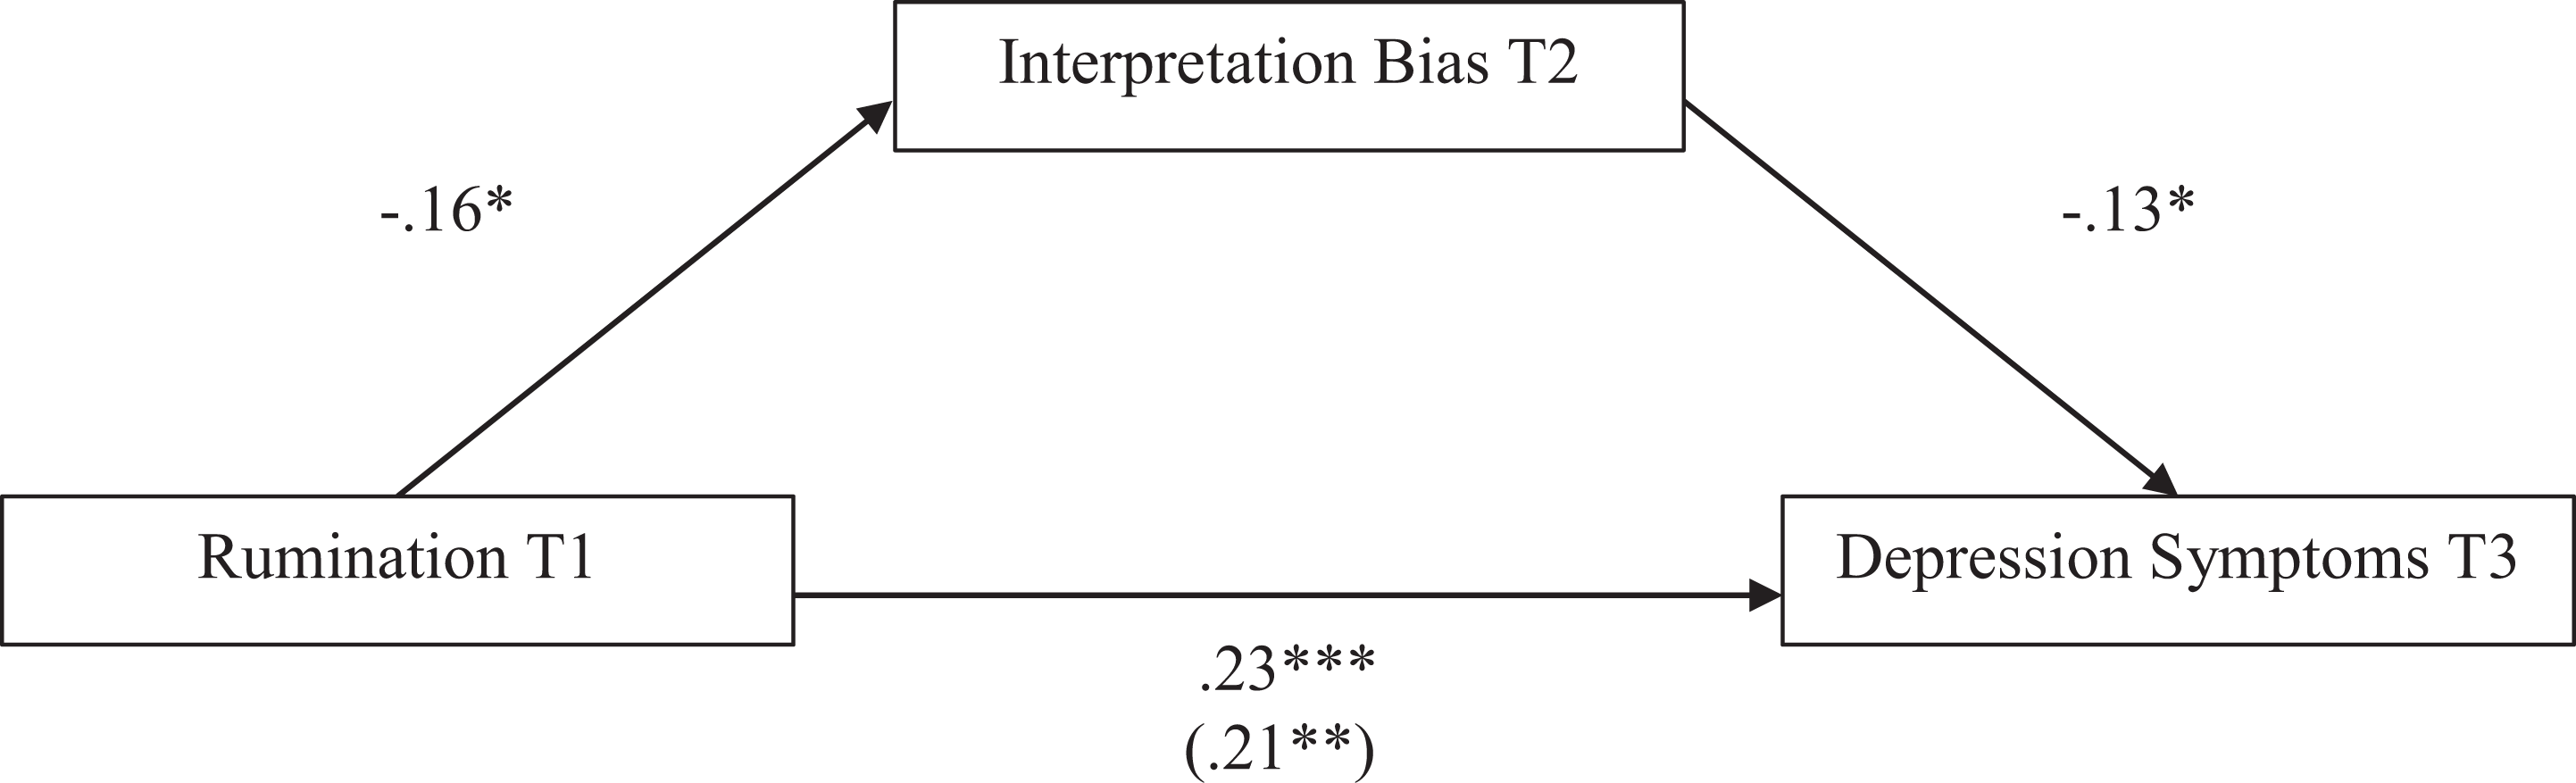
Reverse model testing indirect effects of Time 1 rumination on Time 3 depression through Time 2 interpretation bias (longitudinal analysis). Note. *p < .05; **p < .01; ***p < .001. Standardized coefficients are presented. The total effect of rumination on depression symptoms is provided, with the direct effect given in parentheses. The completely standardized indirect effect was .02, 95% CI [−.001, .054]. Not pictured, but included in the model, were two covariates: Time 1 interpretation bias and Time 1 depression symptom scores.
Brooding and reflection—Cross-sectional analyses
The subtypes of rumination, brooding and reflection, were also examined to see which subtype might be driving observed indirect effects of interpretation bias on depression symptoms. Brooding and reflection were each analyzed separately, first in cross-sectional models. We found a significant cross-sectional association between interpretation bias and brooding a = −.06, p < .001, 95% CI [−.07, −.04], as well as interpretation bias and reflection, a = −.04, p < .001, 95% CI [−.05, −.02]. Controlling for interpretation bias, the association between brooding and depression symptoms was significant, b = 1.14, p < .001, 95% CI [.99, 1.28], as was the association between reflection and depression symptoms, b = 1.01, p < .001, 95% CI [.85, 1.16]. A significant direct effect of interpretation bias on depression symptoms was found for both models: brooding, c′ = −.08, p < .001, 95% CI [−.11, −.05], and reflection, c′ = −.10, p < .001, 95% CI [−.13, −.06]. The indirect effects of interpretation bias on depression symptoms through brooding, ab = −.07, 95% CI [−.09, −.05], and reflection, ab = −.04, 95% CI [−.06, −.02], were both significant. The proportion of the total effect explained by the indirect effect through brooding was 0.45, and the proportion of the total effect explained by the indirect effect through reflection was 0.29. Examined cross-sectionally these results suggested that the indirect effects of interpretation bias on depression symptoms through rumination may be present for both rumination subtypes (see Figure 5(a) and (b)).
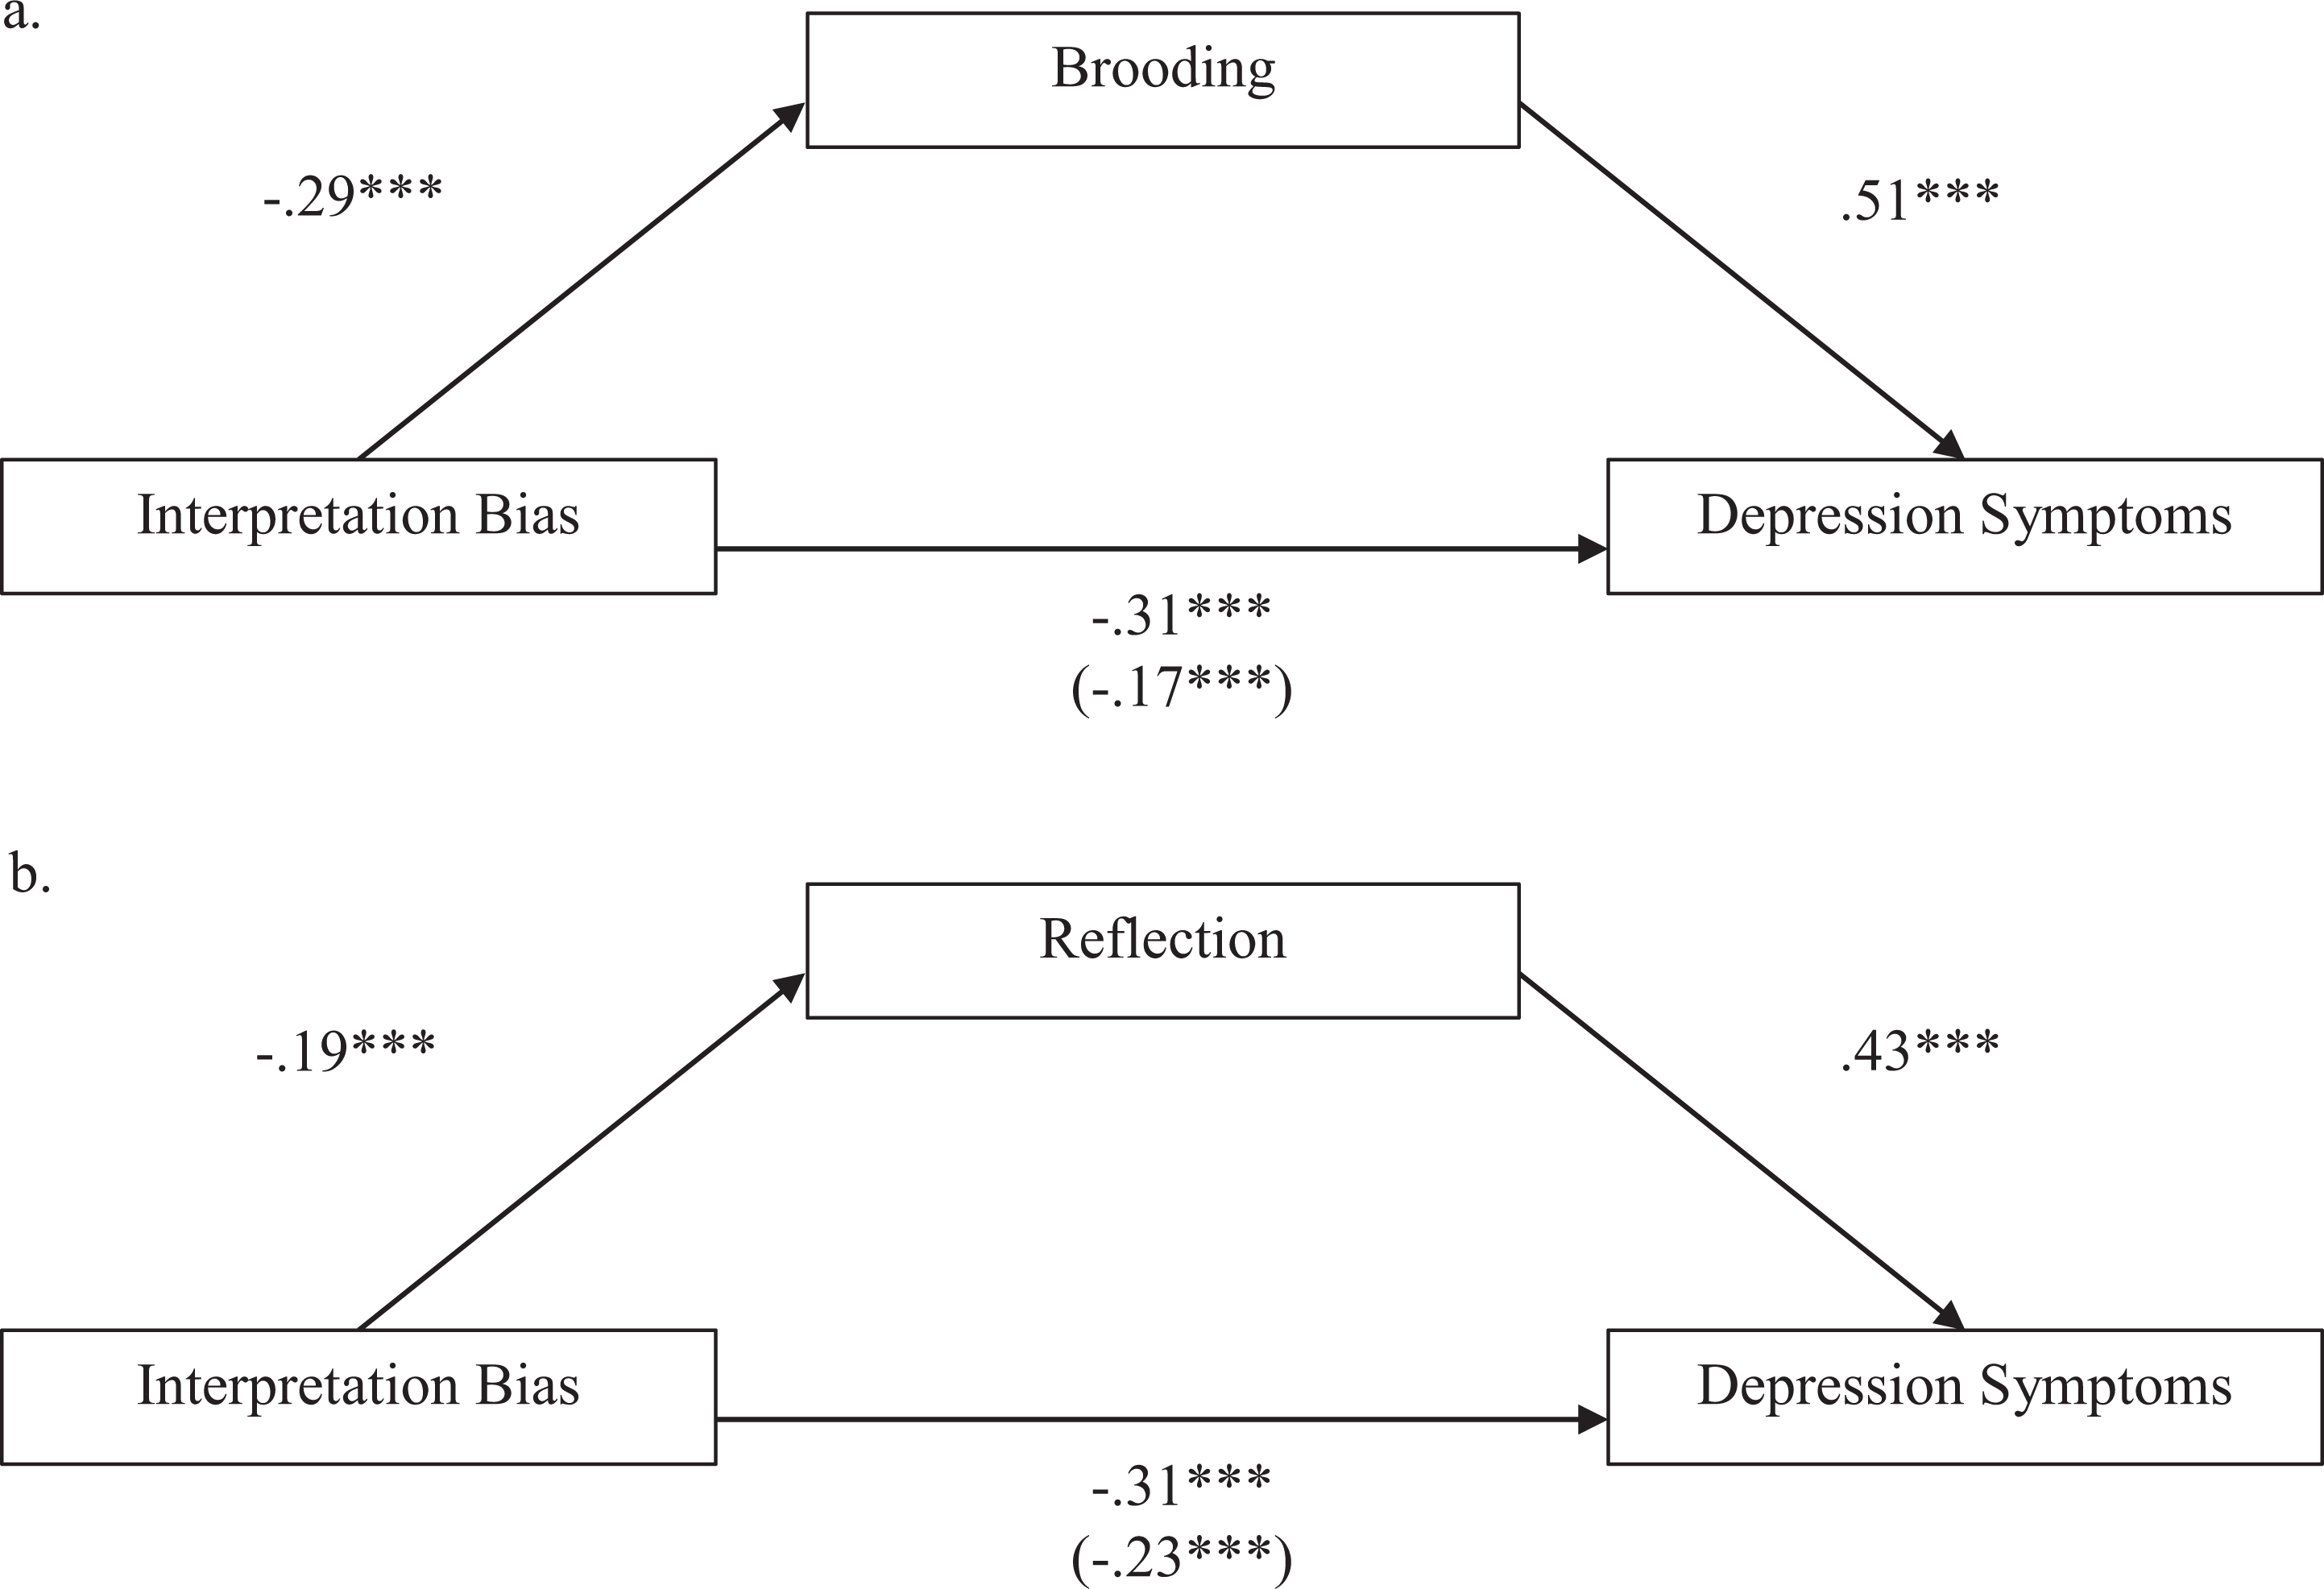
Indirect effects of interpretation bias on depression through brooding and reflection (cross-sectional analyses). Note. ***p < .001. Standardized coefficients are presented. The total effect of interpretation bias on depression symptoms is provided with the direct effect given in parentheses. The completely standardized indirect effect through brooding was −.14, 95% CI [−.18, −.10]. The completely standardized indirect effect through reflection was −.09, 95% CI [−.12, −.05].
We then ran the reverse cross-sectional models. We found a significant cross-sectional association between brooding and interpretation bias, a = −1.39, p < .001, 95% CI [−1.73, −1.04], as well as reflection and interpretation bias, a = −1.00, p < .001, 95% CI [−1.37, −0.64]. The association between interpretation bias and depression symptoms was significant both for the model including brooding b = −0.08, p < .001, 95% CI [−0.11, −0.05], and for the model including reflection, b = −0.10, p < .001, 95% CI [−0.13, −0.08]. A significant direct effect on depression symptoms was found for each ruminative subtype: brooding, c′ = 1.14, p < .001, 95% CI [1.00, 1.28], and reflection, c′ = 1.01, p < .001, 95% CI [0.86, 1.16]. The indirect effect of brooding on depression symptoms through interpretation bias, ab = 0.11, 95% CI [0.05, 0.17], and the indirect effect of reflection on depression symptoms through interpretation bias, ab = 0.11, 95% CI [0.05, 0.17], were both significant. However, the proportion of the total effect explained by the indirect effects through interpretation bias were small for both brooding (0.09) and reflection (0.08). Examined cross-sectionally these results suggested that the observed rumination findings were present for both brooding and reflection subtypes, and the significant indirect effects for both the main and reverse models rendered the direction of these effects unclear, although the proportion of the total effect explained by the indirect effect was much smaller for these reverse models than for the hypothesized models(see Figure 6(a) and (b)).

Reverse models testing indirect effects of brooding and reflection on depression symptoms through interpretation bias (cross-sectional analyses). Note. ***p < .001. Standardized coefficients are presented. The total effects of brooding/reflection on depression symptoms are provided with the direct effects given in parentheses. The completely standardized indirect effect of brooding on depression symptoms through interpretation bias was .05, 95% CI [.02, .08]. The completely standardized indirect effect of reflection on depression symptoms through interpretation bias was .04, 95% CI [.02, .07].
Brooding and reflection—Longitudinal analyses
Models with brooding and reflection were also examined longitudinally using data from Time 1 through Time 3. Interpretation bias at Time 1 did not predict brooding at Time 2, a = −.02, p = .107, 95% CI [−.04, .004], or reflection at Time 2, a = .01, p = .550, 95% CI [−.01, .03]. However, depression at Time 3 was significantly predicted by both brooding, b = .80, p < .001, 95% CI [.47, 1.14], and reflection, b = .81, p < .001, 95% CI [.50, 1.12], at Time 2, controlling for Time 1 interpretation bias. No significant direct effect of interpretation bias at Time 1 on depression at Time 3 was found, for either the brooding, c′ = .03, p = .217, 95% CI [−.02, .09], or the reflection model, c′ = .01, p = .781, 95% CI [−.05, .06]. There was also no significant indirect effect of interpretation bias on depression through brooding, ab = −.01, 95% CI [−.033, .004], or through reflection, ab = .01, 95% CI [−.01, .02]. The proportion of the total effect explained by the indirect effect was 0.50 for brooding and 0.50 for reflection. The results of these analyses suggest that interpretation bias may not lead to either brooding or reflection over time and brooding and reflection may not explain the relationship between interpretation bias and depression symptoms when examined longitudinally (see Figure 7(a) and (b)).

Indirect effects of Time 1 interpretation bias on Time 3 depression symptoms through Time 2 brooding and reflection (longitudinal analyses). Note. ***p < .001. Standardized coefficients are presented. The total effect of interpretation bias on depression symptoms is provided, with the direct effect of interpretation bias given in parentheses. The completely standardized indirect effect through brooding was −.02, 95% CI [−.06, .01]. The completely standardized indirect effect through reflection was .01, 95% CI [−.02, .04]. Not pictured, but included in the model, were two covariates: Time 1 brooding (or reflection) and Time 1 depression symptom scores.
Lastly, we ran longitudinal analyses with a reverse version of our initial model, with brooding and reflection as predictors and interpretation bias as the mediator, entering Time 1 interpretation bias and depression symptoms as covariates. Brooding at Time 1 significantly predicted interpretation bias at Time 2, a = −.97, p = .004, 95% CI [−1.6, −.32], but reflection at Time 1 did not, a = .07, p = .81, 95% CI [−.53, .68]. Interpretation bias at Time 2 significantly predicted depression symptoms at Time 3 in both the brooding, b = −.07, p = .02, 95% CI [−.13, −.01, and reflection models, b = −.08, p = .004, 95% CI [−.14, −.03]. We saw significant direct effects of Time 1 brooding, c′ = .54, p = .001, 95% CI [.22, .86], and of Time 1 reflection, c′ = .32, p = .03, 95% CI [.03, .62], on Time 3 depression symptoms. The indirect effects of Time 1 brooding, ab = .07, 95% CI [−.0002, .16], and Time 1 reflection, ab = −.001, 95% CI [−.07, .05], on Time 3 depression symptoms through Time 2 interpretation bias were not significant. The proportion of the total effect explained by the indirect effect was small for both models (.09 for brooding and .02 for reflection). Results are presented in Figure 8(a) and (b). 2
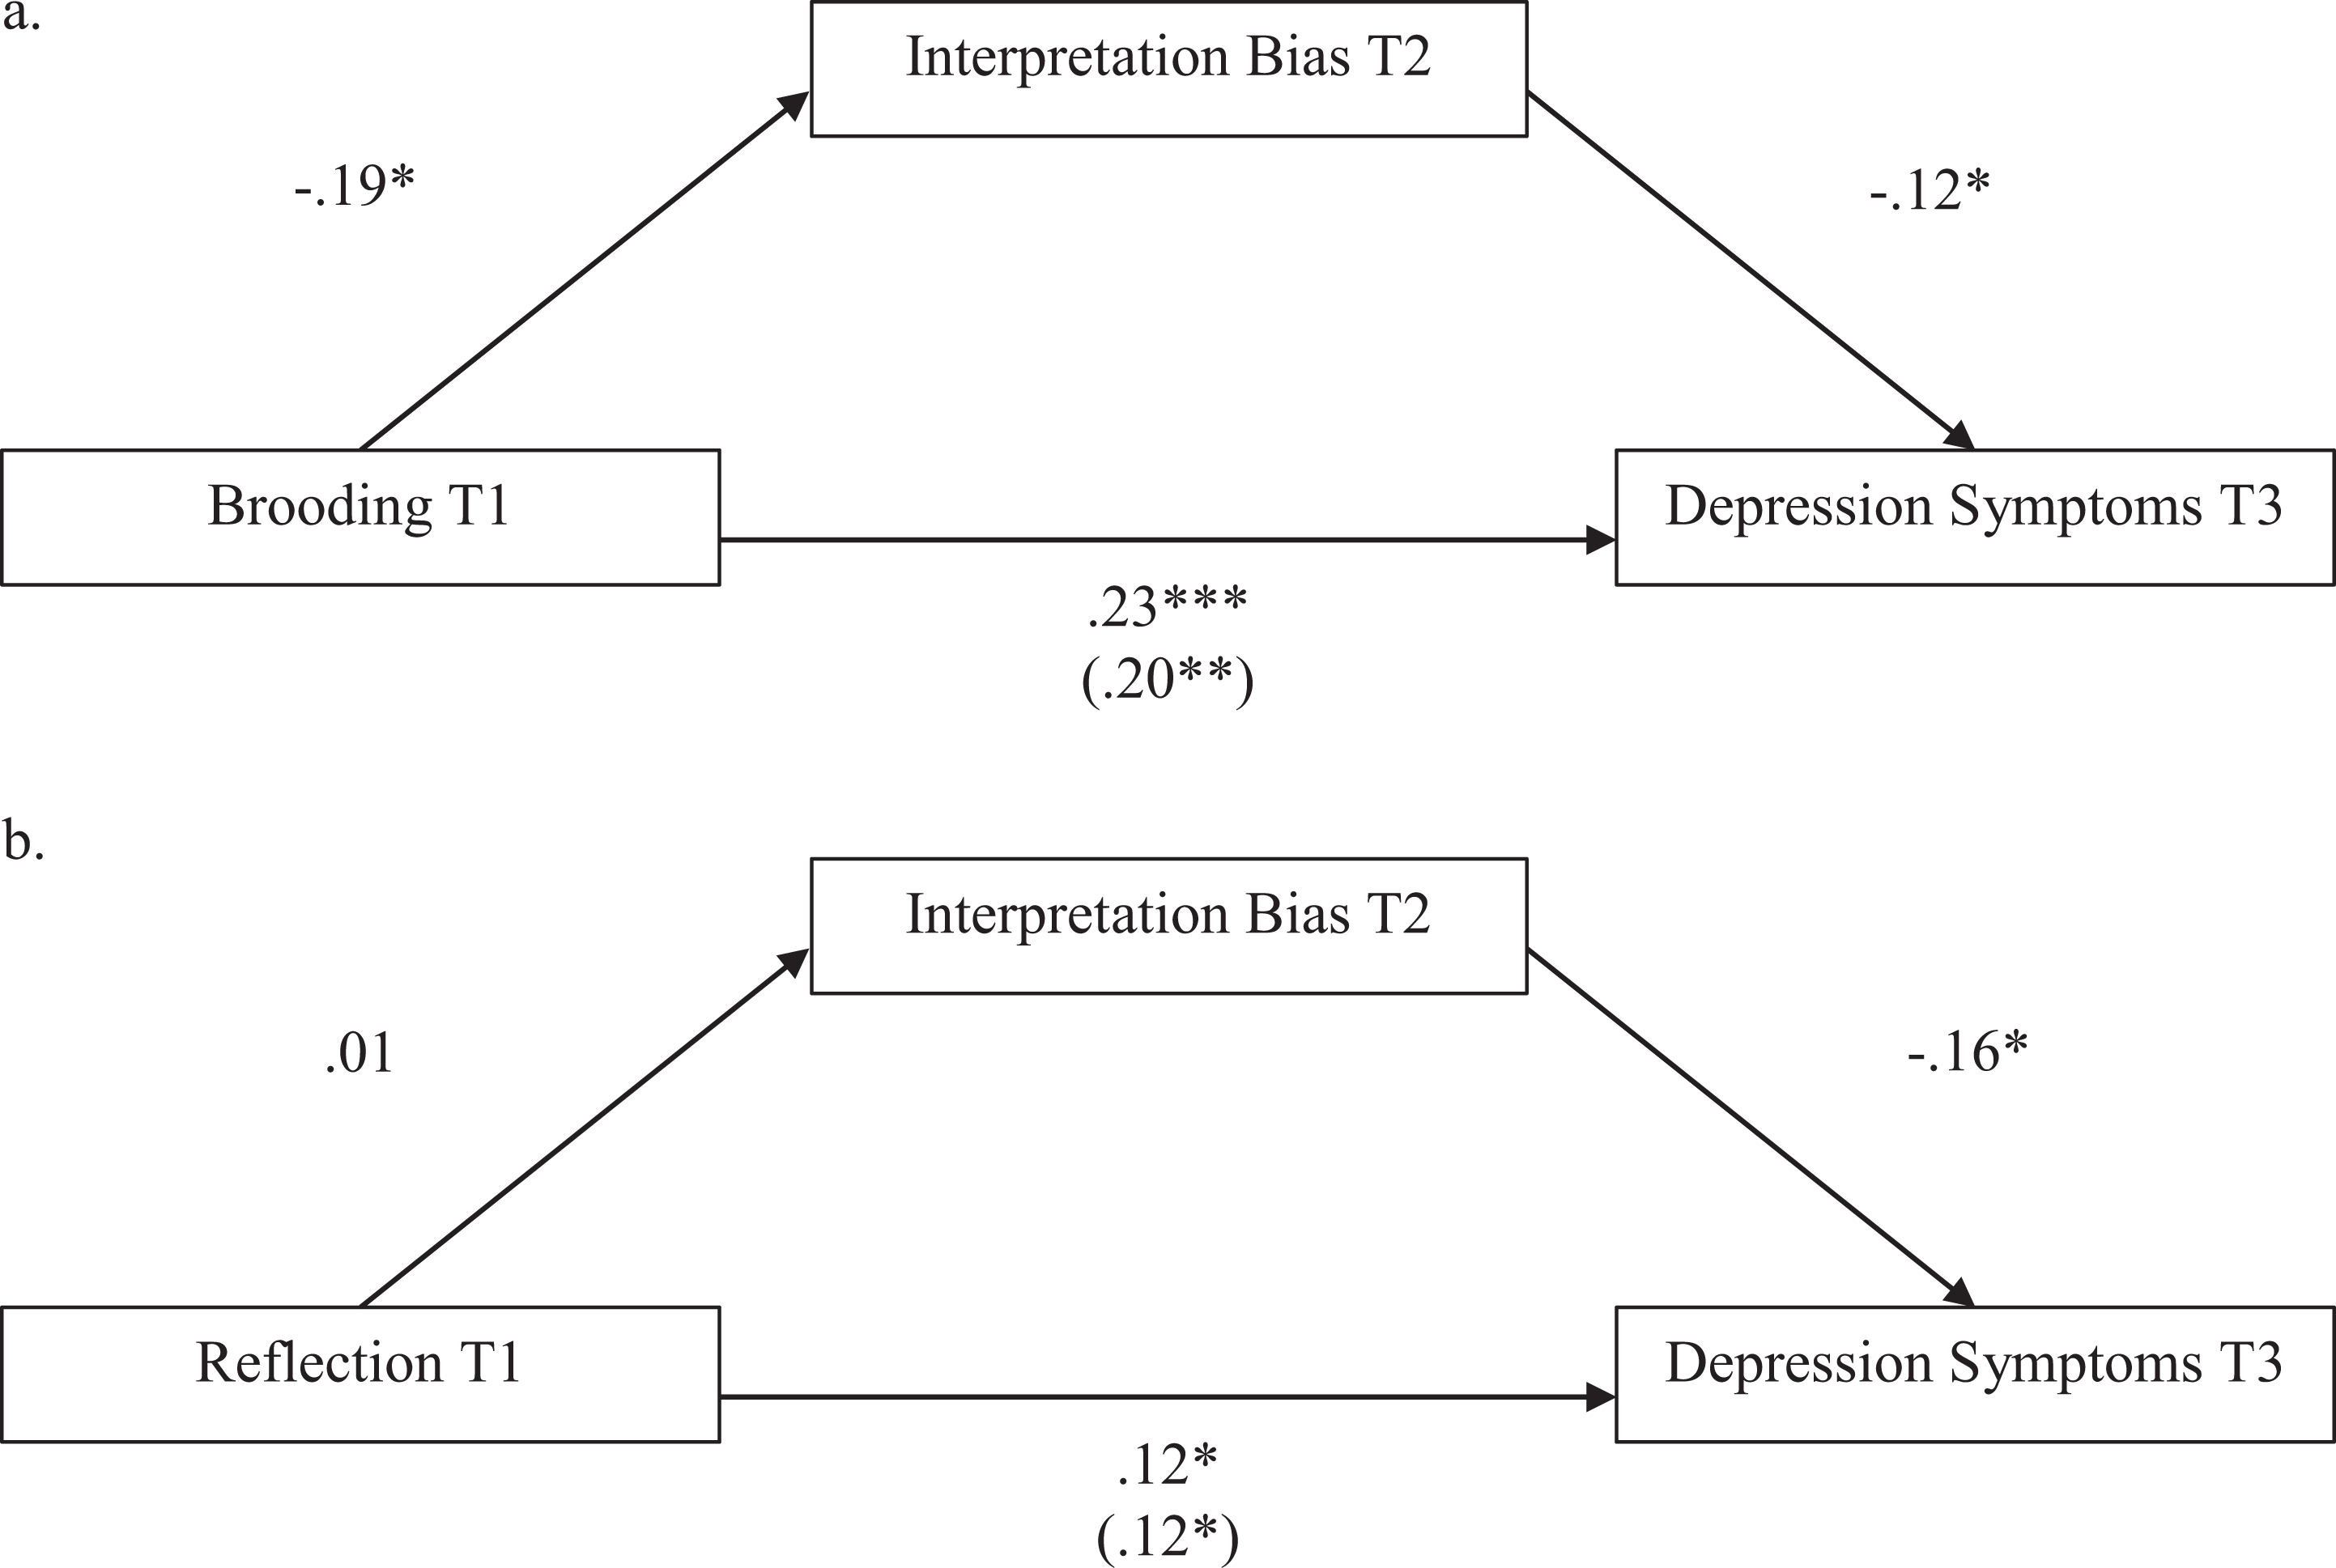
Reverse model testing indirect effects of Time 1 brooding and reflection on Time 3 depression through Time 2 interpretation bias (longitudinal analyses). Note. *p < .05; **p < .01; ***p < .001. Standardized coefficients are presented. The total effects of brooding and reflection on depression symptoms are provided with direct effects in parentheses. The completely standardized indirect effect of brooding on depression symptoms was .02, 95% CI [−.001, .058]. The completely standardized indirect effect of reflection on depression symptoms was −.002, 95% CI [−.03, .02]. Not pictured but included in the model were two covariates: Time 1 interpretation bias scores and Time 1 depression symptom scores.
Discussion
The goal of this study was to examine rumination as a potential mechanism of the association between negative interpretation biases and depression symptoms. Prior research has shown consistently that negative interpretation bias is strongly associated with depression, like other forms of maladaptive cognitive biases (Everaert, Grahek, et al., 2017; Lawson et al., 2002; Lee et al, 2016; Teasdale, 1983; Wisco & Nolen-Hoeksema, 2010). Research has also shown a ruminative style of processing distress to be strongly linked to cognitive biases and depression symptoms (Ciesla & Roberts, 2007; Nolen-Hoeksema, 1991; Nolen-Hoeksema et al., 2008; Spasojevic & Alloy, 2001; Treynor et al., 2003; Wisco et al., 2014). Some studies have demonstrated that rumination mediates the association between negative cognitive biases and depression, but these studies have been cross-sectional, limiting causal conclusions (Everaert, Grahek, et al., 2017; Lo et al., 2008; Wisco et al., 2014). Further, depression is thought to be more strongly linked to the maladaptive form of rumination, brooding, as opposed to the potentially more adaptive form of rumination, reflection, but few studies have compared subtypes of rumination when examining it as a mediator of the association between cognitive biases and depression symptoms (see Lo et al., 2008, for an exception). The current study sought to replicate prior cross-sectional studies and examine this relationship longitudinally. The difference between the ruminative subtypes, brooding and reflection, was also assessed. Given the results of past studies, negative interpretation bias was predicted to have an indirect effect on the development of depression symptoms over time through the process of rumination. Additionally, this indirect effect was predicted to be driven to a greater extent by brooding than reflection.
The results from the cross-sectional analyses in this study replicated those of prior studies (Everaert, Grahek, et al., 2017; Lo et al., 2008; Wisco et al., 2014). Negative interpretation bias did have a significant indirect effect on depressive symptoms through rumination. However, the indirect effect in our reverse model, with rumination as the predictor and interpretation bias the mediator, was also significant. This conflicts with the findings of the only prior study to report reverse mediational results, which found no significant indirect effects of rumination through interpretation biases on depression symptoms (Wisco et al., 2014). One possible explanation for the discrepancy between our reverse model and the findings of the prior study is that we had a much larger sample and were better powered to detect small effects [714 participants compared to 110 participants in Wisco et al. (2014)]. We should also note that we used a different measure of interpretation bias in this study, the AST-D-II rather than the Interpretation Bias Questionnaire, and we did not oversample individuals with high depression scores, which could also have affected our results. Our finding of significant indirect effects in both the main models and the reverse models draws into question the direction of these effects, although we do note that the standardized beta was larger for the hypothesized (.19) than the reverse indirect effect (.04), and that the proportion of the total effect explained by the indirect effect was much larger for the hypothesized than the reverse model (.61 vs. .06). Contrary to predictions, similar cross-sectional effects were also observed for both brooding and reflection subtypes of rumination, indicating that these effects are not driven solely by the brooding subtype of rumination.
When these models were assessed longitudinally, we found no evidence for an indirect effect of interpretation bias on depression symptoms through rumination. In our main longitudinal models, interpretation bias at Time 1 did not predict depression symptoms at Time 3, either directly or indirectly through rumination at Time 2. When examining ruminative subtypes separately, no significant indirect effects were found for either brooding or reflection. In the reverse longitudinal model using rumination at Time 1 as the predictor variable, rumination predicted interpretation bias at Time 2 and depression symptoms at Time 3, but there was no indirect effect of rumination on Time 3 depression symptoms through Time 2 interpretation bias. When examining brooding and reflection separately, brooding predicted both Time 2 interpretation bias and Time 3 depression symptoms, but reflection did not (total effect of reflection on Time 3 depression symptoms was not significant). Taken together, these results suggest that rumination (specifically brooding) is a more robust predictor of depression symptoms than interpretation bias, and that neither rumination nor interpretation bias seem to be driving the associations between the other cognitive risk factor and depression symptoms. These findings also offer another demonstration of the fact that cross-sectional mediational results often do not replicate longitudinally, even when examined in the same sample, suggesting caution in interpretation of cross-sectional mediation (Maxwell & Cole, 2007).
Limitations and future directions
We should note some important limitations of this study. Participants’ mean BDI-II scores were low, with most participants not endorsing depressive symptoms reaching clinically significant severity, which limited statistical power and generalizability. Interpretation bias could be a stronger predictor through rumination in individuals with more severe symptoms of depression. Data were also collected over the course of only one semester. This is a rather brief period of time and may not have been adequate to capture the development of depression symptoms. It is also possible that variables not examined in this study could be involved in the development and course of depression. Increased attention to negatively valenced stimuli, pessimistic evaluations of the future, and excessive recollection of distressing memories are all highly associated with depression. Future research should examine a wider array of cognitive biases beyond just interpretation bias, use larger samples endorsing more severe symptoms of depression, and assess participants over a longer period of time. It would also be informative to examine how these processes unfold in real time, using experience sampling or experimental induction methods. It may be the case that negatively biased cognitions trigger ruminative thinking in the moment, which then exacerbates depressed mood. These momentary processes may be missed by trait measures of both cognitive bias and rumination and would be better captured by studies using ecological momentary assessment designs. Additionally, examining the potential role of alternative risk factors could also prove useful to better understand the wide array of causal mechanisms involved in the development and course of depression.
Conclusions
Our longitudinal findings contradict recent findings that cognitive biases may lead to depression symptoms through rumination. Instead, we found that rumination is a more robust predictor of depression symptoms over time compared to interpretation bias, offering further evidence for the important role of rumination as a cognitive risk factor for depression (Nolen-Hoeksema et al., 2008). Further research is needed to understand the complex interplay between different kinds of cognitive bias, cognitive forms of emotion regulation like rumination, and the development and course of depression symptoms.
Footnotes
Declaration of conflicting interests
The author(s) declared no potential conflicts of interest with respect to the research, authorship, and/or publication of this article.
Funding
The author(s) received no financial support for the research, authorship, and/or publication of this article.