
Abstract
The Clance Impostor Phenomenon Scale (CIPS) is a measure widely used to assess individuals’ self-perceptions of intellectual and professional fraudulence. The study aimed to investigate the psychometric properties of the Hebrew form for the CIPS (HCIPS) in female Hebrew-speaking students, in an attempt to further clarify its structure and strengthen its validity in international settings. The study comprised a sample of 248 female students (M age = 27.74, SD = 7.32), who completed an online version of the questionnaire. Our results generally demonstrated satisfactory psychometric properties of the HCIPS total scale, with its internal consistency, reliability, and item-total-correlations meeting the standard criteria. The exploratory factor analysis yielded a stable four-factor solution for the 19-items, with its factors accounting for 54.81% of the model’s variance. The confirmatory factor analysis confirmed the four-factor model as compatible, with its fit-indices meeting the minimal standards of goodness of fit. The study’s findings are the first to identify a four-factor model, which improves the imbalanced factorial composition characterizing the common three-factor model. Subject to the study’s limitations, this evidence suggests that the HCIPS is a sound instrument for assessing impostor feelings among female Hebrew-speaking students.
Introduction
Clance and Imes (1978) introduced the term Impostor Phenomenon to describe one’s subjective feelings of professional, educational, or personal incompetency, as opposed to objective criteria defining the individual’s performance and accomplishments in these domains as successful. People who experience impostor feelings have a sense of hidden incompetence, continually fearing that their fraudulence will eventually be unmasked by others. Both students and professionals are vulnerable to impostor feelings (Chakraverty, 2019, 2020; Clark et al., 2014; Urwin, 2018), which place them at risk of experiencing psychological distress as well as burnout (Cusack et al., 2013; Hutchins et al., 2018; Sakulku & Alexander, 2011; Wang et al., 2019).
In higher education environments such as colleges and universities where the phenomenon is deemed common (Parkman, 2016), identifying people who experience impostor feelings for intervention purposes should be an inherent part of student development endeavors. The growing awareness regarding the significance that the imposter phenomenon has with respect to students’ functioning raises the importance of developing and validating measurement tools designated to assess the phenomenon. One of the prominent questionnaires available for the assessment of impostor feelings in this context is the Clance Impostor Phenomenon Scale (CIPS; Clance, 1985), which exhibits reliable psychometric properties in English. The scale’s construct validity has been established based on evidences of convergent, discriminant, and nomological validity against related tools and constructs (Chrisman et al., 1995; Clance, 1985; French et al., 2008; Rohrmann et al., 2016). The CIPS is a measure designed to assess individuals’ personal feelings of incompetence and fraudulence, contrary to external standards defining them as successful. It assesses the phenomenon’s components, such as fear of evaluation, self-doubt regarding one’s own abilities, and feelings of phoniness (French et al., 2008). The personality correlates of the impostor phenomenon are low self-esteem, anxiety, depression, and external locus of control (Brauer & Wolf, 2016; Chrisman et al., 1995; Rohrmann et al., 2016; Schubert & Bowker, 2017).
The impostor phenomenon construct was originally divided into three theoretical dimensions (Clance, 1985(, including self-doubts about one’s own intelligence and abilities (Fake), tendency to attribute success to chance/luck (Luck), and the inability to admit a good performance (Discount). However, there is growing controversy over the traditional premise regarding the three-dimensional structure of the construct. While there is more support for the three-factor solution (Brauer & Wolf, 2016), a few studies have concluded with different favorable factorial solutions, such as the one-factor and the two-factor models (Chae et al., 1995; French et al., 2008; Simon & Choi, 2018). Furthermore, due to the limited support for the three-factor model and the lack of a clearly identifiable factorial structure (French et al., 2008), currently the scoring methodology appears to suggest a unidimensional construct, despite studies suggesting a multidimensional construct (Mak et al., 2019). Evidently, there is a shortage in empirical evidence to denote a consistent CIPS structure (Mak et al., 2019), with few studies to test the scale’s psychometric properties in wider cultural and language contexts. To date, just three studies have tested the psychometric properties of the CIPS in non-English versions, which include testing the Korean form with 654 educated Catholic-Korean people (Chae et al., 1995) and the German form with 300 undergraduates (Brauer & Wolf, 2016) and with 183 professionals in leading positions (Leonhardt et al., 2017). In effect, only one study has documented the validity of the non-English CIPS in student populations. The growing interest in the impostor phenomenon invites more empirical investigation of the CIPS psychometric properties to determine its optimal structure and to further establish its validity, particularly in various languages other than English.
The current study
The current study aims to test the psychometric properties of the CIPS in its Hebrew form in female education students, to further provide an evidence for the scale’s validity and reliability in an international setting. Since the impostor phenomenon is prevalent among both students (Parkman, 2016) and professionals (Clark et al., 2014; Urwin, 2018), examining it among students about to become professionals (teachers) might be a good choice. Indeed, such groups have attracted researchers’ interest (e.g., Christensen et al., 2016), however the impostor phenomenon has rarely been studied among teacher trainees and education students. The current study focuses on female college students in education programs, where the vast majority of the trainees are women. The Hebrew version of the CIPS was not previously psychometrically tested, apart from some evidence for the scale’s good reliability presented by a few recent studies (e.g., Bachem et al., 2020; Yaffe, 2020). Therefore, from a methodological point of view, it may be vital to consider the study’s findings in determining the CIPS validity properties and its optimal structure. This could contribute to facilitating and improving the usage of this measurement tool for both diagnostic and research purposes.
The study goal is to test the factorial structure of the Hebrew version of the CIPS (HCIPS), by employing exploratory and confirmatory factor analyses (CFAs) (DeVellis, 2003; Kline, 2016). Apart from establishing the validity of the scale’s indigenous form, this may also strengthen the evidence regarding the CIPS structure and its psychometric properties in general. Specifically, we sought to examine the common three-factor model of the CIPS suggested by Chrisman et al. (1995) against the factorial solution that emerges from the current sample of female Hebrew-speaking students.
Method
Participants and procedure
The sample comprised 248 female students (M age = 27.74, SD = 7.32) from three academic institutions in northern Israel. Most students (79%) were Jews who speak Hebrew as their native language. The rest were bilingual Arab students belonging to several religions, who speak Hebrew as their second native language. The majority of the sample’s participants (about 53%) evaluated their social-economic status (subjective SES) as middle level, while 32% evaluated their status as middle to high level, and the rest as below middle level (about 3% did not answer this question).
The research procedure was approved by the Institutional Review Board of Tel-Hai Academic College as part of data collection conducted in a broader study that dealt with the familial antecedents of the impostor phenomenon among students in higher education. As part of the data collection, participants were initially informed about the study via a recruitment announcement sent by learning forums, asking them to take part in filling out some questionnaires on a voluntary basis. The students who agreed to take part in the study were given an Internet link to an online form, where they were introduced to the research objectives and were guided on filling out the anonymous questionnaires, subject to confirming their informed consent to take part in the study. All respondents reported their personal demographic information (such as age, sex, and social-economic status) and anonymously filled in a series of questions, including the CIPS (Clance, 1985).
While 29.8% of the sample’s students reported having some diagnosed learning disability (persistent difficulties in learning and using academic skills in learners with average or above-average intelligence), they did not differ from the students without learning disabilities in their reported mean grades (participants’ grades were measured using self-reports of their recent GPA in their college studies). Therefore, we did not exclude students with learning disabilities from the sample, nor did we employ separate analyses for testing the CIPS psychometric properties due to the relatively small sample size of each group (i.e., with and without learning disability).
Measure
The CIPS (Clance, 1985) contains 20 self-report items, in which the respondents give their answer on a 5-point Likert-type scale. Accordingly, the scale’s total score ranges from 20 to 100, with 61–80 indicating high impostor feelings and 81–100 indicating intense impostor feelings. The impostor scale was developed to help individuals determine whether or not they have impostor characteristics, such as fear of evaluation (e.g., “I avoid evaluations if possible and have a dread of others evaluating me”), self-doubt regarding one’s abilities (e.g., “I rarely do a project or task as well as I’d like to do it”), feelings of phoniness (e.g., “I can give the impression that I’m more competent than I really am”), fear of being exposed by others as a fraudster (e.g., “Sometimes I’m afraid others will discover how much knowledge or ability I really lack”), and the inclination to underestimate self-achievements and to attribute them to external factors (e.g., “At times, I feel my success has been due to some kind of luck”).
The process of translating and adapting the English CIPS into Hebrew was carried out by the authors using a back–forward translation procedure in accordance with the guidelines for test translation provided by Van de Vijver and Hambleton (1996). This procedure was deployed on three consecutive translation steps (English to Hebrew; Hebrew back to English; English back to Hebrew), with each step being supervised by a professional bilingual English translator. Prior to conducting data collection, the Hebrew version used in the current study was reviewed by an educational psychologist whose native language is Hebrew. In the current study, we observed an adequate internal-consistency reliability coefficient for the CIPS total scale scores (α = .89) as well as for its subscales (α = .67–.78).
Data analysis
We examined the submitted forms and transformed valid responses into SPSS for analysis. As a rule, missing data were handled by employing the listwise deletion method. Adhering this rule, a total of four cases with missing data were excluded from the sample. Other cases with single missing data items each were completed by calculating the variable’s series mean to enable the CFA with structural equation modeling. The instrument’s factor structure was first checked based on exploratory factor analysis (EFA), using SPSS 22. We used the Kaiser–Meyer–Olkin (KMO) test and Bartlett’s test of sphericity to assess the sampling adequacy to assure that the data and sample size were sufficient for factor analysis. CFA using Amos 22 was utilized to evaluate the identified models’ goodness of fit based on Kline’s (2016) recommendations of goodness of fit.
Results
To determine the psychometric properties of the Hebrew form of the CIPS, a series of statistical analyses was employed. These analyses included the individual item analysis (Table 1), the factorial validity investigation using EFA and CFA analyses (Tables 2 and 3, respectively), and the scales’ internal consistency reliability (Table 2). Participants’ age was negatively correlated with their impostor feelings (r = −.17, p < .01). While this generally means that younger female students tend to have stronger impostor feelings, that significance should be restrained in accordance with the correlation’s small magnitude. Of the sample’s participants, 34.7% of the students’ scores exceeded the 61-cut point, which represents high and frequent impostor feelings. This rate of students experiencing frequent impostor feelings is consistent with the rates observed for female students in previous studies (Christensen et al., 2016).
Descriptive statistics and CITC for the CIPS items (N = 248).
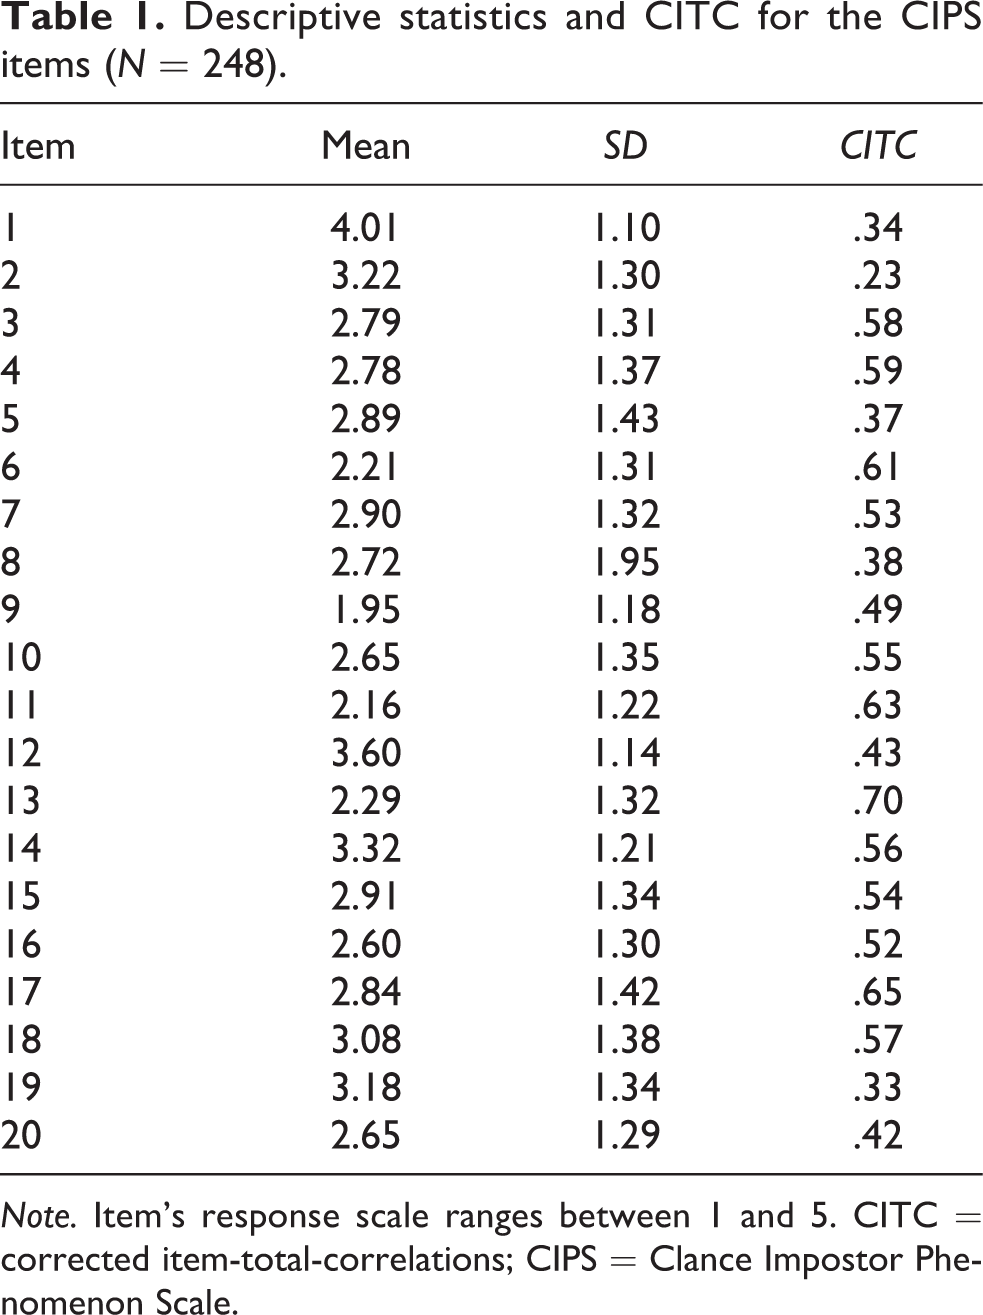
Note. Item’s response scale ranges between 1 and 5. CITC = corrected item-total-correlations; CIPS = Clance Impostor Phenomenon Scale.
Factor loadings with varimax rotation of the CIPS items for the four-factor solution (N = 248).

Note. CIPS = Clance Impostor Phenomenon Scale.
Goodness-of-fit indexes for the four-factor and the standard three-factor models of the CIPS (N = 248).

Note. CIPS = Clance Impostor Phenomenon Scale; χ2 = Chi-square; df = degrees of freedom; RMSEA = root mean square error of approximation; SRMR = standardized root mean square residual; TLI = Tucker–Lewis fit index; CFI = comparative fit index.
aExcluding Item 2.
bExcluding Items 1, 2, 8, 13.
*p < .001.
Internal consistency reliability and item analysis
Descriptive statistics for the HCIPS full scale appear in Table 1. Internal consistency reliability (Cronbach’s α) for the total 20-item scale was .89, which is consistent with previous research (e.g., Chrisman et al., 1995; French et al., 2008). The results reveal an acceptable total-item-correlation for 19 items (ranging from .34 to .70; M = .52), all meeting the standard to support internal consistency (i.e., the threshold of .3; DeVellis, 2003) and indicating a fair to good aptitude of these items to discriminate between female students who are low and high on the measure in question. Due to low item-correlation, Item 2 was excluded prior to conducting the EFA (which also was excluded in the abovementioned previous studies on the same basis), resulting with no significant change of the total scale reliability.
EFA
The KMO measure of sampling was used to test the sample size adequacy for factor analysis. The KMO measure of sampling adequacy is a statistical value used as an index for deciding whether the sample is sufficient for performing factor analysis (Kaiser, 1974). Bartlett’s test of sphericity is a second measure of sampling adequacy that tests for the overall significance of all correlations among all items on the measuring instrument (DeVellis, 2003). Accordingly, the KMO index of sampling adequacy in the current sample was .91, and the Bartlett’s test for sphericity was significant, χ2 (171) = 1603.99, p < .001, both indicating that the data meet the minimal standards for conducting a factor analysis (DeVellis, 2003).
As part of the EFA, we employed a principal components extraction method with varimax factor rotation that yielded a four-factor solution for the 19-item (without Item 2), with its factors together accounting for 54.81% of the model’s variance. We also employed a principal factoring EFA with oblique rotation, which did not significantly improve or change the four-factor solution. Therefore, the current orthogonal solution was embraced and interpreted, as advisable when the two strategies yield similar factorial solutions (Pedhauzer & Schmelkin, 1991). Table 2 displays the items loading on each factor, revealing a moderate to high and consistent items loadings that exceed the .4 threshold criterion suggested by Floyd and Widman (1995). The model’s factors exhibited an adequate internal consistency reliability, given the factors’ small number of items.
Furthermore, the factorial composition in our three first consecutive factors is essentially consistent with that previously identified in the standard three-factor model (Brauer & Wolf, 2016; Chrisman et al., 1995), although the factors of the two models differ in size, order, and proportion (i.e., the variance explained by the factor). Hence, we labeled these three factors in accordance with their original definition, as Discount (reflecting the inability to acknowledge praise and good performance), Fake (reflecting self-doubt and concern about ability), and Luck (reflecting the attribution of success to chance and errors rather to ability (Chrisman et al., 1995). Unlike the standard three-factor model, however, the current model offers more balanced solution in terms of the factorial size and proportion, with its three first factors accounting for 16.28%, 14.29%, and 13.43% (respectively) of the explained variance. The current model’s fourth factor accounts for 10.80% of the variance explained by the model, with its items associated in essence with fear of failure (Brauer & Wolf, 2016)— items normally affiliated with the “Fake” factor. The model’s factorial structure of the HCIPS that emerged from the EFA was then verified via CFA and its fit was tested against the standard three-factor’s model fit.
CFA
Following the EFA, we conducted CFA to verify the model-fit of the current four-factor model with 19 items against a replication of the three-factor model (Brauer & Wolf, 2016) with 16 items, which is the CIPS most common factorial model in the literature. Table 3 displays the model-fit indices for the two models with no model modifications applied on the original factors, to avoid a possible distortion of the real structure of the data by allowing correlated errors (French et al., 2008; MacCallum et al., 1992). While both models exhibit somewhat acceptable fit indices, the four-factor model seems preferable with its indices meeting all the basic recommendations for model-fit (i.e., root mean square error of approximation < .06, standardized root mean square residual < .08, comparative fit index > .90, and Tucker–Lewis fit index > .90) (Bentler & Bonett, 1980; Kline, 2016). Conversely, the three-factor model did not reach two of these minimum requests criteria for goodness of fit. For both models, all variables loaded significantly on their hypothesized latent factors (ranging from .35 to .80 in the four-factor model and from .30 to .73 in the three-factor model; all loadings were statistically significant at .01).
Discussion
The study objective was to investigate the HCIPS’s construct validity via exploratory and CFAs in female Hebrew-speaking students, while testing the model-fit of the emerging factorial structure against the standard three-factor model of the CIPS. In light of the inconsistent findings in previous studies, the current study aimed to test the factorial validity of the HCIPS to foster a better understanding of the scale’s structure in general while providing more information regarding its factors’ preferable composition.
The study results generally demonstrated satisfactory psychometric properties of the HCIPS, with its overall internal consistency, reliability, and item-total-correlations meeting the standard criteria. The EFA yielded a stable four-factor solution for the 19 items, with its factors accounting for 54.81% of the model’s variance. To date, the current study’s data on the CIPS structure are the first to identify four discerned factors. In spite of the significant resemblance between the model’s first three factors and the factorial composition described in early studies with the standard three-factor model (i.e., Fake, Discount, and Luck) (Brauer & Wolf, 2016; Chrisman et al., 1995; Kertay et al., 1992), they differ in terms of size, order, and the explained variance. Specifically, Chrisman et al. (1995) described a three-factor model with about 53% of the variance explained by the model, where its first factor (Fake) accounts for a vast majority of proportion from the total variance (approximately 45%). Similarly, the three-factor model demonstrated by the German form of the CIPS explained about 44% of the variance, with its “Fake” factor accounting for 33% of it (Brauer & Wolf, 2016). In the current study, however, “Fake” was classified as the second-order factor, with its items accounting for about 14% of the explained variance. In contrast to the three-factor model, the four-factor model identified here describes a more balanced factorial solution in terms of both the variance explained by the factors (ranging from approximate proportions of 10% to 16%) and the factors’ size (ranging from 4 to 6 items). The current model’s fourth factor was mainly composed of items expressing fear of failure (Brauer & Wolf, 2016), a theme previously affiliated with the “Fake” factor. Following our findings, an attempt to refine this theoretical dimension (as it is currently constructed by the three-factor model) could be based on extracting this theme (i.e., fear of failure) out of the “Fake” dimension and establishing it as an autonomous theoretical dimension of the impostor phenomenon. Subject to further investigation of the four-factor model, the current factorial solution suggests an alternative theoretical view for the impostor phenomenon as a unidimensional construct and also for the utilization of the CIPS (i.e., its scoring method) as unified factor model (French et al., 2008; Mak et al., 2019).
The study results strengthen French and colleagues’ (2008) assertion in which there is no clear best-fitting model that represents the CIPS factor structure, and that the standard three-factor model might not represent best the theoretical construct in question. Indeed, the further probing of the goodness of fit of the four-factor model against the three-factor model using CFA supported the former as favorable, with all of its fit-indices meeting the minimal standards and overriding those of the latter model. While the three-factor model is more parsimonious (with only 16 items included) (Brauer & Wolf, 2016; Chrisman et al., 1995), the current four-factor model with 19 items poses a more balanced and efficient factorial composition. Thus, our suggested four-factor model tackles the factorial imbalanced item division characterizing the three-factor model, a considerable problematic aspect pointed out by researchers who embraced this factor-solution (Brauer & Wolf, 2016). More research with validation studies is required to establish item homogeneity and to ascertain the dimensionality of the impostor phenomenon (Mak et al., 2019).
The scale’s validity grounded by the current findings is limited in several respects. First and foremost, the generalization of the findings to larger populations, especially to men, requires additional evidence based on further research with more diverse participants. Although there is some evidence suggesting the impostor phenomenon is independent of age and gender (Brauer & Wolf, 2016; Rohrmann et al., 2016; Wang et al., 2019), the establishment of measurement invariance across groups (especially genders) to be compared on the CIPS (French et al., 2008) is required also for the Hebrew form of this scale. Finally, apart from investigating the scale’s structure, to further establish the HCIPS validity, it is imperative to validate the scale against external tools and constructs. To sum up, we found supportive evidence (a high degree of variance explained by the four-factor model; strong inter-item correlation and good internal consistency reliability; satisfactory model-fit indexes) initially suggesting that the HCIPS is a sound instrument for assessing impostor feelings in female Hebrew-speaking students. The study’s findings may also have implications for our comprehension of the impostor phenomenon’s theoretical nature, as they further support the premise that it is a multidimensional construct rather than unidimensional. However, moving toward a multidimensional view of the phenomenon’s construct requires further validation and standardization of the impostor phenomenon’s scales (i.e., the four factors identified in the current study), as it may affect the regular scoring method of the CIPS as a unified factorial scale.
Footnotes
Author’s note
The study was conducted in accordance with the ethical standards of the American Psychological Association (APA).
Acknowledgment
The author would like to thank Dr Pauline Clance for the permission to use and translate the Clance Impostor Phenomenon Scale (CIPS).
Declaration of conflicting interests
The author declared no potential conflicts of interest with respect to the research, authorship, and/or publication of this article.
Funding
The author received no financial support for the research, authorship, and/or publication of this article.