
Abstract
The Short Health Anxiety Inventory (SHAI) is a well-established, self-report measure of health anxiety (HA). However, no psychometrically adequate Arabic-speaking version of this measure is yet available. This study was therefore designed to provide an Arabic version of the SHAI and assess its latent structure, measurement invariance across gender, and internal consistency reliability. Forty hundred and twenty-one Saudis completed the Arabic SHAI online (68.65% women), mean age 25.90, and standard deviation 6.65. Exploratory and confirmatory factor analyses in different subsamples suggested a 2-factor solution: (1) illness likelihood (IL) with 13 items and (2) negative consequences (NC) with 4 items. This structure was found invariant across gender. Cronbach’s α for the full scale, IL, and NC were .85, .83, and .77, respectively. Corrected item–total correlations for all items ranged from .35 to .68. Performance on the scale did not appear to correlate with gender, while age associated weakly but statistically significant with the total score and IL factor. The present Arabic SHAI appears to be a psychometrically promising tool for the assessment of HA. Further investigations of the scale psychometrics, particularly using a paper-and-pencil format, and clinical utility are warranted.
Health anxiety (HA) is characterized by various features, including excessive worry over perceived present and/or anticipated future physical health, fear of developing a disease, repeated medical examinations, and frequent reassurance seeking (Rachman, 2012; Salkovskis & Warwick, 1986). Higher level of HA can be a defining feature of various psychological diagnoses, particularly, hypochondriasis, a severe and clinically significant form of HA listed in the fourth edition of the Diagnostic and Statistical Manual of Mental Disorders–IV (DSM-IV), or either a somatic symptom disorder (SSD) or illness anxiety disorder (IAD) listed in the DSM-5. It should be noted, however, that SSD is characterized by greater HA compared to the IAD (American Psychiatric Association, 2013; Newby et al., 2017).
HA is a prevalent condition. Prevalence rates may range from 1.3% to 10% in community and population surveys (American Psychiatric Association, 2013; Sunderland et al., 2013). This rate increases in medical settings. In one study, for instance, Tyrer et al. (2011) found that the prevalence rate of HA among medical patients ranges from 17.49% to 24.71%. HA can also be comorbid with a variety of psychological disorders (Newby et al., 2017; Sunderland et al., 2013; Tyrer, 2018). HA is associated with significant economic and health burdens. Individuals with this condition are more likely than the general public to have more days off work or are unable to work at all, to utilize mental health and specialist medical services, and to receive disability pensions (Bobevski et al., 2016; Fergus et al., 2017; Mykletun et al., 2009; Sunderland et al., 2013; Tyrer et al., 2011).
HA is considered to manifest dimensionally. That is, it is hypothesized to range on a quantitative scale from normal to clinically significant levels. This approach is in line with contemporary dimensional nosologies of psychopathology (e.g., The Hierarchical Taxonomy Of Psychopathology (HiTOP); Kotov et al., 2017) and has received theoretical and empirical support (Ferguson, 2009; Hiller et al., 2002; Longley et al., 2010; Rachman, 2012). Therefore, considering HA dimensionally would allow for a better description, in comparison with the present or absent categorical view postulated in major diagnostic manuals (e.g., DSM-5; American Psychiatric Association, 2013).
Overall, given the prevalence rates, health and economic burden, and the dimensional nature of HA, it was vital to develop psychometrically sound instruments to assess HA dimensionally in both medical and nonmedical settings. Developing these measurement instruments would help establish effective treatments, enable better mental well-being, prevent disability burden, and reduce unnecessary health resources consumption.
Therefore, a number of self-report measures were developed in order to facilitate a dimensional assessment of HA, namely, the Whiteley Index (Pilowsky, 1967), the Illness Attitude Scale (Kellner et al., 1987), the Health Anxiety Questionnaire (Lucock & Morley, 1996), The Illness Anxiety History Questionnaire (Newby et al., 2017), the Illness Behavior Questionnaire (Pilowsky & Spence, 1975), and the Health Anxiety Inventory (HAI) with its short version (SHAI; Salkovskis et al., 2002; Warwick & Salkovskis, 1989).
Although all of these measures are generally characterized by adequate psychometric properties, the SHAI (Salkovskis et al., 2002) may be preferred for several reasons. First, the scale was designed following a well-researched cognitive behavioral model of HA that has implications for defining, understanding, and treating hypochondriasis as an extreme form of HA (Salkovskis & Rimes, 1997; Warwick & Salkovskis, 1989, 1990). Second, there is accumulating evidence in support of the psychometric suitability of the SHAI in clinical and nonclinical subjects (e.g., Abramowitz, Olatunji, & Deacon, 2007; Alberts, Sharpe, Kehler, & Hadjistavropoulos, 2011; Bailer et al., 2016). This includes evidence in support of using the SHAI for assessing HA severity as an outcome in therapeutic trials (Newby et al., 2017; Seivewright et al., 2008; Sørensen et al., 2011; Tyrer et al., 2014), estimating the prevalence of HA in clinical and nonclinical populations (Rode et al., 2006; Tyrer et al., 2011), and using various test delivery formats (such as paper-and-pencil vs. online format) (Alberts et al., 2013; Fergus, 2013; Fetzner et al., 2014; Hadjistavropoulos et al., 2012; Hedman et al., 2015; Te Poel et al., 2017; Wheaton et al., 2010).
Third, the SHAI has been adapted and validated in various cultures and languages, including Portuguese (Morales et al., 2018), Turkish (Aydemir et al., 2013), German (Bailer et al., 2013), Spanish for both adolescents (Morales et al., 2015) and adults (Arnáez et al., 2019), Chinese (Zhang et al., 2015), Polish (Kocjan, 2016), Persian (Mehdi et al., 2013), North American (Abramowitz, Deacon, & Valentiner, 2007), and Dutch (Te Poel et al., 2017). This adaptation facilitates cross-cultural comparisons and permits extending psychological science beyond particular cultural backgrounds, especially if the latent scale structure was found invariant across targeted cultures.
Relying on an earlier scale development (Warwick & Salkovskis, 1989), Salkovskis et al. (2002) continued the development of the HAI that led to the shorter version (SHAI) by selecting items with the highest item–total correlations on the HAI in a sample of individuals with hypochondriasis. The scale was designed to assess the full clinical and nonclinical manifestations and severity of HA in a way that would discriminate between HA patients, patients suffering from other anxiety disorders or physical illnesses, and healthy individuals and would also be sensitive to therapeutic effects.
The SHAI may have two- or potentially three-factor structure. In the original article, Salkovskis et al. (2002) described a two-factor solution composed of illness likelihood (IL) and negative consequence (NC) factors, which assessed the perceived NC of having an illness. Upon systematically reviewing selected articles of SHAI-related psychometrics that were published up to April 2012, Alberts et al. (2013) concluded that research supports the original correlated two-factor solution initially proposed by Salkovskis et al. (2002) while also acknowledging that a three-factor solution emerged in a few of the reviewed studies. The same conclusion can be drawn from research reports published after this review, in which the original structure was supported in studies employing various factor analytical types (explanatory versus confirmatory) in diverse samples obtained from various cultural, age, and health status populations(Arnáez et al., 2019; Aydemir et al., 2013; Bailer et al., 2013; Kocjan, 2016; Morales et al., 2015, 2018; Te Poel et al., 2017).
However, a few studies found support for a three-factor solution (Abramowitz, Deacon, & Valentiner, 2007; Olatunji, 2009) in which the IL subscale was separated into two factors (perceived likelihood and body vigilance). Neither of these two studies used confirmatory factor analysis (CFA) to verify the resultant model. Interestingly, in another study conducted by the same principal investigator of one of those studies (i.e., Abramowitz), in which another data set involving individuals with hypochondriasis or other anxiety disorder was analyzed, the authors favored the original two-factor structure over the previously extracted three-factor structure in the study by Abramowitz, Deacon, and Valentiner (2007) although on the basis of parsimony (Abramowitz, Olatunji, & Deacon, 2007).
Similar to the study by Abramowitz, Olatunji, and Deacon (2007), several studies that adopted the original two-factor model have done so based merely on parsimony, not necessarily based on its superior goodness of fit. In a large-scale study, Te Poel et al. (2017) selected the two-factor model based on parsimony, although the three-factor model had demonstrated the best fit over the two-factor in their first analysis, and both solutions exhibited identical model fit indices after considering correlated errors in a second analysis. Likewise, in the study by Arnáez et al. (2019), the three-factor model of Abramowitz, Deacon, and Valentiner (2007) presented a fairly equal fit to the two-factor model of Salkovskis et al. (2002). Nevertheless, the former was selected as it “parallels the original factor solution of the Spanish adolescent version…and most validations of the SHAI” (Arnáez et al., 2019, p. 255). In contrast, Morales et al. (2018) found that the three-factor model did not fit the data well, whereas the original two-factor did.
There is evidence that the two-factor structure is invariant across medically ill and healthy individuals (Alberts et al., 2011; Te Poel et al., 2017), cultural groups (Morales et al., 2018), gender, and over time (Te Poel et al., 2017). These findings add to the stability of this latent structure. Taken together, the evidence tends to support the original two-factor SHAI structure, while the three-factor solution proposed by Abramowitz, Deacon, and Valentiner (2007) may also be considered.
Besides the findings that support the latent structure of the scale, available evidence also supports the criteria-related validity of SHAI. In their meta-analysis, Alberts et al. (2013) found that the measure associated with anxiety-related constructs, such as HA vulnerability, anxiety and worry, depression, obsessive–compulsive disorder, social anxiety, and medical status with mean correlation of .43 (95% confidence interval [CI] = .42–.44), with the stronger associations with measures of HA (mean correlation .67, 95% CI = .63–.71). The scale was also found to show an association with behaviors relevant to HA (such as safety-seeking behaviors and medical care utilization).
Findings also support the reliability of SHAI. Internal consistency, whether assessed using the Cronbach’s or ordinal α ranged from .74 to .96 for the full scale (Alberts et al., 2013), from .74 to .92 for the IL, and between .76 and .79 for the NC subscales (Kocjan, 2016; Morales et al., 2015; Te Poel et al., 2017; Zhang et al., 2015). Test–retest reliability, as expected, appeared to be lower than internal consistency, although generally still within an acceptable range. Test–retest coefficients were between .56 and .94 for the full scale and ranged from .44 to .78 and .62 to .72 for the IL and NC subscales, respectively (Alberts et al., 2011; Aydemir et al., 2013; Kocjan, 2016; Morales et al., 2015; Morales et al., 2018; Salkovskis et al., 2002; Te Poel et al., 2017; Zhang et al., 2015).
Despite the significance of SHAI, it has not been properly adapted into Arabic to the best of the researcher’s knowledge. Two articles provided Arabic translation of the measure, one is published in a potentially spam journal, and hence not covered. The only genuinely published Arabic translation of SHAI was conducted in Lebanon by Bilani et al. (2019). The authors utilized the first 14 items within the context of HA among parents of children with cancer. They reported translating items using a back-translation technique and then extracted a Cronbach’s α of .77 in a sample of 105 parents of children with cancer. No further psychometric investigations are reported. Although helpful, procedures carried out in this report are not sufficient to transfer psychometric tools across cultures (Van de Vijver & Tanzer, 2004).
This study was designed to fulfill this aim. Specifically, it is aimed to provide five objectives. First, providing an Arabic translation of the SHAI. Second, testing the latent structure of the construct(s) assessed by the Arabic version. Third, as Saudi society is thought to be high on the masculinity–femininity cultural dimension (Alruwaita, 2009; Hofstede et al., 2010), suggesting notable differences between the two genders at large, measurement invariance (MI) across gender will be investigated. Fourth, assessing internal consistency reliability as estimated by Cronbach’s α. Fifth, gathering data regarding associations between the scale and age, and gender.
Method
Design
Correlational and cross-sectional designs were used.
Sample
A convenience sample consisting of 421 Saudis completed the measure online. Participants’ ages ranged from 15 to 55, with a mean age of 25.90 (±6.65) and median and mode of 24 and 21, respectively. Two hundred and eighty-nine (68.65%) participants were women. Among the student participants (n = 175), 42 (24%) were medical students, 36 (20.6%) psychology, 5 (2.9%) business, 4 (2.3%) computing, 3 (1.7%) science, 2 (1.1%) nursing and rehabilitation, 2 (1.1%) law, 2 (1.1%) English, 1 (0.6%) physiotherapy, 1 (0.6%) religion-related, and 77 (44%) did not specify their subjects. Thirty-eight of the participants (9%) reported having chronic physical illnesses, which included asthma, blood pressure, diabetes, hypothyroidism, irritable bowel syndrome, and allergic rhinitis. Seventy-one (16.86%) reported having a history and/or current psychological condition(s), including any type of personality disorder, any type of anxiety disorder, depression, bipolar disorder, and sleep problems. The majority of the sample came from the middle region of Saudi Arabia (60.33%). Table 1 further specifies the sample characteristics.
Sample demographics.

Tools
Psychosocial and demographic data sheet
A demographic data sheet was used to assess several sociodemographic characteristics and clinical variables: (1) age, (2) gender, (3) nationality, (4) academic year, (5) presence of chronic physical illness, and (6) current or past psychological diagnosis.
The Arabic version of Short Health Anxiety Inventory (A-SHAI)
An Arabic-speaking version of the original 18-item self-report measure of HA was developed by Salkovskis et al. (2002). Every item consists of four statements reflecting various levels of intensity to which respondents were instructed to choose one or more statements that best describe their feelings over a 6-month period. Items were scored on a 4-point Likert scale from 0 = no symptoms to 3 = severe symptoms. Following the original instructions, if more than one statement was endorsed on an item, the higher statement was used for scoring. Following the original format, items of the original scale were divided into 2 subscales: (1) IL consisting of the first 14 items with scores ranging from 0 to 42 and (2) NCs comprising the remaining 4 items with scores ranging from 0 to 12. Higher scores indicate higher levels of the assessed construct. The translation process is described later.
Translation process
In line with pertinent guidelines (i.e., International Test Commission, 2010; Van de Vijver & Tanzer, 2004), the SHAI was translated into Arabic in several iterative phases as follows. First, the measure was translated into Arabic by the author. Second, three academics, two psychologists, and one psychiatrist reviewed the translation individually. All of them are fluent in both Arabic and English and had previously engaged in translating psychometric tests into Arabic. This review included checking the original wordings against the Arabic and qualitatively decided on the extent to which Arabic items assess the same construct as that of the English ones and provided suggestions to improve the translation (making it more representative of the constructs being assessed originally and in a readable form). Third, in order to examine the items’ readability and potential ambiguity, two groups of undergraduates (N = 7 and N = 6) volunteered to fill in and then read out the resultant version.
This deemed helpful to indicate the level of clarity/ambiguity (readability) and determine what did respondents think the item was actually covering/assessing in plain language. Fourth, the version reached over the previous revisions back-translated into English and compared to the original ones by three psychology academics in addition to the author during a group session. A few discrepancies, mostly of linguistic nature, were discussed and resolved, leading to the current Arabic wording.
Data collection procedure
An electronic format of the measure was developed using Google Forms and circulated on social media platforms, particularly Twitter, and online groups. Once entering the website, the participant was provided with a participant information sheet that highlighted the study objectives and protocol, issues of confidentiality, personal safety, and other ethical considerations. If still willing to take part in the study, they were then asked to fill in an e-consent form and then proceed to the demographic information sheet and scale items. The Medical and Health Institutional Review Board at King Saudi University reviewed and approved the study protocol (Project number: E-17-2363). Data were collected from August to October 2017.
Data analytic strategy
Normality was explored by converting the skewness and kurtosis raw values to their corresponding z score, which was considered statistically significant when greater than 2.58 (p < .01) or 3.29 (p < .001) (Field, 2005). Scores with z values >3.29 were considered outliers and, hence, were deleted. Pearson’s r and Student’s t-tests were used to conducting bivariate correlations and comparisons, respectively, or Spearman’s ρ and Mann–Whitney U tests when normalcy was violated. Internal consistency reliability was estimated using Cronbach’s α.
In order to check data suitability for factor analysis purposes, the Kaiser–Meyer–Olkin test (KMO) and Bartlett’s test of sphericity were used. Deciding upon the number of factors to be retained in the exploratory factor analysis (EFAs), three approaches were used: (1) the Kaiser–Guttman criterion (retain all factors with eigenvalues >1), (2) Cattel’s (1966) scree plot, and (3) parallel analysis (O’Connor, 2000). Consistent with relevant recommendations (Fokkema & Greiff, 2017), the full sample was randomly divided into two subsamples. The first half (Subsample a) was used in the EFAs, whereas the other half (Subsample b) was used to verify the extracted solution and models based on previous literature. Consistent with most previous reports, EFAs was performed using principal component analysis (PCA) with promax (oblique) rotation to allow factors to correlate as theoretically expected. While PCA is not a form of factor analysis per se (Tabachnick & Fidell, 2007), it was used in the present analysis to maintain consistency with previous studies and to allow for meaningful comparisons with previous findings.
CFA parameters were estimated using the maximum likelihood approach. Model goodness of fit was evaluated using χ2, the ratio χ2/df, the comparative fit index (CFI), the Tucker–Lewis index (TLI), and the root mean square error of approximation (RMSEA) with its corresponding 90% CI (90% CI RMSEA). In order for a model to be of a good fit, it should have had a nonsignificant χ2, χ2/df ≤ 3, CFI and TLI >.90, and RMSEA ≤.06 (Barrett, 2007; Bentler & Bonett, 1980; Hu & Bentler, 1999; Mueller, 1996). Factor loadings (i.e., standardized estimates) and modification indices were also consulted in assessing CFA parameters. The model with the best fit was selected.
The most optimal latent structure resulting from the CFA was then tested to determine MI of SHAI across gender (men/women). Three levels of MI were addressed using a framework of multigroup CFA and comparing increasingly restrictive models in a stepwise approach (Byrne et al., 1989; Cheung & Rensvold, 2000, 2002; Vandenberg & Lance, 2000). Configural invariance (equivalence of overall factor structure across groups with item factor loadings and intercepts left varying freely in each group) was first tested. If the latent structure was found invariant at the configural level, metric invariance (equivalence of factor loadings), in which intercepts were left unconstrained, was then tested. Finally, scalar invariance (equivalence of item intercepts), in which both loadings and intercepts were constrained to equal across comparison groups, was tested if the previous two levels of invariance were assumed.
In line with widely used recommendations (i.e., Cheung & Rensvold, 2002; Putnick & Bornstein, 2016) and recent MI investigations of SHAI (e.g., Te Poel et al., 2017), two criteria were used to interpret results of the MI testing: (1) change in CFI (ΔCFI < .01) and (2) change in RMSEA (ΔRMSEA < .015). Although known to be sensitive to negligible and slight deviations from a “good” model in large samples, leading to unnecessary rejection (Chen, 2007; Cheung & Rensvold, 2002; Morales et al., 2018), the change in χ2 (Δχ2), which should be nonsignificant to indicate invariance, will also be reported consistent with reporting conventions (Putnick & Bornstein, 2016). Analyses were carried out using the SPSS/23 and Amos/23.
Results
Preliminary analyses
As mentioned earlier, the entire sample was divided into two subsamples for factor analytical purposes. This was done utilizing the data > select cases > random sample of cases command (approximately 50%) function on SPSS/23. The two subsamples, consisting of 226 and 195 subjects each, did not differ in age (t[332] = −0.41; p = .69), proportion of gender (female/male) (χ2[1] = 0.23; p = .63), presence of chronic physical illness (χ2[1] = 0.932; p = .334), or presence of current or history of psychological condition (χ2[1] = 0.389; p = .533), excluding those who did not provide data regarding the presence of chronic physical illness (n = 14) or past/current psychological condition (n = 3). In addition, they did not perform differently on individual SHAI items, following the Bonferroni correction for α level (.05/18 = .0028). In fact, only differences on Items 1 and 2 reached the conventional level of significance (.05) before applying the correction; p values for differences on the remaining 16 items ranged from .24 to .92.
EFAs (Subsample 1, n = 226)
Data were found appropriate for factor analysis. This was indicated by the KMO test value of .84 and the significant value of Bartlett’s test of sphericity (χ2[153] = 1,065.26; p = .000).
An initial PCA with promax rotation revealed four correlated factors with eigenvalues > 1 (5.09, 1.70, 1.48, and 1.11), thus explaining 52.12% of the total variance. Both parallel analysis and the scree plot suggested retaining three factors. Hence, the analysis restricting the factors to be extracted to three was rerun. In addition to rerunning the analysis and consistent with findings of previous factorial studies of SHAI and the exploratory nature of this phase, a two-factor model was extracted. Table 2 presents pattern matrixes (such as item loading) and communalities for these two solutions.
Factor loadings and communalities for EFAs with promax rotation of Arabic SHAI items (n = 226).

Note. Factor loadings ≥.30 are in boldface. SHAI = Short Health Anxiety Inventory; h2 = Communalities; EFAs = exploratory factor analysis.
The three-factor solution accounted for 45.93% of the variance and appears to have a good simple structure (Thurstone, 1947). The first factor consisted of 10 items that assessed fear and worry about illness, avoidance and reassurance, perceived vulnerability, health-related intrusive thoughts, and disease conviction (Salkovskis et al., 2002). This factor was then labeled IL. Four items loaded uniquely and significantly in the second factor, with their content tapping projected harmful outcomes of the feared illness(es). Therefore, this factor was labeled as NC. The third factor was composed of five items, involving preoccupation, interference, and awareness of bodily sensations plus attitudes of self and others toward HA. Given its content, and in line with results from studies by Abramowitz, Deacon, and Valentiner (2007) and Olatunji (2009), this third factor was labeled Body Vigilance. Item 13 (Ability to think of other things if notice unexplained body sensations) cross-loaded on both the first (.40) and third (.33) factors. The three factors correlated with each other. Factor 1 associated moderately with Factors 2 (.39) and 3 (.40), and Factor 2 associated rather weakly with Factor 3 (.30).
In the two-factor solution, a total variance of 37.71% was explained. Thirteen of the first 14 items loaded on the first factor. Item 14 (Familiars/friends say I worry about my health) did not show salient loading whatsoever. Items assessing anticipated negative outcomes of having an illness all loaded saliently on the second factor. No items cross-loaded. The two factors showed a moderate association (.39). In line with reports in the literature, these two factors were titled the IL and NC. Both structures were then tested in the CFA.
CFAs (Subsample 2, n = 195)
In this phase, three initial models were tested, namely, the two- and three-factor solutions revealed in the EFAs described above and a general factor model in which all items loaded on a single latent factor (Arnáez et al., 2019; Te Poel et al., 2017). Analyses were carried out using data gathered from the second half of the sample (n = 195).
Table 3 (section A) exhibits the fit indices for the tested models. Model 1 (general factor) did not fit the data, as none of the model fit indices meets the specified levels. Model 2 (two-factor) was of a marginal model fit as the ratio χ2/df was <3, both CFI and TLI were <.90, whereas RMSEA was >.06. Model 3 (three-factor solution) demonstrated the best model fit.
CFAs of Arabic SHAI: Model fit indices for several factor models (n = 195).
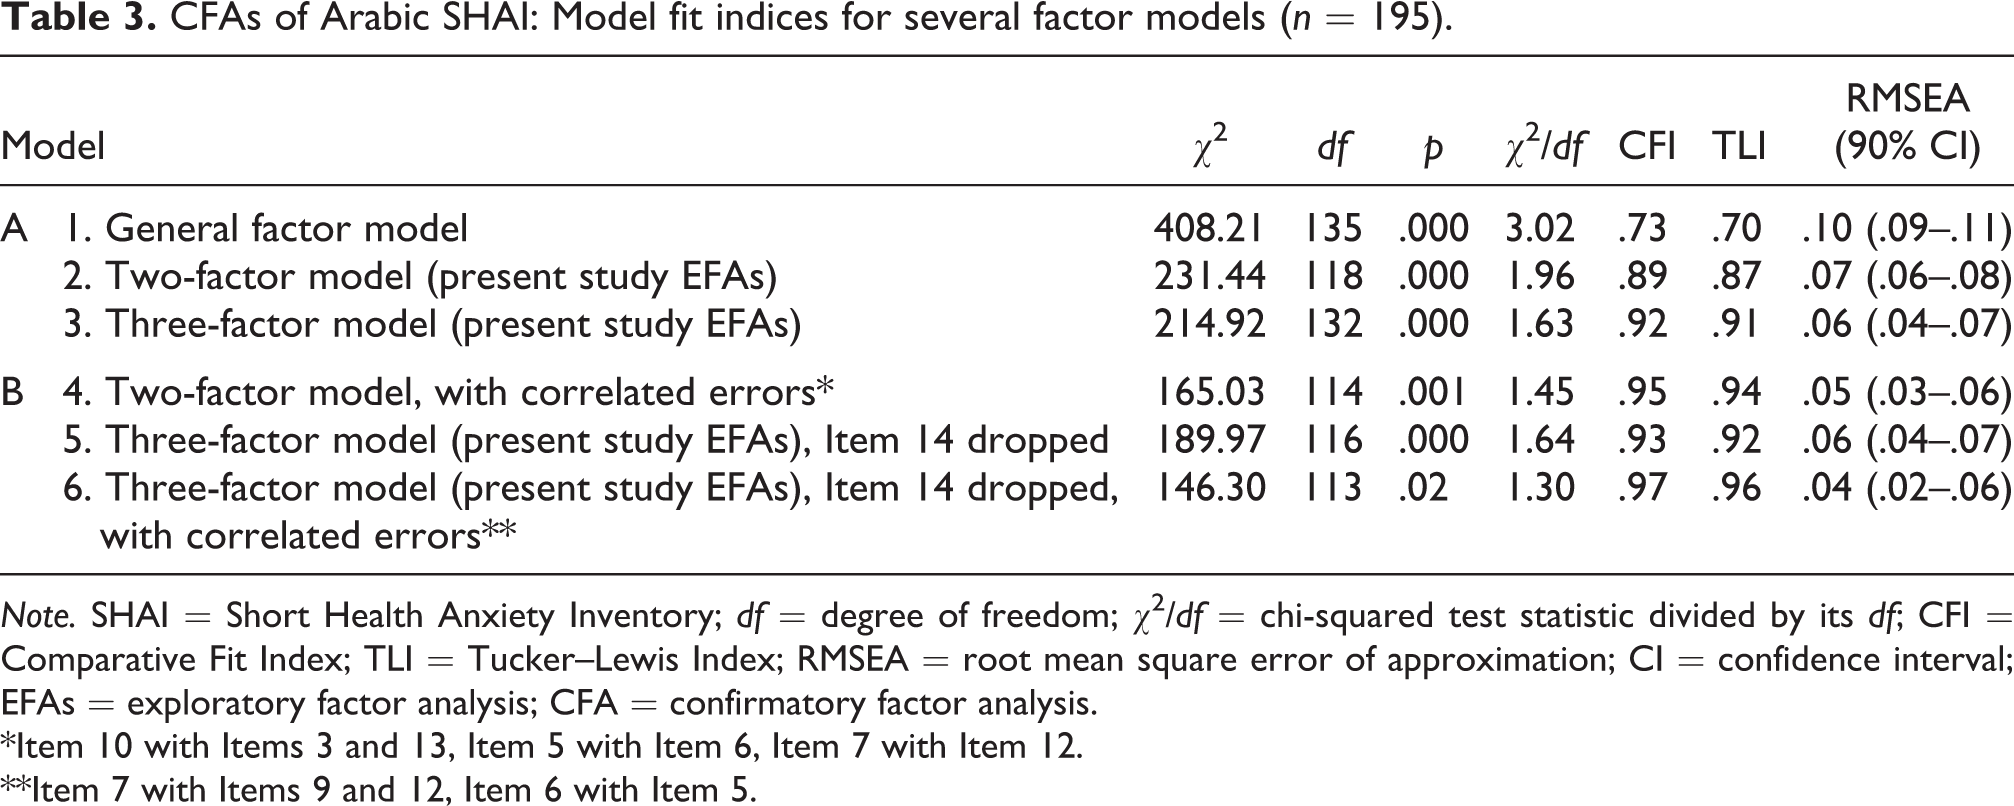
Note. SHAI = Short Health Anxiety Inventory; df = degree of freedom; χ2/df = chi-squared test statistic divided by its df; CFI = Comparative Fit Index; TLI = Tucker–Lewis Index; RMSEA = root mean square error of approximation; CI = confidence interval; EFAs = exploratory factor analysis; CFA = confirmatory factor analysis.
*Item 10 with Items 3 and 13, Item 5 with Item 6, Item 7 with Item 12.
**Item 7 with Items 9 and 12, Item 6 with Item 5.
However, an inspection of factor loadings and modification indices for Models 2 and 3 revealed correlated errors between some items in the models and low loading for Item 14 in the third model (.19). Therefore, the model tests for Models 2 and 3 were repeated, dropping Item 14 from Model 3 and including correlated errors in both models. Section B of Table 3 shows findings from this phase.
All of the three models tested were of adequate fit, with almost identical model fit indices. Model 6 (three-factor model with Item 14 dropped and correlated errors) exhibited the best fit indices followed by Model 4 (two-factor model with correlated errors) and finally Model 5 (three-factor model with Item 14 dropped). However, when comparing the three solutions in terms of internal consistency (Cronbach’s α) of their factors, consistent with related recommendations (Tabachnick & Fidell, 2007), α level for Factor 3 (Body Vigilance) in Models 5 and 6 was low (.62), leading to questions about reliability and hence the credibility of this factor, whereas Cronbach’s α was adequate for components of the two-factor model. Hence, the two-factor structure implied in Model 4 was chosen for the following analyses. This decision was also in agreement with the majority of previous factorial SHAI studies and the parsimony.
MI across gender (full sample, N = 421)
MI across gender was examined by dividing the full sample into two groups: (1) women (n = 289) and (2) men (n = 128). There were no statistically significant differences between the two groups in terms of age (t[156.19] = 1.52; p = .13), proportion of having a chronic physical illness (χ2[1] = 0.93; p = .34), or proportion of having a past or current psychological condition (χ2[1] = 0.19; p = .66) after excluding those who did not provide data regarding the presence of chronic physical illnesses (n = 14) or past/current psychological conditions (n = 3).
Table 4 presents the fit indices for the configural invariance (M1), metric invariance (M2), and scalar invariance (M3) models. As can be seen in the table, results concerning SHAI invariance across gender exhibited overall adequate fit for the configural, metric, and scalar models. However, the TLI value of the configural model fell slightly below the required level of .90 (actual .892). Such a single small deviation is unlikely to be enough to suggest noninvariance, given that the ratio χ2/df, CFI, and RMSEA values were all within the required ranges. The χ2 differences were not statistically significant in either metric or scalar models. Differences in CFI and RMSEA were also <.01 and .015, respectively, in all models. This pattern of findings supports MI of SHAI across gender at the three levels of invariance.
Model fit indices for MI of the Arabic SHAI across gender.
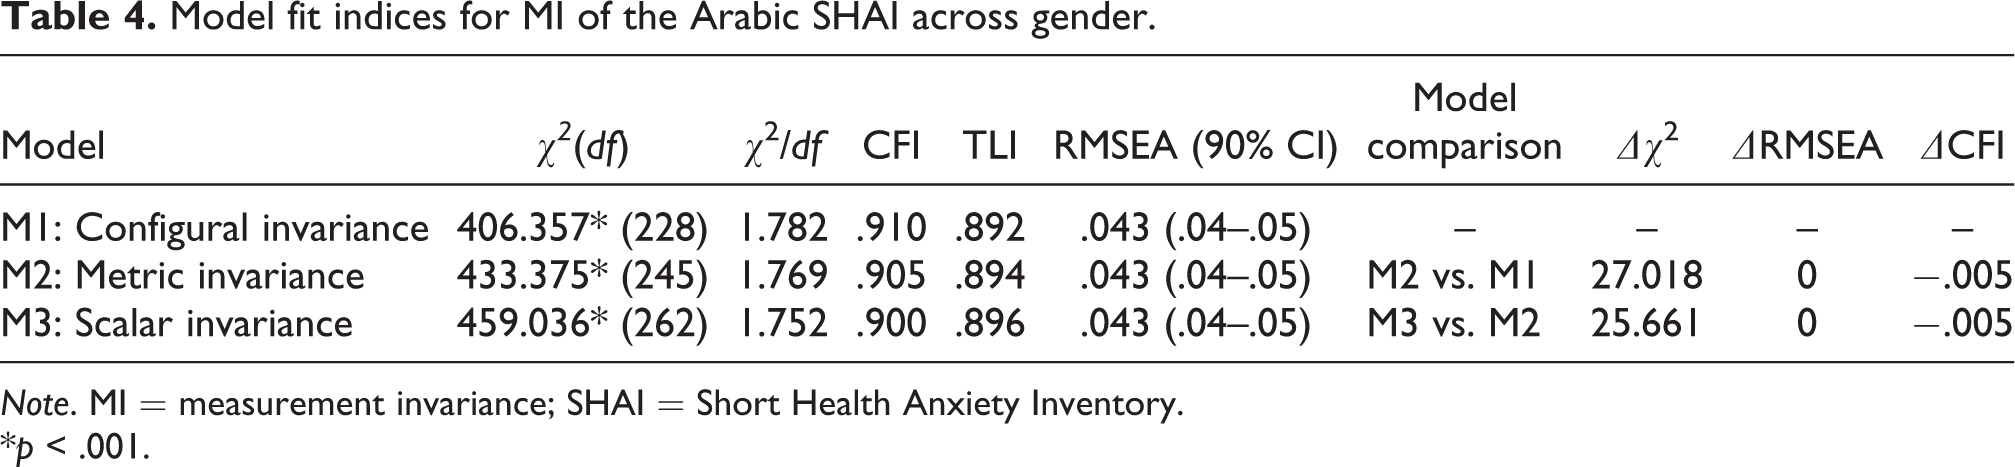
Note. MI = measurement invariance; SHAI = Short Health Anxiety Inventory.
*p < .001.
Descriptives and internal consistency reliability (full sample, N = 421)
Table 5 presents the descriptives of SHAI items and subscales and reliability estimates as assessed by Cronbach’s α. Means of individual 17 items ranged from 0.31 to 1.68 (M mean = 0.72), and medians within the range 0–2. Standard deviations ranged from 0.55 to 0.92 (M SD = 0.71). Overall, the full scale, subscales, and items presented reduced means and standard deviations. Items showed a clear tendency toward positive skewness (a pileup on the left of the distribution toward lower levels) (M S = 0.97, range: 0.00–2.12) and to a lesser extent, positive kurtosis (pointy distribution) (M K = 1.07; range: −0.77 to 4.83).
Factor loadings, internal consistency (Cronbach’s α), and descriptives of the Arabic SHAI.*

Note. M = mean; Med = median; SD = standard deviation; S = skewness; K = kurtosis; CITC = corrected item–total correlation; CFA = confirmatory factor analysis; IL = illness likelihood; NC = negative consequences.
* All statistics shown are derived from the full sample data (N = 421), except for factor loadings (standardized estimates) which are derived from the CFA in the second subsample (n = 195).
** Values presented in boldface type are significant at p < .01.
SHAI total and subscales scores demonstrated good internal consistency reliability. α Values were .85, .83, and .77, for the total score and IL and NC subscales, respectively. Corrected item–total correlations were all above the threshold of .30 for the IL (M = 0.49, range: 0.35–0.59) and the NC (M = 0.58, range: 0.40–0.68). Additionally, inter-item correlations were between .09 and .49 on IL items with an average of .29 and within the range of .30–.62 with an average of .45 for the NC items.
Associations with gender and age
There were no statistically significant differences between the two genders with respect to the SHAI total score or subscales. Total score and IL subscale were associated negatively statistically significantly, although weakly, with age: total score, r s(334) = −.12, p < .05, and IL, r s(334) = −.13; p < .05. NC did not correlate with age.
Discussion
The present study was designed to provide an Arabic version of the SHAI (Salkovskis et al., 2002) and then identify its latent factorial structure, MI across gender, and internal consistency reliability, in addition to testing links between this scale and age and gender.
Overall, exploratory and CFAs supported an interpretable factor structure consisting of two correlated lower order factors, largely resembling those of the development paper (Salkovskis et al., 2002). They are the IL factor (13 items), which is a unidimensional measure of HA, particularly its cognitive component, and the NC factor (4 items), which is a measure of the anticipated negative outcomes of having an illness. This finding is in line with the vast majority of studies that replicated Salkovskis and colleagues’ two-factor structure (e.g., Alberts et al., 2011; Arnáez et al., 2019; Te Poel et al., 2017; Wheaton et al., 2010).
However, unlike most of the abovementioned studies, Item 14 did not produce salient factor loading in the present two-factor model and, hence, was dropped from the solution, an observation first revealed in EFAs and replicated in the following CFA. Interestingly, this item first exhibited proper loading |.60| within the other three-factor solution extracted in the EFAs, before failing to load when the same model was further examined using CFA. This same item was also found to be problematic within the two-factor model extracted by Alberts et al. (2013) and the three-factor solution in Olatunji (2009).
This poor performance of Item 14, particularly in this study, could be attributed to the interaction between collectivism as cultural dimension and social desirability (SD) as a form of response bias. SD is thought to be common among collectivist societies (Bernardi, 2006; Bornstein et al., 2015). That is, certain values in collectivist societies influence individuals to present themselves in a socially appropriate manner, partially to ensure solid ties with their in-groups. In contrast, those from individualist societies tend to experience less pressure to perform in such a way. Saudi society, from where the present sample was derived, is seen to be high on the collectivism dimension (Alruwaita, 2009; Hofstede et al., 2010), and elevated SD is expected as a result. Hence, the explicit reference to family and friends in this item’s content (i.e., Familiars/friends say I worry about my health) may have triggered the collectivist tendencies in participants, leading to SD’s possible contamination of the performance on this item. This hypothesis should be considered with caution as this apparently problematic performance of Item 14 has also been found in samples derived from generally individualist backgrounds as mentioned earlier (e.g., Alberts et al., 2011; Olatunji, 2009). Future studies may shed light on this issue.
Noteworthy, the two-factor solution was partly selected based on parsimony. A three-factor solution, almost identical to that of Abramowitz, Deacon, and Valentiner (2007) and Olatunji (2009), could have instead been selected. This selection choice was also the case in other studies in which both models demonstrated close or similar model fit indices, but the two-factor model was preferred based on parsimony merely, not necessarily due to its superior goodness of fit (Arnáez et al., 2019; Te Poel et al., 2017). The discrepancy between the two-factor and three-factor structures was exclusively in the IL items as they were divided into two dimensions: (1) IL and (2) Body Vigilance. The NC items held together in either model. This finding suggested an issue regarding the accuracy of considering HA (IL) assessed in this measure as a unidimensional construct (single underlying dimension).
In this regard, even if the HA items (the first 14 items) were truly based on two factors, these two factors may not necessarily be the ones proposed by Abramowitz et al. and Olatunji. Alberts et al. (2011) performed a factor analysis of the first 14 items of the SHAI, excluding the NCs items, and extracted a two-factor structure (thought intrusion and fear of illness factors) that did not match the former two studies.
Overall, while existing evidence in support of a two-factor model generally outweigh those of the three factors, no decisive conclusion can be drawn yet. Given the theoretical and clinical implications of this matter, it warrants further investigations, especially within the contexts of modern dimensional models of psychopathology (e.g., The Research Domain Criteria (RDoC); Insel et al., 2010; HiTOP; Kotov et al., 2017).
The incorporation of the NC dimension in this measure may be questionable. In this study, as in previous reports, the IL (HA component) and the NC dimensions were found interrelated but distinguishable. Indeed, Salkovskis et al. (2002) added this subscale as a supplement to the HA measure following the cognitive theory of HA in which anticipated NCs of being ill are seen important in contributing to the threat of being ill. Yet, results from this study do not seem to support the practice of summing scores on both subscales in order to assess HA. Not summing the scores is also in agreement with recommendations from previous articles (Alberts et al., 2013; Te Poel et al., 2017), in addition to studies that utilized only the IL subscale to assess HA (Alberts et al., 2011; Rode et al., 2006; Tyrer et al., 2011).
The SHAI total, subscales, and most individual items scores were characterized by positive skewness and kurtosis. This may not be surprising given that the sample is mostly nonclinical. Nonclinical participants tend to choose statements that reflect their nonclinical levels of HA, resulting in a pile-up of scores on the left side of the distribution and in turn indicating a significant positive skewness. The same observation was noted by Arnáez et al. (2019). Despite that observation, total score mean levels fell within the range reported in most studies (12.41 ± 6.81) (Alberts et al., 2013). All items exhibited appropriate links with their total scores (corrected item–total correlation), providing further support to the homogeneity of the scale content.
Total score and the IL subscale obtained good Cronbach’s αs (i.e., α ≥ .80; Anastasi & Urbina, 1997). The NC subscale’s α was slightly lower (α = .77), which could be due to the small number of items (four items), as this coefficient is known to be influenced by item count among other factors (Anastasi & Urbina, 1997; Gregory, 1996). Again, this is in line with previous reports that indicated an α > .80 for the total score and IL subscale and lower values for the NC (e.g., Alberts et al., 2013; Te Poel et al., 2017). It would be sensible to recommend using the NC with caution due to the relatively lower internal consistency regardless of requests to be less restrictive in specifying the needed reliability level (Gregory, 1996; Groth-Marnat & Wright, 2016).
In this regard, it is important to keep in mind that the insight this study brought to the reliability of Arabic SHAI is partial. Other types of reliability estimates have not been studied, particularly, the temporal stability reliability. Future studies may explore the test–retest reliability of Arabic SHAI.
Women and men do not seem to possess different levels of HA since there were no statistically significant differences between them with respect to the scale’s components. This finding is in agreement with previous results (Alberts et al., 2011). The IL subscale did associate with age negatively but in negligible effect size (r s = −.13), whereas NC did not. The same trend was reported in previous studies (Alberts et al., 2011; Arnáez et al., 2019; Te Poel et al., 2017).
Taken together, results support, at least partially, the psychometric suitability of the Arabic version of SHAI. Nonetheless, several points should be taken into account when reviewing the findings of this study. First, the SHAI was delivered online in this study. While this mode of delivery has also been used in other studies (e.g., Alberts et al., 2011; Fetzner et al., 2014; Singh & Brown, 2014; Te Poel et al., 2017; Wheaton et al., 2010), it is still not clear whether or not findings could generalize to a paper-and-pencil format. Future research may help address this point. Second, current findings have nothing to do with clinical usage of this measure. In fact, they may, at best, pave the way for future studies that would look at the clinical utility of SHAI in Saudi clinical samples.
Third, it is important to realize that this study focuses mostly on what can be considered the internal validity of the scale (i.e., latent structure). In other words, establishing the latent structure needed to explain individual differences in HA as assessed using the scale. Although this is necessary for a newly developed version of a psychometric measure, it is not enough to adequately establish the validity of the scale. Upcoming investigations should further test the validity of the scale by gathering evidence regarding links with external divergent and convergent constructs (i.e., criteria-related validity) and other validity evidence.
Footnotes
Acknowledgments
The author would like to thank Prof. Sultan Alowidha, Prof. Abdullah Alruwaitea, and Dr. Ahmad Alhadi for their help during the translation process. Due thanks also to Dr. Abdulrahman Bahkaly for setting up the online version of the measure and for the helpful discussions during the initial stages of this project. Due thanks to Dr. Abdullah Binshowiel for reviewing an earlier version of this manuscript.
Declaration of conflicting interests
The author(s) declared no potential conflicts of interest with respect to the research, authorship, and/or publication of this article.
Funding
The author(s) disclosed receipt of the following financial support for the research, authorship, and/or publication of this article: This is a research project that was supported by a grant from the Research Center for the College of Education, Deanship of Scientific Research at King Saud University.