
Abstract
Difficulty tolerating uncertainty has been linked to heightened negative affect and risk for various forms of psychopathology. Willingness to tolerate uncertainty is usually assessed by self-report but investigating behavior under uncertainty may be particularly informative. This study examined whether willingness to wait in uncertainty is related to individual differences in impulsivity, anxiety, and emotion regulation. Students (n = 56) completed an uncertain gambling task in which they chose between a small, low-probability reward available immediately and a larger, higher probability reward available after an uncertain delay. The distribution of the data indicated two groups: those who always waited and those who did not. Non-waiters compared to waiters were characterized by higher levels of delay discounting, neuroticism, inhibitory intolerance of uncertainty, and worry. They also reported more tension following the task than did waiters. Among non-waiters, greater delay discounting was associated with less willingness to wait in uncertainty. These findings suggest a link between compromised decision-making under uncertainty and heightened risk for psychopathology.
Keywords
Few things in life are certain. Many of the situations that comprise daily living are characterized by high degrees of uncertainty—one is rarely absolutely sure that the day will go smoothly and that nothing bad, like a loved one’s car accident or a poor performance review at work, will happen. Given the ubiquity of uncertainty, the ability to behave adaptively in uncertain situations is critical. Uncertainty poses challenges for optimal and efficient decision making—and one well-documented effect of uncertainty on decision-making is risk aversion, the preference that individuals exhibit for certain but less valuable rewards over more valuable but uncertain rewards (Kahneman & Tversky, 1984). Many studies have demonstrated that individuals display risk aversion in situations where outcomes are unknown (Harrison & Rutstrom, 2008), but the effects of uncertainty on decision-making extend beyond risk aversion.
Many situations are characterized by uncertainty that cannot be immediately resolved. These situations, such as awaiting the results of an exam, anticipating a text message from a potential romantic partner, or expecting an update on the health of a sick family member, require waiting in a state of uncertainty. In these situations, there are several behavioral options—emailing the professor to ask if the exams have been graded, texting your date immediately, or calling your family member several times per day—that serve as attempts to reduce uncertainty. However, many of these behaviors are not adaptive. Simply “waiting it out” may often be the most efficient and effective decision. However, waiting in a state of uncertainty, even when adaptive, can be challenging. Work by Sweeny and colleagues (2014, 2015) has demonstrated that waiting in uncertain situations tends to be perceived as difficult and emotionally aversive.
Due to the frequency of uncertain situations and their distressing nature, it is important to understand for whom waiting in uncertainty is difficult. Individual differences in three constructs seem particularly important: (1) impulsivity-related traits, such as delay discounting, which may lead to decisions that prioritize immediate rewards over ones that require waiting in uncertainty; (2) anxiety-related traits, which may give rise to negative affect that is unpleasant and avoided through unwillingness to wait; and (3) emotion regulation, which may determine how individuals respond to the emotions that arise during uncertain waiting and influence how willing they are to withstand these emotions to continue waiting. Together, individual differences in these three sets of constructs may reflect distinct pathways that lead an individual to experience difficulty waiting in a state of uncertainty even when it is adaptive.
One facet of impulsivity that may be especially important for understanding willingness to wait in uncertainty is delay discounting. Delay discounting refers to the tendency to prefer smaller, immediate rewards over larger, delayed rewards and is exaggerated in impulsive individuals, such as those with substance use problems (de Wit, 2009). Individuals with greater hypothetical discounting rates on a self-report measure were less willing to wait in states of uncertainty (Luhmann, Ishida, & Hajcak, 2011). It is important to note, however, that delay discounting is a multifaceted construct. Initial or hypothetical delay discounting preferences assessed by self-report measures have been conceptualized as reflecting the rational assessment of the costs and benefits associated with a set of options (McGuire & Kable, 2015). On the other hand, willingness to wait for a delayed reward is thought to recruit self-regulatory processes that enable the individual to sustain their initial choice and inhibit the desire to choose the immediate option (McGuire & Kable, 2015; Mischel, Ayduk, & Mendoza-Denton, 2003). Valuing the delayed option and deciding that it is worth waiting for are a necessary component of being willing to wait in uncertainty for a delayed reward. However, the ability to sustain that choice and inhibit the desire to choose the immediate option may be more relevant to withstanding the potentially unpleasant experience of protracted uncertainty. This component of delay discounting, however, cannot be readily assessed with self-report but instead requires assessment of actual behavior in a waiting task. Thus, the present study sought to thoroughly assess the relation between delay discounting and willingness to wait in uncertainty by administering both a self-report measure of hypothetical delay discounting preferences and a behavioral delay discounting task that required waiting in certainty.
One anxiety-related trait that may be particularly important for understanding willingness to wait in uncertainty is intolerance of uncertainty (IU), a trait that is elevated in individuals with anxiety disorders and that refers to how threatening and aversive individuals find uncertainty (Dugas & Robichaud, 2007; Shihata, McEvoy, Mullan, & Carleton, 2016). Higher self-reported IU has been shown to be associated with less willingness to wait in uncertainty for more valuable, less risky rewards (Luhmann et al., 2011). IU, however, is not a unitary construct. It is thought to consist of two highly related but distinct factors—prospective IU, which refers to the desire for predictability and the active seeking of certainty, and inhibitory IU, which refers to paralysis of cognition and action in the face of uncertainty (Carleton, 2012; McEvoy & Mahoney, 2011, 2012). The two factors have shown differential relations with psychopathology (McEvoy & Mahoney, 2012) and performance on behavioral tasks (Carleton et al., 2016), so it is important to consider their relations with willingness to wait independently. For example, prospective IU is more closely linked with generalized anxiety disorder and obsessive compulsive disorder, while inhibitory IU is more associated with social anxiety disorder, panic disorder, and depression (McEvoy & Mahoney, 2012). Given that prospective IU is characterized by active seeking of certainty, it is possible that individuals high on this subscale would make decisions that bring about certainty—in other words, be unwilling to wait. Paralysis in the face of uncertainty as reflected in the inhibitory subscale, on the other hand, might not interfere with (and could even enable) waiting. Because of these plausible differential relationships, the present study examined both prospective and inhibitory IU independently.
The relation between trait anxiety and waiting behavior has also been investigated: Luhmann and colleagues (2011) found that trait anxiety and willingness to wait in uncertainty were not significantly associated. However, neuroticism, a similarly broad dispositional trait, may be especially relevant to difficulty with uncertainty. Recent theoretical work has suggested that the key feature of neuroticism that contributes to anxiety- and depression-related psychopathology is fear of the unknown—in other words, anxiety in the face of uncertainty (Carleton, 2016). Indeed, neuroticism is associated with difficulty making decisions under uncertainty (Denburg et al., 2009; Hooper, Luciana, Wahlstrom, Conklin, & Yarger, 2008) and thus may relate to unwillingness to withstand protracted uncertainty for better rewards.
Finally, there may be an important relationship between emotion regulation and willingness to wait in uncertainty. The ability to effectively regulate negative emotions that arise during a waiting period may have direct implications for one’s ability to behave adaptively. Previous work with law students who were waiting to learn the results of the bar exam showed that engaging in rumination was associated with greater anxiety (Sweeny & Andrews, 2014), suggesting that maladaptive emotion regulation strategies may not be effective in reducing negative affect during a waiting period. If such strategies are not effective at mitigating the negative effects of waiting on emotion, then it is possible that having a tendency to rely on these strategies may interfere with one’s ability to behave adaptively. In addition to rumination, worry, which is a similar type of repetitive negative thought, may be particularly relevant—high worriers tend to be preoccupied with uncertain future scenarios (Freeston, Rhéaume, Letarte, Dugas, & Ladouceur, 1994) and thus might find uncertainty even more difficult to face than do high ruminators. To address this question, we examined whether individual differences in rumination and worry tendencies were associated with willingness to wait in uncertainty.
Using a gambling task adapted from Luhmann and colleagues (2011), we examined participants’ willingness to wait uncertain amounts of time for uncertain rewards. Specifically, participants chose between a less valuable, riskier option available immediately and a more valuable, less risky option available only after a variable and uncertain delay. Both the uncertainty of the outcome and the uncertainty of the delay created a protracted state of uncertainty on each trial. If participants did not select the delayed option, they were immediately given feedback about the outcome, thus resolving uncertainty, but they were still required to wait the duration of the delay for the next trial to start. Thus, the trial-to-trial waiting period was identical but was differentiated by whether that period was characterized by waiting in certainty or waiting in uncertainty. The rational course of action on each trial of the Uncertain Waiting Task (UWT) was to choose the delayed option associated with a larger and more probable reward, but this choice required tolerating uncertainty.
The current study examined the following questions: (1) whether individuals vary in how often they choose to wait in uncertainty to obtain more valuable, less risky rewards; (2) how willingness to wait in uncertainty relates to both self-reported and behavioral delay discounting; (3) whether IU—specifically, the prospective factor—and neuroticism are associated with willingness to wait in uncertainty; and (4) whether the tendency to worry or ruminate relates to willingness to withstand uncertainty.
Method
Participants
Fifty-six students from local universities in the New Haven area completed the experiment. Sample size was determined using a power analysis that based the effect size on previous work by Luhmann and colleagues (2011). Two participants were excluded from analyses involving the self-report measures because their self-report data were lost due to experimenter error. The remainder of the sample consisted of 54 participants (39 female) with a mean age of 21.22 years (SD = 2.59). Of these participants, 57.40% identified as Caucasian, 13.00% as Asian, 9.30% as African American, 5.60% as Latino/Latina, 1.90% as Native American, and 13.00% as multiracial. The Yale University Human Subjects Committee approved the study, and informed consent was obtained from each participant. Participants completed the UWT first, the Two Choice Impulsivity Task second, and self-report measures last. Participants were compensated US$10.00 per hour, as well as their task earnings. Although participants were led to believe that they would be paid exactly the amount that they earned, their earnings were always rounded up to US$8.00 to ensure equal compensation across all participants.
Procedure
Monetary Choice Questionnaire (MCQ)
The MCQ consists of 21 items that ask the participant to choose between two hypothetical amounts of money, one that is smaller but available immediately and another that is larger but available later (Kirby & Marakovic, 1996). The questions were designed to cover a range of possible discounting preferences, and based on their responses, a discounting rate can be calculated for each participant (for the scoring procedure, see Kirby & Marakovic, 1996; discount factors were calculated from k using the procedure described by Takahashi, Sakaguchi, Oki, & Hasegawa, 2008). The discounting rate reflects the degree to which the value of an option (e.g., US$1.00) decreases as the duration of the delay increases (e.g., US$1.00 may only be worth US$0.90 to a participant after a one-day delay). Thus, higher scores reflect more shallow discounting rates. The measure has demonstrated good test–retest reliability (r = .63 to .77; Kirby, 2009).
Intolerance of Uncertainty Scale (IUS-12)
The IUS consists of 12 items that measure dislike of and reactions to uncertainty (Carleton, Sharpe, & Asmundson, 2007). It is an abbreviated version of the original 27-item measure, with which it is highly correlated (Carleton, Norton, & Asmundson., 2007; Freeston et al., 1994). The prospective subscale (IUS-P) consists of 7 items (e.g., “One should always look ahead so as to avoid surprises”), and the inhibitory subscale (IUS-I) consists of 5 items (e.g., “The smallest doubt can stop me from acting.”). Participants rate items on a 5-point scale. The IUS had high internal consistency in the current study (α = .90), as did the individual subscales (prospective: α = .87; inhibitory: α = .84).
NEO Five Factor Inventory–Neuroticism Subscale (NEO-N)
The NEO-FFI neuroticism subscale consists of 12 items assessing the personality trait of neuroticism (McCrae & Costa, 2004). Participants rate items based on how strongly they agree or disagree with each. The subscale had high internal consistency (α = .87).
Penn State Worry Questionnaire (PSWQ)
The PSWQ (Meyer, Miller, Metzger, & Borkovec, 1990) was used to assess worry. On a 5-point scale, participants rate their agreement with 16 items examining the degree to which an individual’s worry is excessive, generalized, and uncontrollable (Fresco, Mennin, Heimberg, & Turk, 2003). The PSWQ had high internal consistency (α = .92).
Ruminative Responses Scale (RRS)
The RRS (Treynor, Gonzalez, & Nolen-Hoeksema, 2003) was used to assess rumination. On a 4-point scale, participants rated their agreement with 22 items that assess the nature of participants’ responses to sad mood, including responses focused on the self (e.g., “think ‘What am I doing to deserve this?’”), symptoms (e.g., “think about how sad you feel”), and possible causes and consequences of sad mood (e.g., “think, ‘Why do I always react this way?’”). The RRS had high internal consistency (α = .92).
UWT
Participants completed a decision-making task based on the paradigm used by Luhmann and colleagues (2011). The UWT examines participants’ willingness to wait an uncertain period of time for more probable and valuable monetary rewards (see Figure 1). Participants are presented with the opportunity to choose an immediate option associated with a 50% probability of winning 8 cents, or to wait a variable and uncertain amount of time for a second option, associated with a 70% chance of winning 12 cents, to appear. The amount of time before the second option is presented varies from 5 s to 20 s. Immediately after either option is chosen, participants receive feedback telling them if they won money and how much money they have won in total. Importantly, if participants choose the first option, the remainder of that trial’s delay is appended to the 500 ms intertrial interval. For example, if a participant chose the first option immediately on a 7-s delay trial, they would be required to wait 7.5 s for the following trial to begin. In other words, there is no objective advantage to choosing the first option—it is a lower probability of a smaller reward than the second option and is associated with the same duration of waiting on each trial. Participants are told this, and they are informed that the task will consist of 100 trials that last approximately 20 min regardless of their choices. Before beginning, participants completed up to 10 practice trials. The proportion of trials on which participants waited (i.e., willingness to wait) was examined.

Diagram of two example trials of the UWT. The left panel shows a trial on which the participant chooses to wait for the delayed option. The first option is presented, a variable delay of 5–20 s follows, and the second option appears, replacing the first. The participant then responds with a keyboard press to choose the second option, and feedback regarding the outcome of the trial is presented (i.e., a win of 12 cents or no win). The next trial begins. The right panel shows a trial on which the participant chooses the immediate option. The participant does not wait for the delayed option to appear and responds with a keyboard press while the first option is on the screen. Feedback regarding the outcome of the trial is presented (i.e., a win of 8 cents or no win). Before the next trial can begin, the participant is required to wait for the remainder of the predetermined delay for that trial (5–20 s). UWT: Uncertain Waiting Task.
To examine whether the task elicited any changes in affect, ratings of affect were collected prior to beginning the task and immediately after. Specifically, participants reported the extent to which they felt “anxious,” “tense,” and “sad” on a 7-point scale ranging from very slightly/not at all to extremely.
Two-choice impulsivity paradigm
The two-choice impulsivity paradigm (TCIP) examines the delay discounting facet of impulsivity by asking participants to choose between a smaller but sooner outcome (e.g., 5 points after 5 s) and a later but larger outcome (e.g., 15 points after 15 s; Dougherty, Mathias, Marsh, & Jagar, 2005). Each option is represented by a shape; both shapes are displayed simultaneously on the screen, and after choosing one, participants wait the corresponding amount of time and click again to receive the corresponding number of points. Both the value of each option and the length of the delay are explicitly stated at the beginning of each trial and remain visible throughout the task, which consists of 50 trials. Before beginning, participants completed up to six practice trials and were told that they would receive a bonus based on their performance. The proportion of trials on which participants waited was examined.
Data analysis
The distribution of scores on the self-report and behavioral measures was examined. Due to the highly skewed distribution of willingness to wait on the UWT and the fact that a substantial number of participants always waited, participants were split into two groups: waiters and non-waiters. The two groups were compared on the individual difference measures and affect ratings. To examine whether scores on the individual differences measures and willingness to wait in uncertainty were related when examined continuously, correlations were examined among non-waiters only.
Results
Descriptive statistics
Descriptive statistics for the self-report and behavioral measures are reported in Table 1. Scores on neuroticism, IU, rumination, and worry were normally distributed, consistent with the unselected nature of the sample. Willingness to wait for the delayed option in the UWT varied between 16% and 100% of trials, with participants waiting on 84% of trials on average (SD = 0.27). A substantial number of participants (n = 21) always chose the delayed option. Thus, the data were non-normally distributed, with a skewness of −1.49 (SE = .32) and a kurtosis of 0.70 (SE = .63). Willingness to wait in the TCIP varied between 6% and 100% of trials, with participants waiting on 91% of trials on average (SD = 0.17). These data were also non-normally distributed, with a skewness of −3.07 (SE = .32) and a kurtosis of 11.52 (SE = .63).
Descriptive statistics for self-report and behavioral measures.
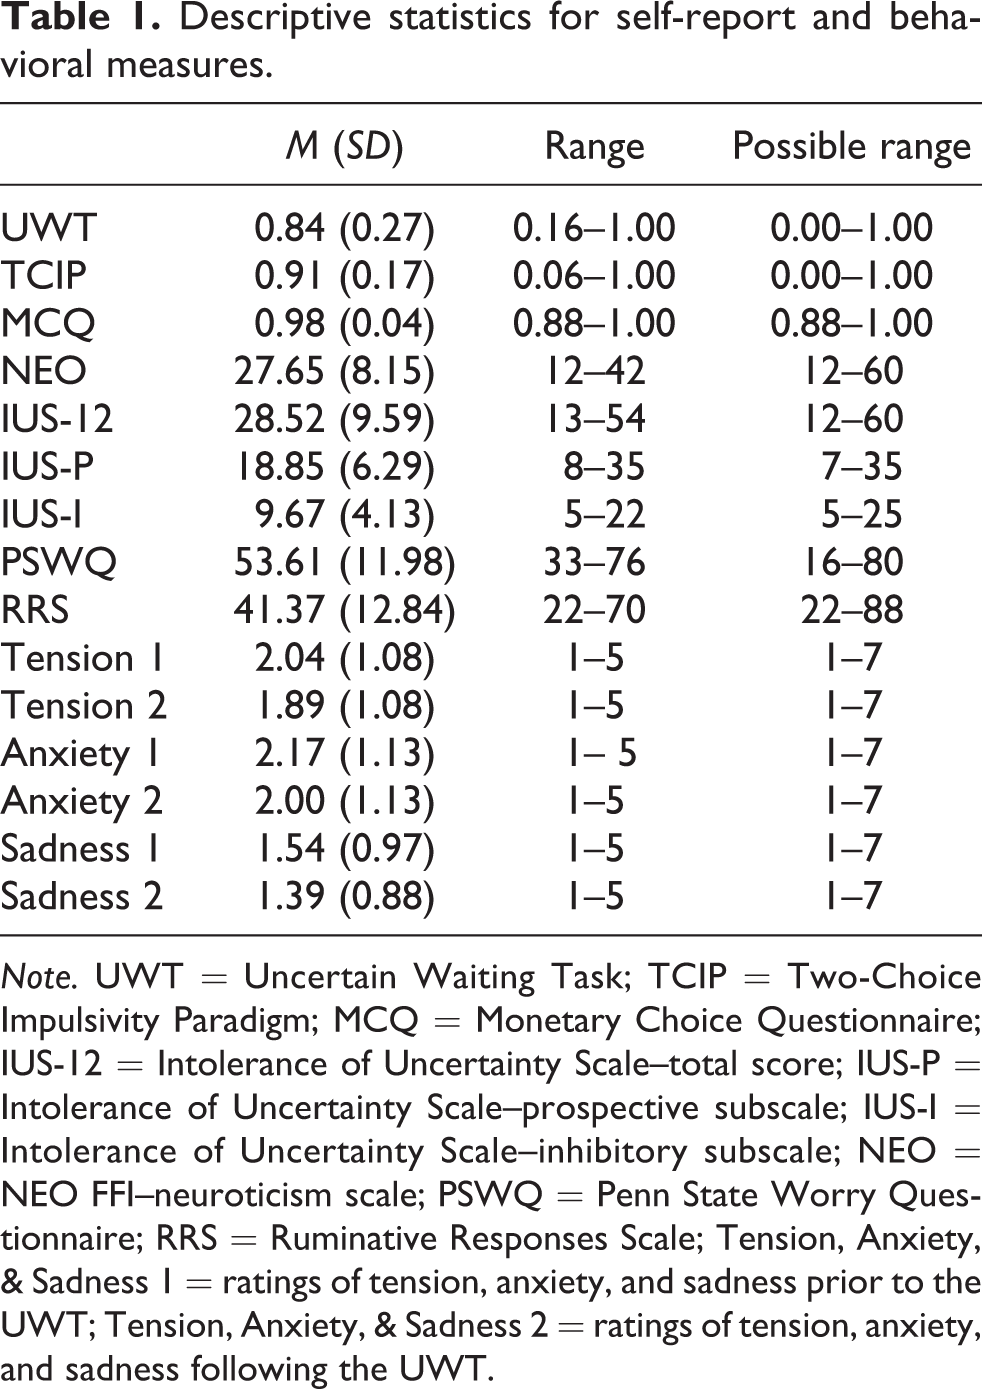
Note. UWT = Uncertain Waiting Task; TCIP = Two-Choice Impulsivity Paradigm; MCQ = Monetary Choice Questionnaire; IUS-12 = Intolerance of Uncertainty Scale–total score; IUS-P = Intolerance of Uncertainty Scale–prospective subscale; IUS-I = Intolerance of Uncertainty Scale–inhibitory subscale; NEO = NEO FFI–neuroticism scale; PSWQ = Penn State Worry Questionnaire; RRS = Ruminative Responses Scale; Tension, Anxiety, & Sadness 1 = ratings of tension, anxiety, and sadness prior to the UWT; Tension, Anxiety, & Sadness 2 = ratings of tension, anxiety, and sadness following the UWT.
Because willingness to wait on the UWT was the main variable of interest and was highly skewed, the sample was divided into waiters (n = 21; defined as participants who waited 100% of the time) and non-waiters (n = 35; defined as participants who did not wait 100% of the time) to examine differences in self-report and behavioral measures between the two groups.
Differences between waiters and non-waiters
Table 2 shows group differences in scores on the individual difference measures between waiters and non-waiters. Non-waiters compared to waiters scored significantly higher on neuroticism, t(50) = 2.34, p = .02, d = 0.68, inhibitory IU, t(51.24) = 2.34, p = .02, d = 0.62, and worry, t(52) = 3.90, p < .001, d = 1.15. Non-waiters compared to waiters also had steeper rates of delay discounting on both the self-report, t(36.70) = −3.69, p = .001, d = 0.69, and behavioral, t(44.09) = −2.74, p = .01, d = 0.61, measures. 1 Rumination, t(52) = 0.93, p = .36, d = 0.27, and prospective IU, t(52) = 1.33, p = .19, d = 0.39, did not significantly differ between waiters and non-waiters. Neuroticism, inhibitory IU, worry, self-reported delay discounting, and behavioral delay discounting remained significant after correcting for multiple comparisons using false discovery rate correction at p = .05 following the procedure described by Benjamini and Hochberg (1995) and others (McDonald, 2014; Simes, 1986). The p values reported are the non-adjusted values, which remained significant after correcting for multiple comparisons.
Mean individual difference scores for waiters and non-waiters.

Note. UWT = Uncertain Waiting Task; TCIP = Two-Choice Impulsivity Paradigm; MCQ = Monetary Choice Questionnaire; IUS-12 = Intolerance of Uncertainty Scale – total score; IUS-P = Intolerance of Uncertainty Scale – prospective subscale; IUS-I = Intolerance of Uncertainty Scale – inhibitory subscale; NEO = NEO FFI – neuroticism scale; PSWQ = Penn State Worry Questionnaire; RRS = Ruminative Responses Scale.
† Means for tension, anxiety, and sadness refer to estimated marginal means of tension ratings following the UWT that are adjusted by the mean of the covariate (i.e., tension ratings before beginning the task), and the SE is reported in parentheses.
Waiters and non-waiters also differed in their affect ratings. Non-waiters (M = 2.07, SE = .14) reported being significantly more tense after the UWT than did waiters (M = 1.61, SE = .17) when tension ratings before the start of the UWT were included as a covariate, F(1, 51) = 4.30, p = .04,
Correlations between individual difference measures, changes in affect, and willingness to wait among non-waiters
Pearson correlations between the self-report and behavioral measures among non-waiters are presented in Table 3. Willingness to wait for the delayed option in the UWT was significantly correlated with the discount factor of the MCQ (r = .52, p = .002), but not waiting behavior in the TCIP (r = .16, p = .35). No other zero-order correlations with willingness to wait on the UWT were significant.
Zero-order correlations between individual difference measures and willingness to wait among non-waiters.

† Tension refers to the residual values of tension rated following the UWT after tension ratings prior to the task were accounted for.
*p < .05; **p < .01: two-tailed.
Correlations with self-reported affect and individual differences were also examined and are reported in Table 3. Affect ratings were calculated as the standardized residual values of ratings following the UWT when ratings prior to the task were accounted for. Among non-waiters, anxiety following the task was positively correlated with neuroticism (r = .57, p < .001), worry (r = .45, p = .01), and rumination (r = .39, p = .02). No other significant zero-order correlations emerged between the individual difference measures and tension or sadness.
Discussion
The current study investigated willingness to wait in states of uncertainty, a behavior that is often necessary in daily life but can be distressing and challenging, particularly for those at risk for psychopathology. Using a paradigm where waiting was always the most advantageous, least risky choice, the association of willingness to wait in states of uncertainty with individual differences in traits implicated in psychopathology was examined. The distribution of the data showed the presence of two groups: those who always waited and those who did not. Non-waiters compared to waiters were characterized by steeper rates of self-reported and behavioral delay discounting and higher levels of neuroticism, inhibitory IU, and worry. As well, they reported feeling more tense after the UWT than did waiters. Among non-waiters, steeper self-reported delay discounting was associated with less willingness to wait, and non-waiters who felt more anxious following the task had greater levels of neuroticism, worry, and rumination. Together, these results indicate that individual differences in impulsivity-related, anxiety-related, and emotion regulation traits distinguish those who have difficulty waiting in states of uncertainty from those who do not.
The finding that tension increased after the UWT for those who had difficulty waiting suggests that completing the task was not affectively neutral, particularly for participants who were unwilling to wait. Instead, our findings provide support for the notion that protracted uncertainty is aversive, especially for some individuals. These results are consistent with work demonstrating the aversiveness of uncertain waiting outside of the laboratory (Sweeny & Andrews, 2014; Sweeny & Falkenstein, 2015), as well as work showing that uncertainty elicits more anxious responding at the psychophysiological level than certainty (Gorka, Lieberman, Shankman, & Phan, 2017; Grupe & Nitschke, 2013). Additionally, among individuals who were unwilling to wait, the extent to which they experienced anxiety following the UWT was correlated with neuroticism, worry, and rumination. These findings suggest that people higher in traits that confer risk for anxiety-related psychopathology may be most susceptible to the aversive effects of protracted uncertainty.
Delay discounting, measured through self-report and behavior, was steeper among non-waiters compared to waiters. These results replicate and extend previous work by Luhmann and colleagues (2011) showing that self-reported delay discounting is associated with willingness to wait in uncertainty. Importantly, however, the current study suggests that self-reported and behavioral delay discounting may relate differently to waiting behavior under uncertainty; only self-reported, not behavioral, delay discounting was correlated with willingness to wait among non-waiters. As well, discounting on the MCQ and TCIP was not correlated. These results are consistent with previous work suggesting that hypothetical discounting preferences and willingness to wait for delayed rewards reflect distinct constructs (Caswell, Bond, Duka, & Morgan, 2015; Cyders & Coskunpinar, 2011; McGuire & Kable, 2015; Mischel et al., 2003). However, it is important to note that the distribution of scores on the TCIP was highly skewed, similar to other studies in student samples (e.g., Caswell et al., 2015), which may have made correlations difficult to detect.
Given the similarity between the behavioral delay discounting task and the UWT, we hypothesized that behavior in the two tasks would be more strongly correlated than self-reported discounting and willingness to wait in uncertainty, but this was not the case. Based on the finding that both self-reported and behavioral delay discounting are steeper among non-waiters than waiters, it may be that two factors characterize non-waiters: (1) they do not value the delayed reward highly enough to wait, as reflected in their hypothetical preferences and (2) they are not able or willing to inhibit their desire to choose the immediately gratifying option long enough to wait for the delayed reward. Our findings may be informative for interventions aimed at helping individuals withstand uncertain waiting. Because of the association between self-reported delay discounting preferences and willingness to wait in uncertainty, changing cognitions regarding the value of waiting may be particularly important. Additionally, because of the association between behavioral delay discounting and willingness to wait in uncertainty, developing skills to sustain the decision to wait may also be worthwhile.
Anxiety-related traits were also related to willingness to wait in uncertainty. The finding that neuroticism was elevated among non-waiters compared to waiters provides evidence that neuroticism is characterized by difficulty with uncertainty—a proposition that has been highlighted in theoretical work (e.g., Carleton, 2016) and for which we have found support at the behavioral level. Like neuroticism, inhibitory IU was elevated among non-waiters compared to waiters. This result was counter to our hypotheses—we expected that prospective IU, which is characterized by active seeking of certainty, would be associated with unwillingness to wait in uncertainty, whereas inhibitory IU, which is characterized by paralysis in uncertainty, might enable waiting (Carleton, 2012). However, conceptualizations of IU also suggest that the prospective factor reflects cognitive manifestations of IU, while the inhibitory factor reflects behavioral manifestations of IU (Carleton, Sharpe, & Asmundson, 2007). Indeed, the inhibitory IU subscale contains items that reflect behavioral avoidance, such as “I must get away from all uncertain situations” (Freeston et al., 1994). The conceptualization that inhibitory IU closely relates to behavior, including avoidance, is consistent with our results. Our findings also provide support for the notion that factors of IU are important to consider separately and have distinct relationships with behavior (Carleton et al., 2016).
Emotion regulation—particularly habitual use of worry—also emerged as an important factor in understanding willingness to wait in uncertainty. Non-waiters reported higher levels of worry, but not rumination, than did waiters. The elevated levels of worry among non-waiters in our sample are consistent with work suggesting that worried individuals are preoccupied with the uncertainty of possible future outcomes (Freeston et al., 1994) and suggest that this preoccupation may impair effective decision-making under uncertainty. Importantly, those who worried more also reported higher levels of anxiety following the task, suggesting that worry is maladaptive for both behavior and emotion during protracted uncertainty.
The current study is limited by a few factors. Thirty-eight percentage of the sample always chose the delayed option, and participants on average chose the delayed option 84% of the time. While this is not surprising given that choosing the immediate option is entirely irrational, the high frequency of waiting 100% of the time required us to use a two-tiered approach of examining which factors differed between waiters and non-waiters and then examining correlations between individual differences and willingness to wait among non-waiters. In contrast, Luhmann and colleagues (2011), who used a very similar task paradigm, found that participants waited 60% of the time on average, with only 4% of the sample always choosing the delayed reward. One possible explanation for this difference is that our task featured rewards of 8 cents for the immediate option and 12 cents for the delayed option, while Luhmann and colleagues’ (2011) featured 4- and 6-cent rewards, respectively. The doubled expected value of waiting in our version of the UWT may have contributed to greater willingness to wait.
It is also important to note that the current study examined uncertainty of rewarding outcomes, not ones featuring loss or threat. While loss and threat may be particularly relevant to dislike of uncertainty for some individuals, such as those high in anxiety (e.g., Grupe & Nitschke, 2013), we were interested in the aversive properties and effects on decision-making of uncertainty alone, even outside of threatening contexts. Future work should extend the current paradigm to investigate the effects of using losses, in addition to rewards, as uncertain outcomes. The current study also used a convenience sample of students as an initial step for investigating which traits are associated with waiting under uncertainty. The nature of this sample may have been associated with limited variability on some measures, such as the UWT and TCIP, as has been found in other work using similar measures (e.g., Caswell et al., 2015). Future work should extend this question to samples with clinically significant psychopathology to investigate whether the identified relations persist at more extreme levels of these traits.
The current study sought to investigate the phenomenon of being unwilling to wait in a state of uncertainty, even when it is the most rational, advantageous, and least risky course of action. Given the ubiquity of uncertain situations in everyday life, including those that require protracted waiting (e.g., exams, medical results, and emails), understanding which individuals are unwilling to wait is an important question. This is especially true in the context of psychopathology, where many individuals experience intense distress or make maladaptive decisions in uncertain waiting situations. This study aimed to elucidate individual differences that are associated with difficulty waiting in uncertainty, with the goal of better understanding maladaptive behavior in those at risk for psychopathology.
Footnotes
Acknowledgment
The authors would like to thank Dr. Christian Luhmann for his help with designing and programming the task.
Declaration of conflicting interests
The author(s) declared no potential conflicts of interest with respect to the research, authorship, and/or publication of this article.
Funding
The author(s) received no financial support for the research, authorship, and/or publication of this article.