
Abstract
Learning analytics aims at helping the students to attain their learning goals. The predictions in learning analytics are made to enhance the effectiveness of educational interferences. This study predicts student engagement at an early phase of a Virtual Learning Environment (VLE) course by analyzing data collected from consecutive years. The prediction model is developed using machine learning techniques applied to a subset of Open University Learning Analytics Dataset, provided by Open University (OU), Britain. The investigated data belongs to 7,775 students who attended social science courses for consecutive assessment years. The experiments are conducted with a reduced feature set to predict whether the students are highly or lowly engaged in the courses. The attributes indicating students' interaction with the VLE, their scores, and final results are the most contributing variables for the predictive analysis. Based on these variables, a reduced feature vector is constructed. The baseline used in the study is the linear regression model. The model’s best results showed 95% accurate, 95% precise, and 98% relevant results with the Random Forest classification algorithm. Early prediction’s relevant features are a subset of click activities, which provided a functional interface between the students and the VLE.
Keywords
Introduction
Information and Communication Technologies have revolutionized the education system with easily accessible, sustainable, low-cost models (Rice, 2013). Massive Open Online Course (MOOC) is one such model, which offers a significant learning pathway as it allows learners to learn at their own space and pace. The MOOC works together with top education institutions, charges a nominal fee or no fee, removes the admission barriers and offers a wide range of topics. MOOC is a new model of inclusive education (Dillahunt et al., 2014). Moreover, these platforms help students to bridge the gap between the skills they acquire from academia and the skills demanded by the industry. MOOCs provide a better flow of information and knowledge to the students (Chen et al., 2014; Sachdeva et al., 2015).
The major MOOC platforms, such as edX, Coursera, Harvard, etc., provide the students with video lectures and learning materials. Also, the students will get a certificate on the successful completion of the course. Despite the popularity of MOOCs, the rate of student dropout and low-performance indices are disappointing. Statistics show that less than 13% of students are only on track (Chen and Zhang, 2017). The lack of engagement and inability to trace materials and activities for the assessments are significant reasons for students’ disinterest in the courses (Holmes, 2018). Hence for the success of a course, student engagement is a valuable factor in web-based education systems (Ye and Biswas, 2014). Even if the online learning platform is referred to as a MOOC, it is assumed it is more of a hybrid that resembles a Virtual Learning Environment (VLE) with a completion certificate (Amantha Kumar and Al-Samarraie, 2019). Student engagement is virtually connected to student satisfaction and the quality of the student experience. It is essential to understand how the students interact with the VLE activities to reduce the dropout rate. An improved learning experience can inculcate motivation and self-regulation to adhere to the courses and score better. To provide better learning environments, one needs to understand the students, learn, and interact with the virtual learning environments. Student engagement is a significant factor in designing learning models and personalizing learning environments (Bouzenada et al., 2018; Hassan et al., 2019). The educational data evolution has inspired the research communities to do learning analytics to predict learners’ performance (Leitner et al., 2017; Shahiri and Husain, 2015; Casquero et al., 2016). The current study aims to predict student engagement using Open University Learning Analytics Dataset (OULAD), recorded by a VLE at Open University UK (Kuzilek et al., 2017).
Unlike the MOOC platforms, VLE allows the instructor to observe the student activities and assessments because VLEs are developed to advance the learners from passive to active (Ryan and Poole, 2019). The VLE logs the student interaction, and hence the instructor can understand the student behavior towards these learning environments. The data produced by these learning platforms have enabled sustainable data-driven decision-making, and the clickstream data can predict student involvement even at an early stage (Waheed et al., 2020). The dataset contains the demographic as well as the student interaction data with the VLE. As the data is stored in the vast data repository of Open University, it is tedious for anyone to apply traditional methodologies to analyze and generate useful information.
This study used classification techniques as the Machine Learning (ML) methods to develop a model to observe student interaction and predict student engagement in the VLE courses. Classification methods are widely used in learning analytics (Ahmad et al., 2015). The predictive model aims at identifying whether a student is highly or lowly engaged in the VLE and tries to explore the VLE activities affecting student engagement. The current work aims at developing a machine learning model to identify the learner’s engagement in their studies at an early stage of the course. This will help the educators to devise proper mechanism to improve the learner engagement. The work further explores an optimal set of factors which can predict the learner engagement accurately. Hence the current study is an enclosure of various terms associated with analyzing educational data, such as academic analytics, predictive analytics, and learning analytics. A recent term coined as ‘educational data science’ combines various researchers from different disciplines to work together on research interests related to educational data (Piety et al., 2014).
The rest of the paper is organized as follows: Section 2 discusses the recent studies related to prediction analytics, ML techniques, and factors affecting student engagement. Section 3 details the research questions and objectives. Section 4 briefs the dataset’s characteristics, and Section 5 explains the methodology, which involves data preprocessing and modeling. Section 6 briefly discusses the results of the experimentation. Section 7 concludes the paper with a discussion on future work.
Literature study
Predicting students’ performance helps the educators and learners improve the learning and teaching process, respectively (Kuzilek et al., 2015). Considerable research has been done to investigate student engagement in virtual learning systems. These studies are multifaceted and used various tools and techniques (Costa et al., 2017). Many studies used machine learning techniques to analyze student interaction with the learning environments to predict the students’ at-risk failure. The literature review aims at analyzing the publications based on various factors such as the machine learning techniques, student attributes, dimensionality reduction techniques, and the evaluation matrices, which are used to predict student engagement in virtual learning environments. The majority of works have used classification as the data mining technique for performing data analysis. Hussain et al. (2018) used the OULAD and proposed an approach to predict student engagement in the e-learning system. Among the seven classifiers (J48, JRIT, decision tree, gradient-boosted, naive-Bayes, and SVM) used for the study, the three classifiers J48, decision tree, and gradient-boosted classifiers have shown a better performance. The study concluded that student interaction with learning content and discussion forums is the most significant activity for predicting low engagement in a social science course. Another study contributed a similar solution to support the students to engage better with the learning environment (Hamid et al., 2018). This study found that Support Vector Machine and K-Nearest Neighbor had the best classification results.
Douglas and Alemanne (2007) studied student participation by comparing student effort and student success. They had introduced automated feedback mechanisms to students, instructors, and advisors in this study. Another study used students’ demographic data from OULAD to evaluate the interaction with VLE (Wolff et al., 2014). The predictions are made using KNN, CART, and Bayes network and found that the KNN and the Bayes Networks perform well with the reduced dataset. A work on university data used a decision tree to build a model that predicts students' performance by extracting knowledge in a time series manner (Baradwaj and Pal, 2011). It helps to identify early dropouts and the students who need special attention. A study comparing four decision tree algorithms concluded that the J48 algorithm is more accurate than other algorithms in identifying the weak students (Pandey and Sharma, 2013.)
Even though most of the works concentrate on classification models, clustering has also been used for predictive analytics. In a case study of the educational data mining process, an incremental semi-supervised fuzzy clustering algorithm is used for data stream classification (Casalino et al., 2019). The OULAD has been processed as a data stream to extract a classification model capable of predicting the students' outcomes. The proposed clustering algorithm can adapt to the new incoming data, and thus the classification model evolves. The results from the preliminary numerical study are promising. Apart from collecting data from an e-learning log, literature shows that analysis has been done on data from other sources as social media (Hassan et al., 2019). As the source varies, the student attributes under the study also differ. The largest-scale research is done on student engagement when watching videos using data from 6.9 million video sessions across four courses on the edX platform (Guo et al., 2014). The time spent watching the videos and students' responses towards the post-video-assessment is used to determine student engagement. The parameters like student gender, age, etc. are dependent and need to be controlled for assessing student engagement (Beer, 2010). A review conducted on student engagement presents the relationship between student participation and grades (Samson, 2015). This study concluded that student outcomes are related to student engagement, and the question answered correctly in the class. From 8-year data collected from 2006 to 2014, Ahmed et al. predicted undergraduate computer science students’ academic performance (Ahmad et al., 2015). They collected data on students’ demographics, previous academic records, and family background and built classification models for the predictive analysis.
Classifiers will give optimal results when the feature set used to train them are most acceptable. Depending upon the data collection method, the feature set is always enormous. Feature selection methods are used to select the relevant attributes to make the classification model more efficient. There are two main objectives for the feature selection process. The first is to maximize classification accuracy, and the second is dimensionality reduction. On comparing different feature selection algorithms, it has been found that Chi-Square and Euclidean distance are better to test the divergence from the distribution when the feature is independent of class values (Ladha and Deepa, 2011). The cost of entropy changes depending on the presence and absence of a parameter. The study briefs that Information Gain (IG) measures this change in entropy. When IG is high, then that parameter set is more suitable for further study. Correlation-based Feature Selection (CFS) methods are used when the feature needs to be searched is redundant (Khalid et al., 2014). CFS is considered to be the best feature selection subset as per the studies. The study examined different feature selection techniques to find the efficiency of these techniques based on its effect on a classifier’s accuracy. A research study on feature selection focused on the dimensionality reduction problem proposed an algorithm based on high dimensional model representation (Taşkın et al., 2017). The researchers compared the conventional feature selection algorithm in terms of accuracy, and the results showed that the proposed algorithm has high classification accuracy and robust features.
The data exploration is a challenging task, mainly due to the large search space. Various methods have been applied to solve feature selection problems, where evolutionary computation techniques have shown sole success (Xue et al., 2015). The study by Xue used a reinforcement learning algorithm to identify the relevant features. CFS selects the maximum appropriate feature and avoids redundancy (Naidu et al., 2014). The Hybrid Feature Selection (HFS) method adopts both filter and wrapper models of feature subset selection. It focuses on selecting a sub-feature set in which the selected features are coalitional and relevant to obtain better classification performance. The feature selection method’s effect depends on the feature selection algorithms (Chelvan and Perumal, 2017). The stability is based on the correction and cardinality intersection. Kendall Rank Correlation, Spearman’s Rank Correlation Coefficient (SRCC), and Pearson’s Correlation Coefficient (PCC) are the stability measures mentioned in this paper. Also, some critical feature selection methods such as One-R, Information Gain (IG), Symmetrical Uncertainty (SU), Gain Ratio (GR), Correlation-based Feature Selection (CFS) are applied to two datasets. It is concluded that there is no single feature selection algorithm that is universally effective for all the datasets.
Classification and prediction are two forms of data analysis used to extract models to predict future data trends (Shahana and Preeja, 2016). Classification algorithms’ performance can be evaluated using different metrics like speed, accuracy, and scalability (Bhavsar and Ganatra, 2012). The research shows that knowing the advantages and disadvantages of classifiers can be ensembled for higher performance. A significant difference is observed in the prediction accuracy when different classification models in educational data mining (EDM) are used together and evaluated the students’ academic performance in an educational institution (Ramaswami, 2014). For this study, five classifiers, such as J48, Naive Bayes, Neural Networks (NN), Decision tree, and Bayesian Net (BN), are considered. It is observed that predictive accuracy falls in the range of 40–92%.
The primary data mining method used in most of the studies is classification. Most of the research papers that have been analyzed are using the classification approach to model and predict student engagement and performance measures. In contrast, few research papers have used clustering and classification together. The commonly used data mining algorithms are Decision Trees, Naïve Bayes classifier, and ANN. The research papers discussing machine learning models on the VLE log concentrate on data collected from students undergoing the course at a particular period. The importance of temporality measures in learning analytics is highlighted in recent study (Saqr et al., 2019). So, the research can analyze data from different courses' durations to find the features affecting student engagement.
Research questions
This study aims to compare various machine learning approaches to predict student engagement in a virtual learning environment. The correctly predicted results can be used by the instructors to intervene in the learning process even at an early stage of the courses. The presence of too many model parameters and veracity in their characteristics makes it difficult for the models to do effective prediction (Hlioui et al., 2020; Li et al., 2020). Thus, the current work gives more importance to the factors which contribute more towards early prediction of engagement quotient in the VLE. Also, the study aims at finding the most suitable classifier which will work with the diversified, heterogenous data from the VLE log.
The research questions addressed in this work are:
RQ1: Which classifier gives optimal performance to predict student engagement in a VLE?
RQ2: What are the factors which contribute towards optimal student engagement prediction in a VLE?
Data description
The Open University Learning Analytics Dataset (OULAD) is used in this study to identify the engagement characteristics of students in a VLE (Kuzilek et al., 2017, 2018). This anonymized dataset comprises data about courses, students, and their interactions with Open University Virtual Learning Environment for seven selected courses (called modules). The dataset contains 22 module-presentations with 32,593 students registered with the Open University. The current study uses a subset of data corresponding to 7,775 students who attended the social science courses AAA, BBB, and CCC for the assessment periods 2013J and 2014J. There are three categories of student data available in the OULAD, such as student demographic, performance, and learning behaviors. The dataset is comprised of different tables, as shown in Figure 1. OULAD structure.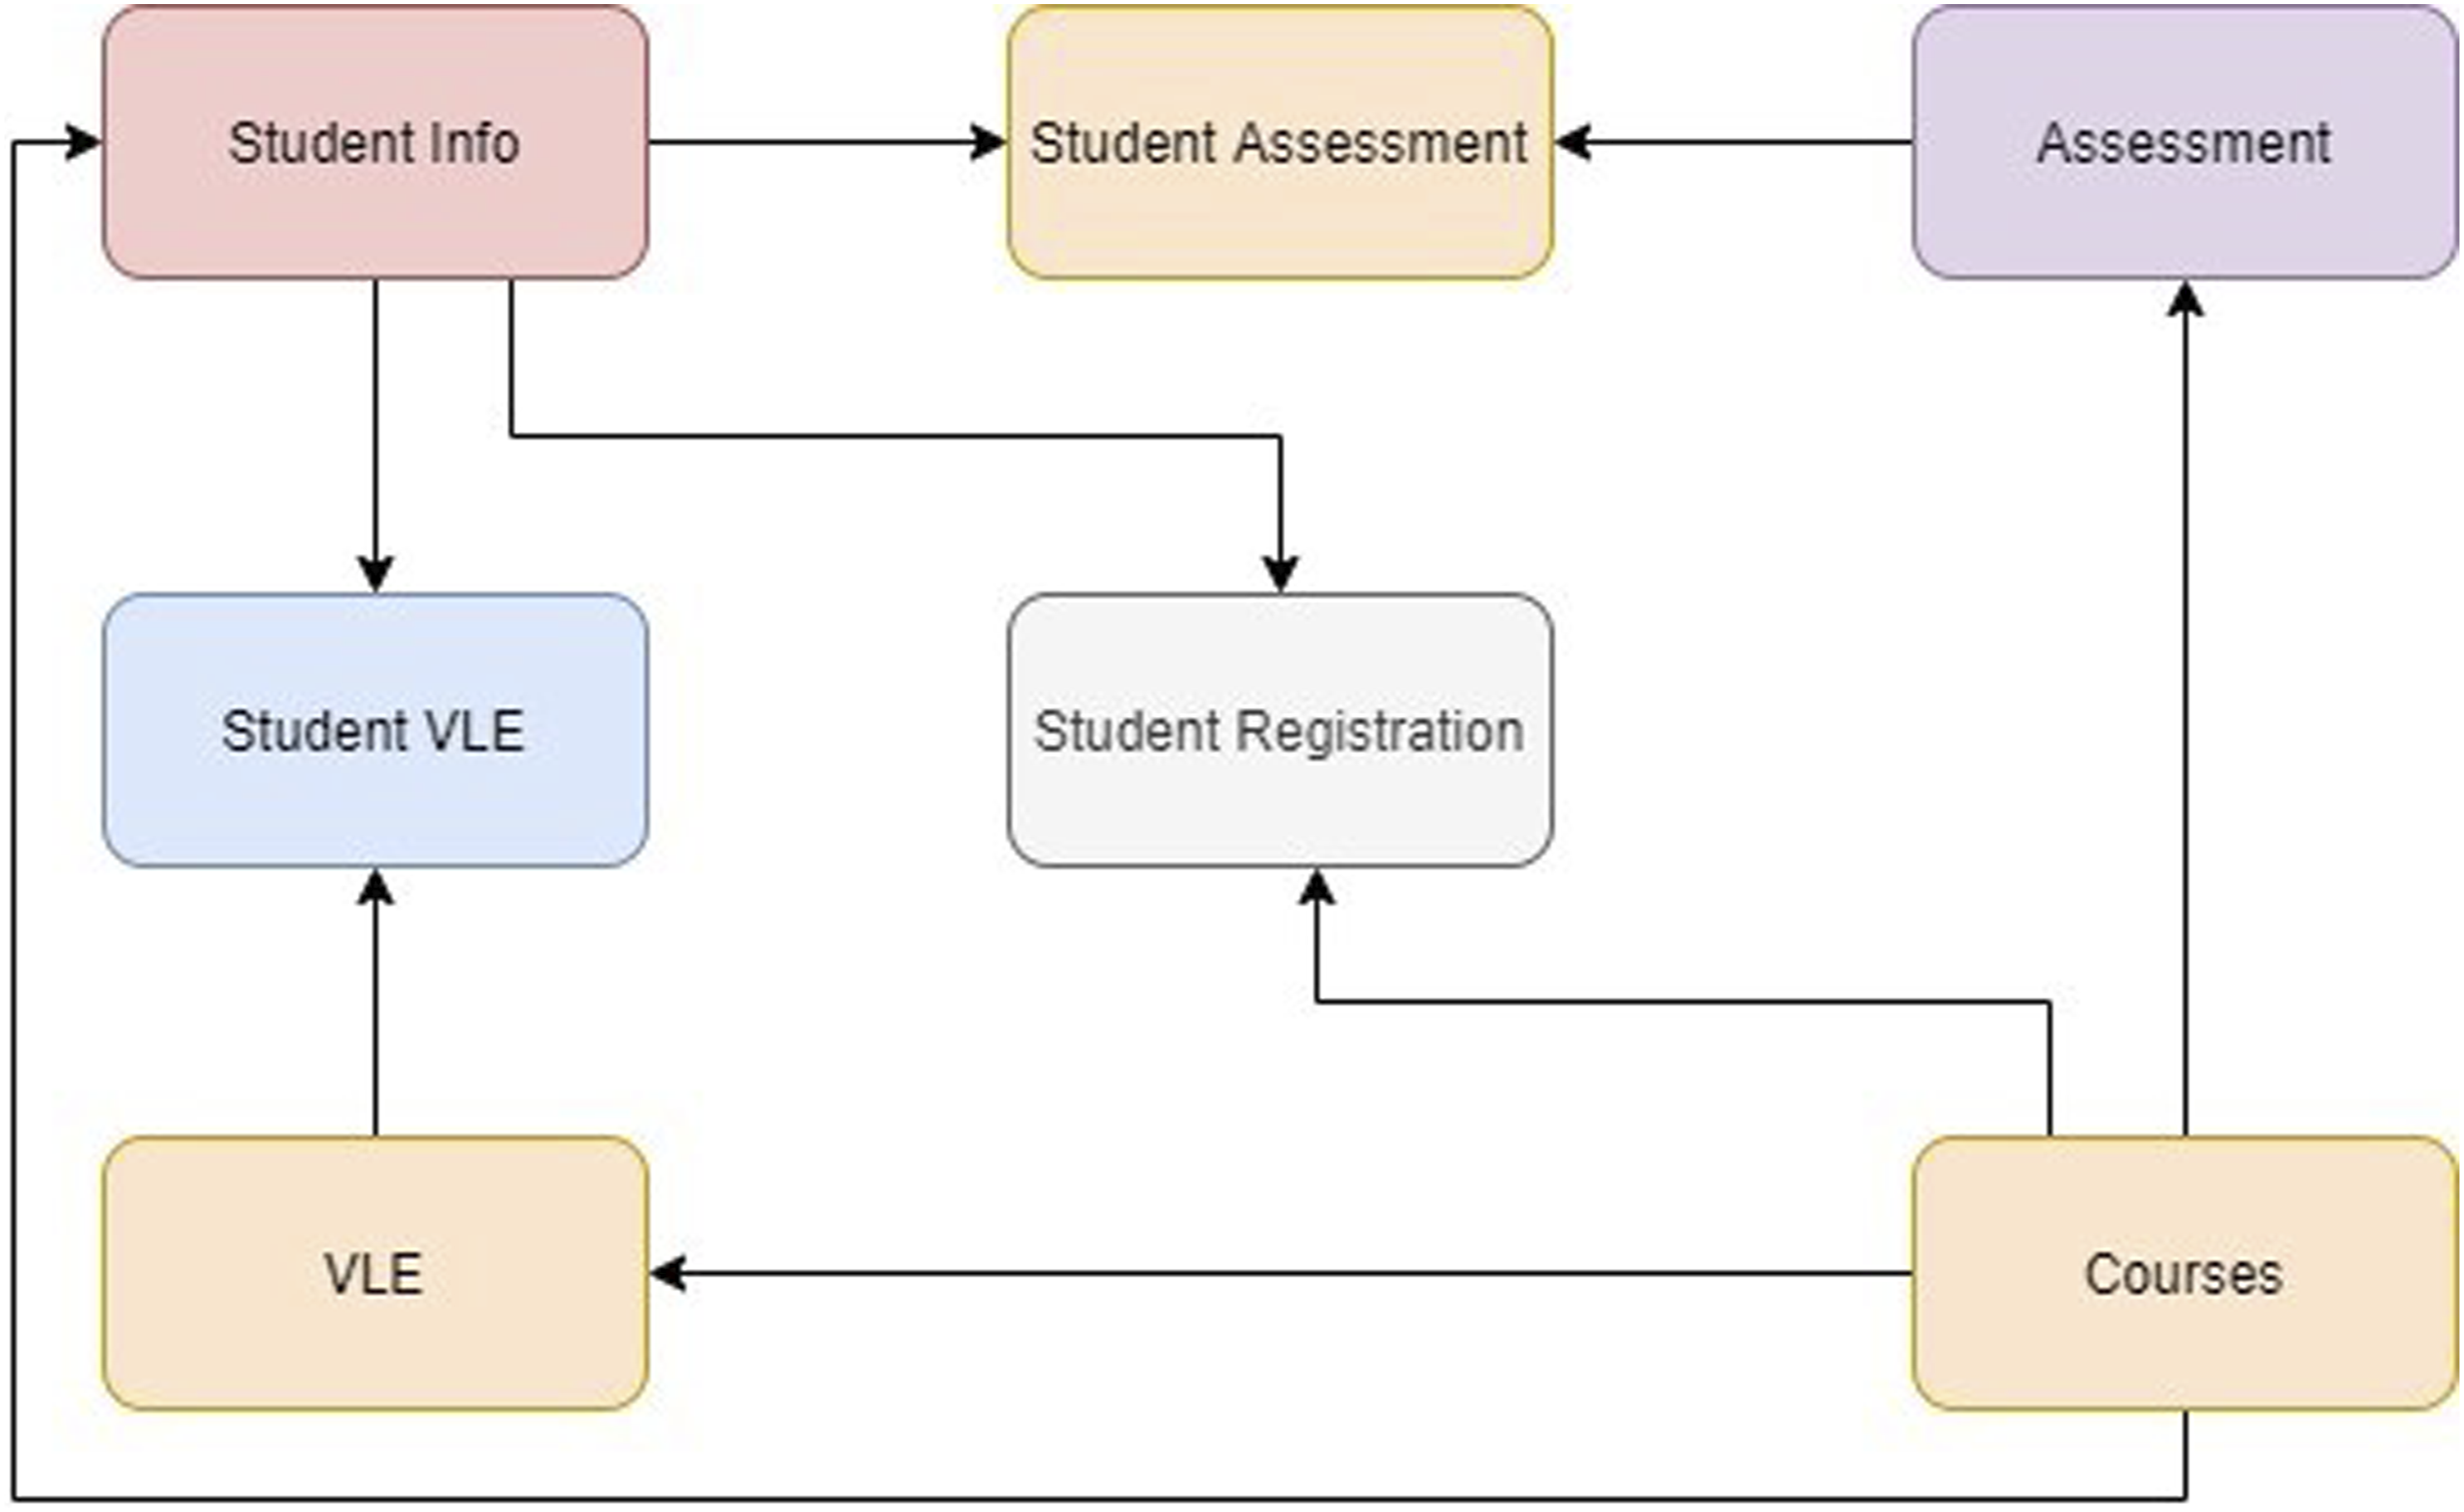
The seven tables in the dataset are StudentInfo, StudentAssessment, Assessment, StudentVLE, StudentRegistration, VLE, and Courses. These tables are available as seven CSV files (Kuzilek et al., 2017). The relational schema of the tables is shown in Figure 1. The dataset contains demographics, registration, assessment, and VLE interaction data of the students. The learner performance, which is found in the assessment table is classified into four classes: distinction, pass, fail and withdrawn. Learner performance reflects the results and achievements of each learner during the course duration. The current study focuses on the degree of student engagement using the VLE interaction data. The students’ interaction data consists of 20 different activities namely; dataplus, dualpane, externalquiz, folder, forumng, glossary, homepage, htmlactivity, oucollaborate, oucontent, ouelluminate, ouwiki, page, questionnaire, quiz, repeatactivity, resource, sharedsubpage, subpage and url. The activities indicate specific behaviour of the learners in the learning environment, counted in terms of the clicks, for e.g. number of clicks on the questionnaires stored as questionnaire.
For the current predictive research, the authors considered the assessment and VLE interaction data corresponding to each student for AAA, BBB, and CCC courses.
Methodology
This study aims to develop an optimal predictive model to classify students based on engagement in a VLE. The student data is the input, and the model is expected to predict whether a student is highly or lowly engaged. The proposed architecture for predictive analysis is represented in Figure 2. The proposed framework for predicting student engagement.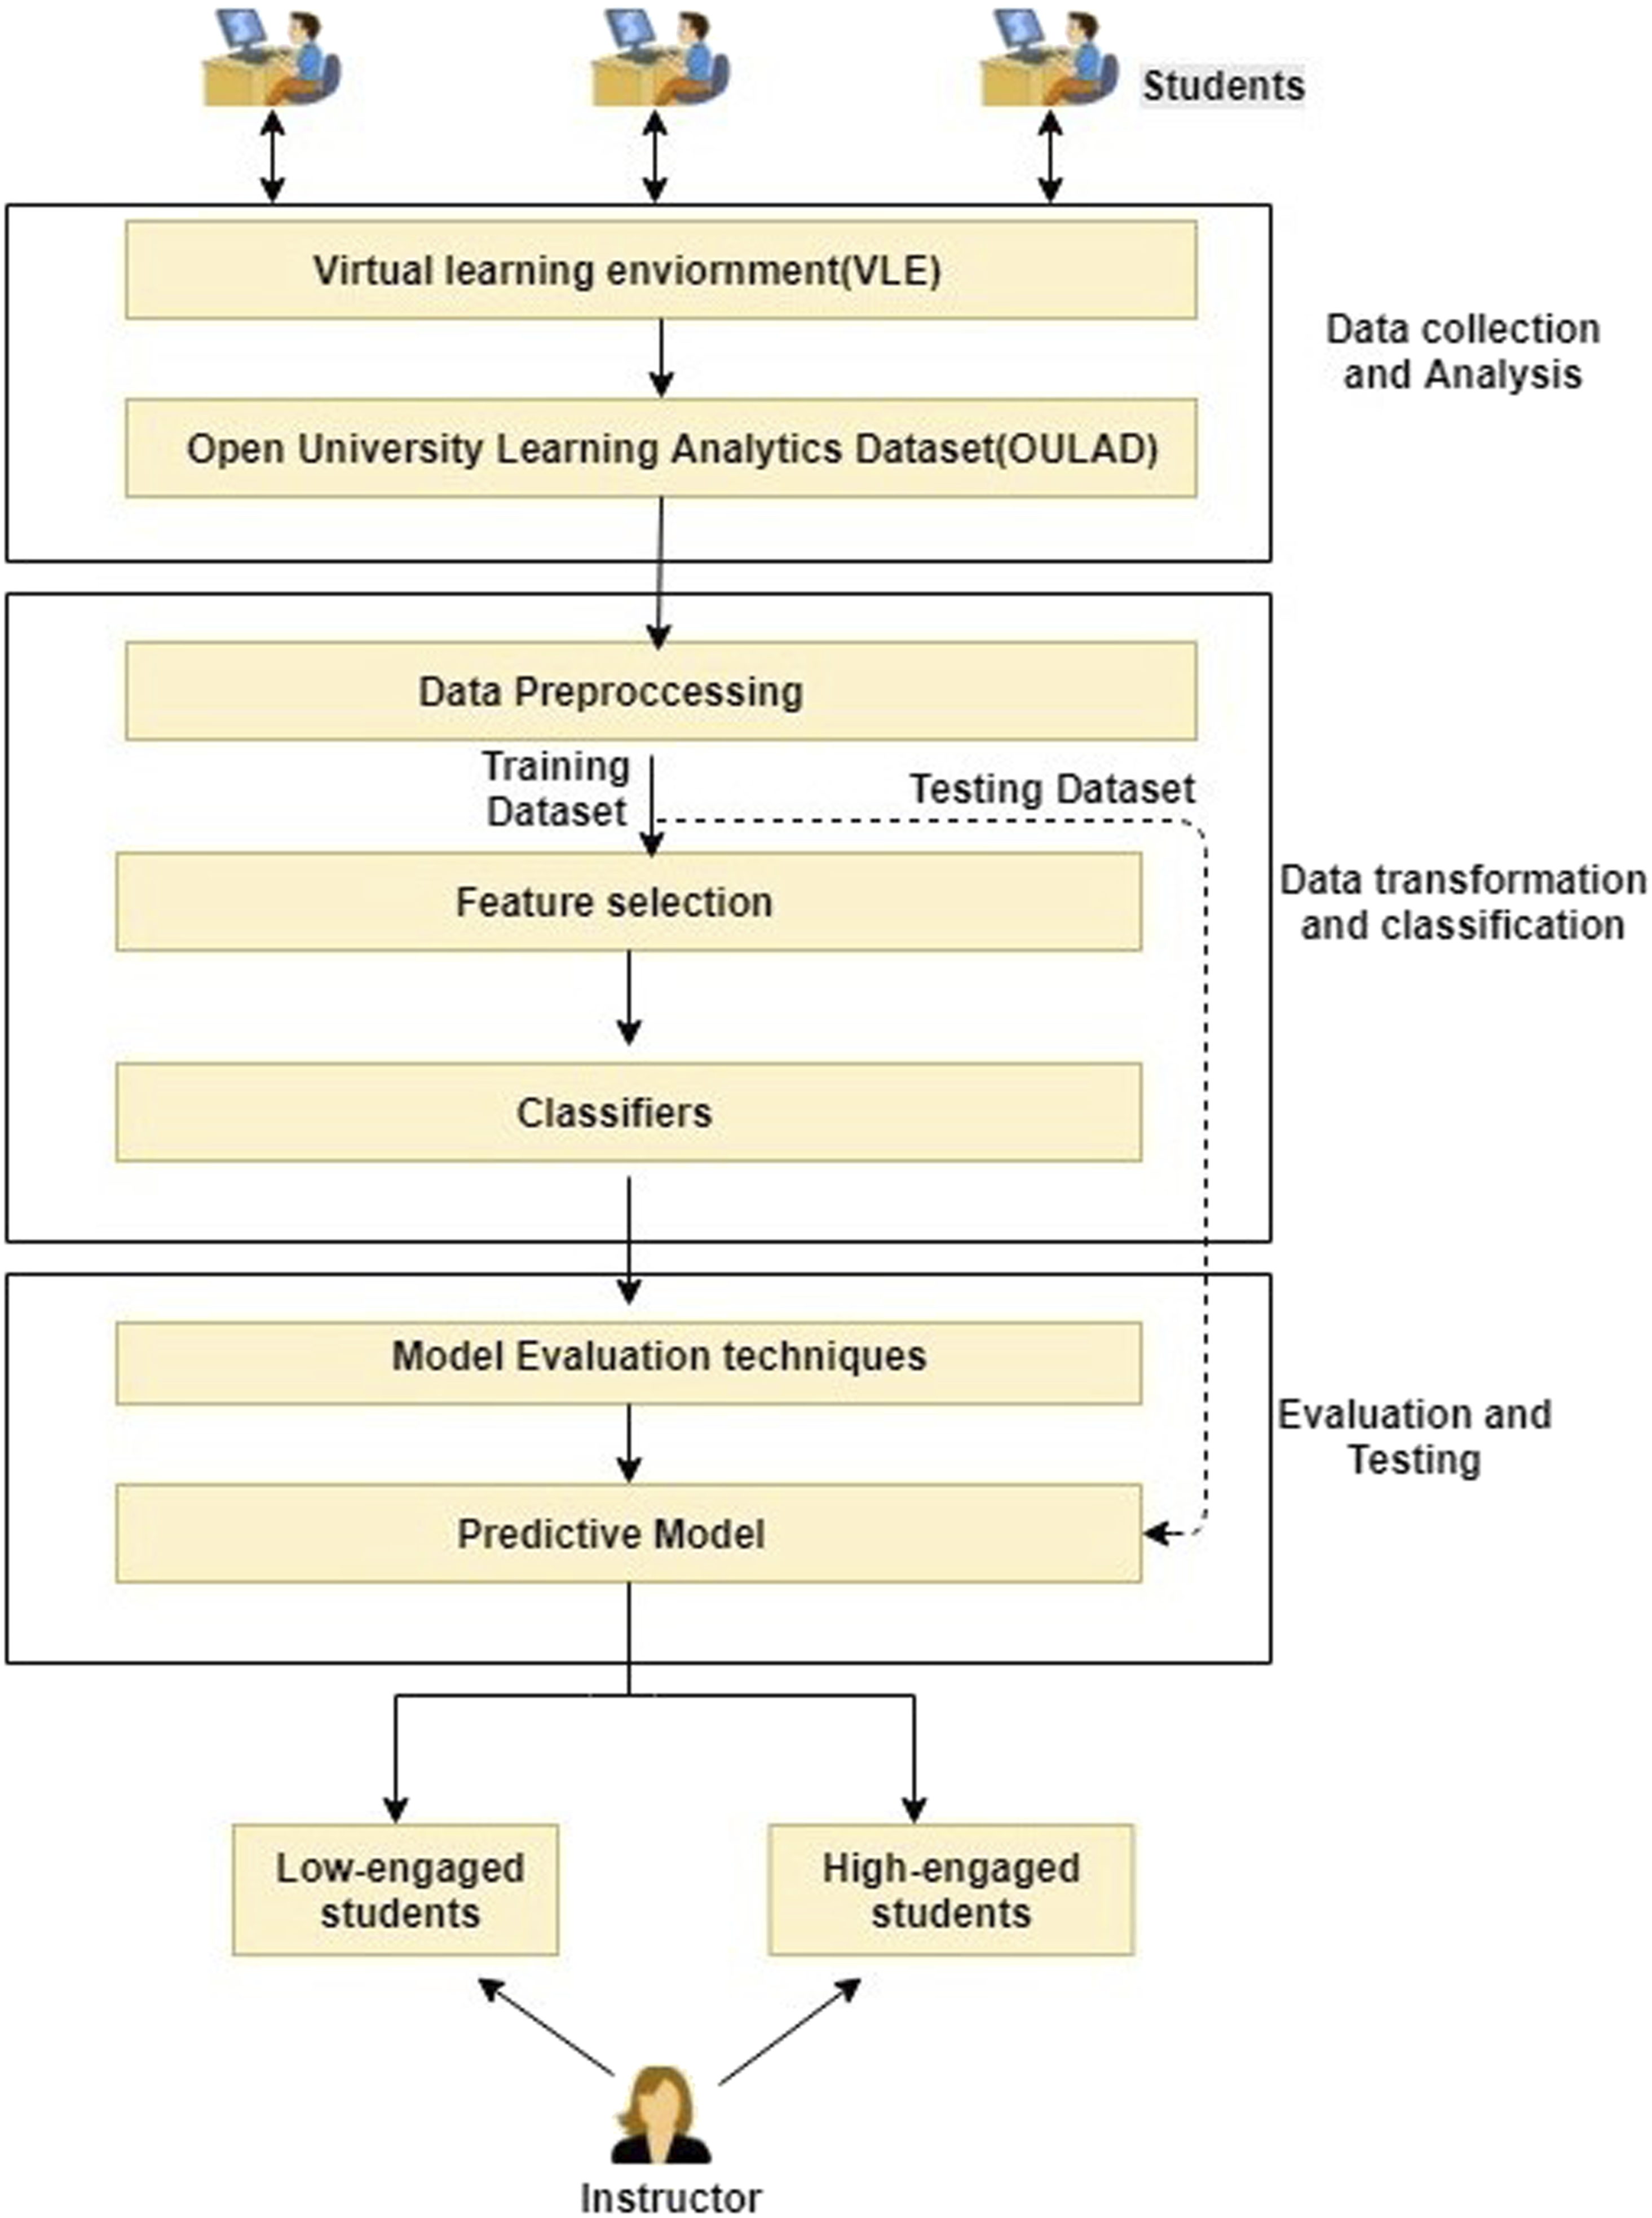
Data pre-processing
The OULAD is available as a set of seven relational tables. The data in this form cannot be directly given as input to any machine learning algorithm. These relational tables are first transformed into a dataset that is compatible with machine learning processing. This study’s input features are obtained from different tables, and these attributes are joined to form a single dataset. A subset of the dataset with code_presentation 2013J and 2014J is selected for further experimentation. Each row of the resulting dataset is the student ID, and each column index is the student’s features. The missing attribute values are filled with a zero, assuming that the student has not logged in to those activities.
After studying the features obtained from the dataset, it is found out that many of them are undesirable in this study, as they are not affecting student engagement. These unnecessary attributes are dropped at the early stage of preprocessing, which eventually can ease the predictive model’s development. The current study aims to find the factors contributing to predicting learners' engagement in a virtual learning engagement. It can be envisioned as high or low involvement. Studies show that a highly engaged student will actively interact with the learning environment (Hussain et al., 2018). In OULAD, different activity types are quantified based on student interaction. The attribute responsible for that is the total_number_of_VLE_clicks, which counts the learner’s total number of times accessed the VLE. But, there are possibilities that the student clicks on interfaces other than VLE during the session. So, the number of clicks alone cannot be taken as an indicator of learner engagement.
The relationship between student engagement and performance in online learning platform is identified and quantified in an earlier study (Rajabalee et al., 2020). Three parameters are used by the authors to measure the student engagement as (1) count of activities which are completed (2) importance of these activities with respect to course outcome (3) activities which require active platform interaction. The paper positions that there is a significant relationship between the learner’s engagement and the academic performance. That is, highly active learners also tend to score high. The study also states that if the continuous learning activities are considered then the correlation between student performance and engagement is observed to be strong. The scores corresponding to intermediate assessments and final results are available with OULAD. The final scores and average of all mid evaluations can be considered as factors for predicting the student engagement along with the total_number_of_VLE_clicks. The number of clicks is a strong measure of student interaction with the virtual learning environment. Student retention is a significant factor indicating engagement. So, the data of students with final_results marked as “Withdrawn” are not considered for this study.
Another desirable feature available with OULAD, highest_education, the learners' qualifications before registering with the course on OU, also can contribute towards predicting the students’ engagement. Thus, the attributes contributing to student engagement are total_number_of_VLE_clicks, assessment_scores, final_results, and highest_education. To understand these attributes' effect on student engagement, the authors have carried out a correlation study among the four variables stated above. Since the assessment score is a multi-valued variable, the values' average is taken and named as the score.
Correlation analysis of click data with other features.
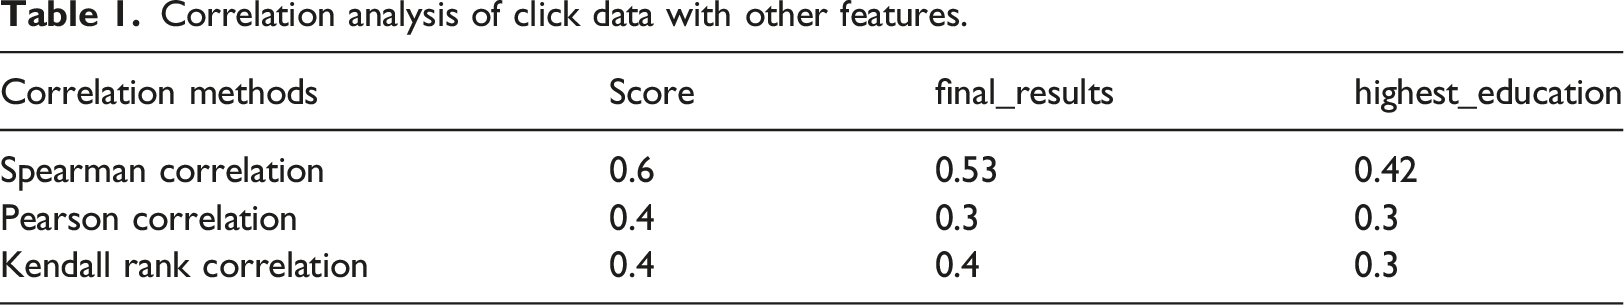
The correlation study report shows that the highest_education is least correlated with student interaction with VLE. Thus, it can be omitted from the current research, and the total_number_of_VLE_clicks, assessment_score, and final_results are the selected features. Each row in the dataset belongs to a student, which is uniquely identified using Student_Id. Each Student_Id is annotated as high_engaged and low_engaged based on the following student engagement definition. The results of the correlation study are visualized in Figure 3 below. The correlation of click data corresponding to VLE activities with other features.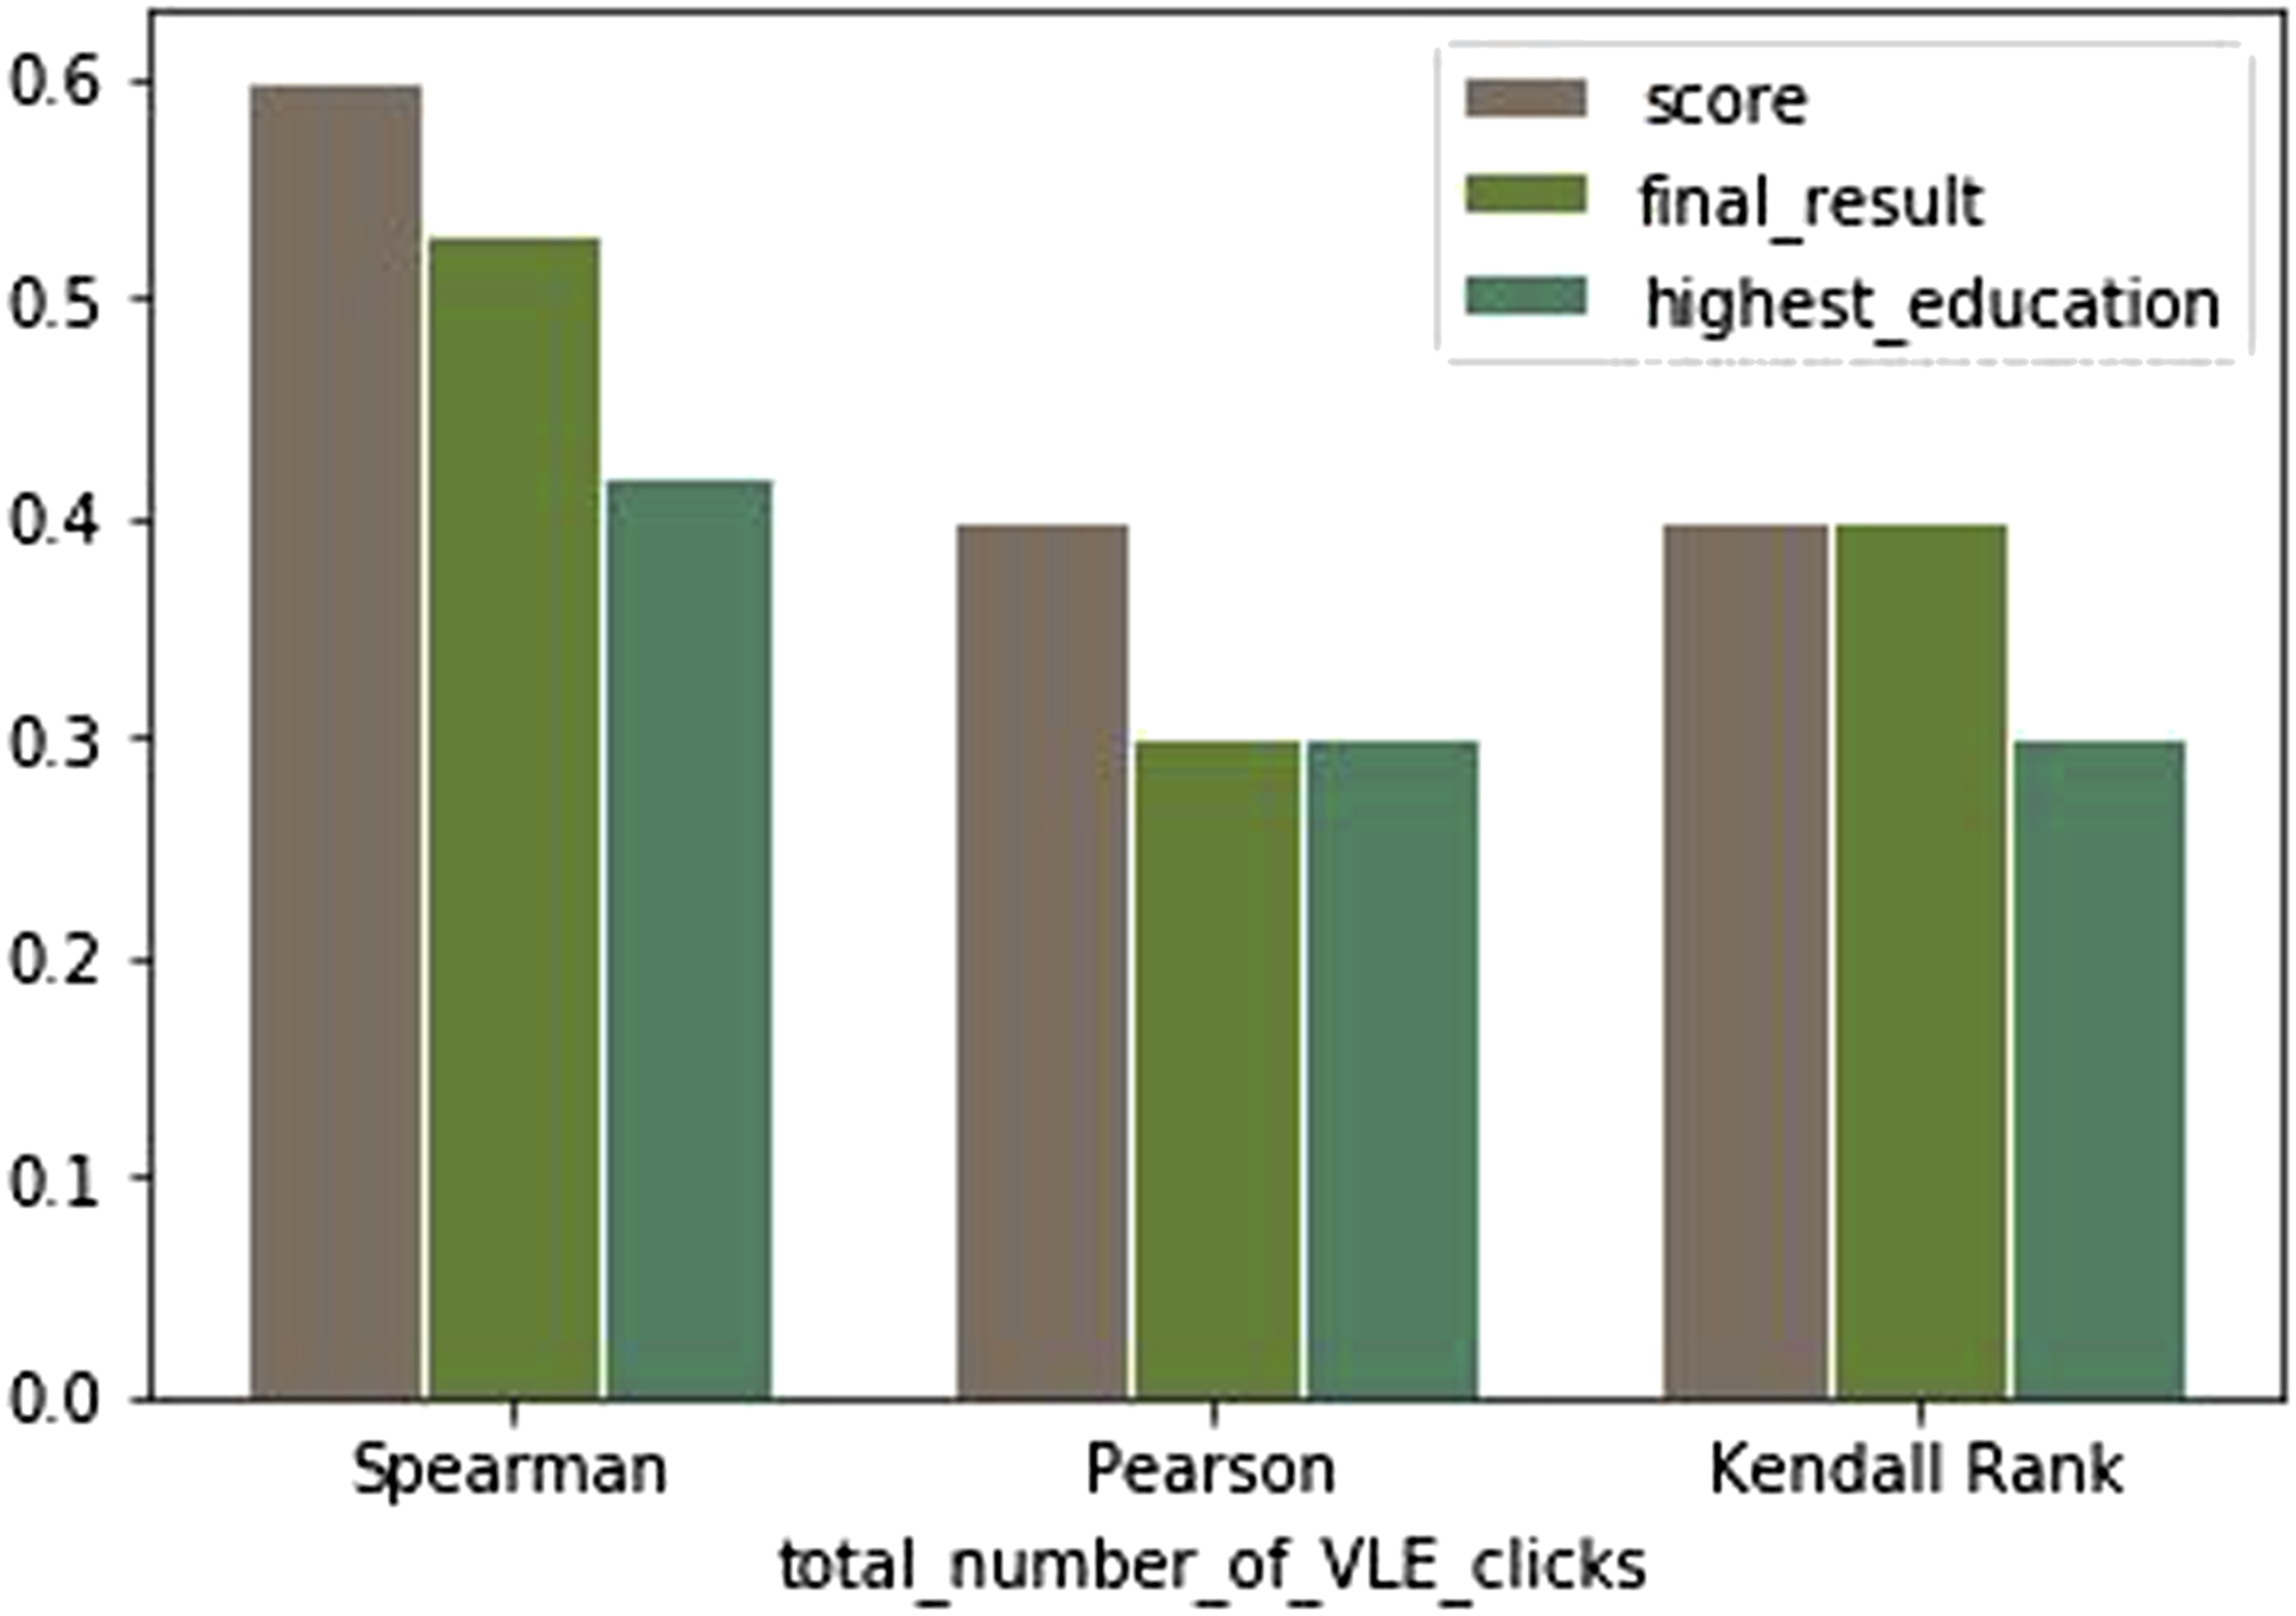
Consider T, the set of students with the total_number_of_VLE_clicks ≥ the average number of clicks by N students, F as the set of students with final_results = pass, and S as the set of students where the score ≥ 80%. If X is a student and X ∈ T ∪ F ∪ S, then X is annotated as high_engaged. Otherwise, X is labeled as low_engaged.
The feature selection is made on the dataset to get a reduced one, using the following step-by-step approach. 1. Select all the unique Student_Id as the first column. 2. For each Student_Id a. Find the sum of all the total_number_of_VLE_clicks and append to the corresponding Student_Id as the second column. b. Find the average of all assessment_scores and append it as the third column. c. Read the final_results and append as the fourth column. d. Construct the fifth column as student_engagement = {high_engaged, low_engaged} and label according to the student engagement definition.
The features describing each student in the dataset are StudentId, total_number_of_VLE_clicks, assessment_scores, final_results, and student_engagement. Here the total_number_of_VLE_clicks is the summation of the clicks from all VLE activities. The VLE activities is a superset that includes dataplus, forumng, glossary, oucontent, oucollaborate, resource, subpage, homepage, and URL.
To develop a predictive model, one needs training and testing data. Here researchers used python techniques to divide the dataset into 80% of training data and 20% testing data.
Modelling
The prediction of student engagement in learning environments is a challenging task. The data preprocessing step started with raw OULAD and ended up in a refined and reduced dataset used to develop a predictive model. This study’s classification algorithms are Decision Tree, Logistic Regression, Random Forest, and KNN. These classification methods are selected due to their acceptance. The researchers in educational data mining have positively used them, and they have obtained a high-performance model using these algorithms (Tomasevic et al., 2020). The Decision Tree is a commonly used classification algorithm that can be applied on educational data for deriving student behavior patterns (Priyam et al., 2013). Decision tree is a binary tree like structure where each interior nodes represents parametric values and leaf nodes represents the supervised classes. The Decision Tree algorithm requires less data cleaning than some other modeling techniques and is not influenced by outliers and missing values. In the Logistic Regression method, the outcome calculates the predicted probability of the mutually exclusive event occurring based on multiple external factors, unlike the regression models. Random Forest is an ensemble classifier, where result from more than one decision trees are combined. Random Forest needs huge training data and comparatively slower than decision trees. KNN assumes that similar things always have proximity. So, that explains the diversity of algorithms chosen for building the predictive model. Researchers have implemented these algorithms using Python libraries. The packages used are sklearn, Numpy and Pandas. The classifiers are allowed to learn from 80% of the dataset, named as the student training dataset.
Evaluation metrics
The evaluation matrices used in this study are Accuracy, Precision, and Recall. Accuracy is the ratio of the number of correct predictions and the total number of predictions. But when dealing with a prediction problem with a binary outcome, the overall ratio should include the number of predictions that were falsely classified positive and falsely classified negatively. Thus, the equation for calculating accuracy can be stated as,
Accuracy =
TP: The prediction is positive and it is true. Here, the students is engaged is the positive result. TP means the classifier correctly predicted that the student is engaged in the VLE.
TN: The prediction is negative and it is true. Here, the student is not showing engagement and the model predicts that, then the case is counted as TN.
FP: The prediction is positive but it is false. For instance, if the system predicts a student as an engaged learner and in reality, he is not engaged, then that is a case of FP.
FN: The prediction is negative and it is false. An engaged student is predicted as a non-engaged student, then the case is counted as FN.
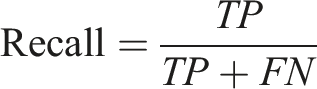
Further, for evaluating the relevance of obtained results, Precision and Recall are used in this study. Precision answers how many selected items are relevant, and recall is how many relevant items are determined by the model. Precision is the ratio of TPs and actual results, whereas recall is the ratio of TPs and predicted results.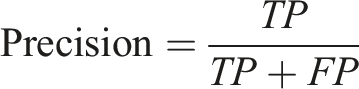
Results
The study aims to build a model to predict whether a student is highly or lowly engaged in a virtual learning environment. Towards the study, a subset of the OULAD dataset is taken, and the features are selected using correlation measurement. The dataset is prepared by extracting and merging different columns from seven tables available as OULAD. Each row in the resultant dataset corresponds to a student. The rows are then annotated as highly or lowly engaged students by considering the assessment score as explained in the data preprocessing section. The correlation between assessment scores during the course time and final scores with engagement is already established (Rajabalee et al., 2020). The prediction models are developed using four classification algorithms discussed earlier. Here, the researchers have implemented 80:20 rule for evaluating the classification algorithms. Eighty percent of the data is used for training these models. The models are tested using the remaining 20% of the data and evaluated using the three-evaluation metrics discussed earlier in this paper. The experimentations are performed to answer the research questions. The linear regression model is used as the baseline model in the present study. The baseline model exhibits an accuracy of 88% in the predictive analysis with 86.4% precision and 79.5% recall in the current experimental setup.
Optimal classification algorithm
This subsection deals with finding the answer to the first RQ: Which classifier gives optimal performance to predict student engagement in a VLE?
Performance of algorithms.
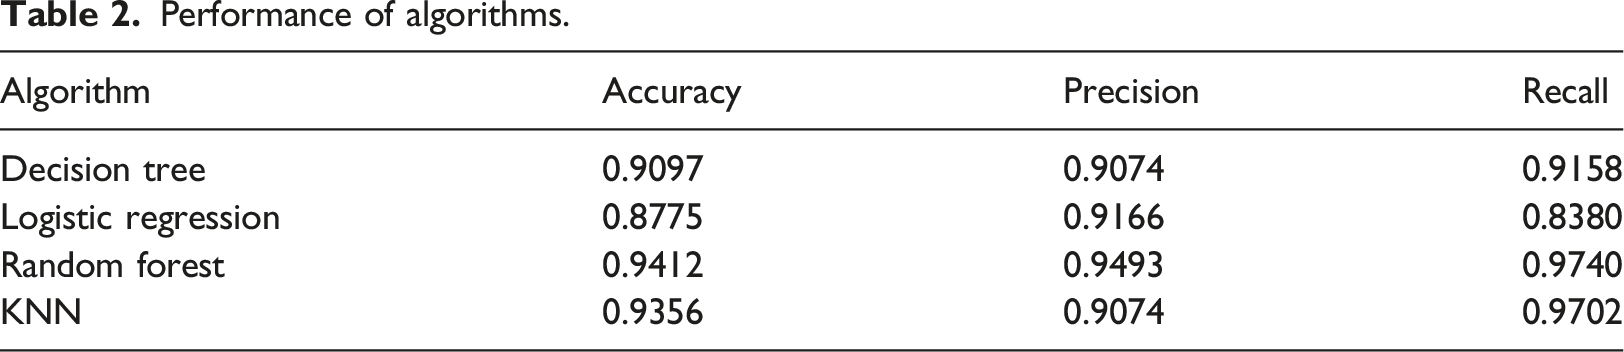
In this experimental format, the Random Forest algorithm performs well than the other classification algorithms. Compared with the other models, Random Forest is an ensemble model, each tree in the Random Forest gives out output, and the class with the most votes become the model’s prediction. Random Forest algorithm gives 94.1% accurate classification. The 94.93% is the precision of the classifier and it shows best recall of 97.4%. For the current problem of identifying low-engaged students, the recall performance of classifier is very important. Recall shows how many relevant classifications are done. If most of the low-engaged students can be identified at an earlier stage, then it will benefit the teaching/learning process. The Random Forest classifier is observed to obtain 97.4% of total low-engaged students in the current experimental setup. The performance of Random Forest is an indication that the feature set under study possesses good predictive power.
Optimal feature set
This subsection tries to address the second RQ. What are the factors which contribute towards optimal student engagement prediction in a VLE?
The first experimentation for getting an optimal algorithm to construct a predictive model for student engagement level in a VLE is executed and found that Random Forest performs better than the other algorithms. The feature vector used in the first experiment consisted of assessment scores, final results, and students' clicks on VLE activities (dataplus, forumng, glossary, oucontent, oucollaborate, resource, subpage, homepage, and URL). Further data exploration studies are conducted in the dataset to reduce the feature vector. A correlation study based on the Spearman Correlation method is undertaken between the score with sum_click of each VLE activity. Figure 4 shows the relationship between the score and VLE activities in terms of clicks. The linear relationship of score and sum_click.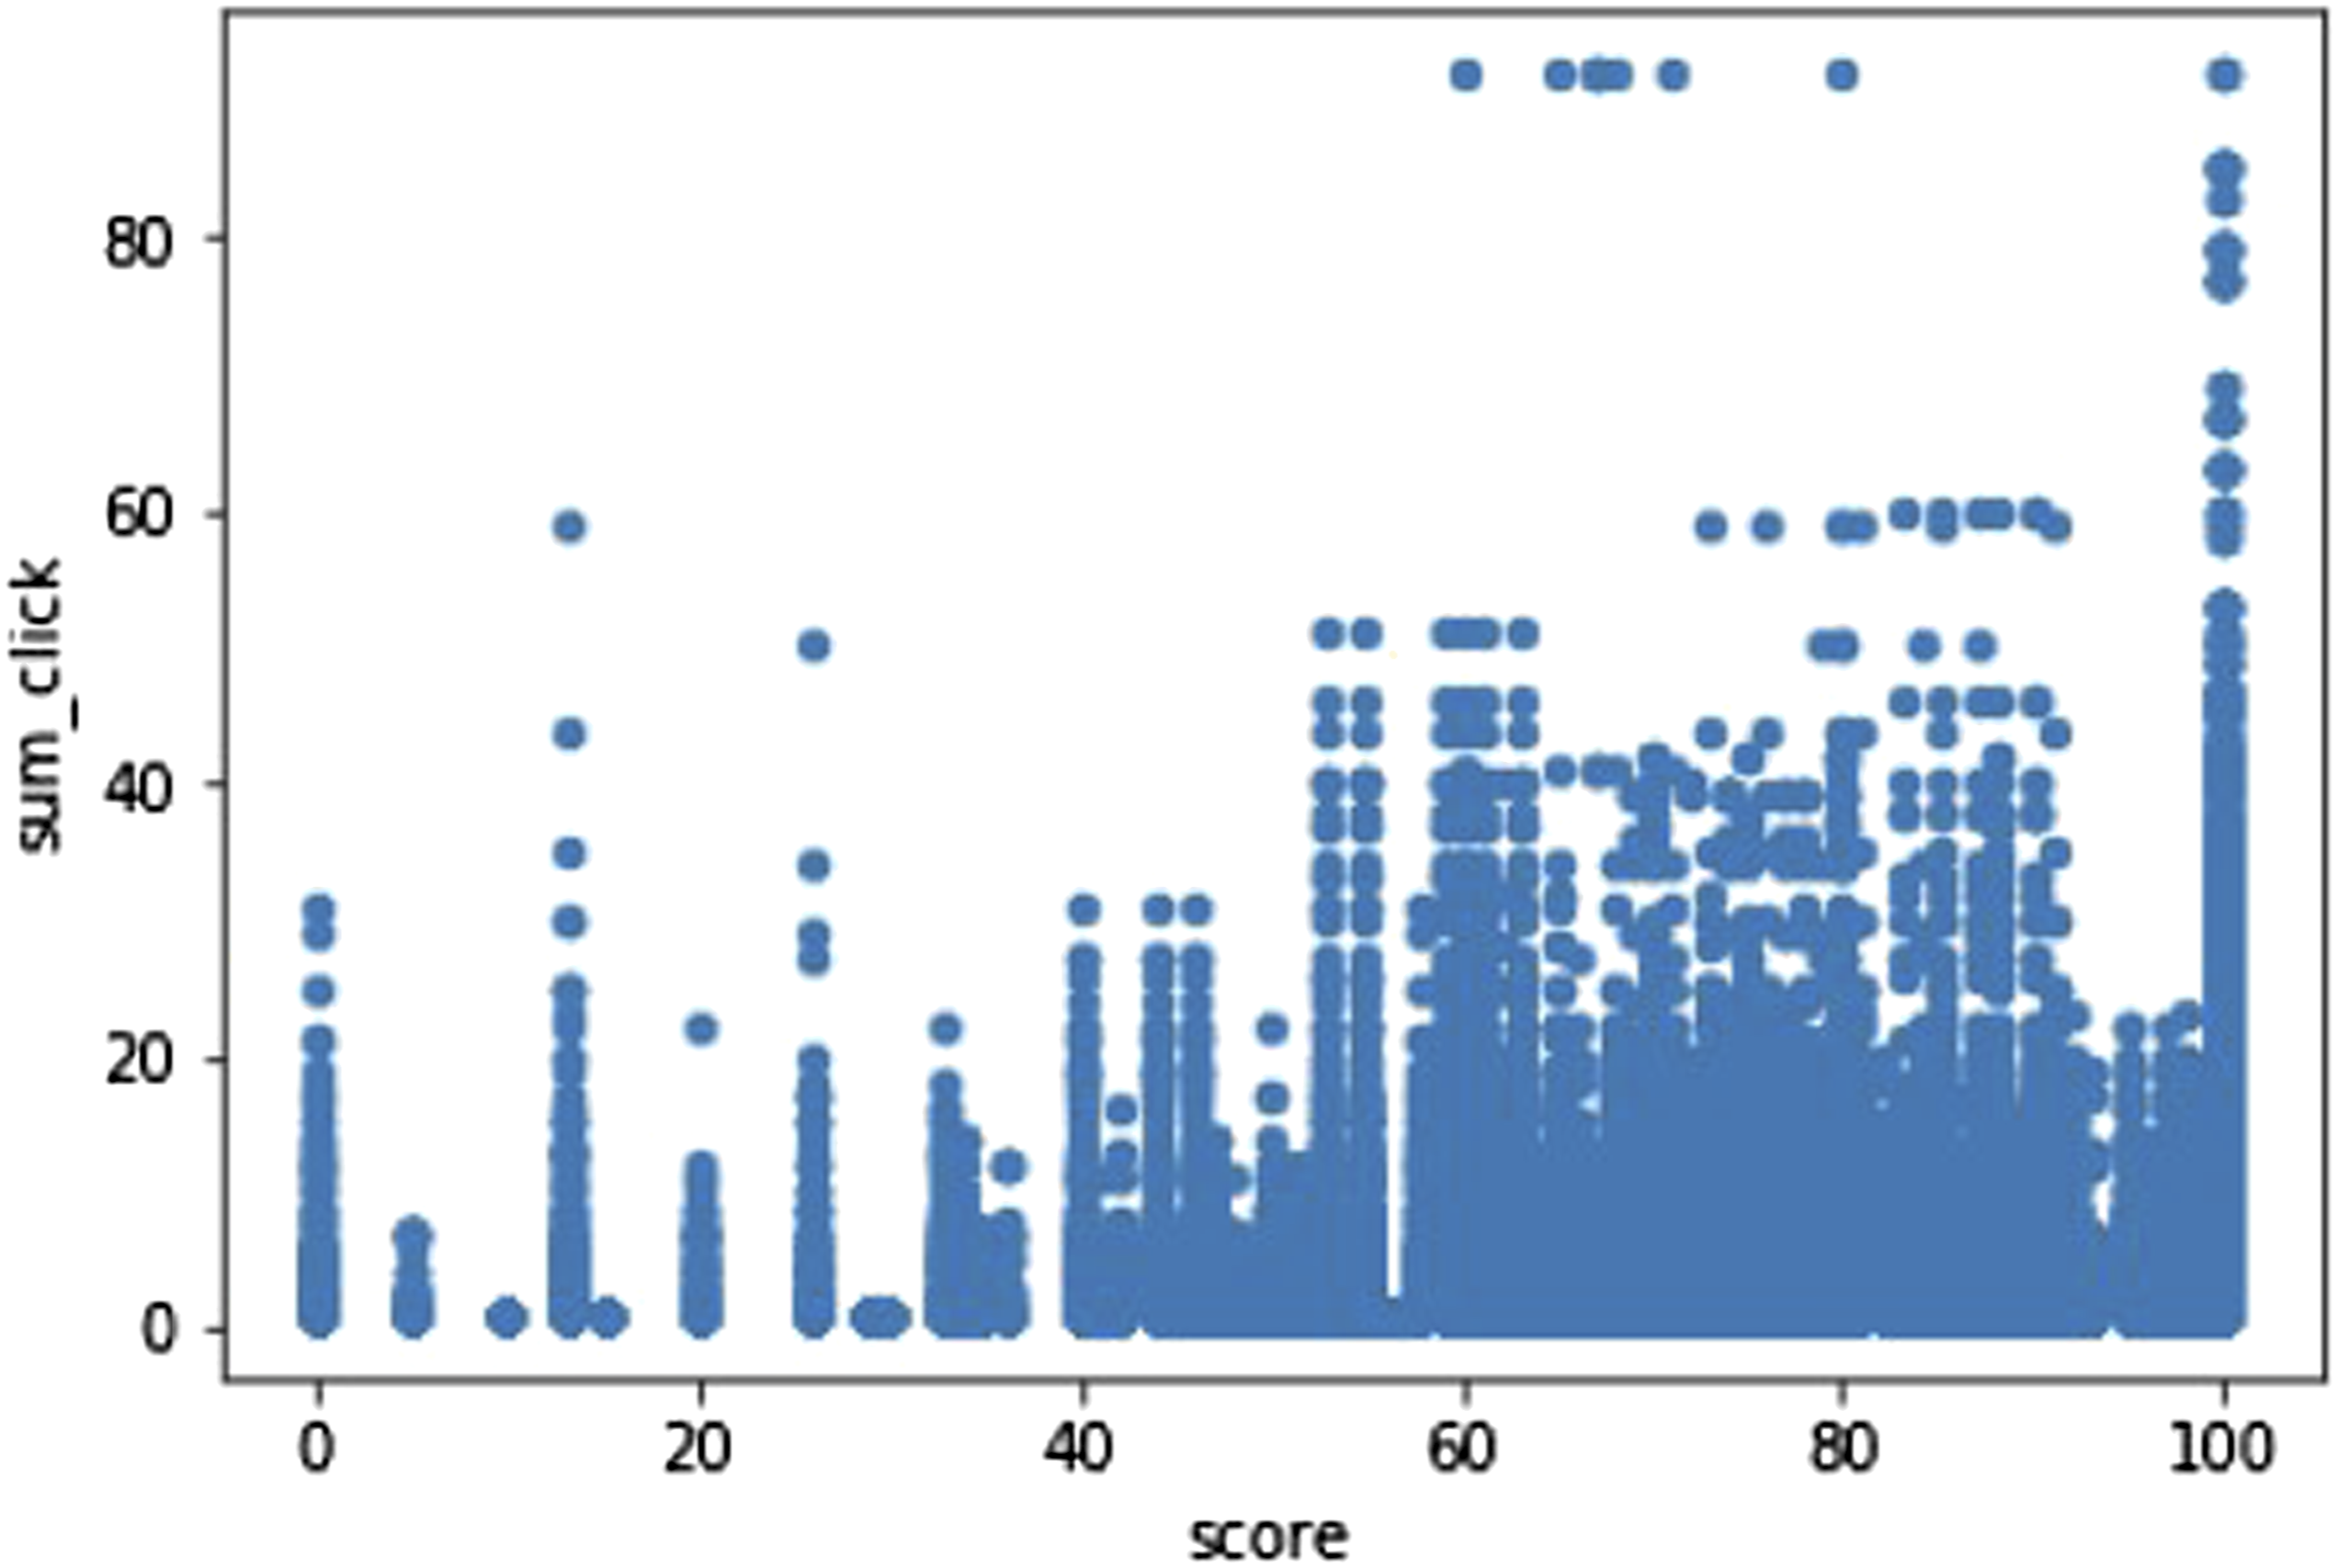
The result indicates that scores and sum_clicks are linearly related and shows that engagement is positively correlated with assessment scores. Also, the final scores and the highest education level are positively correlated with sum_clicks. The Correlation coefficient(r) is visualized in Figure 5, where the x-axis is the sum_click and other features in the y-axis. The correlation coefficient between sum_click and other features based on the Spearman Correlation Method.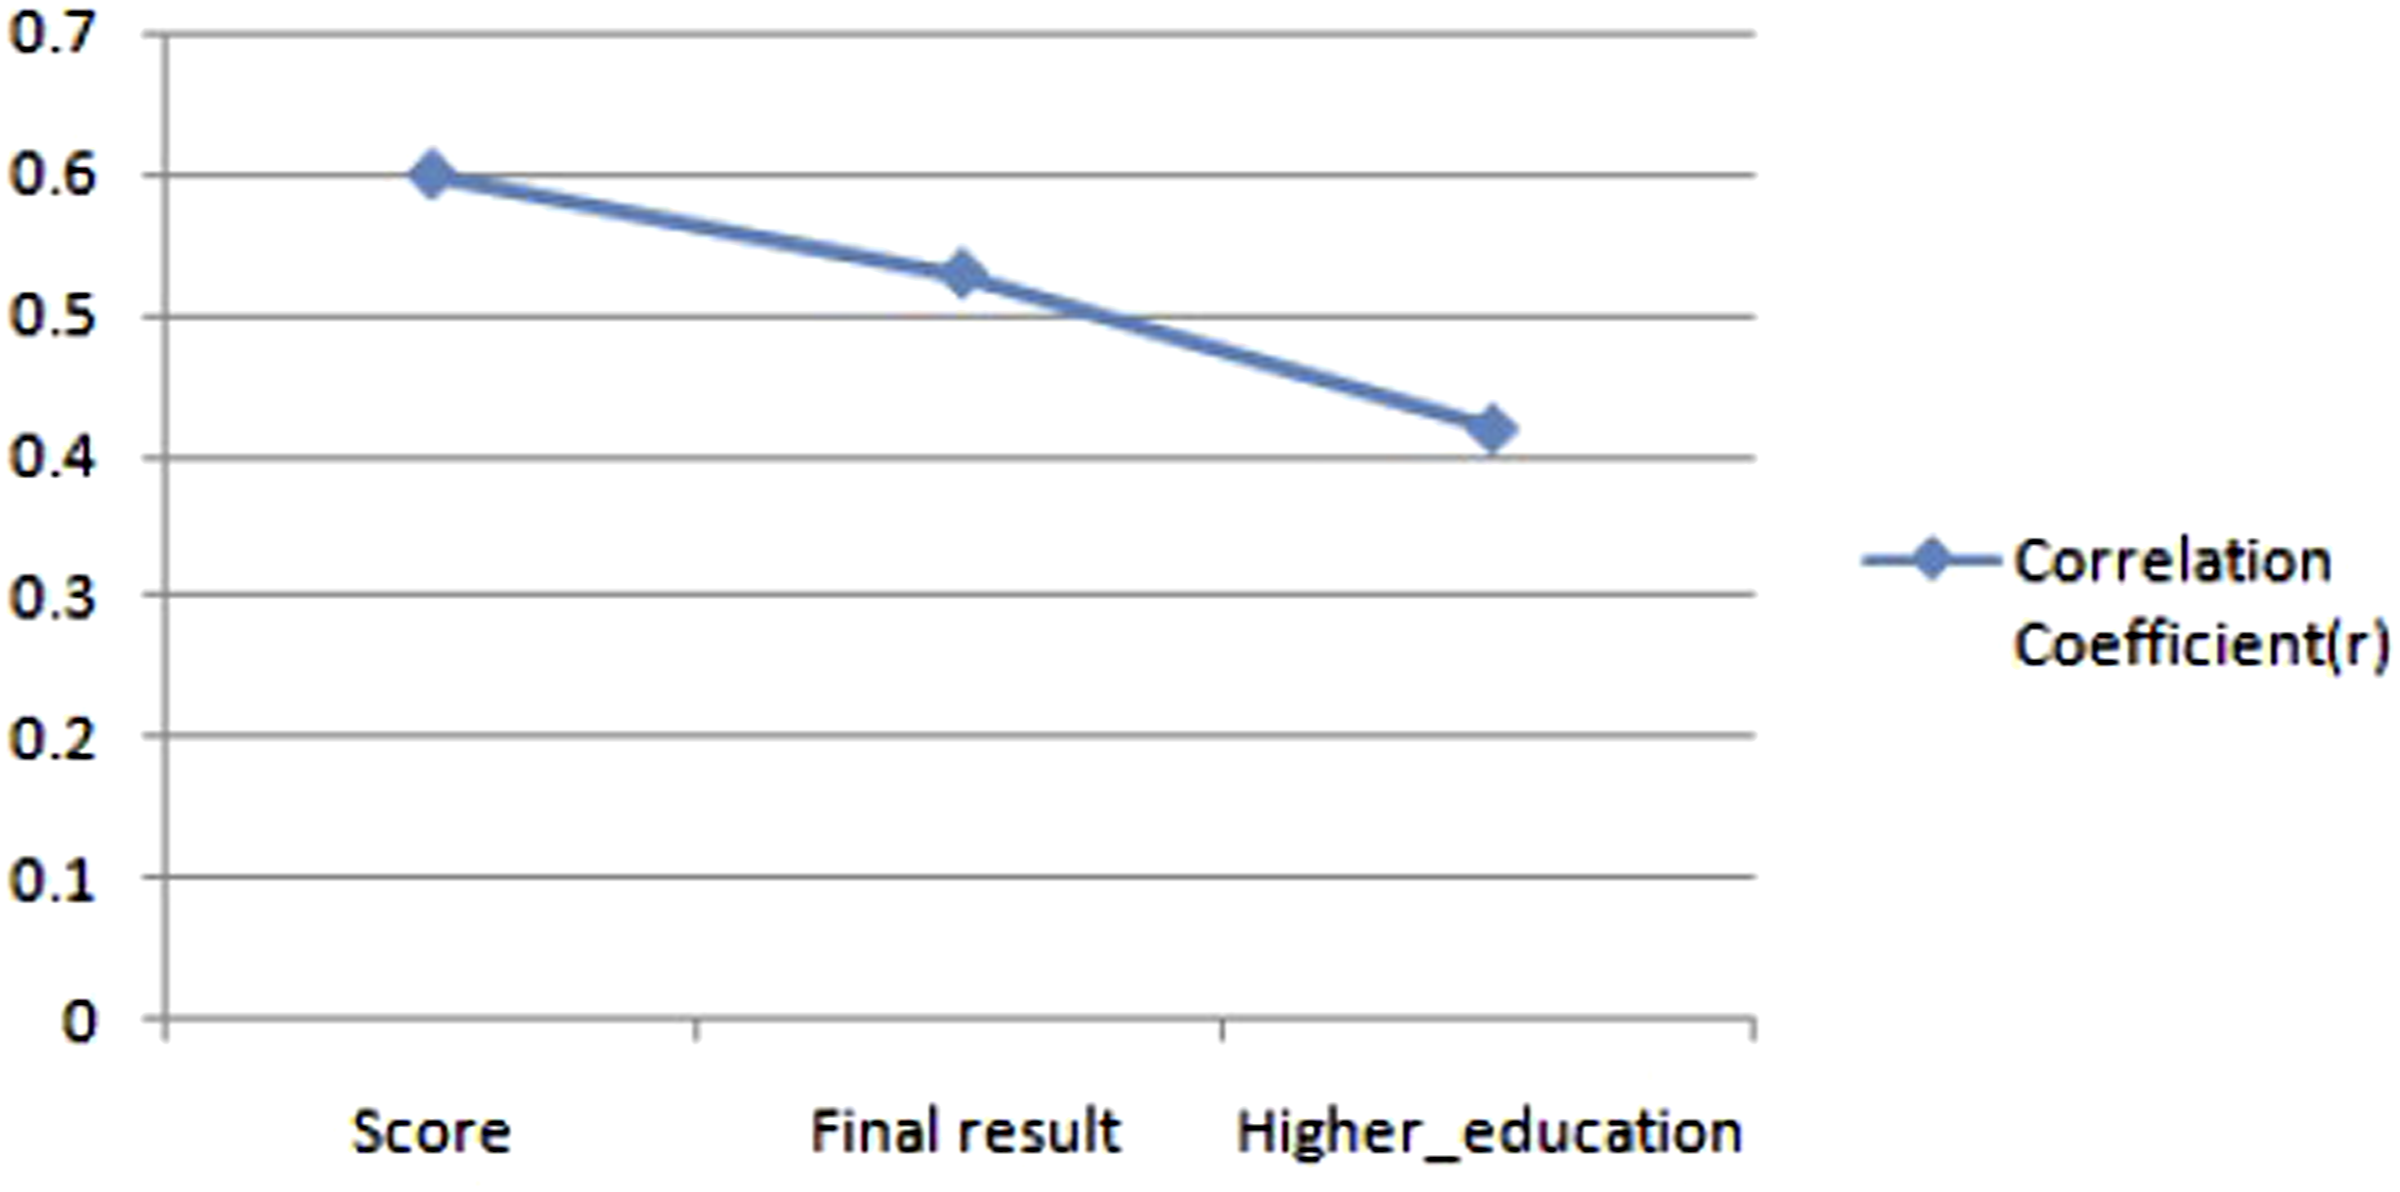
From this result, it is understood that the scores and education levels are linearly related to the VLE activities. If the features are diversified, the classification algorithm will give better outcomes. The above results show that the VLE activities alone are a powerful indicator of student engagement. The VLE activities are dataplus, forumng, glossary, oucontent, oucollaborate, resource, subpage, homepage, and URL. Further, a study is conducted to know each of these features’ influence on the total number of clicks by calculating the percentage of the total count of each VLE activity clicks with total VLE clicks. That is, if v is a VLE activity, then influence(v) = sum of clicks (v)/sum of all VLE activity clicks.
Performance of algorithms with a reduced feature set.
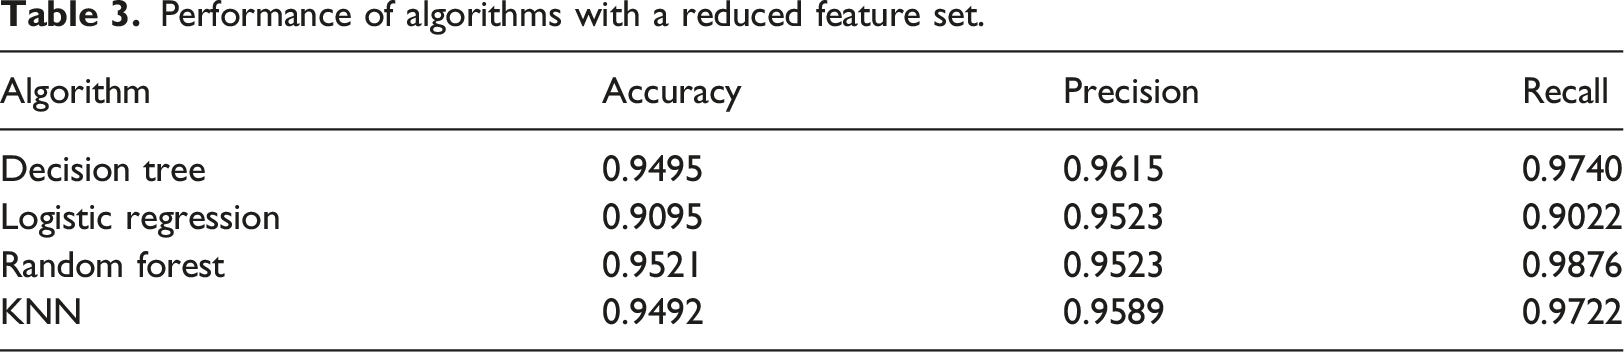
From the analysis, it is observed that the algorithm learned better with the set of diversified features. In this experiment also, the Random Forest algorithm performed better than others. And it is also evident that all the models improved the performance. Hence, the second research question’s answer is the VLE activities, homepage, oucontent, subpage, URL, and forumng.
Discussion
The new-age virtual learning environments give prominence to student engagement to improve student performance and lower dropout rates. The digital settings changed the aspects of engagement measure itself (Bergdahl and Nouri, 2020). The current study focuses on the technology-mediated assessment of student engagement. As the results show, the prominent features that help predict student engagement are the students’ VLE activity data, which describes how they interact with the environment. The subset of activities that show more promising results is student interaction with homepage, oucontent, subpage, URL, and forumng. The observation obtained here is in-line with the earlier studies on OULAD and similar datasets (Peach et al., 2019; Waheed et al., 2020). It is observed that a high-engaged student interacted with these activities more when compared with a low-engaged student. Also, the authors could establish a correlation between scores and the click data of these activities. So, the interaction with these activities can be used to predict at-risk students. The recall is the primary metric considered in identifying low-engaged students, whereas accuracy is used to weigh the model’s performance in predicting high-engaged students. It is observed by Costa et al. (2017), that the techniques analyzed are effective in identifying students’ academic failures early. The study concluded as a decision tree algorithm is observed to produce better classification results. But, when we experimented with different machine learning algorithms, the Random Forest model showed better understanding in predictive analysis. The authors trust that tree aggregation models can estimate more complex patterns than traditional ones, reflecting in the results (Biau et al., 2016).
Limitations of the study
The effect estimated in the current model use mainly the learner’s interaction data and assessment scores. The demographics data is not considered in this study, as the present study concentrates on the effect of learner’s interaction with the learning environment. So, the results might be biased towards activity-related features. The research is done in an Open University dataset that dates back to 2014 and 2015. Due to the high popularity of the dataset in the research community, the same is used in this study also (Li et al., 2020). As this is a preliminary study to know the most influencing factors determining student engagement, OULA dataset is used here.
Conclusion and future work
Predicting the students’ engagement in a class is significant in e-learning systems as it allows the instructor to know how the student participates in different activities. Besides this, student engagement prediction is beneficial for improving recommender systems’ performance in adaptive learning environments. The current study addresses research questions to find the optimal ML algorithm to predict student engagement and understand the optimal features contributing to the prediction. The present study used a subset of Open University Learning Analytics Dataset corresponding to 7,775 students who attended the social science courses in 2013 and 2014. Random Forest is found to be the optimal classifier in the current experimental setup. The prominent features are VLE activities, especially the student interaction with the homepage, the learning contents, subpage navigation, exploring different URLs, and participation in forums.
The study exhibits a strong correlation between learners' interactive actions with the VLE and the scores. Also, it is observed that the more active they are in the early phases, they could achieve their learning outcomes. Instructors can use this knowledge about the engagement of students with the environment for designing better scaffolding systems, and learners can use the knowledge to keep a track of their self-regulatory learning skills. Better personalized and adaptive environments can be designed using these predictive analytics.
This data-driven study mainly analyses the assessment scores and VLE activities of the students. As a future study, we plan to include other factors contributing to students’ engagement analytics in VLE, as their learning styles, characteristics of learning contents, and students' response to assessments and assignments. Then the resultant dataset can be used to observe the relationship between engagement and dropout rate of students in virtual learning environments. For any MOOC running on virtual platforms, a better understanding of students and improving their learning experience can result in better scores and lesser dropouts.
Footnotes
Declaration of conflicting interests
The author(s) declared no potential conflicts of interest with respect to the research, authorship, and/or publication of this article.
Funding
The author(s) received no financial support for the research, authorship, and/or publication of this article.