
Abstract
Digital technology in education has become a staple of many contemporary classrooms. Educational technology offers many benefits, including access to knowledge, mobility, multiple means of engagement, accessibility, distance learning, as well as the ability to connect in unprecedented ways. There is a growing body of research that examines digital learning tools, online classroom environments, learning management systems and other technologies that are integrated into the learning process. Such research extends to analysing the positive impacts of online and blended learning; however, few studies explore the user preferences of the learners. Without assessment of the user preference, the benefits of learning through technology are often lessened. This research explores and analyses how user media preferences influence engagement and motivation in online learning. One hundred twenty-two KS3 (13-year-olds) secondary school were provided voluntary access to a purpose-built online learning resource that augmented their in-class Holocaust history curriculum with learning materials in audio, video and e-text. Data were collected through web analytics and user feedback forms. The analytical tools provided detailed quantitative data on user activity on the site, while the feedback forms yielded qualitative data on usefulness and enjoyment. Results provided insights on the usage trends and user preferences that influence engagement. These behavioural patterns reflect user motivation and learning preferences and can be utilised to personalise digital content delivery to increase engagement with online learning materials.
Introduction
The purpose of this research is to explore the student user-experience and media preferences in an online learning environment. There is strong evidence that student engagement influences academic achievement (Lei et al., 2018). In addition, it is important to understand the target audience to make informed decisions about selecting engaging content and appropriate technological tools. ‘What students do when they learn, and how they understand learning, are important considerations if we want to improve teaching and learning. Conceptions of learning affect students’ approaches to learning, which in turn affect their learning outcomes’ (Makoe, 2008).
For the purposes of this study, the term ‘technology’ is used for digital systems (software and hardware), and Technology in Education (TIE) refers to technology designed explicitly for, or adapted to, the process of learning.
The past four decades have witnessed a paradigm shift in education. At the centre of this change is technology as it simplifies, redefines and offers convenient and accessible ways to learn compared to traditional methods. Students use computers to do their research (Henderson et al., 2015). Educators have employed a variety of TIE tools such as videos (Henderson et al., 2015), podcasts (Lai and Savage, 2013), blogs (Garcia et al., 2013), e-text (Sun and Flores, 2013) allowing for greater flexibility, choice of content as well as how and where learning takes place (Lumpkin et al., 2015). Technology has been proven to be extremely powerful for learning, often redefining the ways people learn.
The benefits of learning through technology have resulted in significant investment in the implementation of TIE (Latif, 2017). ‘Forecasts suggest that the education software market will amass worldwide revenues of around 7.9 billion US dollars in 2020. Should this forecast hold, it would represent a year-on-year growth of over 100 million dollars. Estimates suggest that this trend of strong growth will continue for years to come, reaching 8.3 billion dollars by 2023’ (Lui, 2020). The US State and Federal governments invested billions of dollars into educational technologies (Herold, 2016; Johnston, 2018). Members of the European Union have committed millions of euros for the integration of digital solutions (European Commission/EACEA/Eurydice, 2019; Radulovikj, 2020). Other developed nations are also jumping onboard. For example, Turkey has invested eight billion dollars into integrating technology into instructional activities in classrooms (Hemphill et al., 2015). Countries in the developing world are starting to explore and integrate TIE. Malaysia opened the Open University of Malaysia that caters to learners in remote regions and to those who cannot attend live lectures through m-learning (Njagi et al., 2015). Researchers from developing nations in the Middle East (Izadpanah and Alavi, 2016), Asia (Joan, 2013) and Africa (Adeyemo et al., 2013; Mtebe and Raisamo, 2014; Bachore, 2015) are calling for their respective nations to invest more into TIE. Finally, due to the effects of the coronavirus pandemic, schools globally have been relying more heavily on TIE and technology (Gyimah, 2020).
Because TIE is a relatively new phenomenon, it is still a developing industry. There are many tools implemented for different purposes with various degrees of usefulness (Lai and Savage, 2013). Researchers and institutions often employ TIE without a full understanding of best practices or gauging the needs of the users. The overinflated perception of technological benefits and availability of funds leads to technological ‘arms race’ among learning institutions that want to be perceived as technologically cutting-edge to attract more students. The unfortunate result is that administrative pressure and sales pitches (Coskun et al., 2017) often result in poor implementation. TIE offers excellent tools for learning, but it requires a well thought-out design and proper implementation (Cifuentes et al., 2015). Educational tools should focus on user-centred design to provide a more meaningful learning experience (Giacumo and Conley, 2015), and to do so we need to understand the needs and goals of the users (Eller et al., 2015; Wang and Wang, 2015).
Problems with TIE
The fundamental goal of TIE research should be to examine the relationship between technology and user goals. Is this the right tool for the job? Is it user-friendly? Is it engaging? Approaching TIE with the preconceived notion that technology is automatically better than traditional methods can lead to poor results. The researcher has to examine the advantages and disadvantages to make sure that the tool fits the purpose. If the tool does not show significant benefits over non-technological teaching methods, given the difficulties of implementation, it will be more time-consuming and have fewer or similar positive impacts on learning outcomes. The researcher has to demonstrate why this tool is the best approach for this type of learning.
TIE is powerful, but without a well-thought-out implementation, it fails to achieve its potential. Multiple studies have examined personal reasons for why users fail to adopt technology, but only a select few ask whether the technology is adaptive to the user (Sun and Wang, 2014; Giacumo and Conley, 2015). Institutions have invested a significant amount of funds and resources into researching how students use technology, yet little effort has been made in assessing the goals and needs of the users (Lai and Savage, 2013). Currently, the user has to adapt to the tool rather than the tool designed for the user (Henderson et al., 2015), resulting in a varied and inconsistent success rate of technology in education (Henderson et al., 2015; Ilin, 2020).
The lack of agreed standards of evaluation leads to inaccurate assumptions and poor implementations. Researchers have to ask the right questions to gather meaningful data. There is a dichotomy in how technology is perceived and used. Often, TIE is seen as superior to other solutions disregarding individual ability (to use technology) and preferences. In the literature, the most predominant solution is to train individuals to use a particular technology. This method requires a massive investment of time (per tool) and puts the burden of developing the skills on the user. A solution that seems more practical is that technology should accommodate the user. Given the state of technology today, it is surprising that so little research focuses on ways to attain this goal. Magdin and Turčáni (2015) attempted to develop adaptive learning technology to personalise content delivery to users. The researchers utilised Educational Data Mining to customise the learning material shown to students based on their learning profile. Although adaptive learning seems promising, developing such a complex algorithm is currently not feasible. The authors themselves acknowledge that unique behavioural patterns and the time required for data analyses are limitations to developing a working formula. Until adaptive learning becomes a reality, the needs of the user can still be addressed through an understanding of how people use technology to learn.
Few studies focus on user needs and preferences as the foundation of technological development. With a user-centred approach as the foundation, technology has the potential to redefine learning by personalising the process (Sun and Wang, 2014). The goal of this research is to identify user media preferences to examine how technology can be implemented to improve engagement (Bozkurt and Aydin, 2015). This research focuses on answering a specific question of ‘how do students use media while learning?’, by splitting it into three components: RQ-1: How does the nature and duration of digital content impact on student engagement factors? RQ-2: What factors impact on student perceptions of usefulness and enjoyment of learning via media? RQ-3: How does media type impact on students’ perception of enjoyment, usefulness and motivation to learn?
In this study, the term media refers to video, audio and e-text. Media are widely employed for learning and often are the building blocks of TIE. Employing media avoids some of the issues with ready-made products of learning how to use the new tool. The users are familiar with navigating websites, watching videos, listening to podcasts and reading online articles; thus, there is no learning curve or anxiety associated with using new digital technologies.
There is substantial evidence that learning through media facilitates learning. Many studies confirm the benefits and advantages of learning through media (Aldemir and Akilli, 2015; Coskun et al., 2017; Camposa et al., 2015; Grant and Bolin, 2016; Hemphill et al., 2015; Kates et al., 2010; Lai and Savage, 2013; Lumpkin et al., 2015; Mukama, 2014; Njagi et al., 2015; Ouyang and Stanley, 2014). However, not all learners are the same and there is a lack of data on how to evaluate the needs and personalise the content for a particular group. This research illuminates some of these dynamics with rigorous methodologies and practical research questions.
Research design
Selection and sampling
A partnership was developed with a secondary school struggling to engage their students in the UK National curriculum focussing on the Holocaust. We agreed that an online module would be developed that complements their classroom curriculum with video, audio and e-text. The school selected 122 KS3 students (year 9 of the English system, 13-year-olds) as the audience for this project.
Theoretical foundation
The project design is based on the constructivist theory of learning. Constructivism allows learners to construct their own understanding of a topic by building relationships between ideas and facts (Taber, 2011). Students do not reinvent the wheel but, rather, attempt to understand how it turns and how it functions. They become engaged by applying their existing knowledge and real-world experience, learning to hypothesise, testing their theories and ultimately drawing conclusions from their findings.
Constructivist theory and technology work well together because technology allows for flexibility and learning at their own pace. The concept of the tool was inspired by Vygotskil˘’s Cole (1978) scaffolding. The media resource can build upon what the students learn in class. This digital resource allows them to learn at their own pace, while selecting the resources that are most useful to them to construct their own understanding and knowledge of the subject. Rather than dictating historical facts and figures, students interact and explore them and add new knowledge to their pre-existing knowledge. Given that students already use media for entertainment, the resource taps in into their positive association of technology with fun, increasing potential engagement.
Methodology
The head teacher emailed the teaching materials on PowerPoint that were mapped into six deliverable chapters. The primary purpose of each chapter is to organise and group the media by the relevant topic. Since most of the curriculum is based on a linear-event format, the chapters were tied to a specific epoch.
There is a substantial body of media-based information dedicated to World War II and the Holocaust. Digital media libraries from museums and Holocaust information resources provided an excellent starting point. The content was chosen with the audience in mind. Since the material is for thirteen-year-olds in a low attainment school and learning about the Holocaust an emotionally heavy topic, the overall goal is to keep it concise, engaging and informative.
One of the goals of this project is to explore media preferences. Therefore, each chapter was split into three pages, with each page dedicated to one type of media relevant to the chapter topic. Chapters 1 and 2 contain a single media file (per page) each under ten minutes long. However, Chapters 4 to 6 contain two media files (per page) that become progressively longer as well as more poignant with each chapter. For example, Chapter 1 video is an infographic about Jewish history and Chapter 2 video is an artistic presentation of the rise of the Nazis to power. Both videos are visually stimulating and are designed to engage the audience rather than bombarding them with emotionally charged and information-heavy expert narratives that became predominant in the later chapters.
Having completed the structural and information design of the content, a website was developed that could be used across all platforms and devices.
Research instrumentation
Stage 1
Stage 1 was designed to collect quantitative data on how the students used the website. Two analytical software packages, Google Analytics (GA) and Yandex.Metrica (YM) were employed to collect data on the overall usage patterns. Both GA and YM generate customisable reports for understanding patterns of use, media consumption and user preference. Another advantage of using two analytical systems is that each offers unique features, and they can be used to validate the results by comparing one to the other.
To gauge the individual’s journey through the website, each pupil was assigned a user-ID and password that were distributed by the teachers, keeping the student identities anonymous while tracking their activities across multiple devices. Another way to track the individual’s journey through the website is a unique feature of YM called session replay. YM records user mouse movements on each page they visit during a session. Although it does not record every session, the available replays allow for an intimate understanding of what users do while browsing the website as well as the ability to validate some of the GA session data.
Stage 2
Stage 2 assessed the usefulness and enjoyment of media. Salloum et al.’s (2019) quantitative study on the acceptance of e-learning among students concluded that perception of usefulness and enjoyability are critical factors in their willingness to accept e-learning. For this project, it is essential to understand what is considered useful and what is considered enjoyable to increase the impact of the learning tools as well as differentiate between the two factors. For example, a student may enjoy listening to audio but find it relatively useless for retaining information.
To measure enjoyment and usefulness of learning, each page had data collection form (per media). The usefulness scale consisted of a five-option Likert scale ranking the media from ‘very useful’ to ‘not useful’ for learning. Each selection has a numerical value assigned to measure the usefulness-score. The ‘very useful’ was worth ‘1’ and the ‘not useful’ was worth ‘5’. The scale was followed by an open-ended question (usefulness-feedback) that asks the student to explain their selection.
The enjoyment question consisted of five multi-select options ‘excellent, boring, interesting, poor and entertaining’. No numerical values were assigned to these options, but the selections helped shape user preferences. This question was also followed by an open-ended question (enjoyment-feedback) asked the students to explain their choices.
When a student submitted the form, it captured their user-ID, the date, the page and the media they reviewed, thus connecting their responses to the Stage 1 data. Additionally, using GA allowed us to track how much time the user spent on a page, thus making sure the user spent enough time on the page to complete the interaction before writing a review. This method helped identify several users that submitted feedback without interacting with the resource.
Stage 3
Stage 3 is a survey that was administered at the end of the course. Rather than using their name, the students entered their user-ID maintaining anonymity while connecting the survey data to the previous two stages. The questions in the survey were piloted with a twelve-year-old son of a colleague (who does not attend the school where the research was carried out) to make sure that they made sense to his peers. The exit survey consisted of nine questions combining Likert scale and open-ended questions. The initial question was for the students who did not interact with the website, asking why they had not used the resource. The next three questions measured asked the students to rate each media for usefulness in helping them understand the topic. These data were used to triangulate the findings in Stage 1 and Stage 2.
The next set of questions addressed several factors that have the potential to distort the results. One question asked whether the student liked the subject of history. Someone that dislikes history is unlikely to enjoy it or find it useful regardless of content. The usability of the website is another variable. Web resources that are hard to navigate tend to deter users. The last question asked whether the user would want to continue using the web resource for other history related topics.
Findings
(RQ-1) How does the nature and duration of digital content impact on student engagement factors?
Overall usage
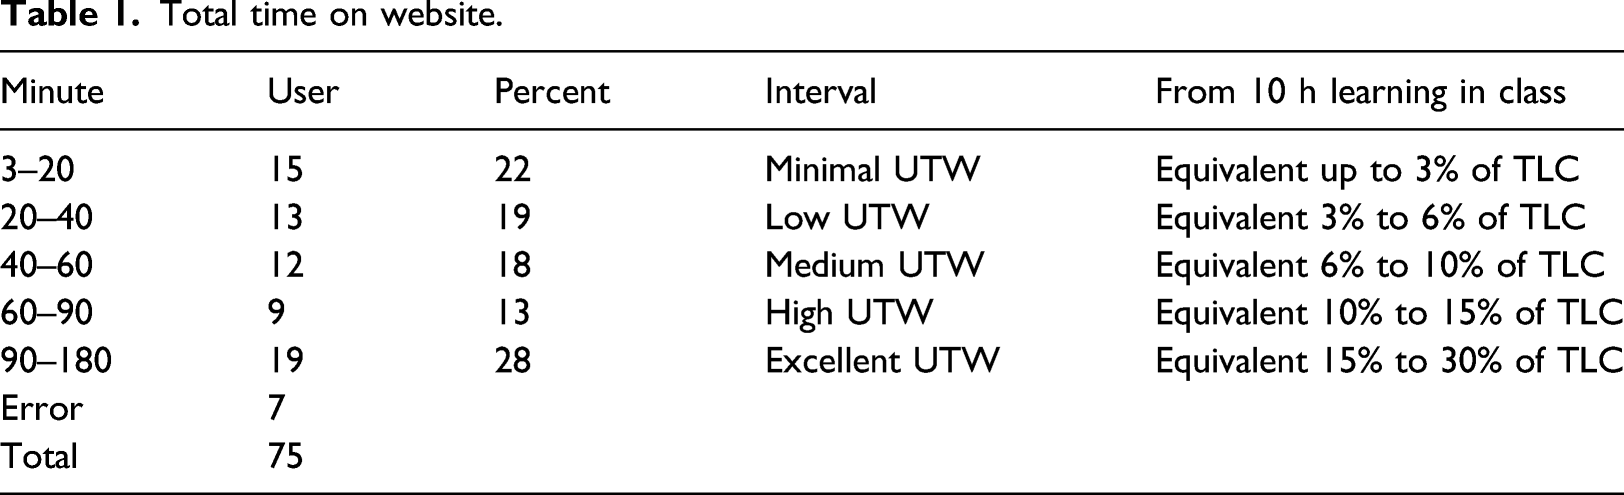
Out of the 122 students, 61% accessed the website. This figure demonstrates the significance of presenting the information in media format. The school struggled with engaging students with this difficult topic. Although this resource was presented as an extracurricular activity, many students chose to interact with the material. Of the 75 students that accessed the website, 59% of students spent 40–60 minutes exploring the website, and 28% of users spending 90–180 minutes.
Total time on website.
Designing the website to work across all devices was effective. 32% of users only used mobile, and 40% only used desktops. This is an important finding, meaning that developers and educators have to be aware that the tools they are using should be accessible on any device.
Figure 1 shows the total user logins per week. Week one starts slow, the number of students gradually increased, peaking at week three and starts to decline during week four. Week five was a holiday week where few students used the website, with the pattern normalising during the last week. Total users by week.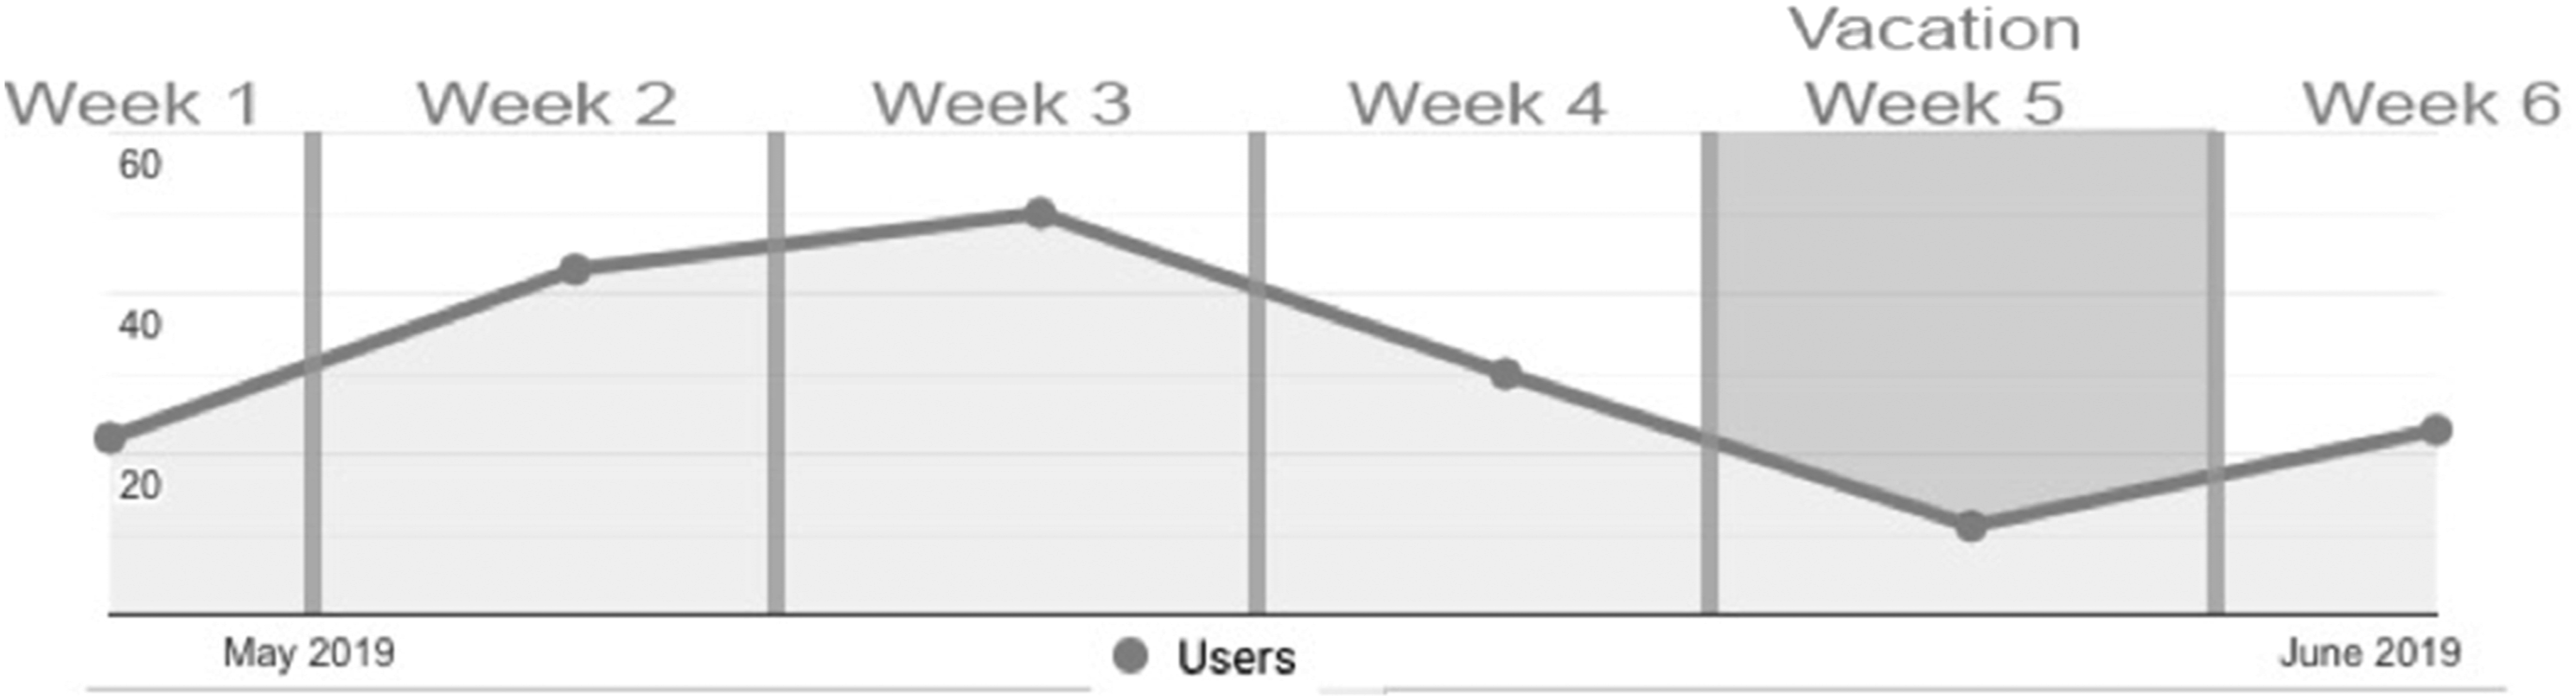
There are several potential reasons for the decline.
Novelty effect
One possibility for decreasing engagement is the novelty effect as the users got over their initial excitement of using a new resource the ones that were not engaged dropped off, while others lost interest over time. This is evident in the overall usage patterns. There are fifteen students whose total time on the website was under twenty minutes. In most cases, the user logged in once looked at a few pages and left for good.
Content strenuousness
The novelty effect is a plausible explanation for the decreased usage. Another potential factor is that the content was designed to become progressively longer and more emotionally taxing with each chapter. This phenomenon will be referred to as content strenuousness. To assess the impact of content strenuousness, rather than looking at engagement over term progression, page visits were examined by chapters (Figure 2). There is a clear pattern of decreased visits from Chapter 2 through Chapter 6 as the content strenuousness increases. Chapter 1 is an anomaly as it breaks the visitation pattern. We have attributed this to the fact that this section is not a significant part of the classroom curriculum. Because it was a minor part of the classroom discussion, some students may have felt that it was not relevant. This is supported by the video completion statistics, although Chapter 1 video has the second highest visitation rate (88 visits), it has by far the lowest completion rate (55%). Refer to Figure 3. Visit per page – organised by chapter. Visit, start and finish – organised by chapter.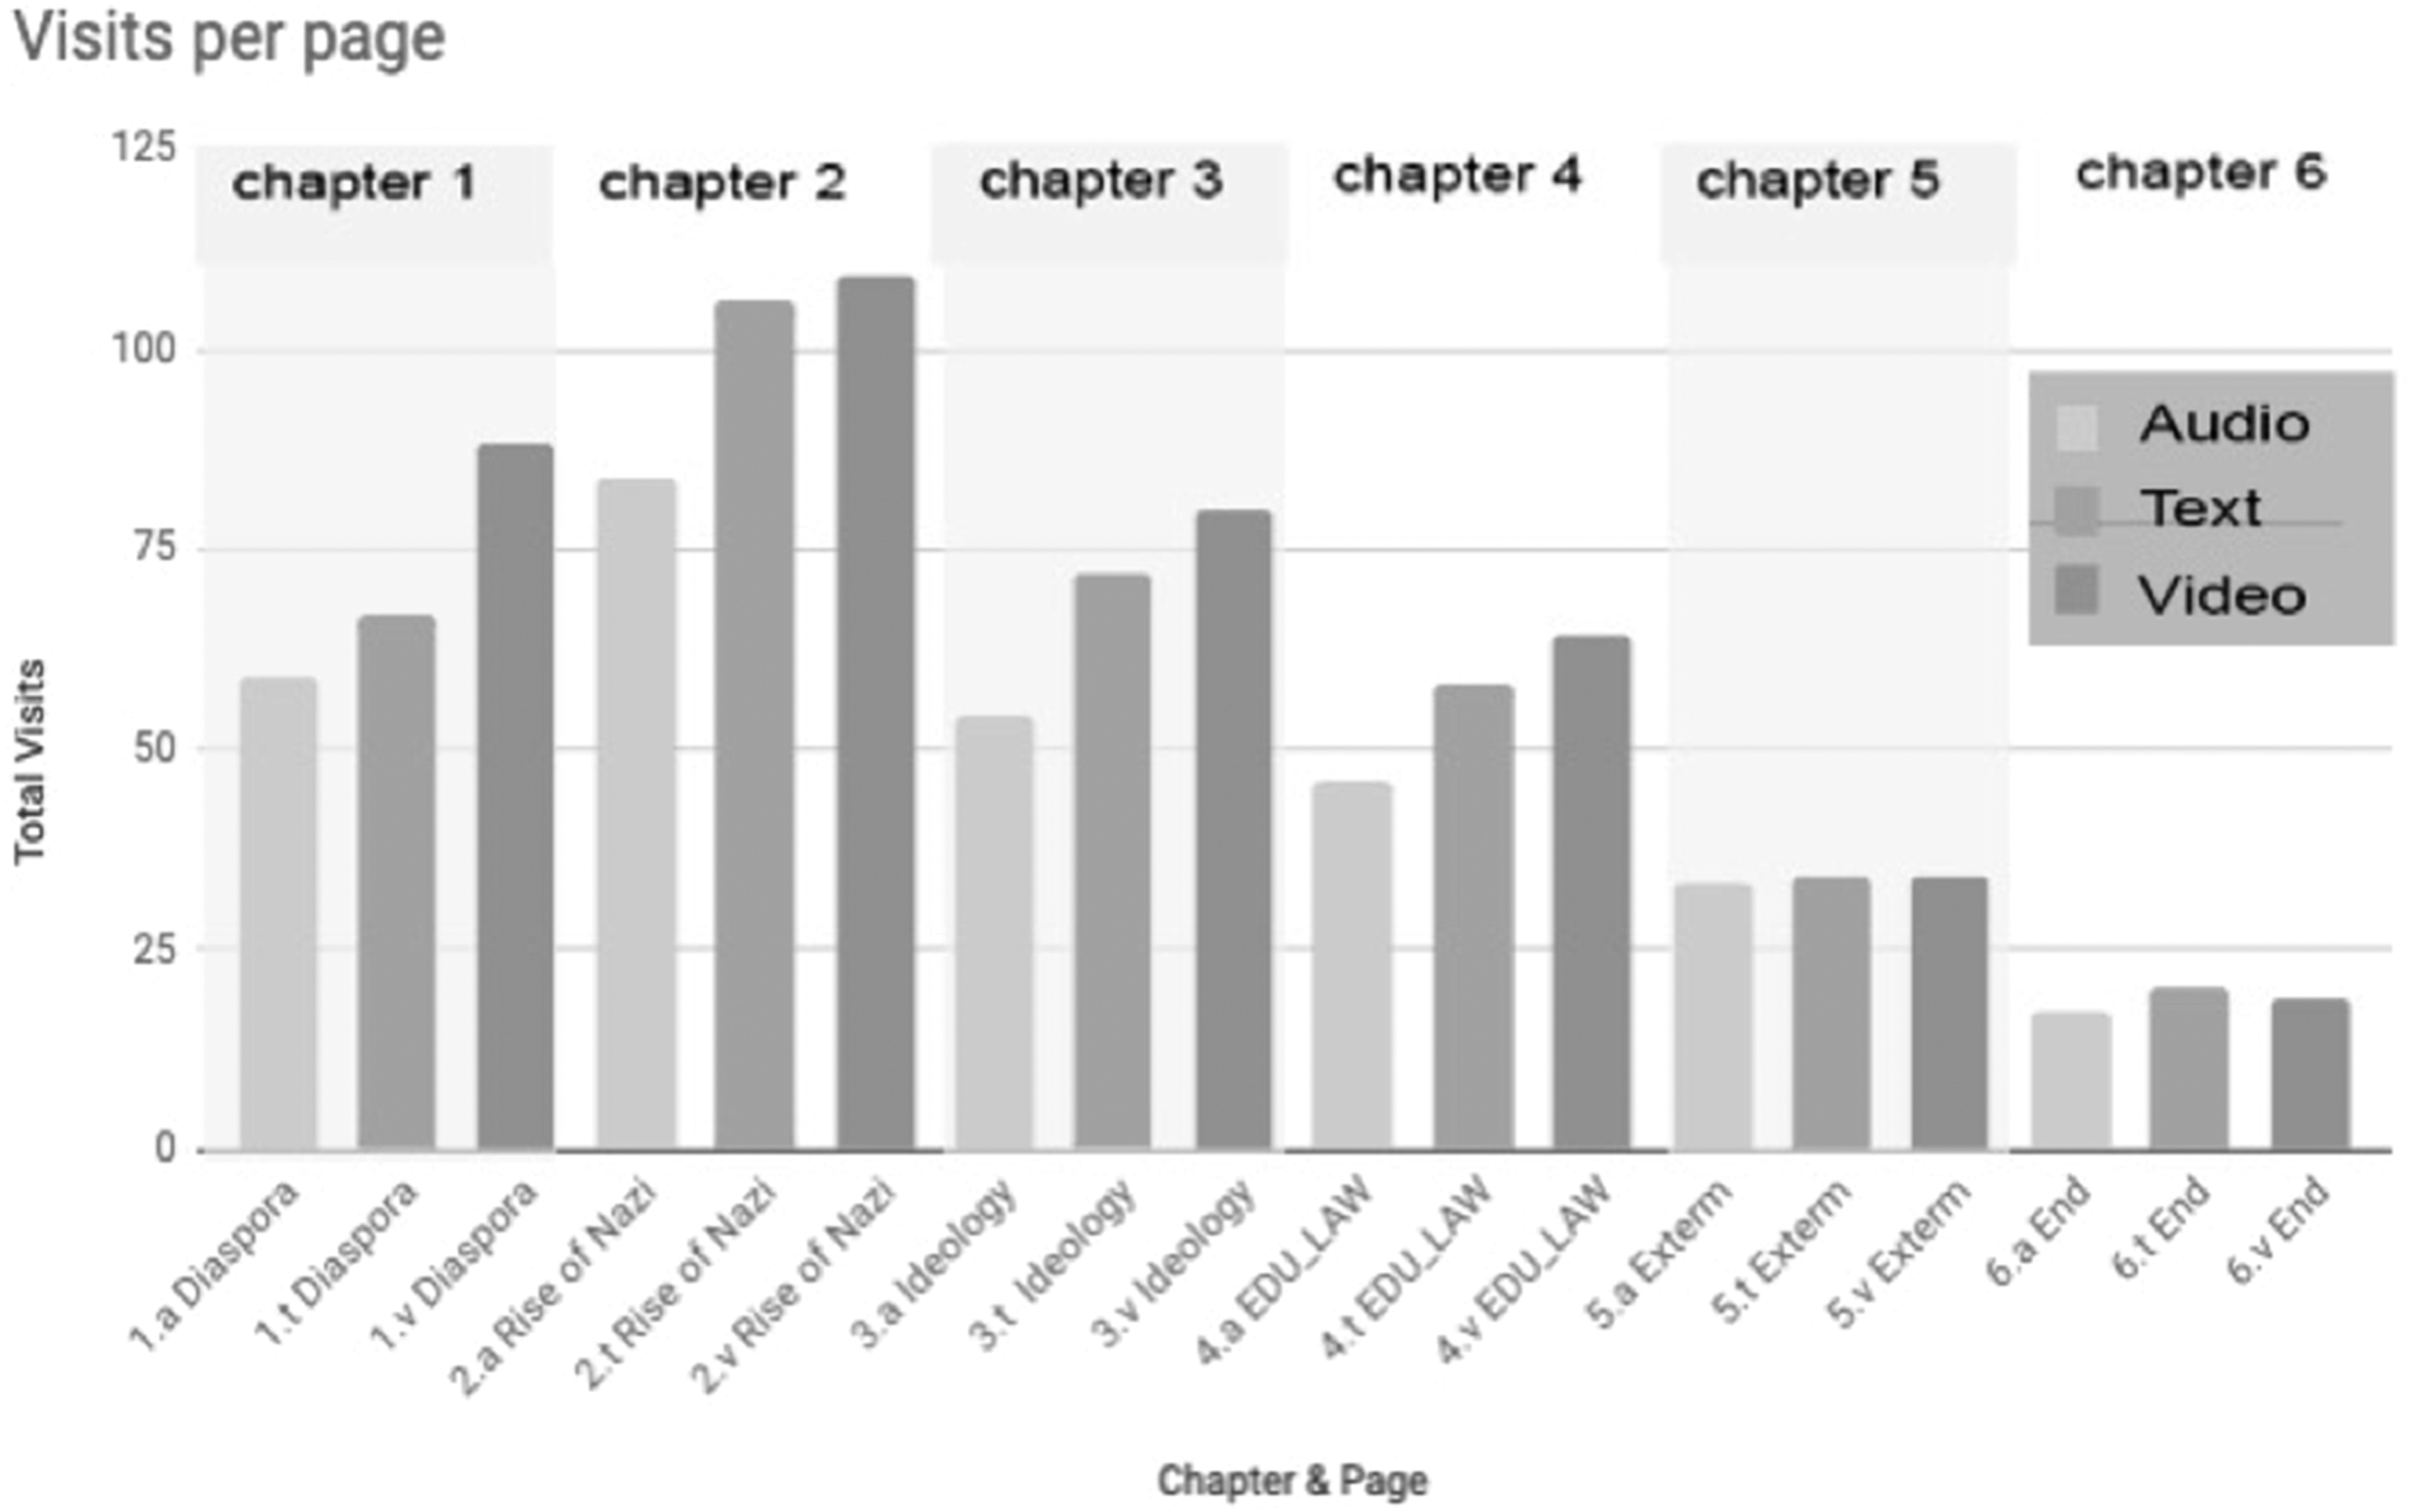
Media duration
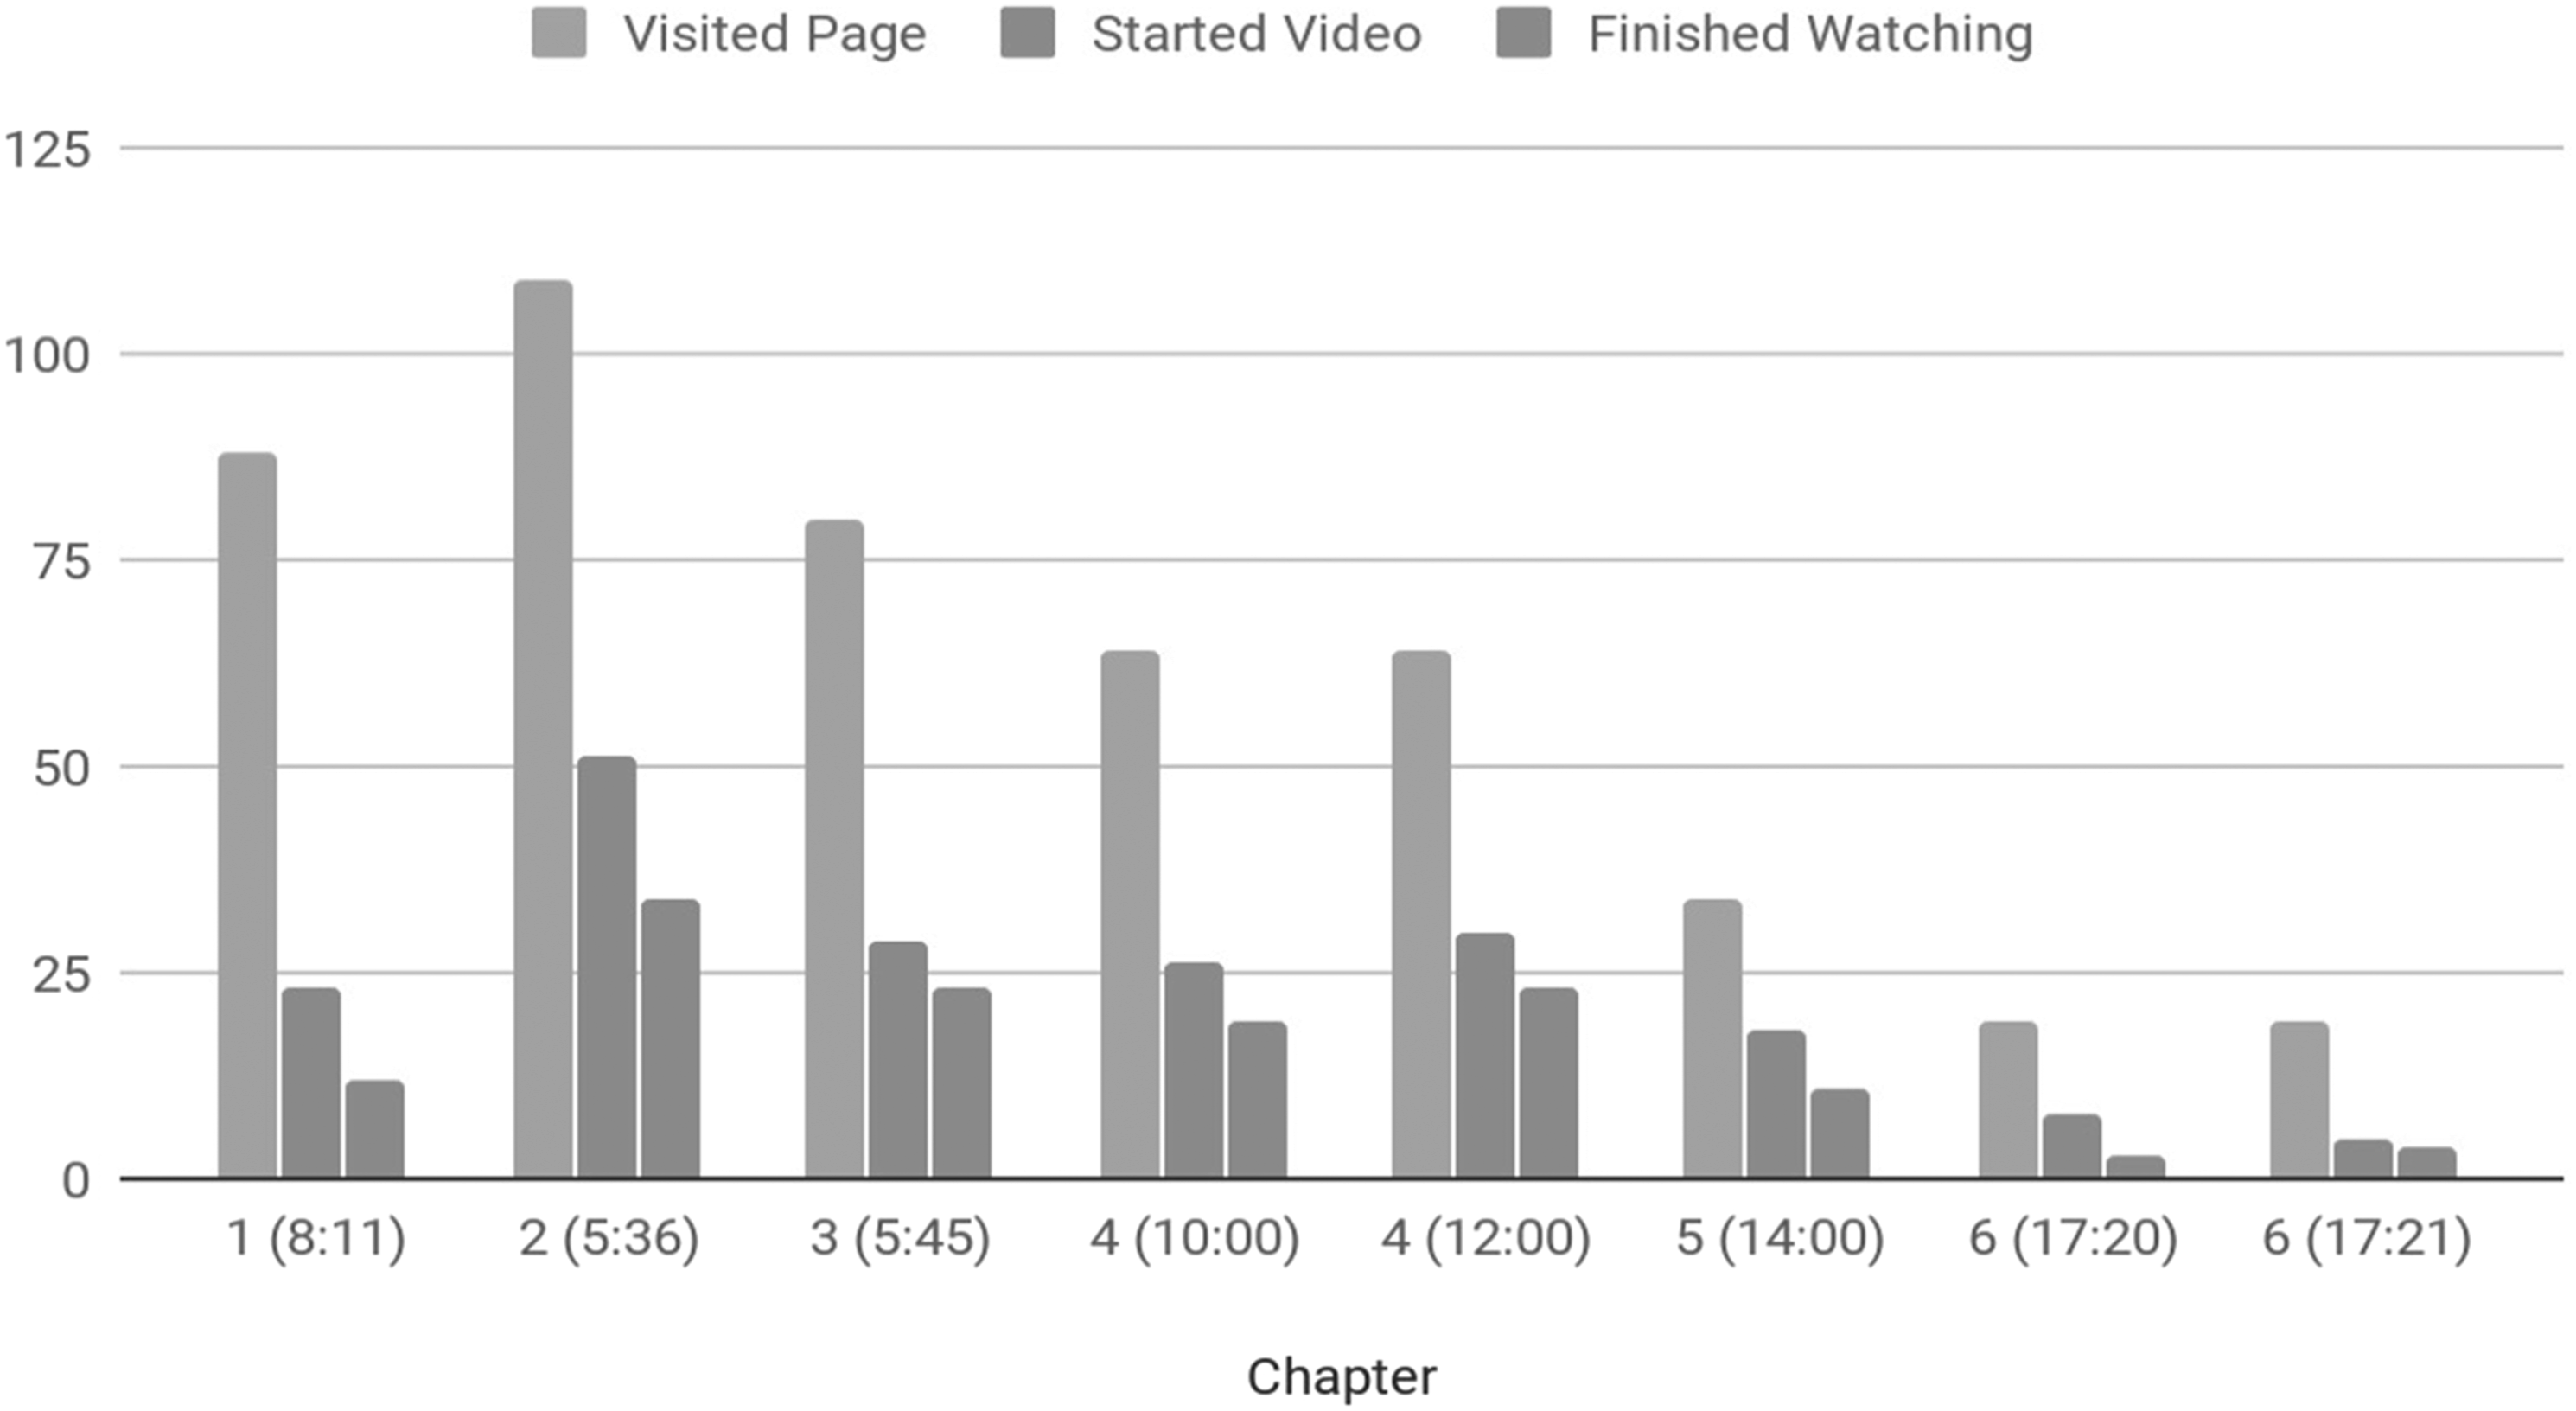
Content strenuousness can be broken down into two components: the duration (of the media) and the entertainment value (of the resource). To probe this further, user video interactions were explored. Utilising GA page visits and video completion tracking, a graph was created that mapped these data arranged by chapter (Figure 3). The graph shows a pattern of decreased interaction as the videos get progressively longer suggesting that content duration affects engagement. This also reflected in the seven comments by five different users (two on audio, three on e-text and two on video) that either praised or criticised the length of the content.
Entertainment value: There are two anomalies in the graph, the lower interaction with Chapter 1 (discussed in the previous section), and the increase in engagement in the fifth video, which is twelve minutes long. The video in question is a Disney cartoon that was particularly attractive to this audience and although this video is longer than the previous four videos, it has the second highest number of users that started and completed watching the video (77%). The entertainment value of this cartoon was evident in the enjoyment feedback where users expressed a preference for the animated format. The Disney cartoon demonstrates that the entertainment value of the content can disrupt usage patterns. Understanding the audience’s preference is significant because by providing content that users find enjoyable, they become receptive to lengthy and complicated topics.
The data and user feedback suggest that the duration of content is a factor in engagement. This finding, although not necessarily representing all the users, does demonstrate a positive correlation between content duration and disengagement. For this group, the average session duration was eighteen minutes, with a significant number of users selectively browsing for entertaining content. It is also clear that the entertainment value is a key factor and users will watch longer material if they find it enjoyable. This pattern is valuable in understanding the user preferences and personalising learning materials best suitable for their attention span and interests.
(RQ-2) What factors impact student perceptions of usefulness and enjoyment of learning via media?
Categories for usefulness and enjoyment.
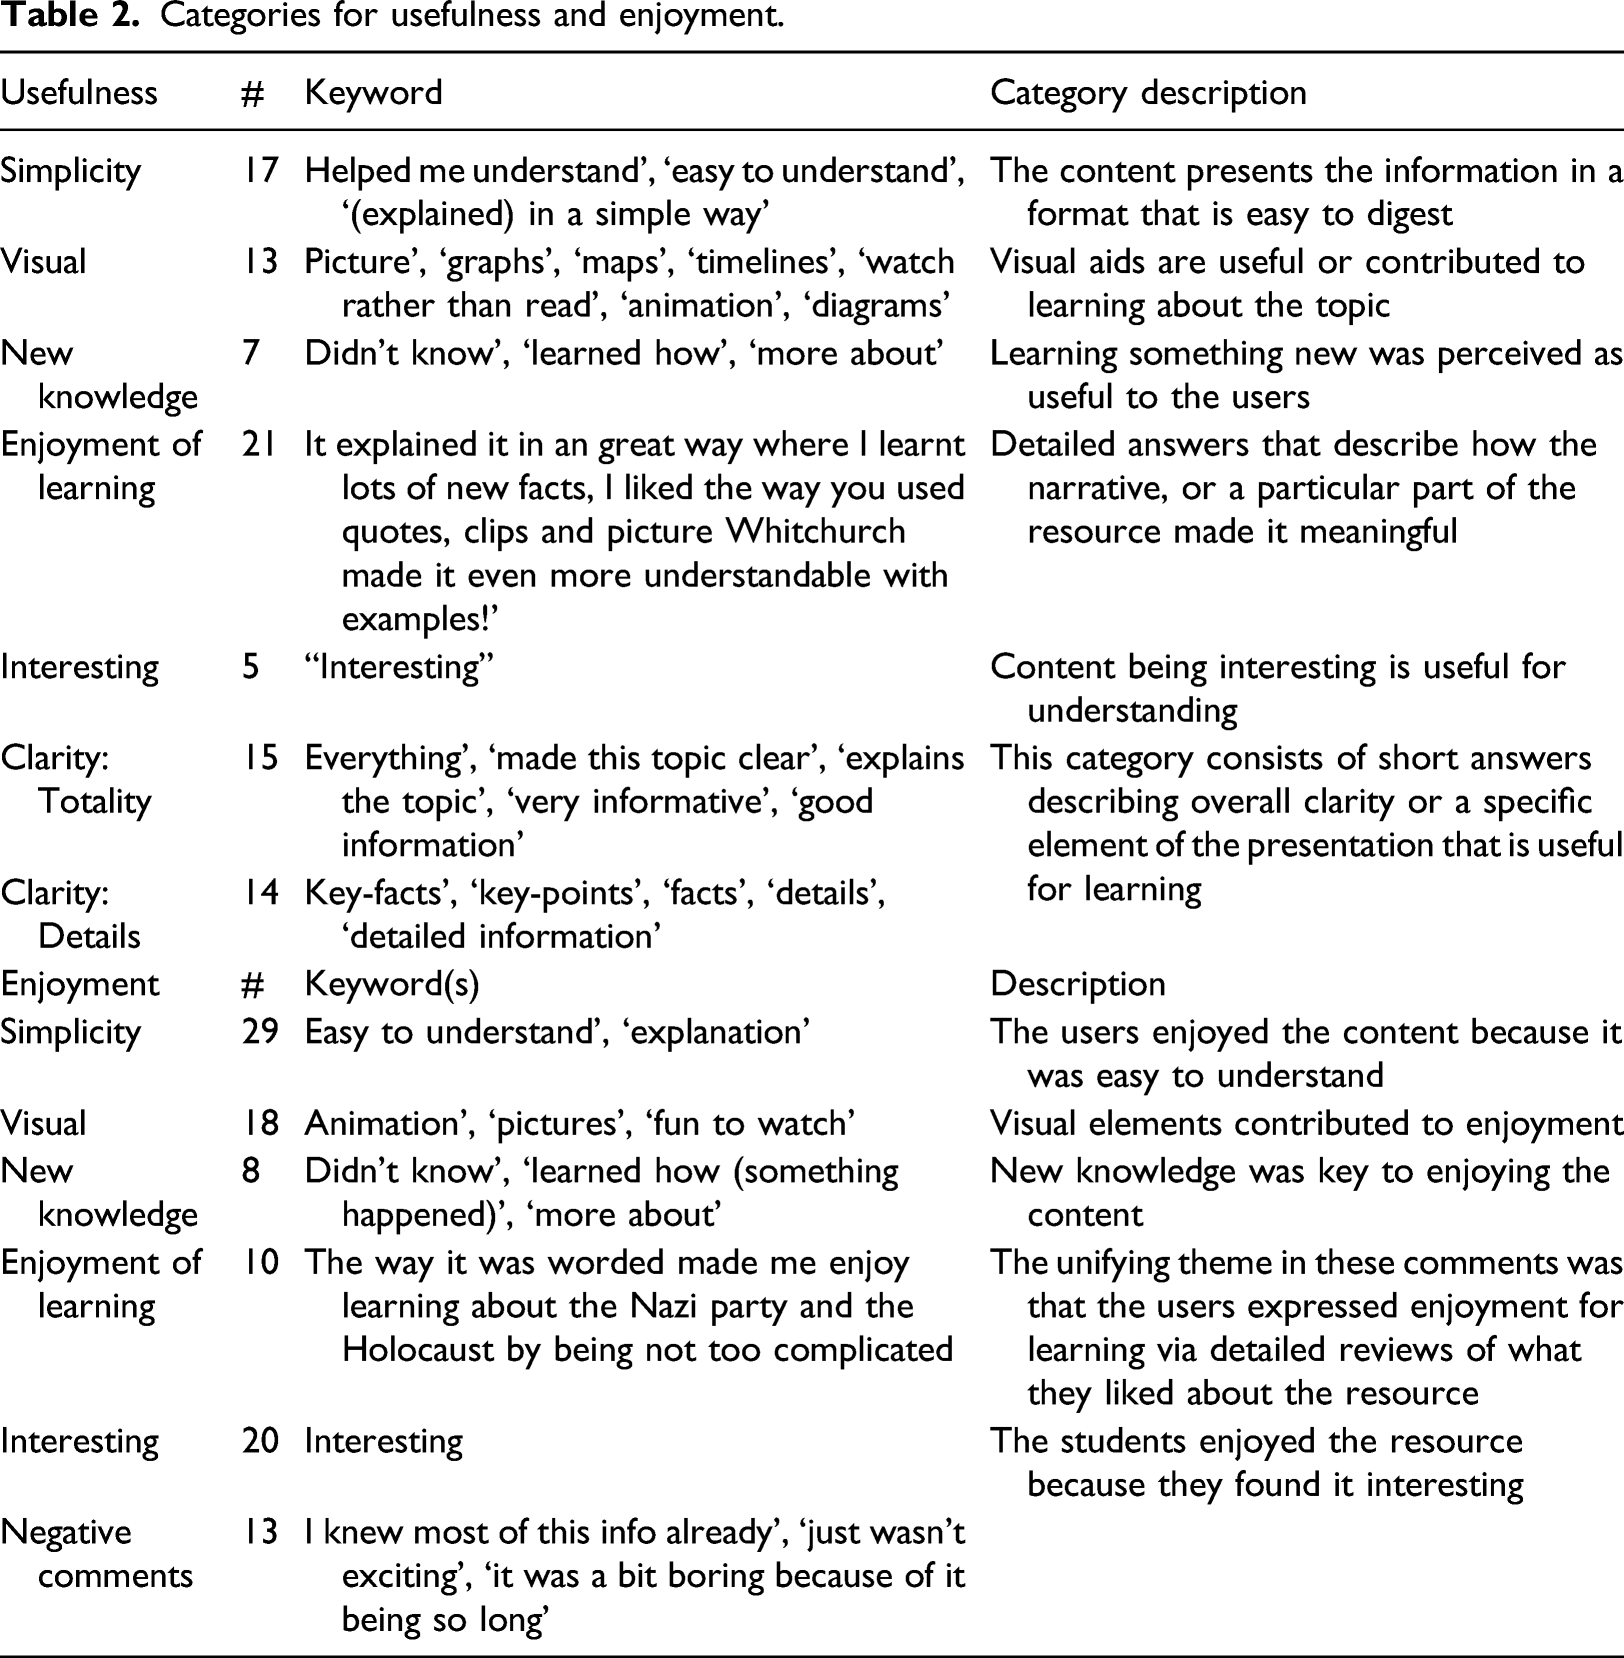
Simplicity
Users found the resource useful for learning because the content was easy to understand. They used keywords such as ‘easy to understand’, ‘explained what happened in a simple way’. In the same vein, students enjoyed the resource because it made the information accessible, praising the content for presenting the information in a digestible format.
Visual Stimulation
Users found that visual aids helped them better understand the topic. Keywords for this category praised: ‘Pictures’, ‘graphs’, ‘maps’, ‘timelines’, ‘animation’, ‘diagrams’. On the enjoyment scale, students enjoyed videos and images for their ability to inform or entertain. Keywords included ‘animation’, ‘pictures’, ‘fun to watch’. There was a distinction in this category between usefulness and enjoyment; while some students enjoyed something, they did not necessarily perceive it as valuable for learning. The Disney cartoon is an excellent example; several students gave it a high enjoyability rating but a low rating for usefulness as a learning tool.
New Knowledge
A small number of users signified that ‘New Knowledge’ is a factor in both usefulness and enjoyment of the materials. From keywords such as ‘didn’t know about (…)’, ‘learned how (…)’, ‘more about’, it is clear that learning something new is important to some learners in both usefulness and enjoyment. Although similar keywords appear in enjoyment and usefulness, we infer that there is a difference. While some students generally enjoy learning new things, others find new information useful because it offers a more comprehensive understanding of the topic.
Enjoyment of Learning
This category is different from the other ones because there were not any specific keywords. The unifying theme in these comments is that the students expressed the enjoyment of learning. This subset of reviews stands out in its detailed description of what they liked about the resource and how it helped them learn. Similar to enjoyment, the usefulness section had a multitude of longer replies that describe in detail what the users found useful. Comments focused on narrative or a particular connection to the content that made the learning experience meaningful.
Interesting
Interesting content was a significant factor for Enjoyment (20 comments) but less so for Usefulness (5 comments). Similar to visual stimulation although users found the content interesting, some did not see it as practical for learning. Although it was not possible within the scope of this project, it would be interesting to explore the student perception of usefulness versus entertaining in greater depth.
Clarity
This category is exclusive to the Usefulness section. The comments consist of short (one to five word) answers that highlight either the totality of the resource in being useful for learning by stating that the resource ‘made this topic clear’, ‘explains the topic’, ‘very informative’, ‘good information’ or focus on details such as ‘key-facts’, ‘key-points’, ‘facts’, ‘details’ and ‘detailed information’ that they found useful. This category overlaps with the Simplicity category, but in this case, the users explicitly expressed that it is the clarity of the content (rather than the simplicity) that helped them understand the topic.
Negative comments
Thirteen comments criticise the content offering insights into some of the issues that affected enjoyment. For example, in the audio file describing the Jewish diaspora, the narrator talked about multiple nations that no longer exist. The user explained that they did not enjoy the audio because he could not visualise where it was taking place. More detailed explanations should be available for those who are listening but not looking at their device or are sight-impaired.
The lack of or insufficient visual stimulation was also criticised. Several users correctly pointed out that watching a narrator talk is boring. Indeed, one video could have focused more on the objects the narrator was describing rather than the narrator himself. One of the e-text pages did not have images, and this was also noted in the comments.
A small portion of negative criticism (and mixed into the positive comments) described the content as not being ‘exciting’ or ‘upbeat’. Some users misinterpreted the seriousness of the speakers as a lack of enthusiasm. Similar comments may signify that some of the content is too emotionally tasking for this age group. The media selection process should mind the emotional capacity of the audience.
Overall, the data show that enjoyment is tied to visual stimulation, duration and entertainment value, while usefulness for learning reflects the importance of simplicity for understanding, the capacity of the content to explain the topic and users’ interests. Both usefulness and enjoyment are essential in the learning process. When selecting content, the educators should be aware of how it fits into the seven categories in both enjoyment and usefulness. It is essential to survey the students to verify how content can be made interesting, clear and stimulating for the intended audience.
(RQ-3) How does media type impact students’ perception of enjoyment, usefulness and motivation to learn?
Media type greatly influenced both the enjoyment and usefulness perception of the students. Figure 3 provides evidence that videos are the most popular format, followed by text and audio. Page visits give us an idea of what users clicked on but not whether they interacted with the content, showing that some users visited multiple pages before selecting a resource. To compare the resources side by side, a Media Engagement table was created that offered a systematic way to examine engagement per chapter per media.
Media engagement.
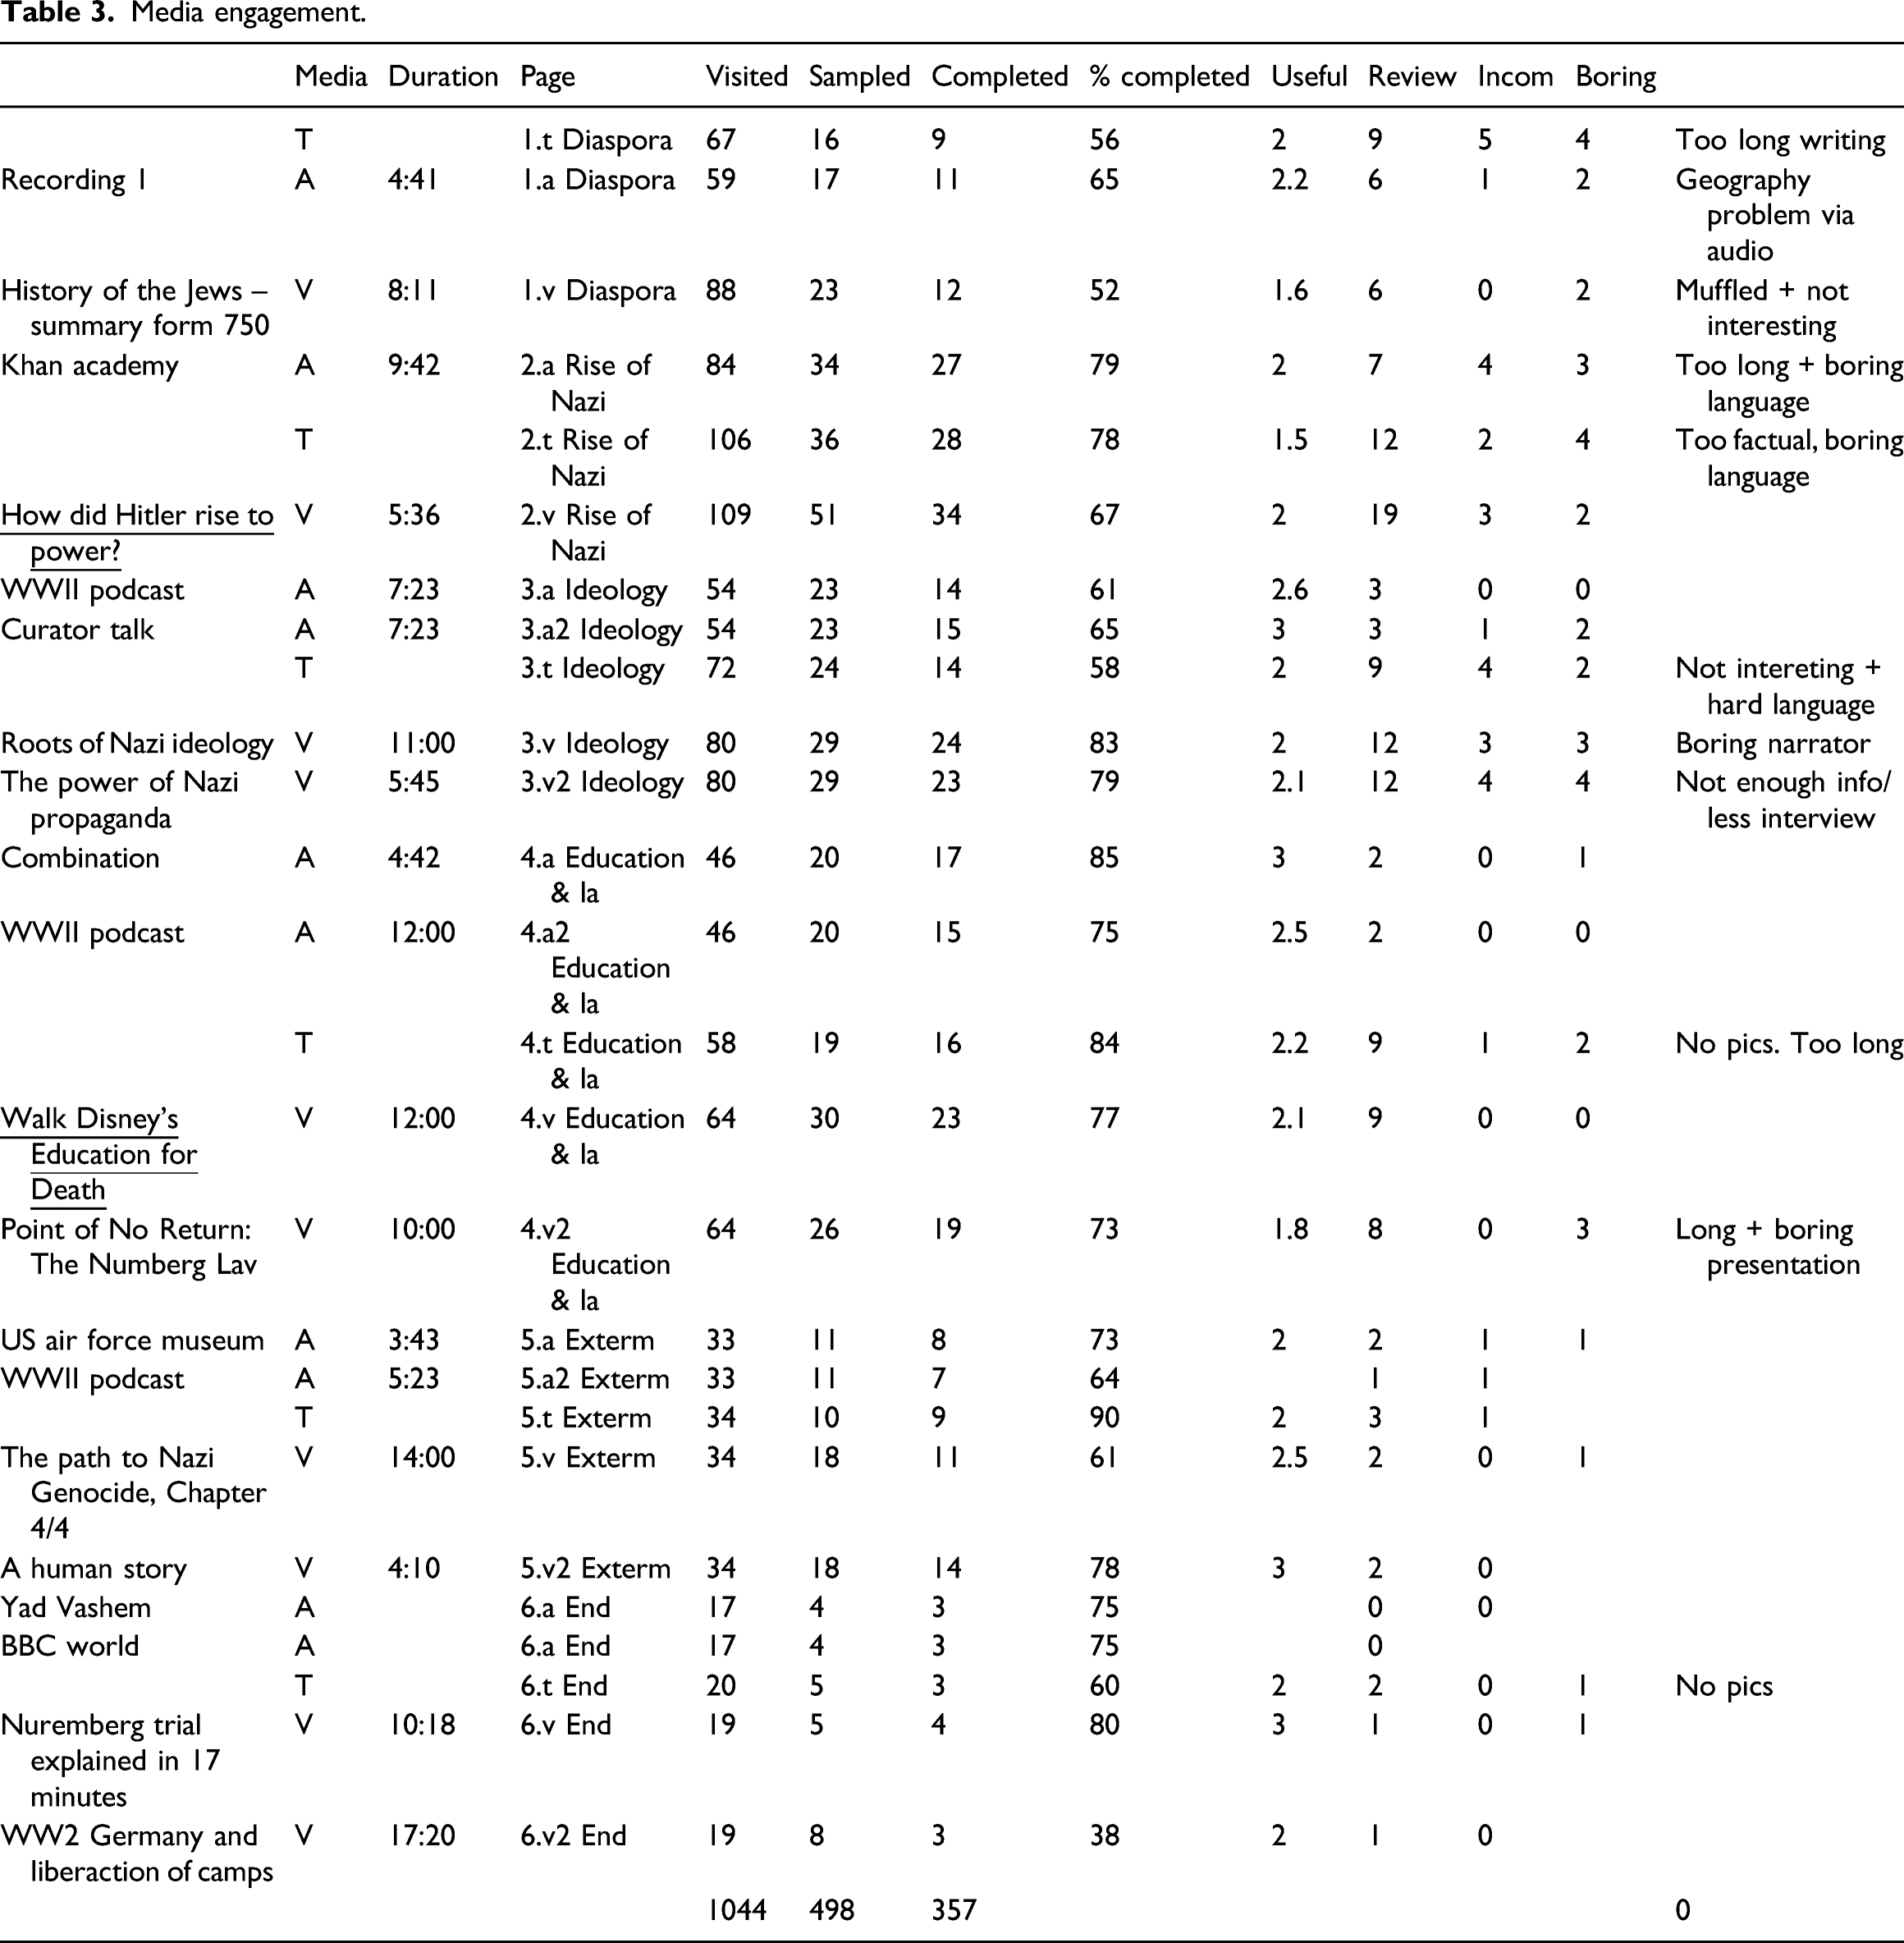
Audio
The audio pages were the least popular in both the number of page visits and usefulness rating. Stage 1 data showed that fewer people visited audio pages than the other two media, and even fewer students sampled the audio content. However, those that sampled the audio generally completed listening to the resource. Stage 2 data triangulated these findings with the lower usefulness rating than video and e-text. Overall, there were fewer reviews for audio and the ones that were submitted, lacked the same enthusiasm which was observed with the other media.
No students solely used the audio format. All audio consumption occurred in combination with other media, mostly by motivated students who utilised every resource in a chapter. This was triangulated by the Stage 3 survey where the audio material had the lowest grade for usefulness for learning and the highest number for ‘did not use at all’.
The lesser popularity of the audio format does not mean that it should be excluded. Audio format offers accessibility options for the visually impaired as it accommodates different learning styles.
E-text
E-text was slightly more popular than audio. Stage 1 data revealed that pages with e-text had high visitation numbers, but a significant number of visitors did not stay long enough to read the content. From Yandex replays, it was clear that some of the users visited the page, looked at the pictures and left. Many of the students rated the e-text format as useful for learning, especially if it was concise and factual. Stage 2 data support this finding via the usefulness rating and user reviews. E-text enjoyment reviews were generally positive with users finding the content enjoyable, the pictures useful for understanding and some users even asked questions about the content. Data show that at least four students exclusively read, completely avoiding the audio and video formats. Most students used e-text in combination with video, disregarding the audio format.
Video
The video format was the most popular in every analytical criteria. In Stage 1, video pages were the highest numbers in terms of visits and completion. Stage 2 data showed overall higher usefulness and enjoyment scores. This was also reflected in the larger number of enthusiastic user reviews. Data showed that at least seven students exclusively watched videos. The popularity of the video format was triangulated by the Stage 3 survey where video had a significantly higher usefulness and enjoyment rating, with and no users selecting ‘did not use at all’.
The entertainment value was the most influential factor for video selection. For example: the Disney cartoon is over seven decades old and significantly longer in duration than some of the more modern educational videos; however, it had a high completion rate and higher enjoyment rating than any other resource.
How do students use media to learn?
In order to better comprehend the data, we created another table called ‘User_Map’ that combined analysed data from several other tables: UTW, number chapters completed, number of sessions, number of comments submitted, category of comments and observation of user browsing patterns. These data allowed us to break down users into three distinct groups based on how users interacted with the website.
Motivated Students
Users in the motivated group explored three or more chapters, completing at least two media units per chapter. In total, there are twenty-one users in this group, eighteen in the Excellent (90–180 min) UTW and three in the High (60–90 min) UTW. Many users in this group exhibit methodical and disciplined study habits, something that was not observed in the other two groups. For example, eleven users systematically covered a chapter per session, during the week that covered the topic in class. Although only half of these users wrote feedback, this group almost exclusively dominates the ‘Enjoyment of Learning’ category, with the most insightful and meaningful feedback. Feedback from the users in the motivated group revealed that they enjoy learning in media format, taking their time to explore and digest each topic, leaving meaningful comments in the process.
Selective Students
Selective learners consist of thirty-three users in the Low (20–40 min of engagement), Medium (40–60 min of engagement) and a several from the High (60–90 min of engagement) UTW. These users are characterised by selective engagement. The user behaviour in this group is characterised by filtering the content, meaning the users visited multiple chapters but only engaged with content they found interesting. This pattern is also reflected in the Stage 2 feedback. Two-thirds of this group wrote feedback. Generally, the comments were positive, suggesting that by picking the media they liked, these users enjoyed learning. The majority of the comments in this group focused on the visual and entertainment value of the resources and praised content that was easy to understand. It can be concluded that this group is motivated to learn, as long as it is fun and easy to understand.
Disengaged Students
Disengaged learners consist of thirteen students that spent less than twenty-two minutes on the website. Most of these users logged in once, looked around and left. Excluded from this group, there are seven students whose data may have been obscured by private browsing. These users had multiple login sessions that lasted 0 s.
Ten users in this category submitted feedback answers. Two users navigated from page to page ranking each media ‘boring’ without interacting with it. Several users wrote reviews without interacting with the media. One user consumed a resource, wrote a positive and rather meaningful review and never came back to the site.
The disengaged group also includes users who did not access the website at all. The single-logins combined with the no-shows constitute approximately fifty per cent of the total audience. Although it was not possible for this project, further research should be explicitly focused on this group to examine the reasons why they did not engage and how to motivate them.
Discussion and conclusion
The overall educational goal of this project was to help young learners better understand a difficult historical topic. Given that the resource was extracurricular, the fact that one-third of the students that spent over 40 min on it speaks to the power of media to engage learners. Seeing or hearing the history had a profound emotional effect. It was clear from the feedback that some students were moved by what they saw and heard. Here are two examples: • ‘It explained the power of Nazi propaganda really well and I really got a feel what it would be like living with Hitler as leader’. • ‘It helped me understand how the Jews were treated during the 1930s and that Jews were actually being punished before World War 2 even started!!’
The material helped them build on the knowledge from the classroom and connect media material to factual knowledge. Even the Disney cartoon helped develop a juxtaposition between historical events to their own lives. • ‘The cartoons were really fun to watch and they got the information across in a great way. It explained how Nazis and children learnt about Hitler and Germany. I loved it’
Lai and Savage (2013) stated that learning is not just memorisation and reiteration of facts, but it is also the understanding of what those facts mean and their consequences. Knowing that the Nazis killed eight million Jews is not the same as seeing the footage. Technology and media can portray the realities of Nazi Germany that are difficult to depict through lectures or textbooks.
TIE does not have to be complicated or expensive in order to be effective. Although there are personalised learning products that use algorithms to deliver content based on user interests and current knowledge level, the same results can be achieved by gauging the user preferences through surveys, analytics data and classroom discussions.
There are a number of things this research found about this cohorts’ preferences that would increase engagement with this difficult topic. Similar to (Bachore, 2015) findings, our users have a finite attention span. The data show that the average session time is eighteen minutes, and many students partake in selective browsing for entertaining content. Boredom and distractions play a crucial role in engagement (Brasiel et al., 2016). The goal is keep the users engaged and learning for the entire duration of that session.
For this group, eliminating ‘content strenuousness’ would increase engagement. Restructuring the site so that all chapters are similar would benefit the users. Each topic should have an introduction page with a brief and digestible video as well as reading material complemented with images. For the more studious users, links to subtopics would offer content with more detail. Restructuring the resource in this format would allow students to choose their mode of learning and offer engaging content that captures their attention for the entirety of the eighteen minutes they spend on the assignment.
Further, the content can be further refined via user feedback and completion analytics. Material that is rated as boring would be adjusted to more engaging for this group.
Limitations
The study was conducted on a small group of students in a single school in the United Kingdom. The unique preferences of these users may not reflect other groups, and similar studies should be conducted to gauge their user preferences. Due to privacy concerns, we could not measure the academic achievement of each student, and further research is required to better understand this relationship between media preferences, perception of usefulness, enjoyment and learning.
Implications for education
1. Media alone are not enough to engage learners.
61% of students took advantage of the tool, with the majority of users rating it as useful for learning and enjoyable. However, 39% did not use it at all or used it for less than 40 min. There are many reasons for disengagement, but our findings support Aldemir and Akilli (2015) suggestion that not all young adults are tech-savvy and some need additional support with online tasks (Hewitt and Stubbs, 2017). Stage 2 and Stage 3 data revealed that a number of users failed to login and were discouraged to try again, among other technical issues that demonstrate a lack of basic computer skills. Access to digital resources should be as simple as possible to use, and educators should proactively troubleshoot technical issues.
For best results, the digital materials should be complementary to classroom learning. Educators play a critical role in whether digital resources are embraced or rejected by their pupils (Sun and Flores, 2013). User feedback data revealed that as a result of this resource was not directly integrated into the classroom activity. Without encouragement, some students were not motivated to explore it on their own. ‘Careful design and an effective implementation of active learning strategies help produce positive results on students’ performance without major disruptions in the instructional process’ (Cernusca and Brown, 2015). Training teachers in using these tools, as well as proper integration into the curriculum, is essential for engagement (Song and Donovan, 2013). 2. There is no single learning format that is suitable for everyone. Diversifying ways to access knowledge engages different types of learners.
Flexibility is essential to reach a broader audience. Joan (2013) found that there are a broad variety of learning styles and levels of motivation, even in a relatively homogenous group of peers in a single school. These data support other research which found that students benefit from having the ability to learn at their own pace (Kates et al., 2015), use various devices to access the information (Henderson et al., 2015) and learn via various media formats (Song and Donovan, 2013). The users interacted with the online resources in a number of ways based on their learning needs and preferences.
Given that this was an extracurricular activity, the extensive time some users spent engaging with the resource combined with the positive feedback suggests that the users found it useful and benefited from having the information available in various formats. Students have individual preferences for how and where they learn. Offering more ways to access knowledge maximises the learning potential. 3. Understanding the audience’s preferences maximises engagement.
When selecting media content, it is crucial to understand the audience preferences (Mukama, 2014). The educator’s assumptions are not always correct, and it is important to probe what the audience enjoys and finds useful. For this group, content strenuousness and duration directly influenced engagement, but entertainment value turned out to be the most significant factor. The users were willing to watch an educational video to completion even though it was significantly longer than the less entertaining counterparts. This underpins the importance of gauging audience preferences to maximise engagement and learning.
In conclusion, technology on its own cannot fix poor teaching or low student engagement (Lai and Savage, 2013), but with proper implementation guided by a research-based approach to content selection and integrating it into a rigorous curriculum, technology can make learning more inclusive and enjoyable.
Footnotes
Declaration of conflicting interests
The author(s) declared no potential conflicts of interest with respect to the research, authorship, and/or publication of this article.
Funding
The author(s) received no financial support for the research, authorship, and/or publication of this article.