
Abstract
The concept of online learning has witnessed an increase in the higher education sector, where enrolment rates in online courses have significantly grown in recent years. According to the literature, one of the critical components of quality online education is to ensure learner engagement. In short, the need to effectively measure learner engagement is imperative to determine the performances and the successful achievements of learners. In this research, the aim was to understand the relationship between students’ engagement in an online module with their overall performances by analysing students’ learning activities in an online module. Three measurable indicators were identified and considered relevant within the current research context and based on the available data, and from research literature for assessing learner engagement within the module. These were (i) the number of completed learning activities; (ii) importance level (as per course outcomes) of completed learning activities; and (iii) activities requiring platform presence. It was found that there is a significant but weak positive correlation between the engagement of students in the online module and their performances in the final learning activity. It was further observed that when continuous learning activities were considered, there was a very strong positive correlation between engagement and performances. In general, the average engagement level of students was significantly higher for good performers as compared to low performers. Similarly the mean performance of highly engaged students was significantly better than those with low engagement levels.
Keywords
Introduction
ELearning encompasses a variety of headings, including computer-based learning, internet-based education and online learning, and includes the use of e-books, social network platforms, audio-visual technologies and digital broadcasting networks (Chawinga and Zozie, 2016; Daniel, 2014; Lee and Duncan-Howell, 2007; Siemens, 2012). Digital technologies are evolving at a rapid pace, coupled with a constant gain in momentum of distance and online education through cross-border developments, transnational delivery and the international franchising of higher education, which has led to the phenomenon called distributed learning (Santally, 2016). Allen and Seaman (2013: 4) reported around 6.7 million students taking at least one online course in the United States. Consequently, the evolution in education technology has contributed to improve learning process through e-Learning environments, where learners can have better control over their learning pace and the sequence of their learning experiences (Jung, 2001). Rennie and Morrison (2013) noted that technology can remarkably influence learners’ process of constructing knowledge and can assist in motivating them to go deeper into any sources of information they might be presented with. Hence, there is a need to address different perspectives to provide the learner with a quality online learning journey.
In this research, the aim was to understand the relationship between students’ engagement in an online module with their academic performanceby analysing existing data about students’ learning activities. This was not an experimental study per se as the module was run in a real teaching and learning context. Quantitative data related to 1105 students were analysed. The students were registered on an online module named “Educational Technologies” from five different disciplines Engineering, Agriculture, Social Studies & Humanities, Science and Law & Management. Based on data available, and that could be retrieved at the time of the study, three measurable indicators were identified and considered essential, as justified from relevant literature, for assessing learner engagement within the module namely (i) the number of completed learning activities; (ii) importance level (as per course outcomes) of completed learning activities; and (iii) activities requiring platform presence. The module was offered as a General Education Module (GEM) to first-year students online through the Moodle eLearning platform using an activity-based learning design approach (Santally et al., 2012).
Literature review
The concept of online learning has witnessed an increase in the higher education sector, where enrolment rates in online courses have significantly grown in recent years. This increase is greatly influenced by the uptake of MOOCs as a sustainable initiative for offering a large number of online courses to large numbers of learners in a flexible mode. The term MOOC was introduced to describe an open online course which was designed by George Siemens and Stephen Downes (Cormier, 2008). They wanted to do an experimental course on ‘Connectivism and Connective Knowledge' by delivering open course contents and making them easily accessible to attract a mass of learner participation from across the world (Siemens and Downes, 2008). Online courses with massive number of students usually generate a lot of data related to educational processes and learning pathways from each individual student. They consist of learners' activities, participation and contribution, and they are significant collection of data that emerged from learners' input on eLearning platforms. Therefore, it is important, that these data do not remain only for the purpose of archiving, but rather they could be useful and relevant to improve learner experience in educational settings (Johnson et al., 2011; Retalis et al., 2006). As a consequence, these data can be used to measure and capture learners’ online experiences and thus, the capacity to incorporate measurement techniques gives rise to big-data analytics (Siemens and Long, 2011). Basically, learning analytics was rooted from big-data analytics, in the idea of analysis of large volumes of data. Consequently, the concepts of educational data mining and learning analytics emerged in order to delve further into data that are stored on different online learning platforms and systems with the main goal to help improve learning experiences and prevent drop-outs in many cases (Phillips et al., 2012; Rienties et al.,2017). Researchers on learners’ retention (Credé and Niehorster, 2012; Marks et al., 2005; Richardson, 2012) have suggested that learners’ academic performances can be predicted when the outcomes of learning analytics are applied and thus, prediction can potentially help improve learner retention. Similarly, Rienties et al. (2016) supported the fact that learning analytics can be used to help investigate on learner experience and make actionable interventions when needed.
There is evidence of research in online learning which has demonstrated some benefits of online courses over traditional classroom-based delivery (Maki and Maki, 2007; Neuhauser, 2002; Robertson et al., 2005; Zhao et al., 2005). However, other comparative empirical studies carried out (Allen et al., 2002; Chipps et al., 2012; Tomlinson et al., 2013) revealed a slightly higher level of satisfaction of students with respect to courses being on traditional mode of delivery. Findings from Keramidas (2012) also revealed that online students find it difficult to do time management and meet deadlines for activities, compared to traditional face-to-face students. Although there has been an increase in the rate of enrolment in online learning, the high dropout rate has also become a concern for many institutions (Park and Choi, 2009).
Robertson et al. (2005) have reported positive results for online learning effectiveness, after examining the perceived quality of learners’ learning experience, in comparative studies related to the effectiveness of online versus on-campus face-to-face courses. Online learning can be either inside or outside the classroom. Chawinga (2016) reported in his findings that microblogging using Twitter as an online platform enhances teaching and learning. It was asserted by researchers that Twitter as a pedagogical tool promotes communication and learning among students, especially among those who are hesitant to speak in a traditional face-to-face environment, to voice out their opinions (Chawinga, 2016; Menkhoff et al., 2014). However, Veletsianos (2012) postulated that Twitter was not a pedagogically relevant platform. Furthermore, Bosch (2009) reported that Twitter is of distracting nature where students spend unproductive time tweeting and deviate their attention from focussing on their studies. The delivery medium such as Twitter, Facebook or Moodle is not really the concern, as the challenge has shifted to exploring strategies and initiatives to enhance online teaching and learning (Levy, 2008; Young, 2006). Certainly, this raises an interesting question on the models and approaches to be used to support quality teaching and learning online (Santally et al., 2012). Santally and Senteni (2004) defined the occurrence of successful learning in an online module as a three-phased activity consisting of a knowledge acquisition, knowledge application and knowledge construction through reflective practices. Dixson (2015) advocated for similar approaches by using concepts of the observational (learn-by-reading) and application (learn-by-doing) learning behaviours. It is important to further evaluate how to enhance online teaching and learning, and there is a need to address different perspectives to provide the learner with a quality online learning journey. One of the critical components of quality online education is to ensure learner engagement (Robinson and Hullinger, 2008; Sinclair et al., 2017). There are different definitions for learner engagement (Richards, 2011).
Learner engagement refers to the effort the learner makes to promote his or her psychological commitment to stay engaged in the process of learning in order to acquire knowledge and build his or her critical thinking (Dixson, 2015). It is also associated with the learner’s feeling of personal motivation in the course, which keeps the individual active in order to interact with the course contents, tutors and peers respectively. In short, learner engagement is an essential element to keep learners motivated and help them achieve learning goals (Kehrwald, 2008; Shea et al., 2006). While Kuh (2003) relates to learner engagement as being the energy and time learners dedicate to their educational activities, Richards (2011) stressed that meaningful learning occurs when learners are actively engaged. There are different models to measure learner engagement in learning contexts. Kuh (2003) developed the National Survey of Student Engagement (NSSE) benchmarks to evaluate students’ engagement through their skills, emotion, interaction and performance, applicable mainly to the traditional classroom settings. Another model relevant to the classroom environment is the Classroom Survey of Student Engagement (CLASSE) developed by Smallwood (2006). The Student Course Engagement Questionnaire (SCEQ) proposed by Handelsman et al. (2005) uses the psychometric procedure to obtain information from the students’ perspective in order to quantify students’ engagement in an individual course. Roblyer and Wiencke’s (2004) proposed the Rubric for Assessing Interactive Qualities of Distance Courses (RAIQDC) which was designed as an instructive tool, to determine the degree of tutor-learner interactivity in distance learning environment. Dixson (2010) developed the Online Student Engagement (OSE) scale model using the SCEQ model of Handelsmann et al. (2005) as the base model. It aimed at measuring students’ engagement through their learning experiences, skills, participation, performance and emotion in an online context. Dixson (2015) validated the OSE using the concept of behavioural engagement that is comprised of what was earlier described as observational and application learning behaviours. Dixson (2015) reported a significant correlation between application learning behaviours and OSE scale and a non-significant correlation between observation learning behaviours and OSE.
Lauría et al. (2012) supported the fact that the number of submitted assignments, posts in forums and completion of online quizzes can quantify a learner’s regularity in MOOCs. A study using descriptive statistics has also reported that regularity and persistence in learning activities are related to learner engagement and successful performance (Greller et al., 2017; Kennedy et al., 2015). This indicates that when learners are encouraged to revisit and revise their learning activities more than once and they persist in their effort to learn, they develop their learning skills effectively which is also associated with their engagement and success in the course. In addition, Boroujeni et al. (2016) quantifies learner’s regularity in MOOCs as those learners who are engaged in planning the learning activities assigned to them. The regularity of their participation and contribution are related to their performance, and this determines their chances to succeed in MOOCs (Nawrot and Doucet, 2014).
A study on learner engagement revealed that the completion of students’ coursework, including discussion exercise, academic achievement, grades and MCQs, can be used as a quantitative method to evaluate learner engagement (Huei, 2014). In line with this, results from Gerber et al. (2013) revealed same and evidence has shown that learners’ coursework submissions occur as a result of academically engaged learners. Although coursework is presented in multiple forms in online courses, they are all explicitly driven by and are of relative importance of the overall objectives of the course (Suskie, 2010). Therefore, learner engagement can also be measured by the completion of coursework whose importance level is aligned with the course learning outcomes in general. Measuring learner engagement is also about exploring those activities that require online or platform presence (Anderson et al., 2014; Kop, 2011; Swan and Shih, 2005). Those online activities can be in the form of participation in discussion forums, wikis, blogs, collaborative assignments and online quizzes which require a level of involvement from the learner. Research has demonstrated that activities that encouraged online and social presence, enhanced and built learner confidence and increased performances are key factors in engagement (Akyol and Garrison, 2011, 2014; Anderson et al., 2014; Dixson, 2015; Kop, 2011; Richardson and Swan, 2003).
Research context and methodology
The aim of this research was to investigate whether there is a correlation between students’ engagement and their academic performances in the online module on Educational Technologies. In this context, the current study therefore addresses the following the research questions:
What is the relationship between students’ engagement and their academic performances in an eLearning environment? Is there a significant difference between mean performances of students within different engagement levels? Is there a significant difference between mean engagement of students within different performance levels (high, average, low)?
The following hypotheses related to the above research questions were developed and tested.
Hypothesis #1
H0: There is no relationship between engagement levels of students and their performances.
Hypothesis #2
H0: There is no difference between mean performances of students with respect to engagement levels.
Hypothesis #3
H0: There is no difference between mean performances of students in the final learning activity as compared to the cumulated average marks obtained in the learning activities (1–8).
Hypothesis #4
H0: There is no difference between mean engagement levels of high, average and low performers.
The module was offered as a General Education Module (GEM) to first-year students online through the Moodle eLearning platform using an activity-based learning design approach (Santally et al., 2012). It did not follow the classic eLearning models where learner online interaction patterns (such as login frequencies, number of pages viewed online or number of posts on online discussions) were the key elements to determine the regularity and engagement of a learner in online modules such as MOOCs. The main goals were to promote and inculcate (i) a self-learning culture among students, (ii) development and acquisition of practical competencies and (iii) higher-order cognitive skills. The focus was on the development specific competencies through an outcome-based approach where the module was structured as a set of sequential learning activities. There were eight learning activities in the module and a final assessment activity which counts as the overall performance achievement of the student within this study as the dependent variable.
The data subjects
Data related to learning activities carried out in the module for 1105 registered first-year full-time students were analysed. The module which was offered online to students spanned over one academic year consisting of two semesters of 15 weeks each. The students came from different disciplines namely Science, Engineering, Law and Management, Agriculture and Social Studies and Humanities. The module was facilitated by seven tutors as students were divided into groups ranging from 130 to 160 per groups. The role of the tutors was mainly to act as a facilitator for the learning process, and to mark learning activities and to provide feedback to the students.
Data collection and retrieval
The module was hosted on Moodle where the students’ activities such as forum posts, submission of assignments and input of marks and feedback by tutors are kept. The data were retrieved through querying the Moodle Database and from student achievement records exported to Excel formats. Once the raw data were retrieved, grouping and classification was carried out as per the requirements of the study. Outliers were identified for further analysis. Incomplete data sets were further refined and irrelevant data sets or inaccurate ones were discarded. Out of the 1105 records, 44 have been discarded due to the fact that the students had completed less than three activities and did not do the final assessment activity. Appropriate scaling and transformation processes were carried out with respect to the performance marks and for the appropriate computations of the engagement value.
Ethical and legal considerations
During the course of this research, we have ensured to comply with the appropriate data protection laws and regulations. No personal data were processed in such a way that it would reveal the identity of the students or which would be in contradiction with legal and ethical provisions. We have ensured that all data have been anonymised, depersonalized and used under modified attribution. For instance, we removed all names and student identification numbers were altered so as not to give any hint or indication of the identity of the student concerned.
Methods
In this study, three measurable indicators were identified and considered essential, as justified from relevant literature (Anderson et al., 2014; Gerber et al., 2013; Lauría et al., 2012; Suskie, 2010) for assessing learner engagement as follows:
No of completed assignments Importance level (as per course outcomes) of completed assignments Activities requiring platform presence
The focus was mainly on application learning behaviours in line with the findings of Dixson (2015). However, the OSE and SCEQ are mainly self-reporting assessments of students from their perspective. Given the nature of this research, a self-reporting process could not be adopted as the study was carried out much after the module had been run. However, a quantitative model is developed based on the most appropriate indicators for which data could be retrieved but which were aligned to OSE and SCEQ components were devised.
To validate the indicators, a focus group discussion of seven tutors on the module was organized to discuss and agree on how these indicators might serve as reliable means of measurement, as well as to define the scale, in terms of a numerical value, to allocate to each indicator given the specific nature of this module. There was a general consensus that these three indicators could reasonably be considered to provide a reliable indication of learner engagement in that module. Each indicator was examined and shown how it could contribute to the evaluation of learner engagement and effective participation. Each learning activity was marked over 10 marks as a standard approach and a scaling was then applied with respect to the expected effort needed from the student and the relative importance of the learning activity with respect to the achievement of the learning outcomes. Activities 1 to 4 were then scaled down to 25% while the activities 5 to 8 weighed for 75% of the overall accumulated marks as shown in Table 1.
Description of learning activities.
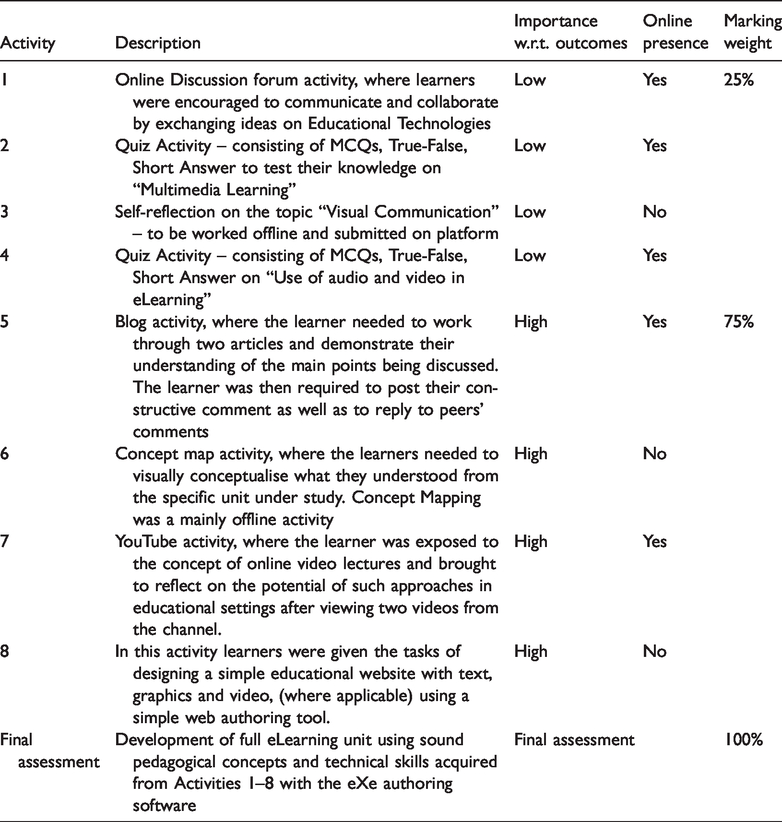
The objective of lower weighted activities was to assess lower-order cognitive levels, while the higher percentage attributed activities were designed to evaluate higher-order cognitive levels (Chan et al., 2011; Scouller, 1998; Ventouras et al., 2010). Since the number of completed assignments was deemed a good indicator for assessing the likely engagement level of a student, it would not however be fully accurate only to take the number of assignments alone. Since the assessment of the learning activities were mainly formative in nature and counted as continuous evaluation process, the quality of the work of the student which would be reasonably demonstrated by the mark achieved would also provide a good insight with respect to the effort input by the student. Therefore, the tutor team decided to introduce a variable factor related to the mark achieved by the student over 10 for the learning activities.
It was also important to take into account the importance level of the learning activities as discussed above with respect to the weightage to be allocated. The reasoning was that a student who has completed only four lower-order learning activities as compared to one who completed only the higher order learning activities cannot be considered to have demonstrated the same level of engagement and effort in the module. Similarly, the same scaling was applied for the activities that required online platform presence. For this component, the formula had to be broken in two parts as out of the five activities requiring platform presence, three were of the lower order ones while two were of the higher order ones. The tutor team therefore came up with the following equation for the calculation of the overall engagement of a student within the module.
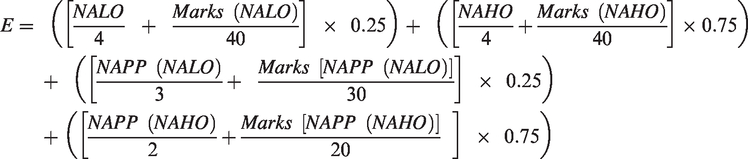
E is the overall engagement value computed for each student.
NALO = No. of activities of Lower order completed over 4.
NAHO = No. of activities of Higher order completed over 4.
Marks (NALO–NAHO) = Total marks achieved by the students in the NALO or NAHO activities over 40.
NAPP (NALO–NAHO) = No. of activities completed requiring platform presence falling into NALO or NAHO.
Marks [NAPP(NAHO–NALO)] = Marks achieved in either NAHO or NALO activities requiring platform presence.
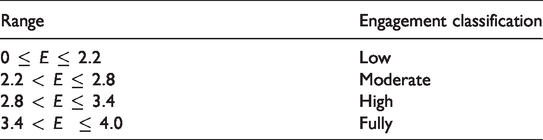
The overall engagement value is therefore computed as a linear function of the number of activities completed, importance level of activities (lower order or higher order), and the activities that require platform presence. Based on the formula above the engagement value will range from 0 (for someone who has not done anything in the course, e.g. drop-outs) to a maximum value of 4 (ideal situation for a student scoring full mark in all the activities). Both extremes are unlikely as drop-outs were not considered when the data were processed, and no student scored full marks throughout. Table 2 illustrates the range that was established and the relevant classification to group the students. The tutors used the existing grade system classification as a baseline to set the four levels of engagement for the module.
Classification of engagement level of students.
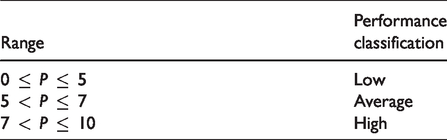
The students were also classified as high, average and low performers with respect to their marks (P) obtained (i) in the final learning activity and (ii) in the total cumulative average marks for learning activities (1–8). The classification was devised to be in line with the grading system adopted for the module and is illustrated in Table 3.
Classification of student performances.
Assumptions and limitations of the research
In this research, the data related to students’ activities in one online module at one university were used. Despite the high number of students enrolled, the study is contextually relevant while being also restrained within the institutional level only. Furthermore, the students, despite coming from different fields and areas of study, are local students who come from the same secondary schooling system. While this ensures homogeneity to a good extent within the population under study, there is a need to be cautious with respect to generalisation of the findings. This study was also not an experimental design but analysed real data collected in an unplanned setting and the researchers could only study and use data that were available. For example, records related to frequency of access and web pages clicked upon by the students were not available which would have been helpful to analyse data from an additional perspective. Furthermore, given that there were marking schemes, it was assumed that the tutors’ marking styles was consistent.
Results and findings
Distribution of data
Figure 1 illustrates the distribution of the engagement variable computed as per the formula above for the data subjects, their performances in the continuous learning activities and their marks distribution for the final learning activity.

Histograms to show the distribution of student engagement and performance values.
It can be observed from Figure 1 that the student engagement histogram is left skewed and is not likely to follow a normal distribution. A test of normality to calculate the Skewness (S = −2.17) and the Kurtosis value (K = 4.4) revealed that the distribution cannot be assumed to be normal. Therefore, for the engagement variable, a non-parametric testing was conducted using Kendall’ method. On the other hand, the normality test revealed that the two variables overall performance and the continuous learning activities marks could be assumed to be normally distributed.
Correlations between engagement and performance
An X–Y scatter diagram (Figure 2) was devised in Microsoft Excel with the line of best fit and the regression value R2 computed. The low value of R2 is noted, suggesting that engagement alone may not provide an accurate prediction of each individual student performances as each student is different from a number of attributes. From Figure 2, a rather dense concentration of the data can be observed when the engagement values are between 3 and 3.5.
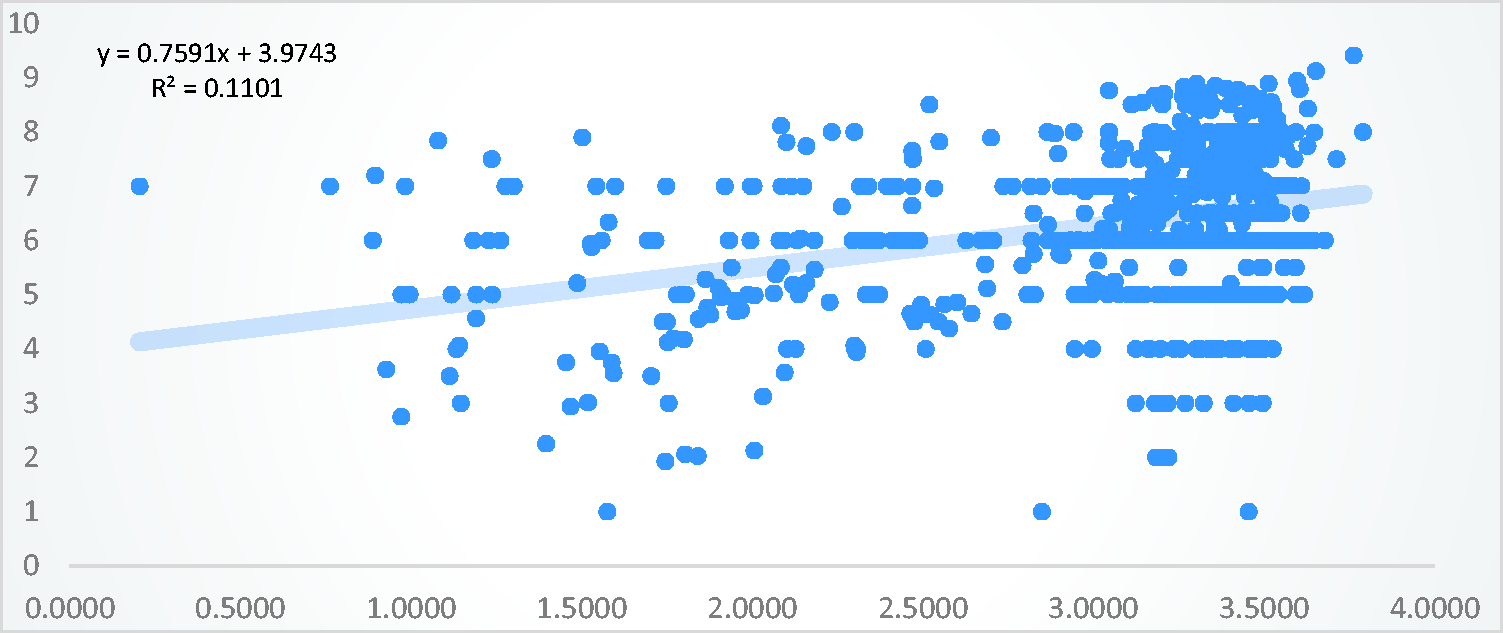
Scatter plot of engagement (x-axis) versus performance (y-axis).
The correlation coefficient between the engagement level (E) with the mark in the final assessment was then calculated. It was found that a very weak positive correlation existed between the engagement level of the students and their performance in the final assessment activity (rb = 0.158, N = 1061, p < 0.01). This observation confirms the trend shown in the scatter plot in Figure 2 which also explains the weak correlation due to the highly scattered data along the best fit line.
The nature of this module was such that students’ learning was continuously being assessed throughout, through learning activities specifically designed to address the expected learning outcomes. As such each of these continuous learning activities were marked and feedback given to students. Therefore, it was deemed important to further explore how the engagement level would impact on the total accumulated marks of the students in the eight learning activities. While it was obvious that the more activities that a student carries out, and assuming that he will not be getting zero, the tendency would be that the cumulated marks would increase. However, knowing the strength of the relationship would be important as a factor to predict the performances of students in modules where continuous assessment plays an important role. It was found that a very strong positive correlation existed between the engagement level of the students and their cumulated marks average in the eight learning activities (rb = 0.847, N = 1061, p < 0.01). This observation confirms the trend shown in the scatter plot in Figure 3.
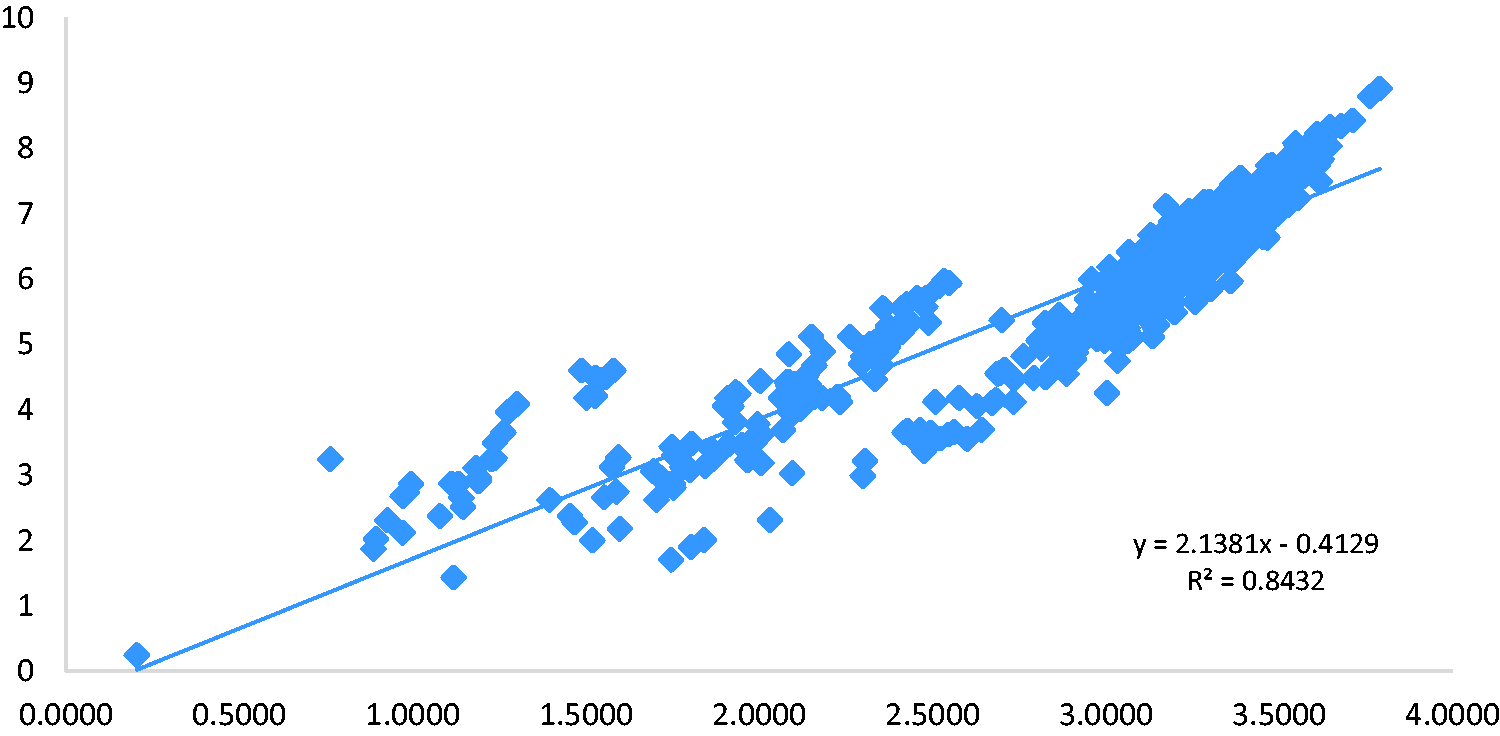
Scatter plot of engagement levels versus cumulated marks average in learning activities.
To further understand the relationships that might exist and their respective potential influence of the final assessment activity mark, the Pearson correlation of the total cumulated average marks of the first eight activities was carried out with the final assessment activity’s marks. Furthermore, the additional correlation coefficients were computed for the cumulated marks average in activities classified as NAHO and NALO respectively with respect to (i) the final activity assessment mark and (ii) the cumulated average marks for the learning activities (1–8). The results are represented in tabular form in Table 4.
The correlation coefficients of marks in learning activities with (i) the final assessment marks and (ii) the cumulated average marks in learning activities 1–8.
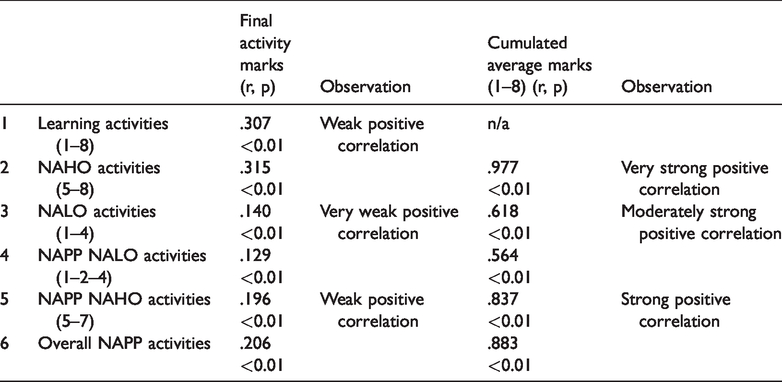
From Table 4, with respect to the first part (i), it is observed that the cumulated average marks in the continuous learning activities have a weak positive correlation with the final activity marks (1) and (2). For (3) and (4) related mainly to the activities of lower order, we find very weak positive correlation. The correlation coefficient is very near to 0 which suggests that the marks achieved in those activities will not necessarily be accurate enough to predict for the performance in the final marked activity. This is also an indication that the activities of higher order have a greater influence on the correlation when we compare (1) and (2) and then (5) and (6) in relation to (3) and (4).
With respect to the second part (ii) of Table 4, it is established that the NAHO activities have a higher influence on the cumulated average marks for the learning activities (1–8) as illustrated by the Pearson’s correlation coefficient (r= 0.977, p < 0.01, N = 1061). Conversely NALO and NAPP NALO activities have a moderately strong positive relationship while NAPP NAHO activities have a strong positive relationship with the cumulated average marks. The findings here are consistent with what has been already illustrated in the scatter plot in Figure 3.
The next step was to understand the relationships between the respective engagement level classifications as per Table 2 with the classification of students in terms of the performance level in the final learning activity as per Table 3. Given that the engagement variable did not follow a normal distribution, Kendall’s test was carried out rather than Pearson’s. Table 5 illustrates the results.
Correlations between levels of engagement and performance.
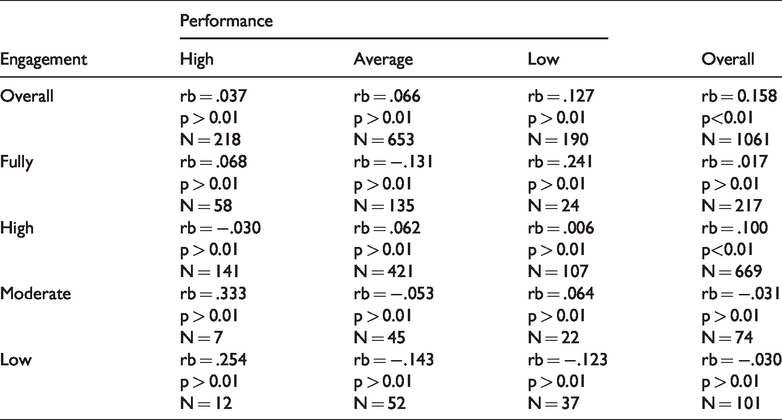
The observations in Table 5 suggests that the correlation between different levels of engagement and level of performances in the final learning activity is very weak and this is in line with the other findings reported in Table 4 and in the scatter plot (Figure 2) respectively.
Comparing means and analysis of variance
After the calculation of the different correlations above, an analysis of means using one-way ANOVA is carried out to further analyse the available data. With respect to hypotheses #2 and #4, the observations are illustrated in Figure 4.
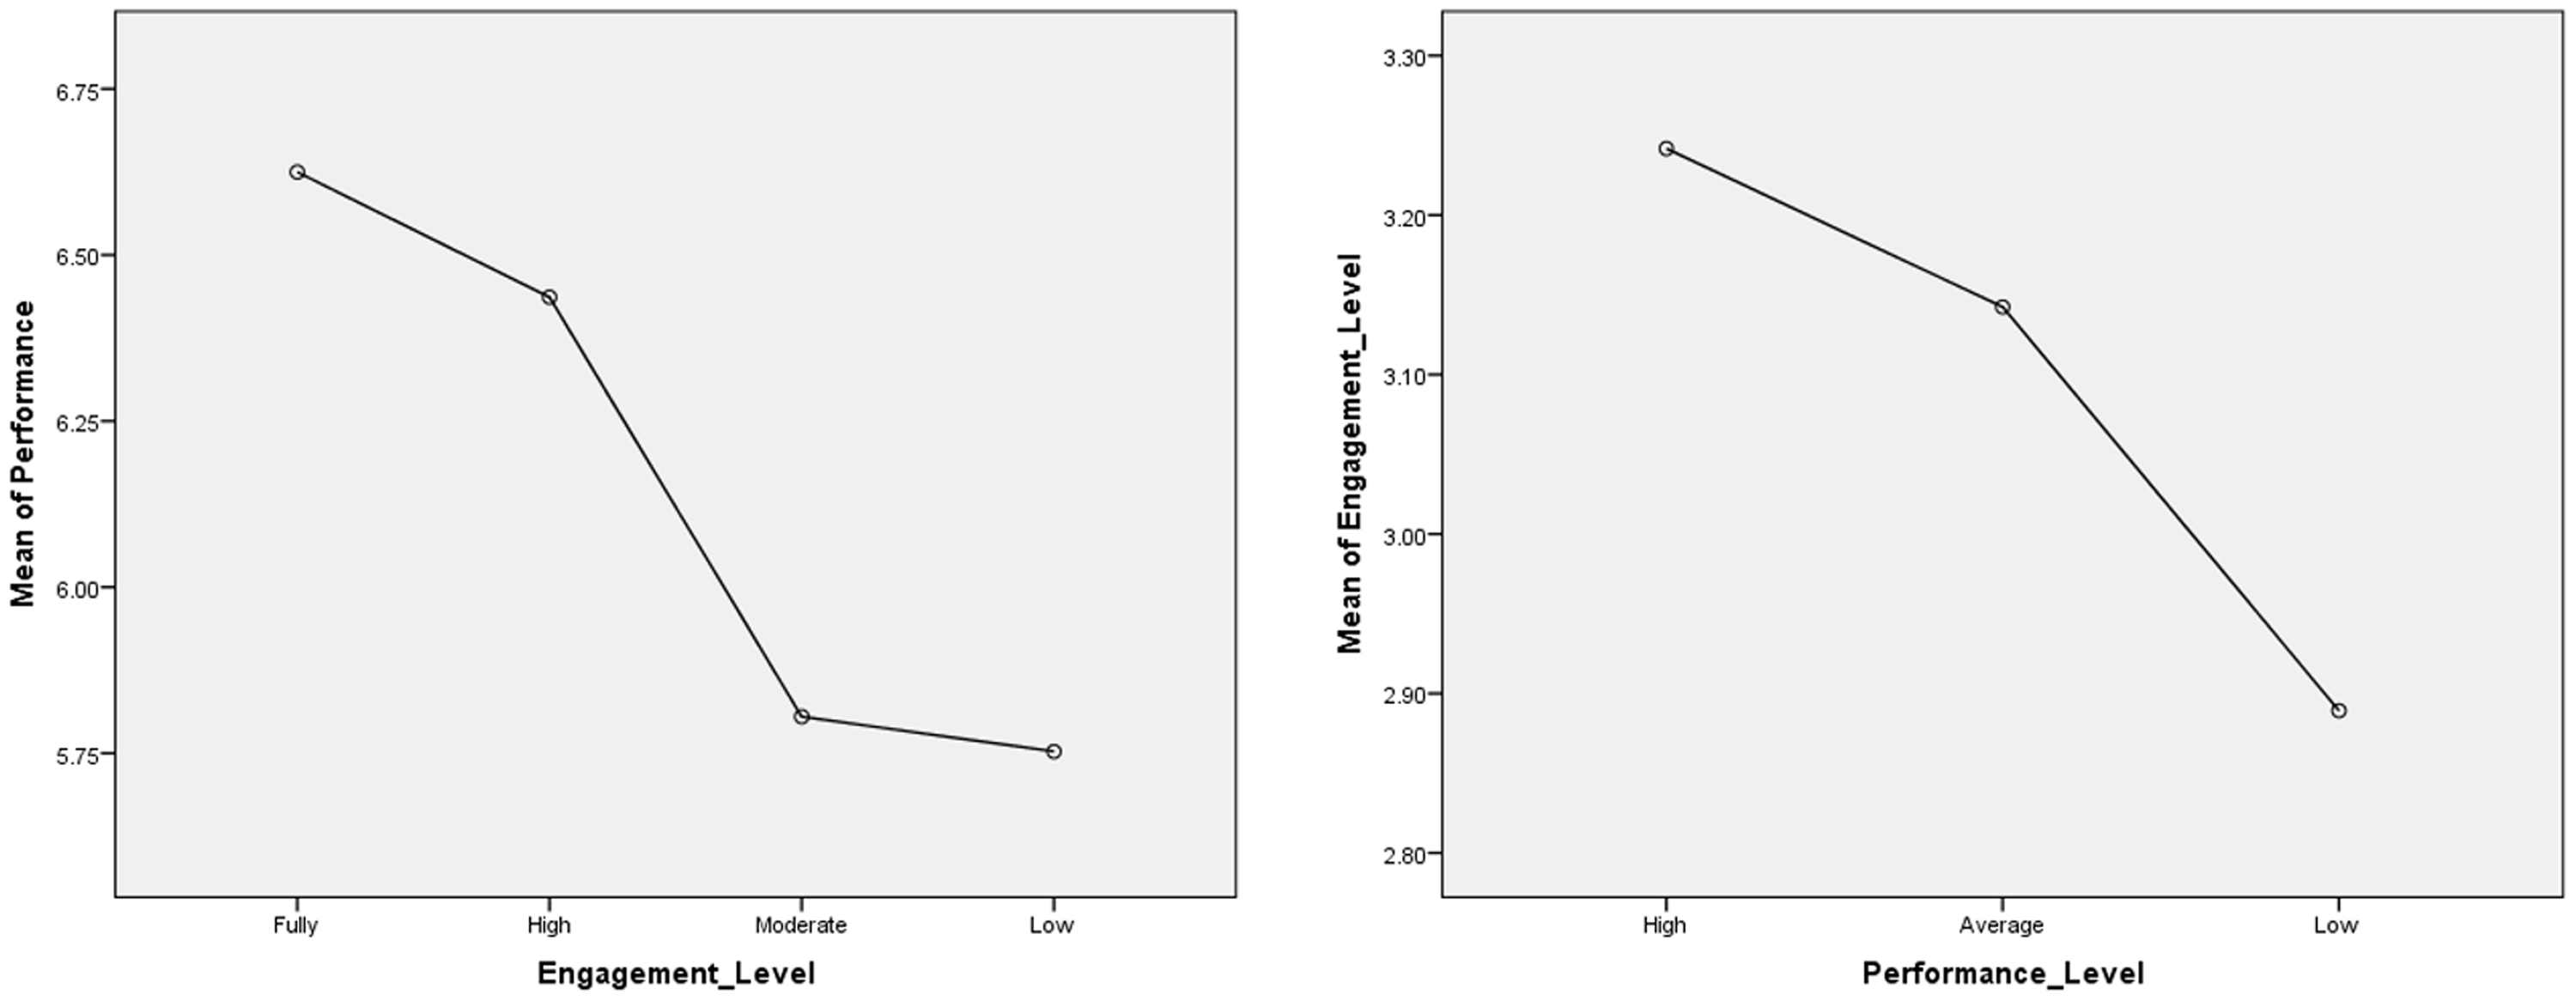
Average performances for different engagement levels and average engagement for different performance levels.
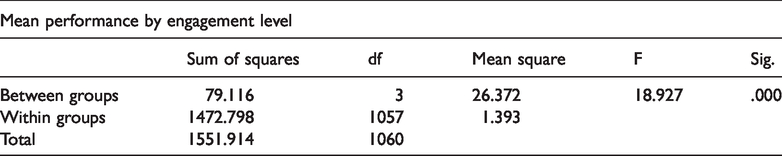
The one-way ANOVA revealed that there were significant differences in mean performance of students falling within the different engagement levels (fully, high, moderate, low) as shown in Table 6 (p < 0.01) at 99% confidence interval. However, no significant differences were found in the mean performance between those falling in low and moderate engagement levels (p = 0.991).
One-way ANOVA for marks by engagement level.
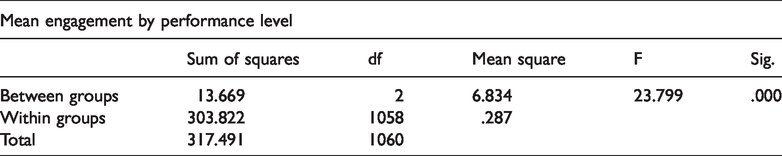
With respect to engagement by performance level, there were significant differences of mean engagement value between high, average and low performers (p < 0.01) as per Table 7. The illustrations in Figure 4 fit well with the distribution observed in the scatter plot in Figure 2.
One-way ANOVA for engagement by performance level.
Finally, for hypothesis #3, a paired t-test (N = 1061, µ1=6.3658, µ2=6.2531) revealed that there was no significant difference (p = 0.95) between the mean marks for the cumulative average marks in learning activities 1–8 (continuous assessment) with respect to the marks in the final assessment learning activity.
Discussion
From the findings of the research, it was established that students’ engagement levels in the online course throughout could give broadly an indication of whether they will do well in an independent learning activity. From a total of nine learning activities, we can confidently infer that the majority of those who had a high engagement level in the eight previous activities would do as well in the final learning activity (activity 9) provided that (i) they attempted it and (ii) they input decent effort in the respective specific activity. This is in line with findings of other studies as reported in the literature (Anderson et al., 2014; Greller et al., 2017; Huei, 2014). It was also noted that there were students who would do quite well in the first eight learning activities and they will then perform below average in the final learning activity. Others were not adequately engaged throughout the course, doing the minimum or just above the minimum, but would perform quite well in the final learning activity. The first is explained by the fact that in the real-world setting the continuous learning activities were also counted towards the final overall mark for the module. The importance of continuous assessment in online courses has been illustrated in the scatter plot (Figure 3) showing a strong positive correlation between engagement and relative performance and is in line with other research findings (Gerber et al., 2013; Holmes, 2018; Kop, 2011).
The above might be explained by the fact that they would at the final stages of the academic year concentrate in other modules of higher importance in their curriculum than a General Education Module. On the other hand, those who did not perform quite well in the first eight learning activities,still felt that the final learning activity could either contribute in helping them achieve the minimum or improve their overall mark in the module. Therefore, in line with what was observed from the scatter plot (Figure 2), a lack of engagement in some activities might not necessarily result in low mark in another independent activity, as engagement might encompass other factors as highlighted by Dixson (2015). Engagement may further be influenced by other factors from the behavioural or observational states and the affective side as highlighted by the Student Course Engagement Questionnaire (SCE) model (Handelsmann et al., 2005). There is a need therefore to capture these states throughout the learning duration to see if variations at these levels may impact specific engagement level or mark achieved within a specific learning activity. This can be done in online learning through gathering of regular feedback by students through the use of reflective learning journals.
Finally, the design of the module was an important factor in explaining the results and findings. The module was designed using the activity-based learning approach which is more inclined towards constructivist learning rather than the behaviourist model of learning. Students had to demonstrate their achievement more through what Dixson (2015) called application learning behaviours (learning-by-doing) rather than observational learning behaviours. The final learning activity was just a learning activity as the other continuous learning activities, rather than a formal written examination per se. Despite the significance of the correlation between engagement and performance in the final learning activity, the very weak nature of the association between the two variables highlighted the fact that in online learning, the classical model of knowledge acquisition mainly through observational learning behaviours present some limitations to predict potential outcomes for students in a final examination as also confirmed by Holmes (2018) and Greller et al. (2017). As proposed by Santally and Senteni (2004), course designers therefore need to ensure that the three key phases of knowledge acquisition, knowledge application and knowledge construction are addressed while designing online courses. This will help to foster an environment where student engagement if properly modelled can help to improve learning outcomes through better performances via smart learner scaffolds and personalized support.
Future work
The findings reported in this paper presented a snapshot of the available data with respect to the association between student engagement as defined within the context of this research in the online module. Based on the available data and findings so far, there is ground to further engage in mining of the available data to either consolidate the findings and/or to look for additional interpretations and patterns in the data. There is a need to understand the feedback of students with respect to their satisfaction levels to see if there is any inference that could be made from the affective side to further explain the findings or to come up with new observations.
Conclusion
The findings of this research align with the existing body of work to establish that student engagement is an important factor that contributes to the success of students on online courses. However, there are different models of students’ engagement based on the teaching and learning context and the preferred learning design when it comes to online learning. In the context of activity-based learning designs as is the case in this study, the application learning behaviours become significant elements to contribute to the calculation of student engagement. It is also obvious that in such contexts, the learning activities that count as continuous assessment are relevant factors to take into account while calculating the effective engagement of the student. Finally, the very strong positive correlation between engagement and continuous learning activities as compared to the very weak positive correlation between engagement and the final learning activity mark suggests that engagement in constructivist learning environments might be better predictors of success than engagement classic behavioural e-learning models.
Footnotes
Declaration of Conflicting Interests
The author(s) declared no potential conflicts of interest with respect to the research, authorship, and/or publication of this article.
Funding
The author(s) received no financial support for the research, authorship, and/or publication of this article.