
Abstract
Animation can be used for various purposes such as for procedural and motor skill learning (i.e., dance, sports, and motor rehabilitation). In the context of visual design, this study explores the possible influence of realism (levels of visual detail) in animation at the cognitive stage of motor skill acquisition. Students (N = 64) with low-prior knowledge about tennis were randomly assigned into three groups to view either 2D schematic, 3D stylised, or live-action instructional video. Their performance on the knowledge test, learning time, efficiency score, confidence level, preference, and open-ended responses were captured for analyses. Based on the findings, despite most preference towards live-action video, there was no statistically significant difference regarding cognitive learning performance among learners from different treatment groups. Hence, animated digital characters of various levels of realism can still be incorporated for motor skill acquisition especially in instructional animations, simulations, video games and virtual reality.
Introduction
Visual rendering issues are important to study and to be seriously approached as it has potential roles to motivate, engage and impact learners (Gulz and Haake, 2006). Also, there was also a preconceived notion by the industry and artists that ‘more realism equals to higher believability’ (Wages et al., 2004). Indeed, Wages et al. (2004) stated that the realistic factor was one the main selling points to attract customers to purchase their games or watching the animation or film. However, when it comes to learning, does it need to be realistic or believable? From the entertainment industry point of view, speculations were being made as for whether to invest resources in creating photorealistic characters since these characters could generate negative reactions (McDonnell, 2012). McDonnell (2012) provided the example of the highly realistic animated movie, Polar Express (2004) being unfavourable as compared to the stylised animated movie, The Incredibles (2004). The researcher also added that choosing a suitable rendering style of digital characters in various application domains can be difficult. Furthermore, deciding to use realistic rendering characters could be perilous since it could increase the production cost and it runs the risks of generating negative audience reactions (Geller, 2008; Levy, 2004). This effect may be the reason production studios chose cartoon (two-dimension style animation) rendering style over realistic human rendering (three-dimensional style animation) to portray their characters (McDonnell et al., 2012). Besides that, it is found that many well-received instructional animations utilised two-dimensional more than three-dimensional visual style (Lucas and Rahim, 2017).
In recent years, there are a considerable number of studies comparing animation over static graphics with a conclusion that learning via animation is useful in various cognitive processes such as remembering, understanding, applying, or analysing (Berney and Bétrancourt, 2016). Based on a meta-analysis study, visually realistic animation can be suitable for motor skill acquisition (Höffler and Leutner, 2007). Unfortunately, the effect of different levels of visual details (realism) towards learning is still inconclusive (Ruiz et al., 2009). Ruiz et al. (2009) suggested that it might be due to extraneous cognitive load and decrease germane cognitive load. Despite those various comparison studies of two-dimensional and three-dimensional visuals, few studies (Sharma and Horgan, 2012; Smith et al., 2012) have compared the computer generated visual representations with real imagery or live-action videos. Based on their study, the animation was as effective as live-action depicting relevant scenarios related to classroom management. This study extends the exploration by investigating the effectiveness of varying degrees of realism in dynamic visualisations for a different form of learning objectives (Scheiter et al., 2009): motor skill learning.
Motor skill learning with animation
Two meta-analysis studies (Berney and Bétrancourt, 2016; Höffler and Leutner, 2007) revealed that animation has particular advantage over static in term of procedural learning such as motor learning. It has been shown that animation can be useful in learning human movement tasks such as surgical procedures, assembly tasks, origami tasks, knot tying, first-aid procedures, puzzle constructions, and sports technique (van Gog et al., 2009). In addition, a conceptual design framework was proposed in guiding the creation of instructional animation for psychomotor learning (Lucas and Rahim, 2015). Since animation has particular versatility over static in procedural tasks, many applications of animation can be seen in sports training videos, exercise mobile apps, martial arts mobile apps, and rhythm games (i.e., dancing) in high-end console games. The interesting point is that these applications of animation for motor learning present their digital characters in various visual styles (i.e., flat two-dimensional graphics, three-dimensional forms, and real human actors) into a digital environment.
Ergo, this paper focuses on exploring the effect of different level of visual details (realism) at the cognitive stage of learning complex human-based body movement. The study is interested in discovering possible ways visual styles can affect novices learning a new set of complex motor movements. This paper is significant in a way that it adds to the growing body of knowledge of the application of animation in psychomotor learning. Currently, studies in comparing the effect of different level of visual details (realism) in motor skill acquisition are still lacking. Therefore, the study briefly surveyed several related theories such as cognitive load theory (CLT), cognitive theory of multimedia learning (CTML), naïve realism, and hypothesised relationship between fidelity and learning. Questions like how to optimally incorporate animation as a medium for psychomotor learning other than for entertainment also acts as an impetus for this study.
Level of visual details (realism) and cognitive load
Regarding cognitive load theory, ‘less is more’. CLT advocates reducing extraneous details to facilitate ease of information processing and memorising. The depiction of the subject matter should focus mainly on the essential aspect (Sweller, 2011; Sweller et al., 2011). Reducing unnecessary or decorative details can lessen learners’ cognitive load. By doing so, learners may be able to learn more efficiently by focusing on the salient information. Similarly, Mayer’s (2009) first CTML principle, coherence, explicates that unnecessary or extraneous information should be excluded whenever possible. Besides that, based on the theory of naïve realism, individuals have a tendency to intuitively prefer three-dimensional visual realism over the two-dimensional type of visuals assuming that viewing a more realistic version would result in better learning (Smallman and Cook, 2011). Results from a recent study have shown that, in contradiction to naïve realism, the preference towards more realistic detail does not have significant difference towards comprehension (Barnes, 2016). In retrospect, Alessi (1988) provided his hypothesis on the relationship of fidelity and learning. Alessi and Trollip (2001) opined that there is a dilemma regarding training simulations as increasing fidelity may decrease learning performance and decreasing fidelity may not allow transferability from learning. Hence, choosing the optimal balance among fidelity level, economic restraint, and time limitations would result in the most cost-effective line is essential in designing the instructional design (Alessi, 1988; Alessi and Trollip, 2001).
The quest for designing efficient and optimal visual representations is yet to be fully discovered (Anglin et al., 2004). Empirical studies that focus on the impact of two-dimensional, three-dimensional visualisations on learning are limited and inconsistent. Also, ‘both visualisation types are frequently used in education, and therefore it is important to understand which type leads to better learning outcomes and under which conditions’ (Nugteren et al., 2014: 606). Such inconsistencies might result from the use of different animations in past studies (Ploetzner and Lowe, 2012). ‘Believability and authenticity in the narrative, in particular, three-dimensional animation, is often confused with realistic representation, and realism is one of animation’s more contentious stylistic issues’ (Power, 2008: 40). However, only a few studies were conducted comparing among different types of visualisations such as two-dimensional animation, three-dimensional animation and live-action video form of visualisations. Scheiter et al. (2009) stated that direct empirical comparisons of learning with either more realistic or more schematic visualisations are lacking. In 2010, McLaughlin, Smith, and Brown posed a question: Does visual simplicity lead to higher level of learning? It is an interesting question that may have different results in different context. Varying levels of visual representations (simplified, stylised, or naturalistic) have their unique characteristics. Due to these differences, their influence toward cognition may vary. Thus, it is recommended to investigate dynamic, realistic visualisations with varying levels of visual details (realism) and addressing how these levels can be effective for different types of learners (Brucker et al., 2014).
Visual comparison studies on learning movements with animation
Several studies in the past touched on the effect of different levels of visual details (realism) on motor learning. Findings from these studies vary but interesting. In a study observing perceptual and visuomotor brain processes when viewing digital hands and real hands visuals, only the actual hand action in a natural environment activated a visuospatial network in the central nervous system (Perani et al., 2001). Perani et al. (2001) concluded that digital visualisation such as 2D or 3D computer graphics like virtual reality might not be as effective as watching the realistic visual. In another study, schematized version of mitosis was found to be superior to the real counterpart; this may be due to the visual complexity of the realistic visual of the mitosis (Scheiter et al., 2009). Realistic visuals usually contain more information than abstract visuals. However, low-prior knowledge learners may not know what relevant visuals to concentrate to learn. In a study on information salience that compared the learning process of using realistic versus point-light demonstration of ballet dance found that motor learning from point-light demonstration is quite sufficient (Rodrigues et al., 2010). Besides that, the degree of realism played no moderating roles in the effectiveness of dynamic visualisations (Imhof et al., 2011). Another study found that simplified version of the digital character (stick figure model) offered clearer object and movement recognition than a more detailed digital character (Ida et al., 2012). Brucker et al. (2014) found that there was an interaction between learners’ visuospatial abilities. Interestingly, learners with lower visuospatial abilities performed better in schematic dynamic visualisations whereas learners with higher visuospatial abilities perform better with realistic dynamic visualisations. In Barnes (2016) study, a majority of participants had a preference for higher fidelity visualisation after been given a chance to review all available stimuli. They had the initial anticipation that higher fidelity animation would be more helpful in comprehension but then realised it was not so.
The present study
In creating an animation, several components need to be considered by the animator: narrative believability, narrative coherence, scene negotiation, proto-narrative, visual design, character design, characterisation and plot, character affordance, character acting and optimising audience engagement (Power, 2008). As there are many aspects involved in creating an animation, the study focuses on the visual design aspect of the animation process. Realistic and schematic is a continuum like a spectrum; thus, it is not a binary construct (Dwyer, 1976). However, due to practically, the study focuses on three different levels of visual details (realism): 2D schematic, 3D stylised and live-action. The conceptual idea of these visual representations can be seen in Figure 1. Thus, this study investigates the visual aspect of animation design by examining the cognitive and perceptive influence of different levels of visual details on psychomotor learning.
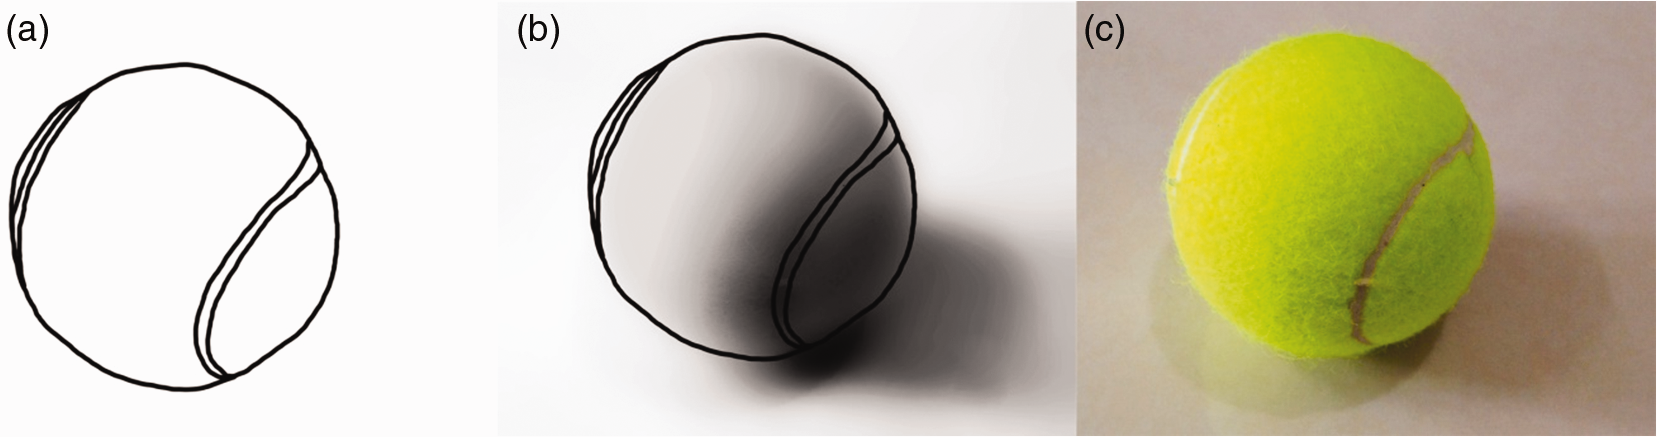
Conceptual examples of the 2D schematic (a), 3D stylised (b), and live-action (c) level of visual details (realism).
A recent study showed that the depiction of human movement in the form of animation might facilitate learning of whole-body movement, manipulative tasks, gestures, and body metaphors (Castro-Alonso et al., 2014; de Koning and Tabbers, 2013; Koning and Tabbers, 2011). However, there is a lack of empirical research in comparing the effectiveness of using two-dimensional animation, three-dimensional animation and live-action video in complex motor skill acquisition. Recent findings on the effectiveness of visual styles are relatively mixed (Marcus et al., 2013; Ploetzner and Schlag, 2013). Results on the effectiveness of two-dimensional and three-dimensional imaging in motor learning are also mixed, possibly due to the challenges of transferring complex motor skills information through three-dimensional multimedia instructional tools (Hoyek et al., 2014).
Due to these inconclusive findings, the current research aimed to fill gaps in past studies (Ayres et al., 2009; Barnes, 2016; Brucker et al., 2014; Imhof et al., 2011; Wong et al., 2009). For example, Imhof et al. (2011)’s study was testing the influence of learner’s visuospatial abilities and degrees of realism in facilitating learning of a task that requires the acquisition of non-conceptual and highly perceptual knowledge. This kind of knowledge acquisition involves understanding a continuity of movements: human-based biological locomotion patterns. The current study aimed to further investigate on one of the variables of previous studies which is the level of visual details (realism). Also, Marcus et al. (2013) provided a few suggestions for future research that will be addressed in this study. They suggested that future research could: (a) use the more discerning task to test for cognitive differences, (b) conduct a research study using computer-generated animations, and (c) utilise different learning materials and participants.
Moreover, evaluating the speed and accuracy can be used to measure the effectiveness and efficiency as it can provide a more valid basis for assessing the comparative advantages of different instructional format (Akinlofa et al., 2013) and visual styles. Lee and Shin (2012) suggested examining the effect of instruction on performance in relation to both knowledge acquisition (cognitive aspect) and retention.
Apart from the style quality studies of two-dimensional or three-dimensional visuals (Croft et al., 2014), the degree of complexity and the nature of the subject matter are also worth looking into (Smith et al., 2012). It is also suggested to explore other complex procedural motor tasks to assess the robustness of the effect of learning with animation (Garland and Sanchez, 2013). Finer-grained or more procedurally demanding motor tasks is also suggested to possibly find the effect of learning with animation more significantly because previous studies were focussing on simpler tasks such as manipulating Lego bricks, folding origami, solving puzzle ring, applying band-aids and solving knots (Castro-Alonso et al., 2015). However, it is important to note that this study does not focus on comparing realistic vs. abstract or iconic or diagram or symbolic form.
Learners with high prior knowledge would benefit more from realistic or integrated (realistic and abstract) instructive graphics (Joseph and Dwyer, 1984). In the similar study, learners with low-prior knowledge performed better as long as there were forms of instructive graphics were involved. However, the study only covered instructive statics graphics. A study that focuses on the different types of dynamic visual representations such as instructional animation, particularly for the video format, is still lacking. Studying the effect of realism on low-prior knowledge learners is important. People can acquire more information when they can relate new information to what they already familiar with (Alessi and Trollip, 2001). If participants with different prior-knowledge were mixed, the results of the finding might be more varied. It may be so because experience learners experience less cognitive load in processing information that they are already familiar with (Ayres and Paas, 2012). Learner prerequisites such as visuospatial abilities could influence the effectiveness of visualisations during a learning process (Imhof et al., 2012). The effectiveness of learning from examples can be affected by the learner’s level of expertise: low-prior knowledge learners benefit more than high-prior knowledge learners (van Gog et al., 2009). Additionally, there is evidence that prior knowledge can affect learners’ ability to comprehend information retrieved from visual representations (Mayer, 1997).
Research questions
Based on Sweller (2011)’s cognitive load theory and Mayer (2009)’s coherence principle, a learner with low-prior knowledge would benefit from the schematic. This study also attempted to fill research gaps suggested by Scheiter et al. (2009) on the lack of empirical evidence of learning with either more realistic or more schematic visualisations and by Brucker et al. (2014) on testing the effect of realism on a different domain. This study is valuable in adding empirical evidence to the capabilities of various levels of visual details (realism) in complex motor learning. It is essential that studies related to learning with animation focus the integration of perception and cognition (Lowe and Schnotz, 2014). In this regard, an attempt was made to answer research questions detailed as follows:
How different are the learning performance (learning time, knowledge test scores, and efficiency score) of low-prior knowledge learners in complex motor skills acquisition based on different levels of visual details (realism)? What are the visual preferences of low-prior knowledge learners in complex motor skills acquisition based on different levels of visual details (realism)? Why do they prefer certain visual style over the others? Overall, to what extent realism (level of visual details) was sufficient to be effective?
Methods
Participants and design
To explore the causal relationship potential between render styles and learning effectiveness at the cognitive stage of psychomotor learning, an experimental study was proposed. This study collected quantitative and qualitative data by employing a randomised post-test with control group between participants experimental design. The live-action group was the control group for this study. The observations were collected concurrently for all three groups. Purposive sampling was used to select and identify low-prior knowledge learners for this study to minimise the potential effect of individual difference. Students that fulfilled this criterion were invited to participate in the study. A description of participants via purposive sampling, study setting, instrumentations (such as materials and interactive questionnaire), study procedures, data collection and planned statistical analyses are outlined as follows.
Purposive sampling
Instead of using a pre-test, the study conducted purposive sampling to identify learners with low-prior knowledge on the subject matter of tennis. No pre-test with actual questions about the topic (tennis serve) was used to assess prior knowledge to avoid any effects of pretesting on learning performance. The justification for not conducting a pre-test is because the pre-test can create a testing effect in which ‘the act of taking the test is an instructional activity and the pre-test can create an adjunct question effect in which pre-questions can direct the learners’ selective attention during subsequent instruction’ (Mayer and Estrella, 2014: 14). As an alternative, self-rating items were used in the purposive sampling survey. The purposive sampling was done to screen potential participants of the study. Participants who satisfied certain criteria or possessed certain characteristics would be invited to participate voluntarily in the experiment. The reason for this purposive sampling was to reduce potential individual differences that might have affected the outcome because prior knowledge is an individual difference that can affect learning performance in novice- and expert-level knowledge participants (Clark and Feldon, 2014). Moreover, volunteers participating in this purposive sampling survey were asked about their experience with and exposure to tennis, the familiarity of with computers and other electronic devices to ensure that participants for the actual experimental study were comfortable and familiar with using computers.
Participants’ level of prior knowledge was assessed by the mean score of questionnaire items on a five-point Likert scale, ranging from 1 (= ‘strongly disagree’) to 5 (= ‘strongly agree’). Depending on the question items, participants who rated their answers above a mean value of 2 on the questionnaire items were not selected to participate in the study. The participants were students from International Education College (INTEC). The purposive sampling was conducted for students of American Transfer Credit Programme (ATCP) Cohort 14 on 10 October 2016. Based on Academic Office’s record, there were 280 students enrolled in the ATCP program in that cohort. The pen-and-paper-based questionnaires asked for respondents’ basic demographic information, familiarity with sports (e.g., badminton, basketball, bowling, football/soccer, squash, table tennis and tennis) and familiarity with electronic devices (e.g., smartphone, tablet PC, desktop computer, laptop, handheld console game and home game console). The questionnaires were distributed to them on that day. However, only 181 questionnaires were returned which resulted in a response rate of 64.6%.
Based on predetermined criteria, 92 students with a Male/Female ratio: 28/62 (31.11%/68.89%) were identified to be potential participants in the experimental study. After receiving the permission of INTEC, selected participants were contacted if they were still interested in participating in the study. Thus, confirmed participants were 64 students (M = 18.9 years, SD = 0.13) with a Male/Female ratio: 19/45 (29.7%/70.3%). Each participant received a token equivalent to €2.08 after completing the experimental study. Thirty-four (53.1%) reported wearing visual aids such as contacts or glasses. None reported suffering any physical impediment such as requiring a hearing aid or suffering from colour blindness. Participants’ characteristics are as follows: First, on exposure to tennis (level 1= ‘strongly disagree’, level 5 = ‘strongly agree’): ‘I know how to play tennis’ (M = 1.48, SD = 0.53); ‘I am familiar with the rules of tennis’ (M = 1.47, SD = 0.59); ‘I regularly (at least once a week) visit tennis facilities (i.e., stadium, courts, etc.)’ (M = 1.22, SD = 0.45); ‘I regularly (at least once a week) play tennis’ (M = 1.25, SD = 0.47); ‘I consider myself as a fan of tennis’ (M = 1.92, SD = 1.07); ‘I regularly (at least once a week) watch matches or shows about tennis on any type of visual media (i.e., television, online video, etc.)’ (M = 1.59, SD = 0.95); ‘I regularly (at least once a week) check for news or updates about tennis’ (M = 1.63, SD = 0.88); ‘I regularly (at least once a week) keep-up-date with news of my favourite sportsman or sportswoman in tennis’ (M = 1.63, SD = 0.86). Secondly, on motivation to learn tennis (level 1 = ‘strongly disagree’, level 5 = ‘strongly agree’): ‘I find tennis interesting’ (M = 3.06, SD = 1.22); and ‘If I were given an opportunity, I am interested to learn tennis’ (M = 3.5, SD = 1.27). Third, on exposure to consumer electronic devices (level 1 = ‘strongly disagree’, level 5 = ‘strongly agree’): ‘I am familiar with using desktop computer’ (M = 4.17, SD = 0.86); ‘Desktop computer are important to me’ (M = 3.25, SD = 0.99); and ‘I interact with desktop computer on a daily basis’ (M = 2.48, SD = 1.09).
Those participants were randomly assigned to three groups: 2D schematic (n = 22), 3D stylised (n = 21), and live-action (n = 21) via a web-based interactive questionnaire (refer to Section 3.2.1). Furthermore, there were no significant differences between the three treatment groups in terms of these predetermined criteria: ‘I know how to play these sports (whether self-taught or received coaching formally or informally)’ (p = .20); ‘I am familiar with the rules of these sports’ (p = .48); ‘I find these sports interesting’ (p = .88); ‘If I were given an opportunity, I am interested in learning these sports’ (p = .13); ‘I am familiar with using these consumer electronic devices’ (p = .73); ‘These consumer electronic devices are important to me’ (p = .20); and ‘I interact with these consumer electronic devices on a daily basis’ (p = .20).
Settings
The experiment was conducted at INTEC Library IT Lab B. Utilised computers were of a similar model: 32-bit HP Compaq 6005 Pro SFF with 4GB RAM, AMD Phenom™ II X4 B95 Processor 3.00 GHz, Windows 7 Pro SP1, with HP Compaq LE1711 15’ LCD monitor. The screen resolutions were standardised to 1280 × 1024 pixels. A custom-made, web-based interactive questionnaire consists of a tutorial video, instructional videos (stimuli) and survey question items. Google Chrome internet browser was used to access the web-based interactive questionnaire. Participants viewed and interacted with the web-based interactive questionnaire that displayed the stimuli. Participants seated a table apart from one another. Thus, participants interacted with their assigned personal desktop computer. Interactions with the computer involved mouse clicks and typing their responses on the keyboard. Participants also wore headphones to listen to the audio from the instructional videos.
Materials
Psychomotor learning with animation (PLAto) interactive questionnaire
The main purpose of this computerised interactive questionnaire was to facilitate smooth flow of the study procedure. The custom-made web-based interactive questionnaire was designed primarily to record participants’ responses in the knowledge test and survey questions. Another feature was to log the duration of participants’ learning time and answering time.
Tutorial video
A tutorial video provided a brief introduction to PLAto’s interface, and the type of questions participants would encounter during the study. The tutorial length was 3 minutes and 30 seconds with 407 words. The tutorial explained on how to wear the headphone and interact with the video player interface. Bloom’s Revised Taxonomy sample questions that were unrelated to tennis were shown to participants for question type familiarisation. The tutorial also emphasised participants to observe the instructional videos to comprehend the material. Participants were also informed that they could not return to the previous questions or web pages once they had finalised their answers. Besides that, the tutorial reminded participants that they could ask any questions to the researcher if they encountered any issues throughout the study. Participants were allowed to replay the tutorial video until they were ready to proceed to view the stimuli.
Instructional tennis serves video (2D, 3D and live-action)
The study attempted to identify content domains comprising human movements that are relevant to motor skill acquisition. Particularly, the content domain of this study need to satisfy the following three constraints: (a) the domain is derived from the area of sports; (b) the domain directly comprises complex human movement; and (c) the domain comprises biological movements that allows for anthropomorphized encoding, so that learners can map the to-be-learned dynamics onto body-based representations of their human movements.
The content domain that satisfies these constraints and is applicable in motor skills acquisition is the tennis serve. Complexity is ‘a measure of the production process rather than the product, the work time rather than the work result’ (Nørretranders, 1999: 79). The whole-body movement can also be considered complex as the movement involve various parts of the body to perform a desired action or techniques. Examples of whole-body skills are performing complex dance sequences and making basketball shots in perfect form (Castro-Alonso et al., 2014). Tennis requires good hand-eye coordination, tactical competence and fitness. Most tennis movements are complex and three-dimensional in nature (Knudson, 2006). Despite that the tennis serve is the most important stroke in a tennis match (Elliott, 1990), it is also considered difficult to learn. Tennis serve is a refinement of an overarm throwing fundamental movement pattern. In professional matches, tennis serve is the most complex shot performed in the game, and its technical performance does not depend on the opponent (Đurović et al., 2008). At the recreational or amateur level, learners may become frustrated since it can take a considerable amount of time to learn on a regular basis. Schools that teach tennis as part of their curriculum often end up repeating the same skills and drills year after year, with minimal student success (Vasil, 2005). Also, Castro-Alonso et al. (2015) also suggested using stimuli related to the practical domain of area. Hence, tennis is chosen as the content domain for this study while the tennis serve is selected for its complex motor movement.
The instructional video on how to perform a basic tennis serve was created as the stimuli for the experiment. The video consists of the instructive demonstration of the tennis serve. In summary, the instructional video demonstrated seven common steps to perform a basic tennis serve: the grip, the stance, the backswing, the trophy pose, the swing up, the ball strike, and the follow-through. The video consisted of 412 words and lasted for 2 minutes 29 seconds. Journal articles on the tennis serve (Abrams et al., 2011; Đurović et al., 2008; Kovacs and Ellenbecker, 2011; Pollick et al., 2001) and a tennis book (Knudson, 2006) were referred and a national tennis coach who is also a sports science lecturer at UiTM was consulted in creating the content of the instructional video. The constant variables were the instructional design of the materials and the video format. The only difference was the visualisation types (level of visual details) of instructional videos which were 2D schematic, 3D stylised; and live-action (see Figure 2). Relevant learning outcomes and level of the cognitive domain were discussed with and suggested by the coach. Video production software such as Adobe Photoshop CS6, After Effects CS6, and Premiere Pro CS6 were used to produce the instructional videos in 2D schematic, 3D stylised and live-action versions.
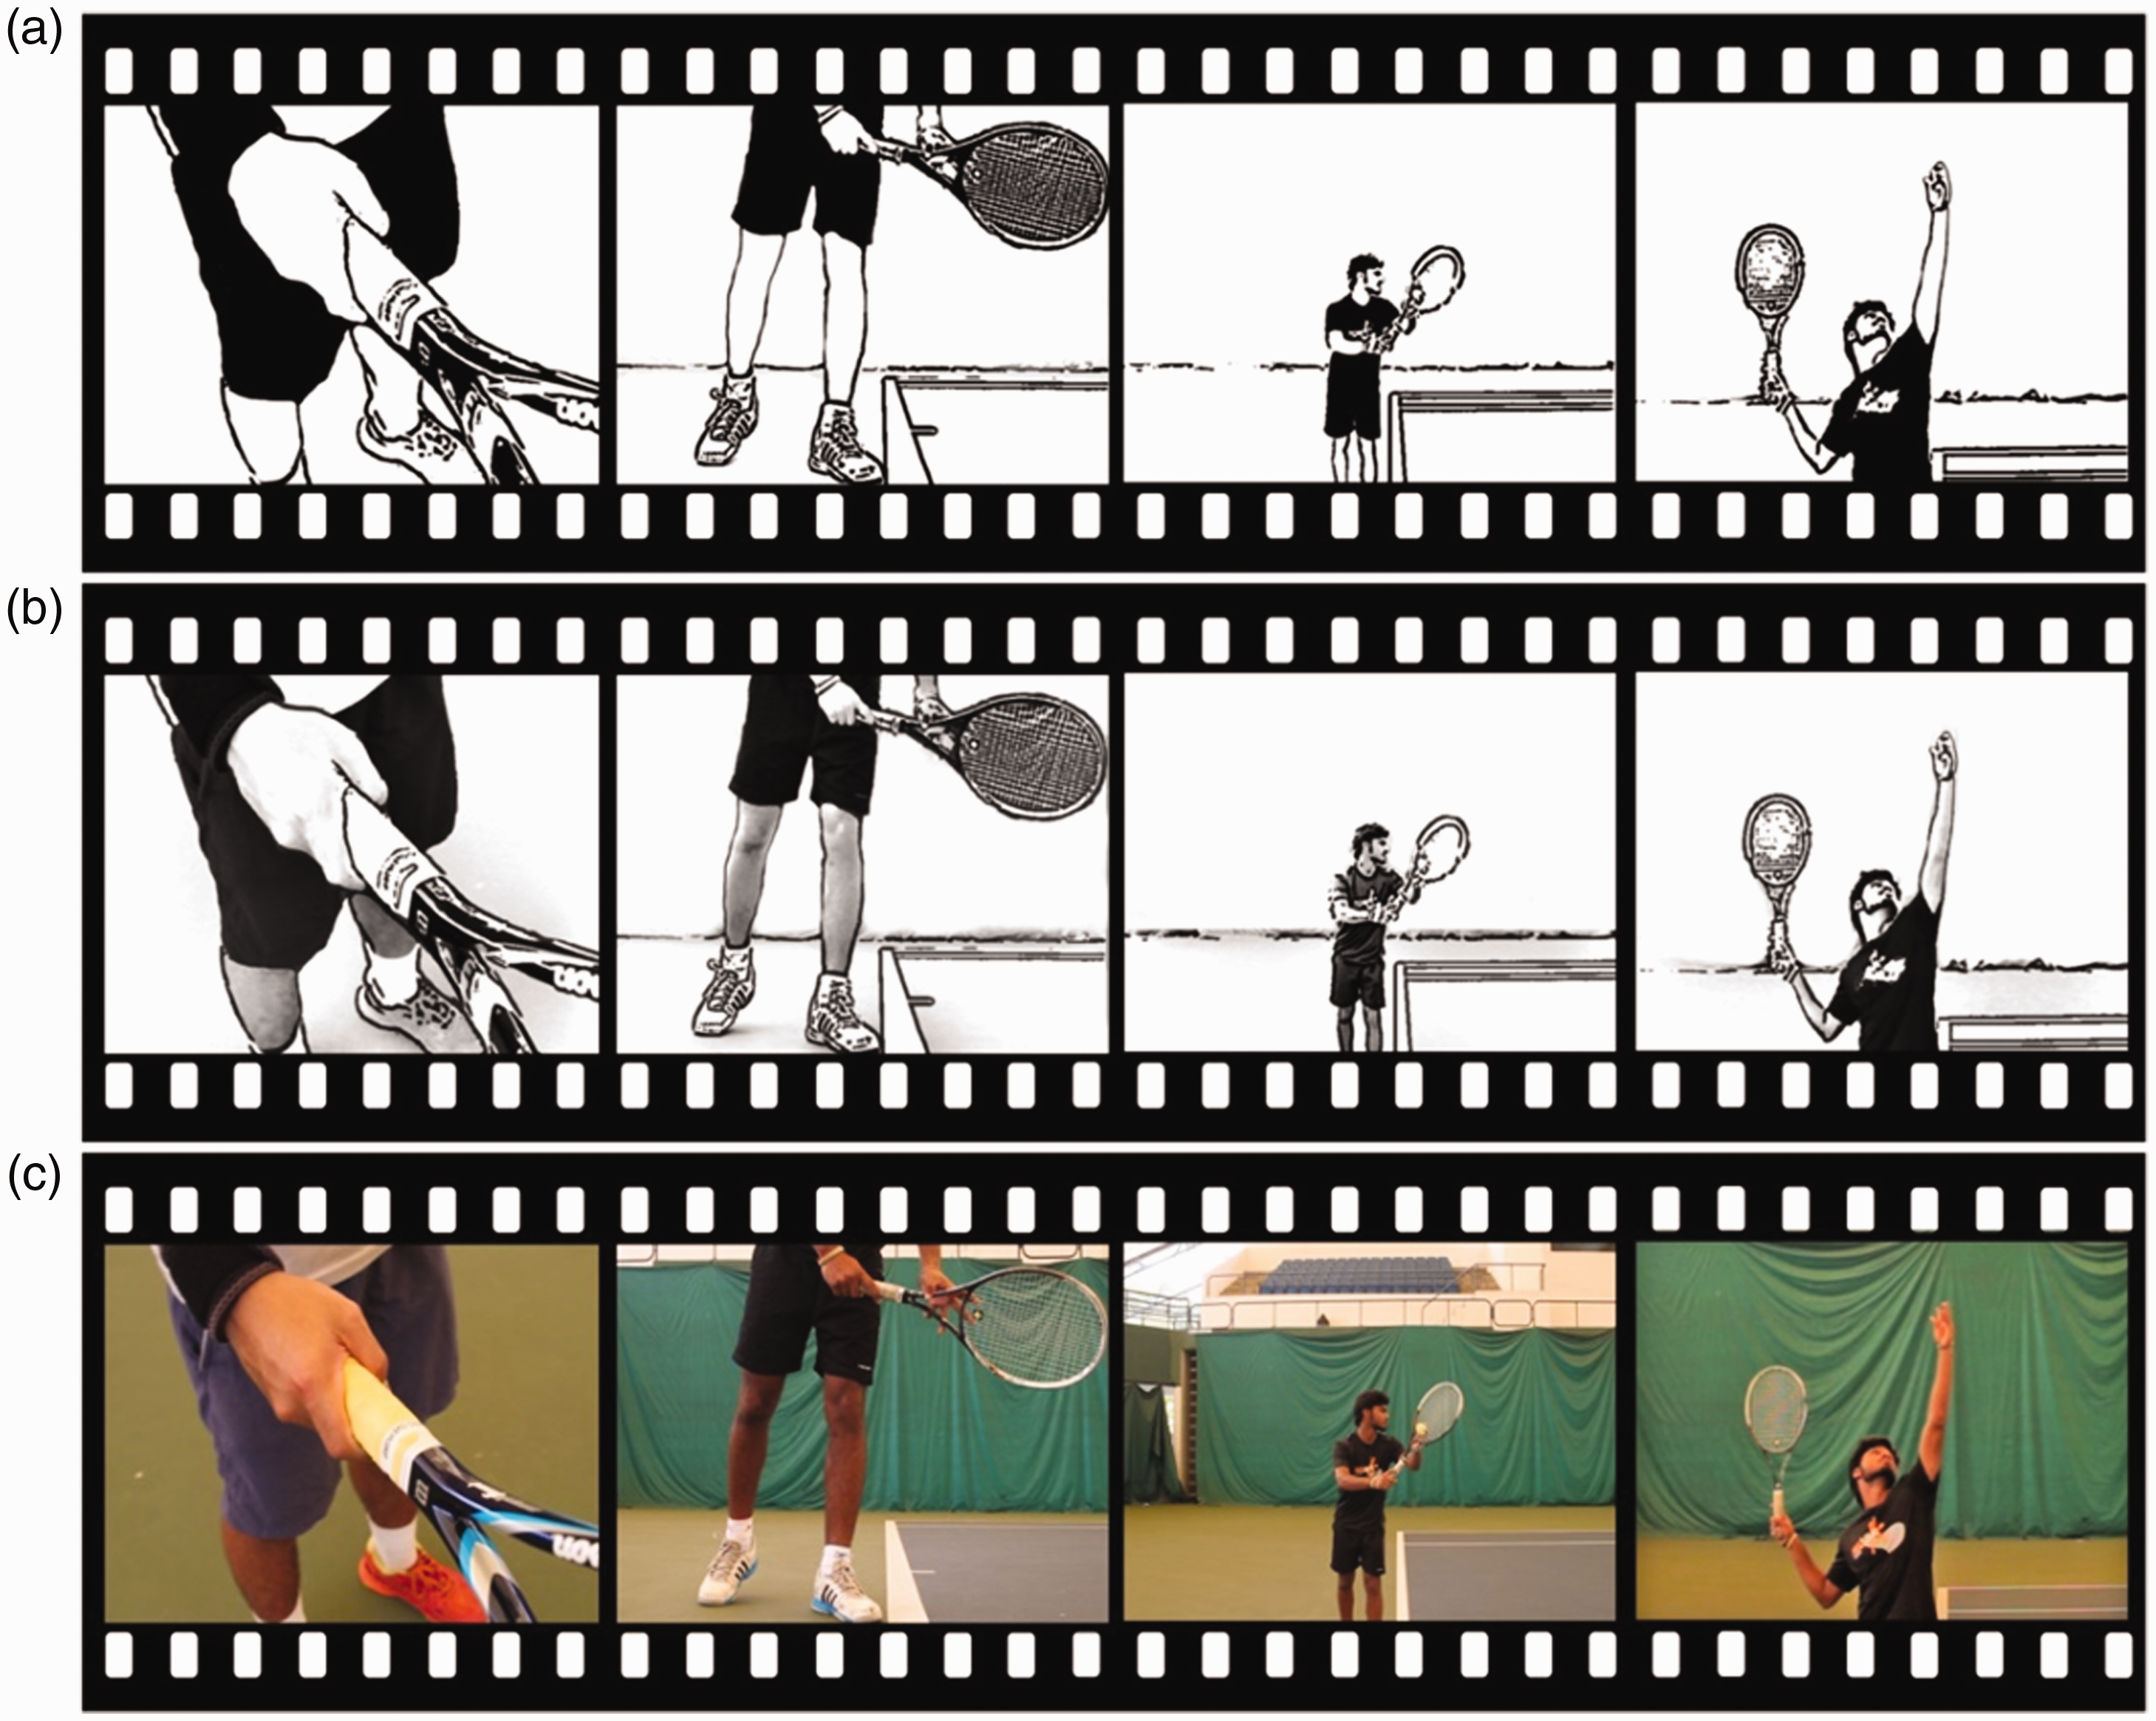
Screenshots of an instructional tennis serve video in the 2D schematic (a), 3D stylised (b), and live-action (c) level of visual details (realism).
Measures
Both quantitative and qualitative data were recorded via PLAto for analysis. The dependent measures are as follows:
Learning time: The time to complete watching and replaying the instructional tennis serve video was collected via PLAto. Recording started as soon as each participant started watching the video. The recording ended when participant proceeds to the next session. Perceived attitude survey: After watching the instructional video, participants answers several questionnaire items related to perceived cognitive load (Mayer and Estrella, 2014), perceived triggered situational interest (Magner et al., 2014; Schiefele, 1990), and perceived satisfaction (Lee and Shin, 2012; Mayer and Estrella, 2014). The items used in this section of the survey were adapted and modified from previously mentioned studies (refer Appendix A). Perceived triggered situational interest consist of two main categories: value-related item: useful, worthless, and unimportant (Cronbach’s α = 0.75) and feeling-related item: entertaining, boring, and exciting (Cronbach’s α = 0.74). These questionnaire items were meant to be used as a single-item questionnaire for explorative purposes and to minimise survey exhaustion (Türkay, 2016). Knowledge test (MCQ): The test questions were designed in reference to Bloom’s Revised Taxonomy (Anderson and Krathwohl, 2001; Krathwohl, 2002). Due to the short length of the instructional videos, only eight multiple choice questions were designed. Each question was accompanied by four choices of the answer. To check for the validity of the questions type, 17 university lecturers from UNIMAS and UiTM provided their feedback to check if the questions corresponded to the Bloom’s Taxonomy. Next, the coach who aided in providing feedback on the instructional design of the tennis serves video also provided feedback and assisted in finalising the questions to be used in the study. After the question type validation process, six questions were selected to be utilised for the knowledge test (see Appendix B). These questions consisted of two items from Remembering, two items from Understanding, and two items from Applying categories. Each correctly answered question equalled to 1 point. Thus, the total score is 6 points. Answering time: The duration needed for participants to respond each question was recorded via PLAto. The recording started when participants encountered the questions. The recording ended when participants proceeded to the next page. Perceived confidence level: Perceived confidence level was measured by having participants complete a question with a Likert scale from level 1 (= ‘not confident’) to level 5 (= ‘very confident’). This item was asked after participants answered each knowledge test question. Similar to Türkay (2016)’s study, this was meant as a measure of their judgment of learning. Adjusted efficiency score: Based on the suggestion by a review study (Hoffman and Schraw, 2010), the efficiency score is calculated as follows: total score/learning time. The resulting scores were in several decimals. Thus, for the purpose of readability, the adjusted efficiency score was also used by multiplying the efficiency score with 100. Preference survey: The preference survey consisted of comparison and open-ended questions. Open-ended questions solicited the justifications for participants’ preferences. After that, participants were shown all three types of visual styles. Participants were asked to play and watched all videos so that they can make a comparison. Then, participants were asked to choose which visual style that participants prefer to watch to learn how to learn the tennis serve. The follow-up questions solicited reasons for their choice. In addition, participants were asked whether visual styles are important in learning sports techniques along with their justifications.
Procedure
The whole process lasted between 30 and 60 minutes. Participants were tested individually. The experiment began with participants entering the computer lab (see Figure 3). As the participants sat at their designated computer, they were asked to key in their designated identification number. After keying in their identification number, they were shown the information regarding the introduction of the experiment. After that, they were shown a brief tutorial on navigating PLAto. The tutorial provided guided instructions on the functions available in PLAto. After participants had watched the tutorial, the main part of the experiment began with the randomly assigned instructional video (stimulus) of the tennis serve. Here, participants were randomly shown 2D schematic animation, 3D stylised animation, or live-action video. As mentioned earlier, the instructional content of the stimuli was the same. Only the visual style of the videos was different. Participants were allowed to take as much time as needed to view the randomly assigned video. Next, participants were asked to fill several perceived attitude survey based on their experience from watching the assigned stimulus. Subsequently, they were directed to the knowledge test section which involved the recall of information presented in the video that they had watched. The questions were presented in the form of multiple choice questions. Each multiple choice question was accompanied by a perceived confidence level question. In the following section, they were shown all three versions of the tennis instructional video. They were asked to view all these videos in any order. After watching all these videos, they were asked several open-ended questions for them to answer. After responding to these questions, they were directed to the last part of the program. They were invited to key in their email address if they were wished to receive information regarding the findings of this study. Finally, participants exited PLAto, and they proceeded to the checkout counter at the front of the computer lab.
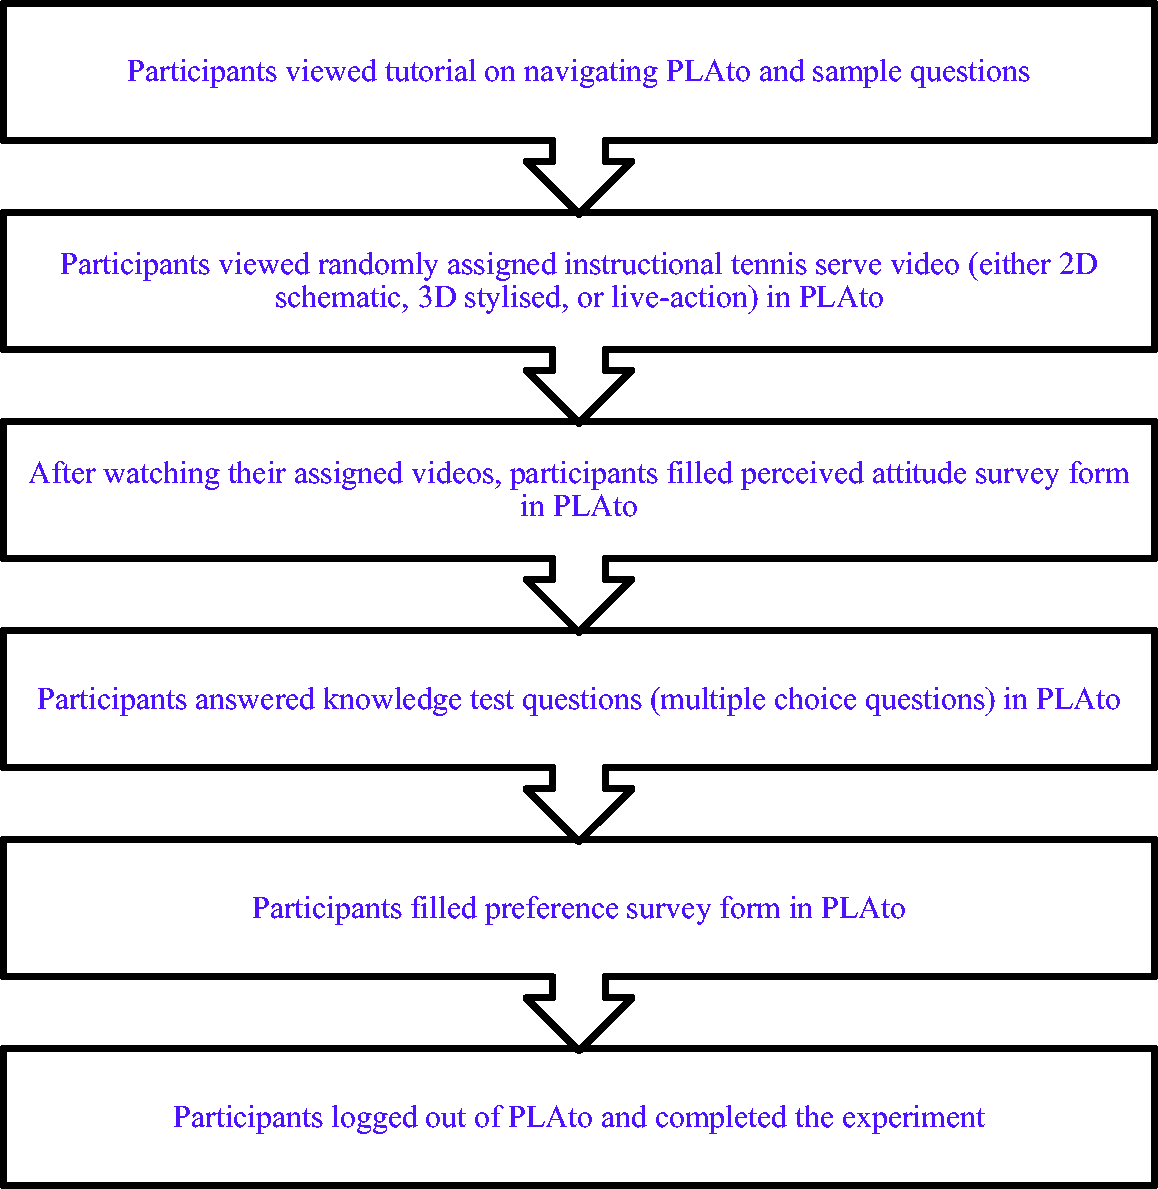
Diagram of the study’s procedure.
Statistical analyses
IBM SPSS version 22 was used to perform the statistical analysis of the quantitative data. The significant level adopted was .05 for all analyses. Two-tailed hypothesis (non-directional hypothesis) was selected due to mixed and inconclusive findings from previous studies. The learning outcome was measured cognitively through knowledge test, which was measured through a summative assessment. Descriptive statistics were collected on all of the data to view the frequency data of the post-test. One-way ANOVA was used because there was only one independent variable.
After verifying that the assumptions for parametric tests (homoscedasticity using Levene’s test and normality distributions using Kolmogorov–Smirnov and Shapiro–Wilk tests) were not met, Kruskal–Wallis, a non-parametric ANOVA, was used for testing differences between groups when there are more than two conditions and different participants have been utilized in all conditions (each person contribute only to one score of data). Kruskal–Wallis was chosen compared to Mann–Whitney because the experimental study compared more than two groups. If a statistically significant difference was found, multiple comparison tests or posthoc test with Mann-Whitney were conducted to analyse the findings further. Content analyses were undertaken to analyse open-ended preference survey to identify common themes in participants’ responses. Similar themes were coded and grouped together. Additional exploratory analyses were also performed to discover possible unexpected findings. Analyses with Pearson correlation were carried out to examine possible interaction between learning time and knowledge test score, total answering time and total knowledge test score, and total confidence level score and total knowledge test score.
Findings
This study focuses on the potential effects of level of visual details (realism) of animated human character in the 2D schematic, 3D stylised and realistic imagery. The study compares different levels of visual details depicted in the visualisations as one of the pertinent issue relevant to the design of instructional animation for motor skill acquisition. This section presents quantitative and qualitative findings from the experimental study on perceived attitude survey (Table 1), knowledge test performance (Table 2), confidence level of answering each knowledge test question (Table 3), preference survey (Figures 4 and 5 and Tables 4 and 5), and correlational analyses (Figure 6).
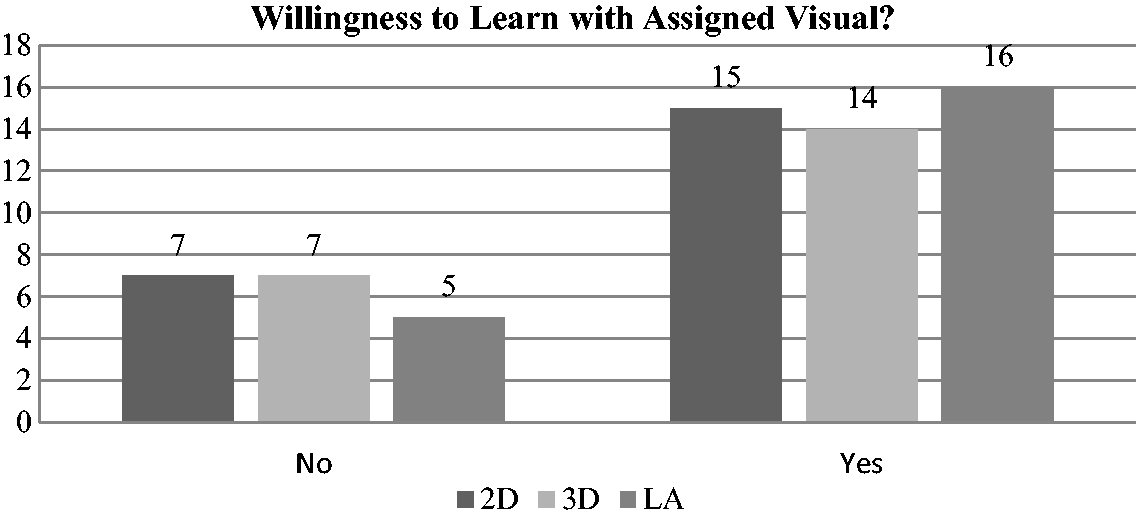
Willingness to learn with assigned visual.
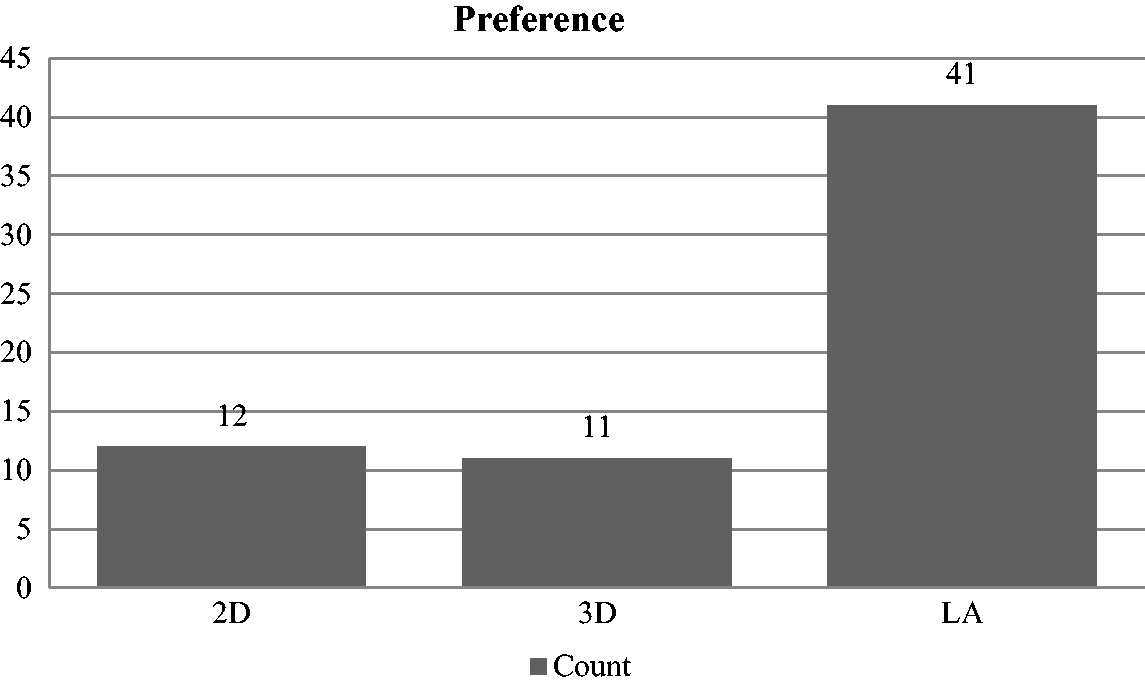
Participants’ preference after viewing all stimuli.
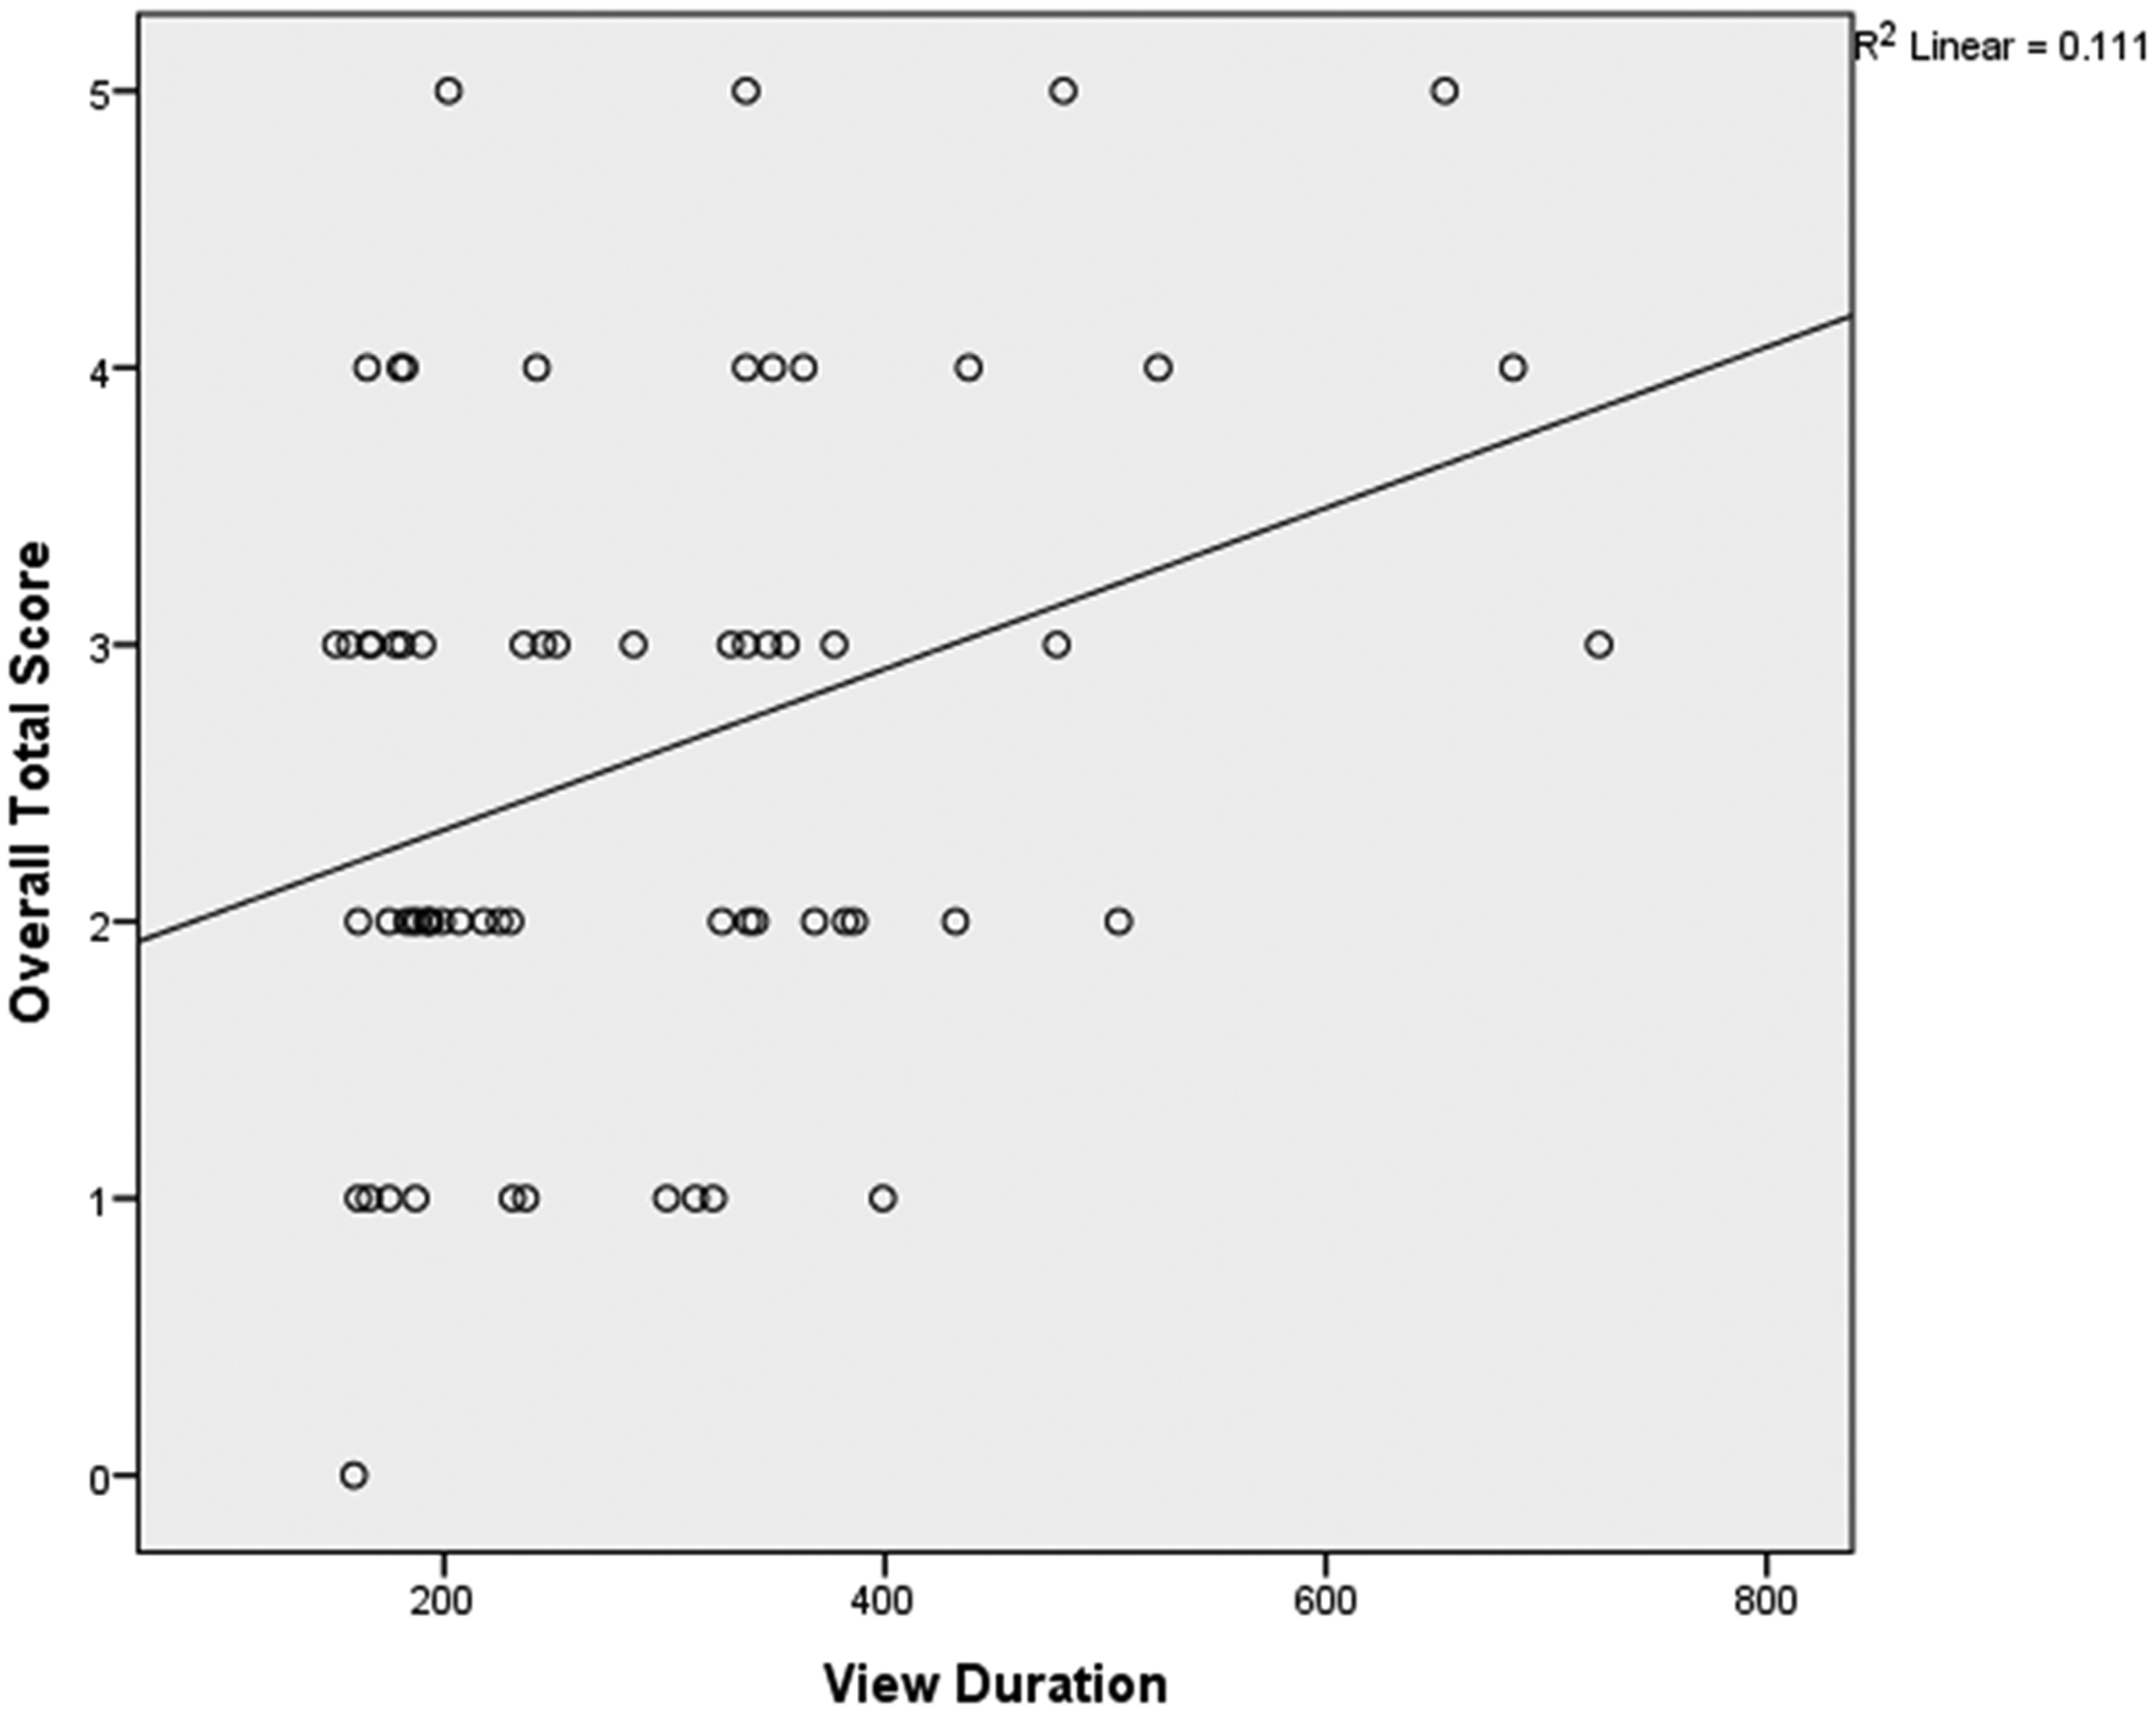
Correlation between learning time and knowledge test score.
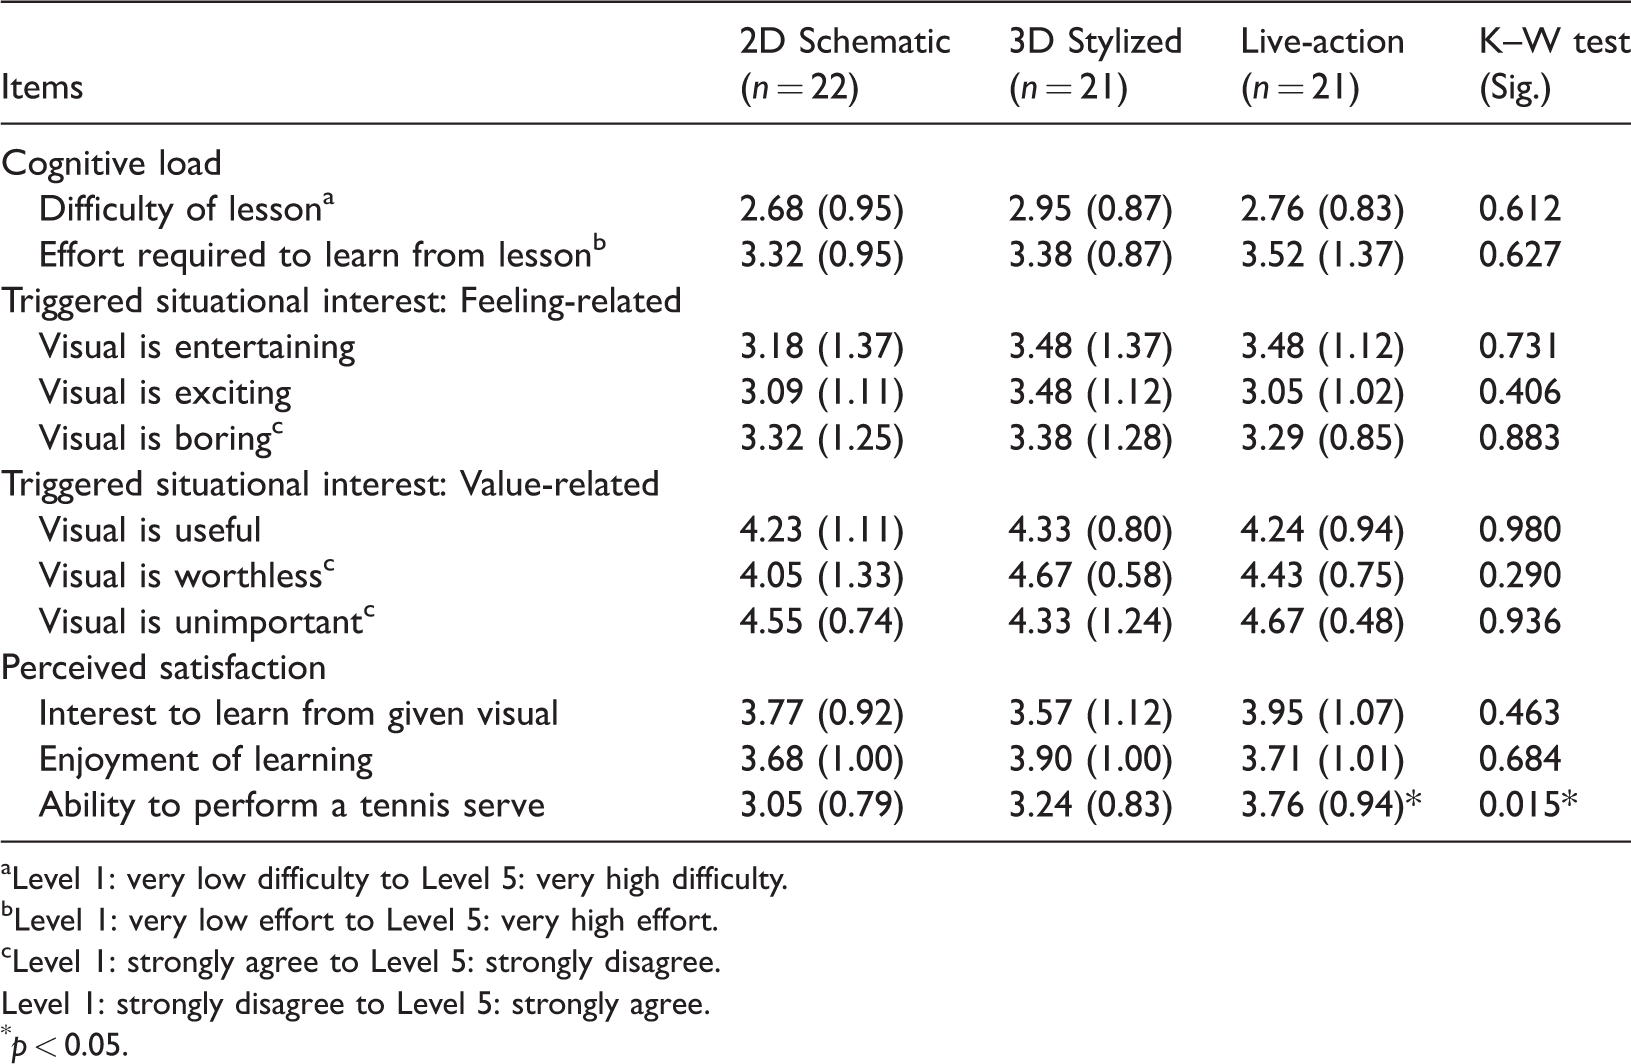
Perceived attitude survey items in mean (standard deviation) with Kruskal–Wallis test.
Level 1: very low difficulty to Level 5: very high difficulty.
Level 1: very low effort to Level 5: very high effort.
Level 1: strongly agree to Level 5: strongly disagree.
Level 1: strongly disagree to Level 5: strongly agree.
p < 0.05.
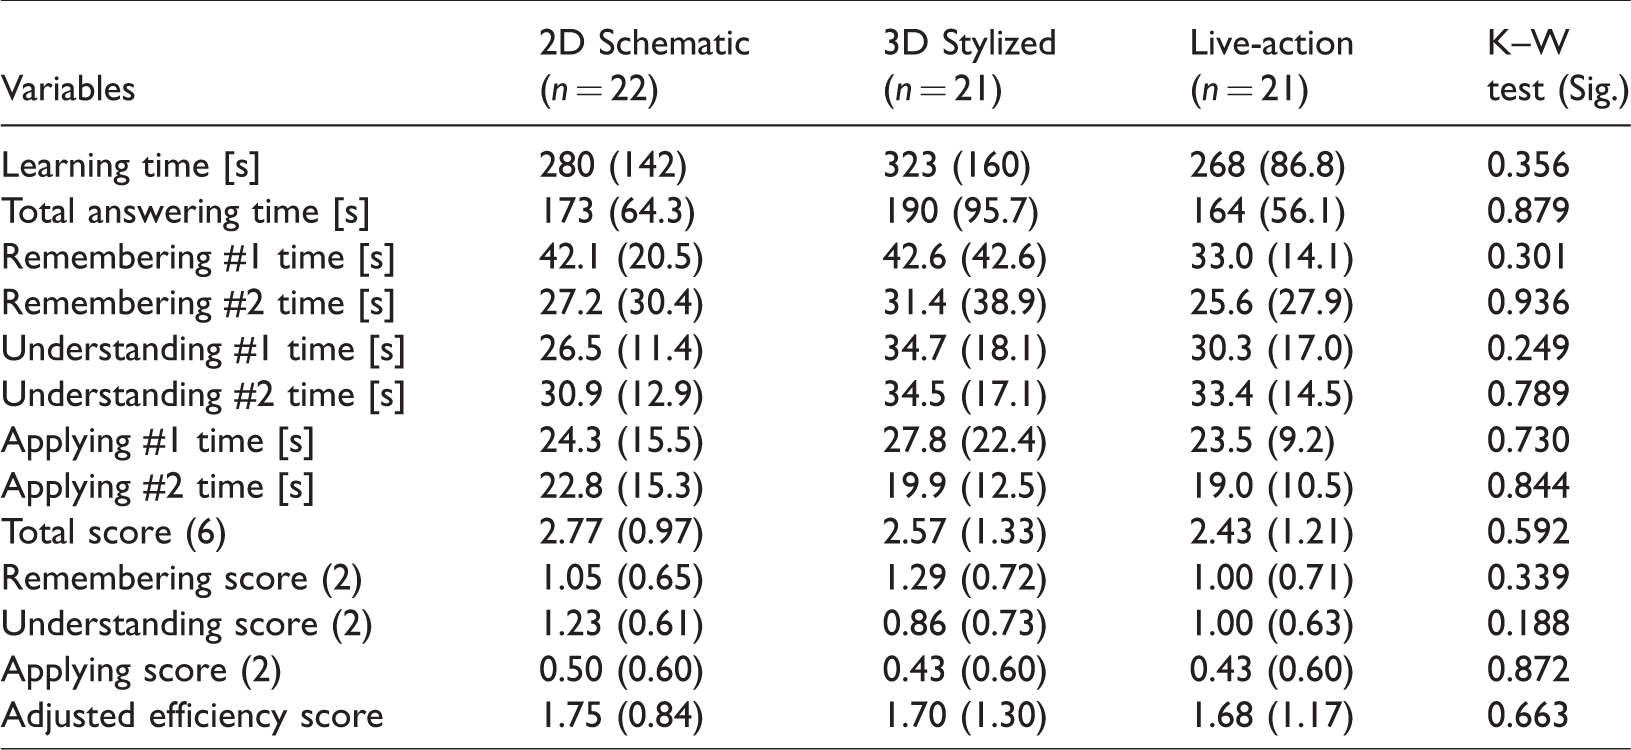
Knowledge test variables in mean (standard deviation) with Kruskal–Wallis test.
Perceived confidence level of answering correctly in mean (standard deviation) with Kruskal–Wallis test.
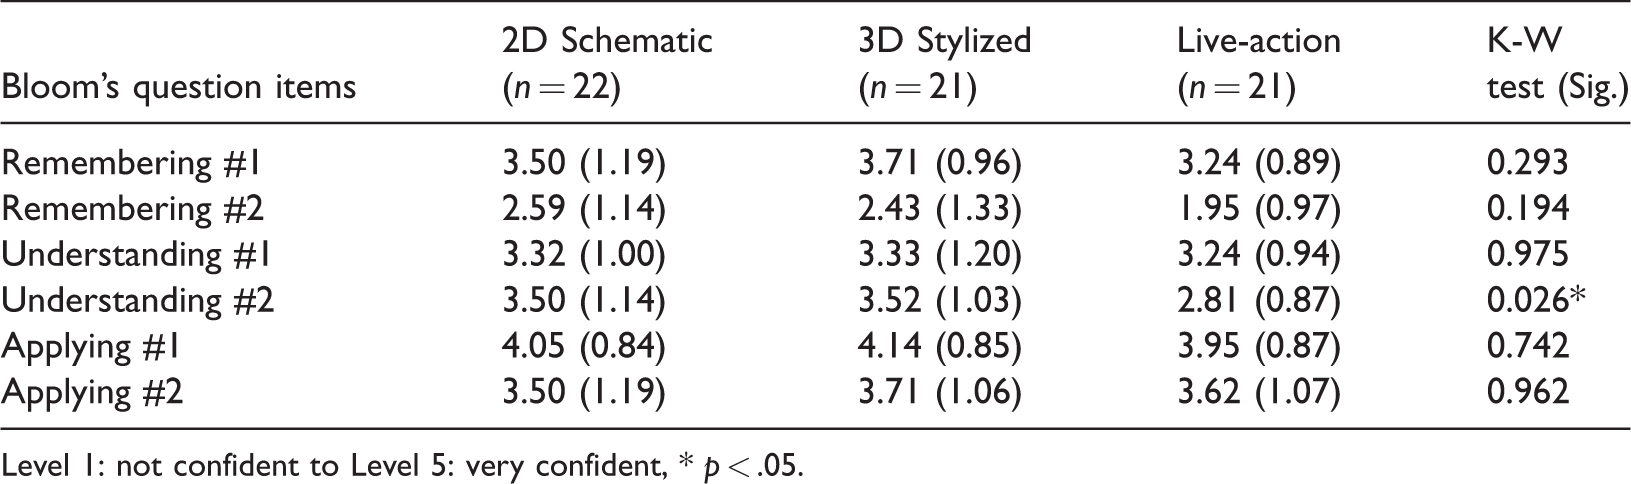
Level 1: not confident to Level 5: very confident, * p < .05.
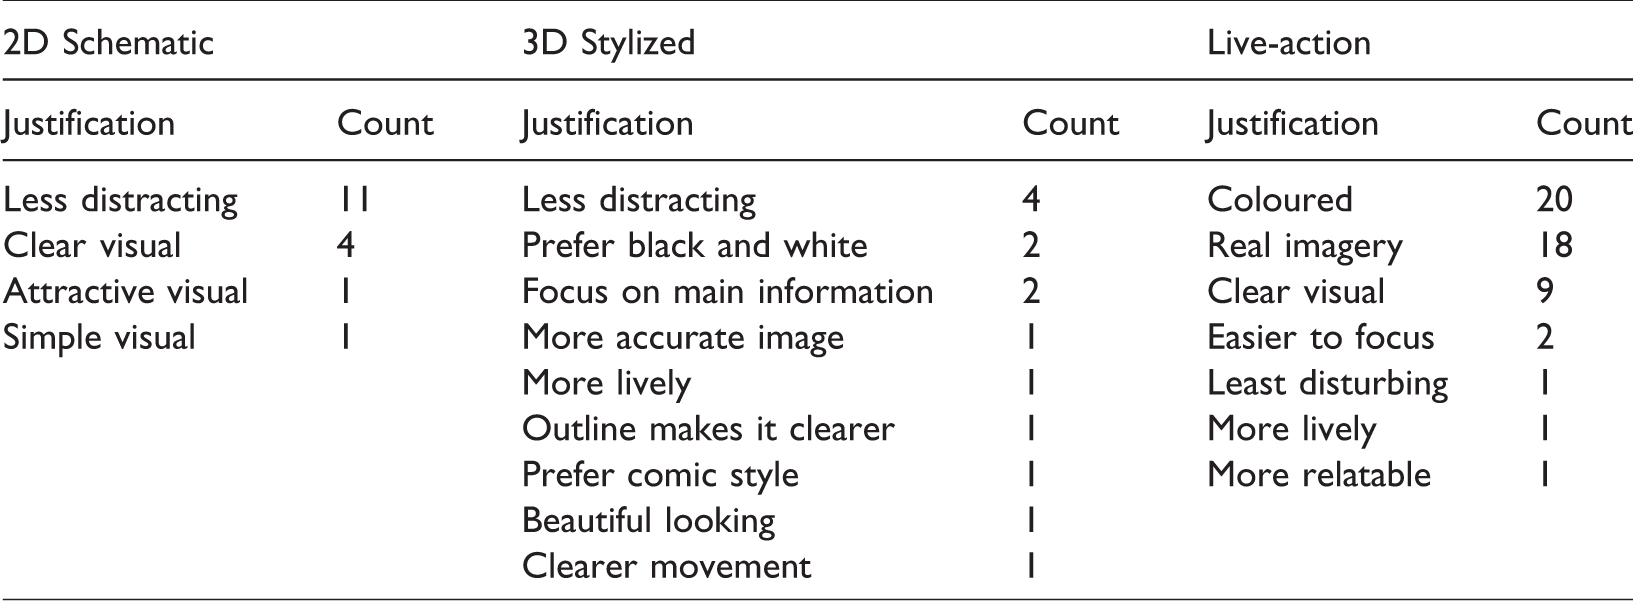
Participants’ reasons for such preference.
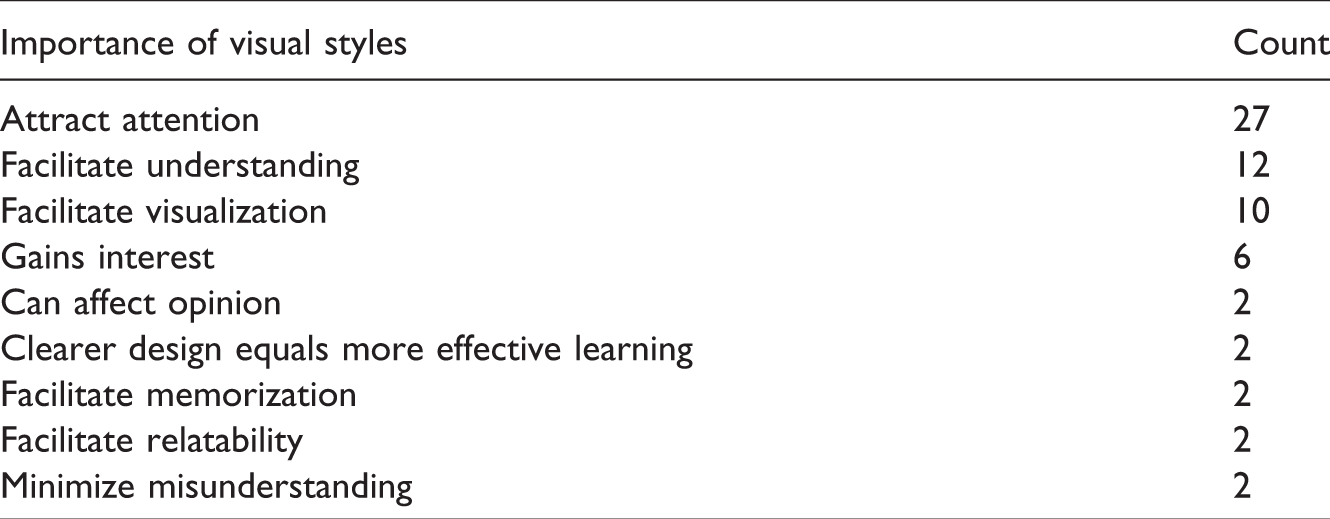
Participants’ opinion on the importance of visual styles.
Perceived attitude survey
From perceived attitude survey (Table 1), questions on cognitive load, triggered situational interests, and perceived satisfaction showed almost no statistically significant difference. There were no statistically significant differences across different levels of realism groups in perceived difficulty of lesson (H(2) = .982, p = .612); perceived effort required to learn from lesson (H(2) = .935, p = .627); perceived entertained level induced by visual (H(2) = .626, p = .731); perceived excitement level induced by visual (H(2) = 1.804, p = .406); perceived boredom level induced by visual (H(2) = .248, p = .883); perceived usefulness of visual (H(2) = .040, p = .980); perceived worthlessness induced by visual (H(2) = 2.478, p = .290); perceived lack-of-importance level induced by visual to learn (H(2) = .132, p = .936); perceived interest to learn from given visual (H(2) = 1.541, p = .463); and perceived enjoyment of learning (H(2) = .760, p = .684).
However, there was a statistically significant difference in perceived ability to perform a tennis serve across different levels of realism groups (H(2) = 8.395, p = .015) with a mean rank of 26.52 (Mdn = 3) for 2D schematic, 29.95 (Mdn = 3) for 3D stylized, and 41.31 (Mdn = 4) for live-action visual style. After Bonferroni adjustment, the alpha level was set at 0.017, and posthoc Mann–Whitney U-tests indicated that there was a statistical difference between the ‘perceived ability to perform a tennis serve’ (U = 338.5, z = 2.793, p = .005, r = .425) of the 2D schematic and live-action groups with a medium effect. There was no statistical difference between the ‘perceived ability to perform a tennis serve’ (U = 255, z = .632, p = .528) of the 2D schematic and 3D stylised groups. There was no statistical difference between the ‘perceived ability to perform a tennis serve’ (U = 298, z = 2.071, p = .038) of the live-action and 3D stylised groups.
Knowledge test performance
From the knowledge test performance (Table 2), there were no statistically significant differences across different levels of realism groups in learning time (H(2) = 2.066, p = .356); total answering time (H(2) = .258, p = .879); total score (H(2) = 1.048, p = .592); and adjusted efficiency score (H(2) = .823, p = .663).
Perceived level of confidence survey
For perceived confidence level (Table 3), almost all items revealed no statistically significant difference. However, there were statistically significant differences in the confidence level of answering correctly for the Understanding #2 question across different levels of realism groups (H(2) = 7.33, p = .026) with a mean rank of 36.93 (Mdn = 4) for 2D schematic, 36.29 (Mdn = 3) for 3D stylized, and 24.07 (Mdn = 3) for live-action visual style. After Bonferroni adjustment, the alpha level was set at 0.017 and posthoc Mann–Whitney U-tests indicated that there was a statistically significant difference between in the confidence level of answering correctly for the Understanding #2 question (U = 138.5, z = −2.417, p = .016, r = −.368) of the 2D schematic and live-action groups with a medium effect. There was no statistically significant difference between the confidence level of answering correctly for the Understanding #2 question (U = 226, z = −.128, p = .899) of the 2D schematic and 3D stylised groups. There was no statistically significant difference between the confidence level of answering correctly for the Understanding #2 question (U = 136, z = −2.341, p = .019) of the live-action and 3D stylised groups.
Preference survey
To explain how different level of visual details (realism) affected participants’ learning performance and preference, responses to the comparison and open-ended questions in the preference survey were analysed together. By the resulting qualitative data, some possible explanations for the preferences were proposed. The results were presented regarding participants’ perspectives about the visual styles used in the instructional videos.
In comparison, the response toward willingness to learn with the assigned visual was almost similarly distributed: 2D schematic, 31.8% responded ‘No’ while 68.2% responded ‘Yes’; 3D stylized, 31.8% responded ‘No’ while 68.2% responded ‘Yes’; and live-action, 31.8% responded ‘No’ while 68.2% responded ‘Yes’ (see Figure 4).
However, after participants were given a chance to review all three versions of the instructional tennis video, most participants decided elected live-action visual type (64%), followed by 2D schematic (18.8%) and 3D stylised (17.2%) (see Figure 5). From the 2D schematic group, 17 participants (77.3%) chose live-action, 4 participants (18.2%) chose 3D stylised, and only 1 participant (4.5%) decided to remain to watch 2D schematic version. Meanwhile, from the 3D schematic group, 10 participants (47.6%) chose live-action, 7 participants (33.3%) chose 2D schematic and only 4 persons (19.0%) decided to remain to watch 3D stylised version. Lastly, from the live-action group, 4 participants (19.0%) chose 2D schematic, 3 participants (14.3%) chose 3D stylised and 14 participants (66.7%) decided to remain to watch live-action version.
Based on the thematic content analysis, the most common reason participants prefer 2D schematic is ease of focus while viewing the video. The most common reason participants prefer 3D stylised is a lack of distractions while viewing the video. The most common reason participants prefer live-action is for having colour while viewing the video. Other justifications for their choice are presented in Table 4.
Based on the thematic content analysis, the top three points that participants mentioned regarding the importance of visual styles were to attract attention, facilitate understanding, and facilitate visualisation. Other opinions on the importance of visual styles in learning motor skill are presented in Table 5.
Exploratory correlation analyses
Due to the non-significant difference in learning time, knowledge test scores, and efficiency score, additional exploratory analyses were conducted to discover possible interactions between these variables across all groups combined. There was a statistically significant positive relationship between learning time and total knowledge test score but with small effect size (Cohen, 1988), r(62) = .333, p = .007. However, there was no statistically significant relationship between total answering time and total knowledge test score, r(62) = .068, p = .592. Moreover, no statistically significant association was found between total confidence level score and total knowledge test score, r(62) = .222, p = .078.
Discussion
This study aimed to determine the effects of different levels of visual details for complex motor skill acquisition on learning effectiveness and efficiency. The question arises regarding how different level or visual details (realism) may affect the acquisition of position information and object recognition of human shape and form. In exploring for possible effects, several quantitative and qualitative data were collected and analysed from randomly assigned participants. The independent variable is the degree of realism (level of visual details). The dependent variables were knowledge test score, learning time, answering time, perceived attitude survey, perceived confidence level in answering each question, participants’ visual preference and their responses to open-ended questions.
Although most participants prefer live-action visual, there was not enough evidence to show that participants would perform better by viewing the live-action visual. These past studies asserted that there would be a difference in learning performance from a different level of visual details. However, based on the findings from the current study, participants performed just as well by watching the lower level of visual details when it comes to studying motor skill acquisition. The cognitive load theory (Sweller et al., 2011) and CTML’s coherence principle (Mayer, 2009) asserted that minimal is better because fewer level of visual detail (minimalist approach) can be less overwhelming, contain fewer distractions, lesser visual redundancy, and more focus on salient information as indicated by participants’ feedback. Notwithstanding, this argument is not well supported based on the knowledge test and efficiency scores. Perhaps that realism affects the perception more than cognitive aspect. The results from the knowledge test and efficiency score also fail to support Alessi and Trollip (2001)’s hypothesised relationship of fidelity and learning. The proposed curve of learning effectiveness was not evident based on the data from this study. Despite being not statistically significant, the scores were gradually decreasing by a relatively small margin rather than a curve-shape line. Scheiter et al. (2009)’s study found that schematic dynamic visualisation could outperform realistic visualisations. Results from the knowledge test did show 2D schematic outperform realistic visualisation; however, the difference is not considered as statistically significant. Supported by participants’ responses from open-ended questions, realistic visuals have more information, but low-prior knowledge learners may not be familiar with what information to focus. Also, Ida et al. (2012)’s study found that it is easier to distinguish differences in motor skills with a lower level of detail. This perhaps happens, but regarding the knowledge test from this study, the argument was not strongly supported. Also, a majority of participants preferred to view the realistic version after they were given a chance to make the comparison.
Participants performed just as well by watching the lower level of visual details when it comes to studying motor skill acquisition. The knowledge test and efficiency scores supported Rodrigues et al. (2010)’s argument that minimal visualisations are sufficient and Imhof et al. (2011)’s claim that learning from realistic visualisation is almost equivalent to the schematic counterpart. In addition, Brucker et al. (2014)’s argument realism did not interact with the dynamism of the visualisation and Barnes (2016)’s claim that different levels of realism had no effect on comprehension are also supported by results from the knowledge test and efficiency scores. In summary, findings from this study do not have sufficient evidence to reject findings from studies mentions above. Thus, these claims can still be supported tentatively. In terms of preference, the comparison survey results were similar to Barnes (2016)’s findings related to ‘naïve realism’ in which the majority of respondents initially preferred high fidelity graphics. Nevertheless, this is geared towards perception rather than cognitive because results from knowledge test and efficiency scores had indicated otherwise. For example, participants in the live-action version seem to be able to visualise themselves to perform the tennis serve more successfully than the 2D schematic group. Moreover, participants from the live-action group felt more confident in answering the Understanding #2 question correctly when the visual reference accompanying the question was similar to the visual from the stimuli. Nevertheless, Applying #1 and #2 had visuals accompanying the questions there was no significant difference in the confidence. A possible explanation for this could be that Applying #1 and #2 questions were more challenging (based on the hierarchy of Bloom’s revised taxonomy) than the Understanding #2 question.
Due to the mainly non-statistically significant difference in the effect of realism, additional exploratory analyses were conducted. From the analyses, a positive correlation was found between learning time and knowledge test score which suggest that more effort given in learning can produce better performance in comprehension independent of learning with different visual styles.
This study is not without limitations. Firstly, the sample size can be considered fairly small to detect the effect of realism towards motor learning. The small sample size was also due to the fairly strict selection process during the purposive sampling in an attempt to gather a homogenous sample. Also, only volunteers from the pool of selected students participated in the study. Nevertheless, many attempts to control for confounding variables and maintain consistencies were made. Secondly, the learner control factor may have affected the performance as participants were free to take their time to view the stimulus until they felt ready to answer the questions. However, it is practical to allow learner control when participants are viewing these videos as it is a common feature inherently embedded in viewing video players nowadays. To take that factor away would significantly reduce the generalizability of the findings. Besides that, another limitation would be the small number of questions used for scoring and statistical analysis purposes. As the focus of the instructional video is in the tennis serve only, a limited number of questions could be generated. Nevertheless, the study incorporated Bloom’s taxonomy-based questions as recommended by Berney and Bétrancourt (2016) for future meta-analysis study. For example, multiple choice questions were used to measure ‘Applying’ instead of performing the actual motor skill because it was planned that the data could be used for future meta-analysis study. The current experimental study is limited to the controlled computer laboratory. Future study can test their information acquisition by performing in an actual tennis practice session. Besides that, it is essential to be aware that the scope of this study is on motor skill acquisitions via animated and moving images such as animation and film. Another form of representation media such as topographical maps and still images may yield different results. Another possible ceiling effect could be of the instructional design, content, or video format. However, those factors were constant factors in all versions except for the level of visual details (realism).
Based on a meta-analysis, studies focusing in furthering refinement of differentiating between iconic (pictorial representations ranging from highly schematic to photo-realistic) and abstract visualisations (semiotic) are highly encouraged (Berney and Bétrancourt, 2016). In line with that endeavour and based on the content analysis, future studies can consider including four different levels of visual details (realism): 2D schematic in black & white, 3D stylised in black & white, 3D stylised in colour, and live-actions. However, recruiting sufficient samples to four groups would be challenging. Besides that, studies using transcranial magnetic stimulation (TMS), functional magnetic resonance imaging (fMRI) and eye-tracking can be conducted to capture more direct and objective measures of the effect of viewing the different level of visual details. For example, TMS and fMRI can be used to track neural activity in the brain while viewing the different level of visual details (realism). Also, eye-tracking can be used to monitor eye movement and attention while viewing various types of visual stimuli. Also, the experiment can be conducted in a real setting like viewing instructional animations at the tennis court and practising the tennis serve physically. Also, additional studies can consider testing in different (a) domains such as dancing, learning martial arts, exercising, and playing musical instruments; (b) level of prior knowledge of the subject matter; (c) age groups as younger audience may find 2D schematic and 3D stylized more visually appealing; (d) single vs. multiple representations; and (e) visual representations of pedagogical agents. Also, findings from the thematic analysis can be used to construct questionnaire items to further explore the preferences on the visual style for other animation and realism related studies (i.e., ‘uncanny valley’).
This study discovers a variety of findings supporting and not supporting findings from previous research; hence, further study on the effect of realism or level of visual details should be encouraged and continued. The realism factor does affect low-prior knowledge learners. Based on this study, realism seems to affect the perception more than the cognition. It is hoped that this study has provided additional empirical evidence that can catalyse more future studies and potential applications such as learning dance moves (ballet or capoeira), sports or exercises, movement rehabilitation and therapy, and virtual reality sports training (Nagata et al., 2017). Animation can potentially add appeal and thus, create more interest and motivation to learn motor-based simulations (Eaves et al., 2016), edutainment for video games console, and motor skill training mobile apps. Effective visualisations can help in injury prevention for beginners and recreational players, and motor learning for healthy people and motor rehabilitation in patients.
As a conclusion, to teach motor skill acquisition, animators and instructional designers can still opt for using 2D schematics or line style drawing, 3D stylised as those styles have not shown strongly unfavourable evidence in reducing the learning effectiveness. Nevertheless, using interesting visualisations styles can potentially be more appealing and exciting for younger audiences if designed appropriately. This study adds empirical evidence to the potential use of various human-based visual representations in motor skill acquisition such as in the domain of sports like tennis. Therefore, animation and instructional designers can still have the creative freedom on how to best present their digital character when it comes to motor skill acquisitions.
Footnotes
Acknowledgements
Many thanks go to Dr Ruslan Abd Rahim, Dr Nazrul Azha Mohamed Shaari, Dr Ruzela Tapsir, Mohammad Shurabil Suib, Dr Rahizam Abdul Rahim, Alvin Siaw, Sri Aakash Reddiyar and Talhah Mohamad Rahizam for providing support throughout the study, and several UNIMAS colleagues who provided useful comments throughout the study.
Declaration of Conflicting Interests
The author(s) declared no potential conflicts of interest with respect to the research, authorship, and/or publication of this article.
Funding
The author(s) received no financial support for the research, authorship, and/or publication of this article.