
Abstract
Affinity spaces are digital or physical spaces in which participants interact with one another around content of shared interest and through a common portal (or platform). Among teachers, some of the largest affinity spaces may be those organized around hashtags on Twitter: These spaces are public, largely unmoderated, and thriving, yet very little is known about them, especially those based in geographical areas such as American states. This paper examines these potential affinity spaces by providing the first large-scale study of them in the form of an examination of 47 State Educational Twitter Hashtags (SETHs). Collecting over 550,000 tweets over 6 months, our analysis focused on who is participating in SETHs, how active participants are, and when participation occurred. We found support for two of Gee's tenets of affinity spaces, in particular many interactions through a shared portal. Though the content of tweets were not the focus, this study’s findings lend support to efforts to identify which particular SETHs will be best suited to subsequent analysis of their content and what times subsequent analysis might most productively focus on. We discuss implications for how we conceive of teacher professional development and suggest directions for future research focused on the content of tweets associated with SETHs.
Affinity spaces (Gee, 2004) are digital or physical spaces that are built around some kind of content and in which people interact with each other through some kind of portal (a means by which people enter the space). Like other conceptions of groups and contexts in education (e.g. Lave and Wenger’s [1991] community of practice), affinity spaces call attention to and help us understand how knowledge and learning exist not only at an individual level but also in a distributed, situated form. Gee’s (2004) original description of affinity spaces and more recent conceptualizations of the term (e.g. Lammers et al., 2012) also draw attention to how changes in technology are shifting the nature of these spaces and participants’ related interactions.
In this paper, we explore the possibility that the social networking site Twitter is supporting affinity spaces for teachers across the United States. Recent research suggests that teachers and other educational professionals are using Twitter as a means of interacting and connecting with their colleagues and peers (Carpenter and Krutka, 2014). For example, State Educational Twitter Hashtags (SETHs) are Twitter spaces associated with individual American states developed by educators to interact with and support each other on a professional level. SETHs and other hashtag-based interactions may constitute some of the largest educational affinity spaces in the world.
#miched—the SETH associated with the state of Michigan—provides an example and illustration of why we were compelled to examine SETHs. #miched participants seem to use the hashtag at a regular time every week. Every Wednesday, a different moderator asks followers of the #miched hashtag to introduce themselves, after which the moderator spends an hour asking participants a series of questions. The topic of conversation changes by week but generally focuses around problems of practice such as creating meaningful homework assignments, communicating with parents, and integrating technology into students’ opportunities to learn.
These hashtag-based spaces seem to be teacher driven, public, largely unmoderated, and thriving. The apparent qualities of these informal, Twitter-based interactions among teachers could change the way that we conceive of teachers’ continuing professional development. However, phenomena like SETHs have not yet been the subject of any large-scale, systematic study. The research that does exist (e.g. Carpenter and Krutka, 2014, 2015; Visser et al., 2014) typically focuses on teacher perceptions of these spaces rather than on the characteristics of the spaces themselves. Indeed, very little is known about who participates in these spaces or even what the most basic patterns of activity in these spaces look like. Thus, this study represents a first-of-its-kind investigation of these patterns in SETHs.
This study seeks to address basic questions about SETHs as Twitter-based potential affinity spaces. To determine with confidence whether SETHs are serving as affinity spaces is no small undertaking, and an initial exploration of SETH-related data will provide a better understanding of the phenomenon and a stronger foundation for further investigation. Through the use of descriptive data about participants and their patterns of activity as tracked through their uses of SETHs, we focus our analysis on 47 key SETHs that appear to serve as education- and region-specific affinity spaces. In doing so, our intention is to further understand the nature of these spaces in a way that will facilitate further exploration of how they create opportunities for interaction and learning among and between these hashtag users.
Background and conceptual framework
In this study, we introduce SETHs and apply Gee’s (2004) theoretical construct of affinity spaces as a conceptual framework to describe the knowledge, interaction, and learning that exist within SETHs. We use this section to articulate this framework of affinity spaces, describe how Twitter generally—and SETHs specifically—may act as affinity spaces, and provide background on the digital methods that we will use to study SETHs.
Research on social aspects of learning
Learning in formal and informal settings is often social, ranging from interacting in a collaborative group to participating in disciplinary activities. While research on social aspects of learning has become more prominent in recent research (Greeno and Engestrom, 2014; Greeno et al., 1996), the roots of this thinking can be traced as far back as John Dewey’s work in the early 20th century. In the years since Dewey, the community of practice (Lave and Wenger, 1991) has emerged as one way of describing how these interactions take place. People and organizations in a community of practice individually and collectively participate in the consumption and dissemination of information and ideas. They also engage in a joint enterprise of contributing to their community’s sustainability as well as producing and sharing a repertoire of communal resources (Wenger, 2000).
Gee (2004) introduced the concept of an affinity space as an alternative to the community of practice. In doing so, he acknowledged the utility of the community of practice concept for describing the interactions that take place during learning but argued that the idea has been overused, in part because it is difficult to use precisely. Gee also noted that “modern technologies allow the creation of more and more spaces where people can enter and interact with others (and with objects and tools) at a distance” (2004: 216). Thus, affinity spaces may exist in face-to-face and virtual settings. By way of example, Gee described an online chat room focused on a multi-player video game and explained how people who enter this chat room engage in a shared, virtual affinity space, where both the space (i.e. the online chat room) and the reason for joining and participating in the chat room (i.e. interest in a particular multi-player video game) support the affinity space’s existence.
Educational Twitter hashtags as affinity spaces
Twitter is built around 140-character tweets, small posts that include small amounts of content such as short phrases or sentences, images, or links (Kaplan and Haenlein, 2011). Most interaction on Twitter is focused on a feed made up of the tweets composed by people a user has chosen to follow. However, certain conventions can be used to break out of the feed for more specific interactions. For example, to directly engage with someone, the at-sign (@) can be employed to mention other users, thereby alerting them to the post. Alternatively, to engage with a focused collection of tweets, users can forego the standard feed in favor of a stream of tweets that match a particular search term. Hashtags are standardized search terms prefaced with a number sign (#) that are meant to facilitate reading groups of tweets on the same topic.
Hashtags in particular have lent themselves to a variety of educational uses. For example, #edchat is a hashtag that users can either follow to read about educational topics writ large or include in their own tweets to extend their audience to other educators. Other hashtags are more specific, such as #elachat, which is focused on topics related to English/Language Arts (ELA), or #apchat, which focuses on issues related to assistant principals. Researchers have taken note of how these hashtags serve as venues for teacher professional learning and have surveyed participants in order to better understand their participation (Carpenter and Krutka, 2015). For example, Britt and Paulus (2016) studied the hashtag #edchat. Of particular interest to these researchers were the weekly chat associated with this hashtag and those who participated in the chats. The study’s results indicated that connections to and participation in the weekly chat positively supported participants’ professional learning and development, in large part because participants could connect with others to regularly engage and discuss education-based topics as well as share resources and ideas. Given that Gee (2004) explicitly refers to the Internet when describing digital affinity spaces, it is not difficult to extend this framework to our conceptions of these educational hashtags.
Yet, while any and all of these hashtags could serve as affinity spaces, SETHs may merit particular attention. In the United States, educational systems have historically been under local control (Spring, 2016); local, district, and state-level entities are directly engaged in decisions related to funding, curriculum development, and assessment. Teachers and other stakeholders engage with their local educational community in many ways, such as after-school events in their own buildings, local school board meetings, and professional development opportunities at the district level and beyond. It should therefore come as no surprise that many educational hashtags are, in fact, grounded in a particular region. A survey of educational Twitter communities shows that most states are associated with at least one SETH (Junkins, 2014; Mazza, 2014). An examination of these hashtags may help us understand state-specific education issues and topics as well as the nature of the ideas and resources their users share.
Digital methods for Twitter research
Digital technologies not only afford new conceptions of affinity spaces—as Gee (2004) noted—but also afford new methods for researching these affinity spaces. Whereas researchers would have once needed to measure and describe interactions in an affinity space through some indirect means, teachers engaging with affinity spaces now interact with each other in ways that persist long enough and are accessible enough for researchers to collect directly. Indeed, digital methods are new research techniques that have been built around the collection and analysis of data coming from Twitter and similar sources (Lazer et al., 2009; Snee et al., 2016).
The use of digital methods in educational research can be traced as far back as the year 2000 (Baker and Siemens, 2014) and has grown more common over time. Specific fields such as educational data mining or learning analytics (Baker and Siemens, 2014; Penuel and Frank, 2016) utilize digital methods associated with contexts intentionally designed for education; in this paper we use the term digital methods to focus instead on “the use of online and digital technologies to collect and analyze research data” (Snee et al., 2016: 1). Studies employing digital methods are often explicitly or implicitly associated with affinity spaces. For example, video games are held to be powerful spaces for learning in part because they produce data that can be used for teaching and assessment purposes (Ifenthaler et al., 2012; Kafai and Dede, 2014; Loh et al., 2015; Steinkuehler and Squire, 2014). Likewise, another kind of online space—the Internet forum—can be downloaded and subsequently analyzed for evidence of knowledge, thinking, and learning (Steinkuehler and Duncan, 2008).
Naturally, a range of digital methods has been used to study the use of Twitter in education. For example, Kassens-Noor (2012) compiled a Twitter list (i.e. a customized feed) of undergraduate and graduate students enrolled in a particular class in order to study their learning in the class. Alternatively, Gleason (2013) used a third-party application to archive tweets that used a particular hashtag and then analyzed them for evidence of informal learning. Veletsianos (2012) took yet another route by using the Twitter application programming interface (API) to collect tweets associated with scholars employed at institutions of higher education and then employed qualitative analysis to find themes emerging from their tweets.
Purpose
Given SETHs’ potential to serve as important affinity spaces and their absence in the extant literature, our purpose in this study is to present the first examination of SETHs as candidate Twitter-based educational affinity spaces. State-based Twitter affinity spaces are potentially well suited to deliver localized topics for educators to work with, learn about, and discuss within a sustainable community. Research on SETHs is critical because with it comes the opportunity to better learn from and support a large number of teachers and other education stakeholders who participate in these affinity spaces.
Employing digital methods, we seek to understand the characteristics of these affinity spaces evidenced in patterns of their activity over the course of a 6-month data collection period. As described earlier, Gee (2004) and others (e.g. Lammers et al., 2012) describe affinity spaces as digital or physical spaces that are built around some kind of content and in which people interact with each other through some kind of portal (i.e. a means by which people enter the space). This study focuses on people’s interactions around portals: We examine who these people are, how often and when they interact, and which portals they made use of. While the content around which the interactions we examine is evidently educational, an examination of the specific topics is too unwieldy at present due to the magnitude of tweets we collected; however, discovering who is participating and how active participants are may provide the opportunity for future researchers to study specific SETHs at specific times to better understand the nature of the content shared and discussed. In short, the scope of the data collected required us to focus on which particular SETHs will be best suited to subsequent analysis and at what times subsequent analysis might most productively focus on.
We developed research questions by identifying SETHs and determining how an examination of them could lend initial insight into how these spaces function. Our primary concerns were to learn more about participants, determine levels of participation, and examine when participation took place. Taken together, these lines of inquiry help us better understand the degree to which SETHs, individually and collectively, serve as affinity spaces. Accordingly, we answer the following questions on both an aggregate and individual level; while the first question focuses on the members of the affinity space and their characteristics, the other two scrutinize patterns of interaction within the spaces:
Who is participating in these Twitter-based educational affinity spaces? How active are participants in these Twitter-based educational affinity spaces? When are participants active in Twitter-based educational affinity spaces?
Method
In this section, we describe the sources of our data, the means we used to collect it, and the measures we developed for each research question.
Data sources
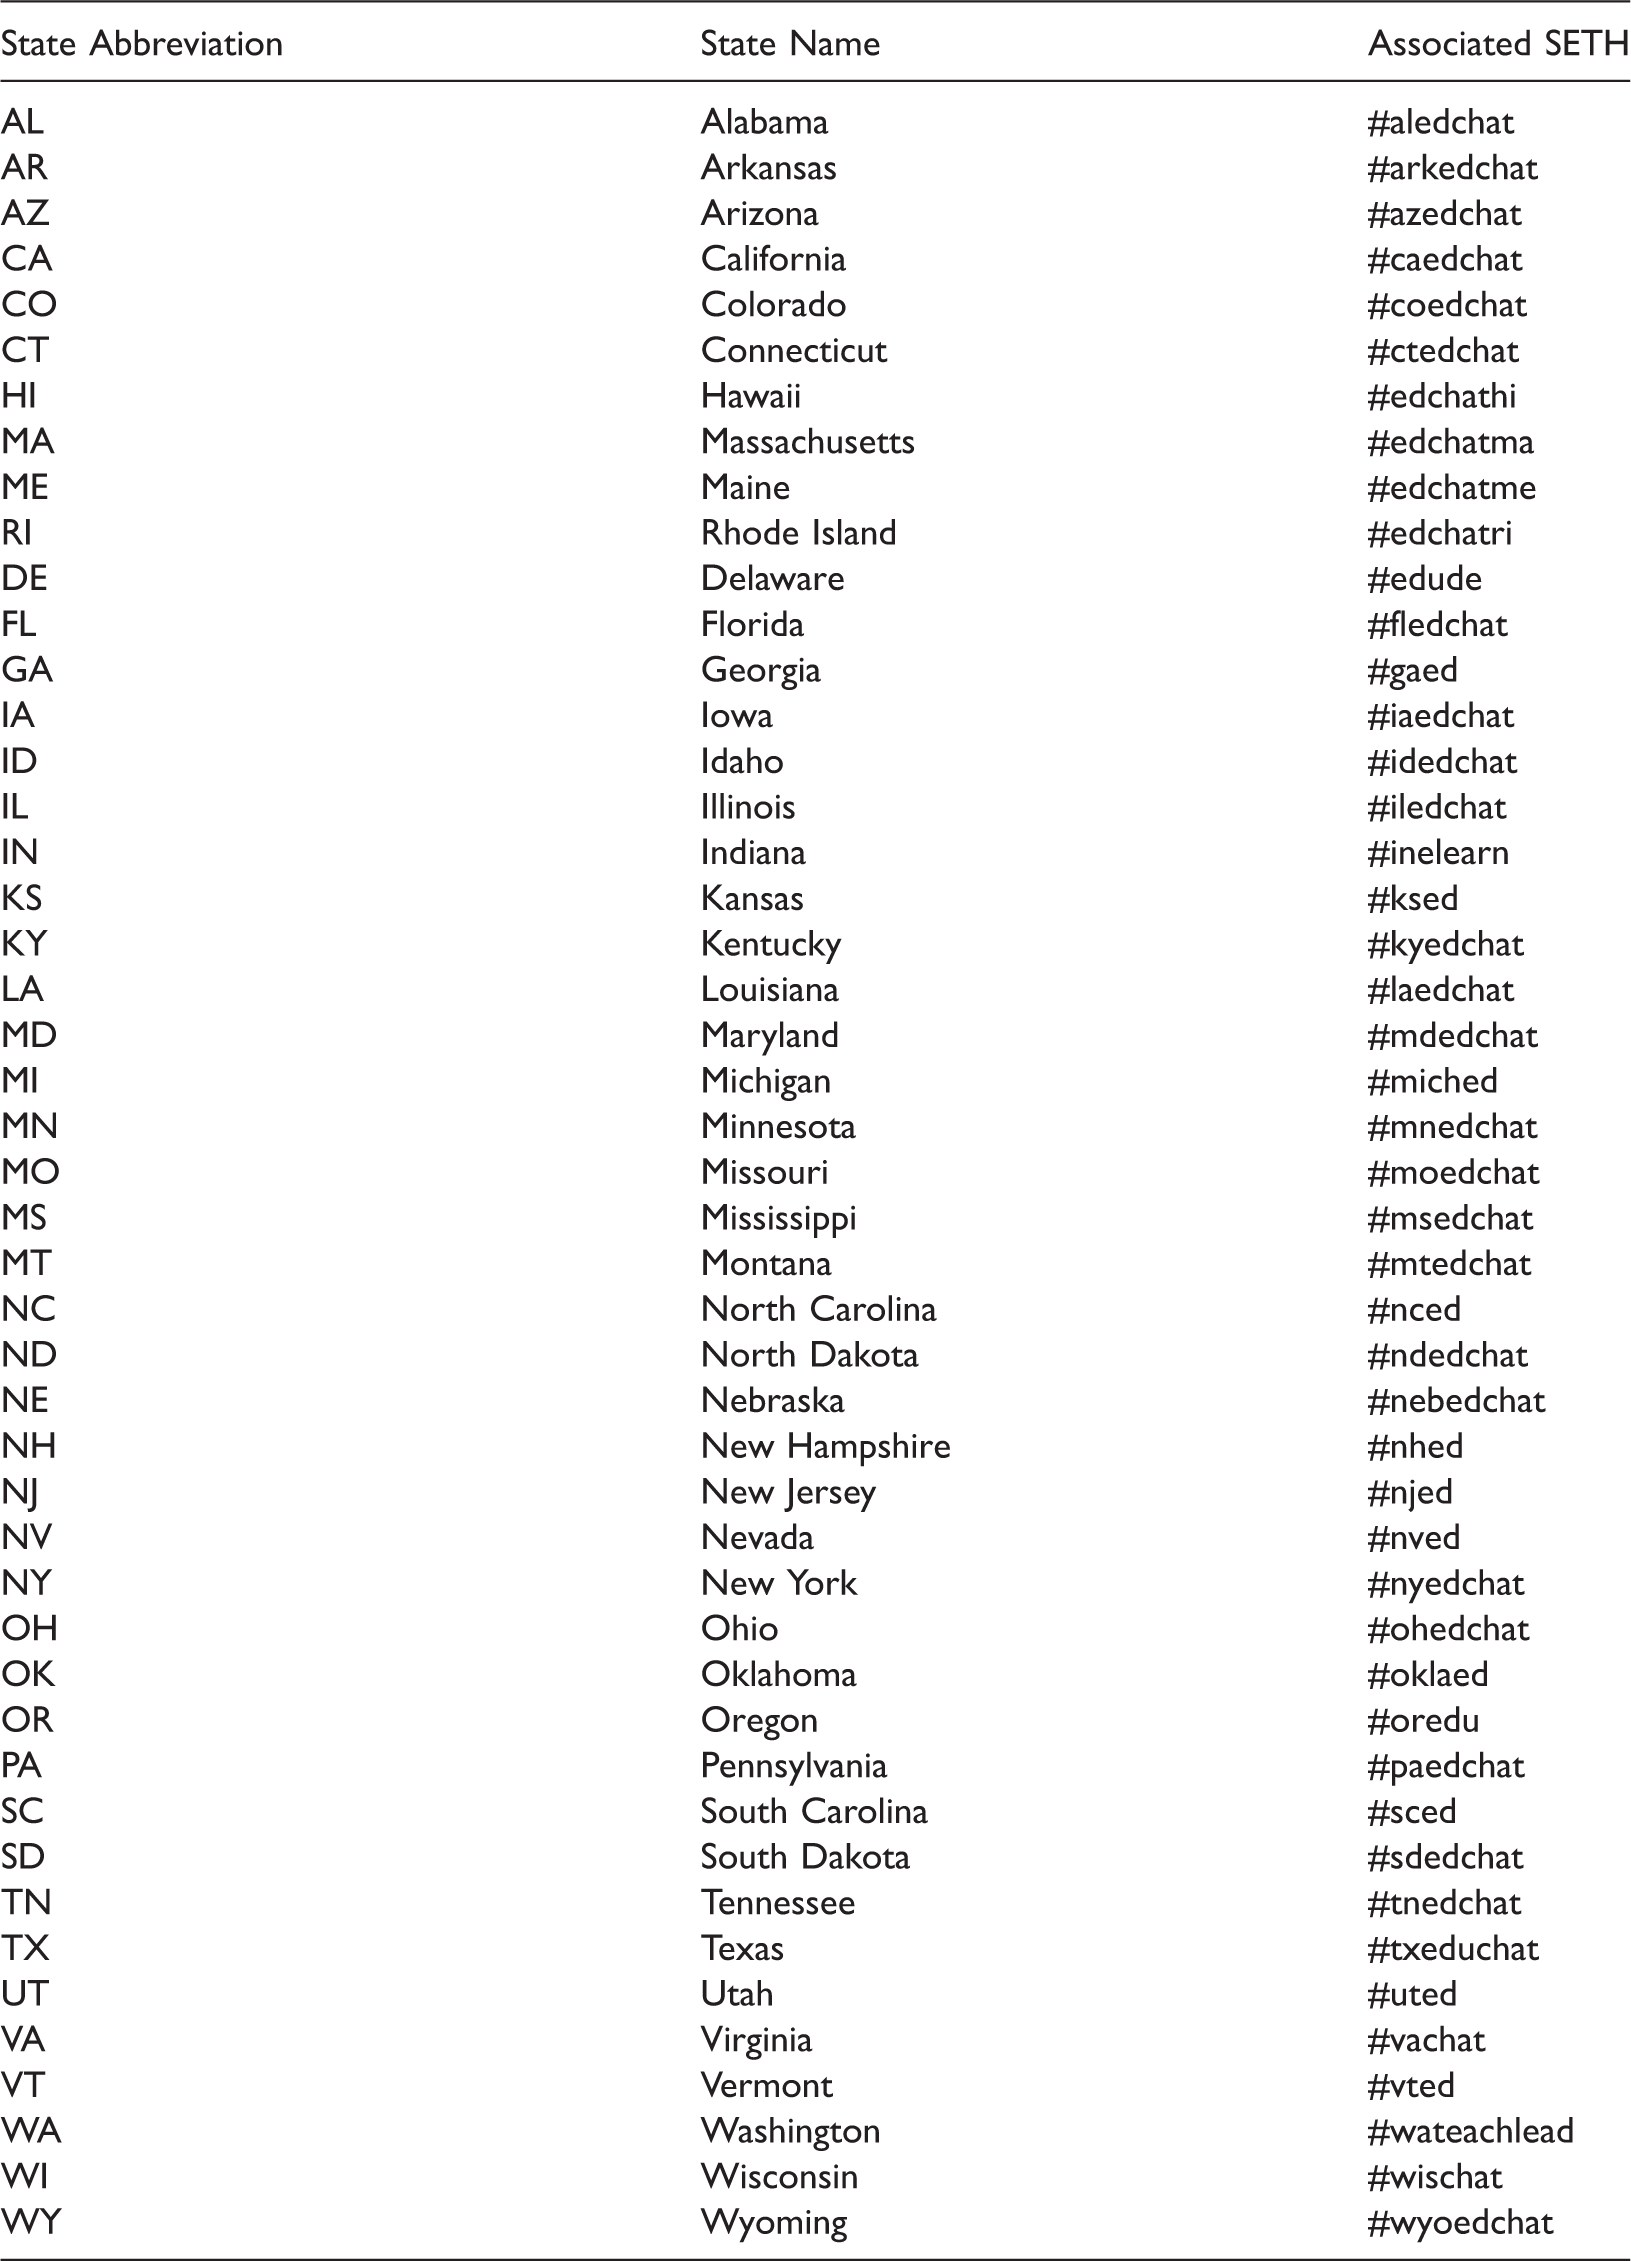
State abbreviations, names, and associated SETHs.
We also drew basic information on the educational community (i.e. the number of teachers) for each state from the 2013–2014 State Nonfiscal Public Elementary/Secondary Education Survey (National Center for Education Statistics, 2014).
Data collection
To collect data from these SETHs, we accessed the Twitter API through a series of Twitter Archivers built with Google Apps Scripts and Google Sheets (Agarwal, 2015). Once activated, a Twitter Archiver monitors all tweets matching a particular search term (such as a SETH) and collects up to 50 tweets for every period of 15 minutes. This includes retweets, instances when one Twitter user reposts another user’s tweet. The content of each tweet (or retweet) is stored in a Google Sheet alongside the username of the person who tweeted (or retweeted) the post, a timestamp, and other information. We used the Twitter Archivers to continuously collect tweets for 6 months, from 1 January 2015 to 30 June 2015.
We also collected information from Twitter profiles using the programming language and statistical software R. The script we wrote collected participant profile information for a given list of Twitter usernames (in this case, usernames associated with SETHs). That information included what the participants listed in terms of their name, location, and personal description.
Measures
Measures used in this study and their descriptions.
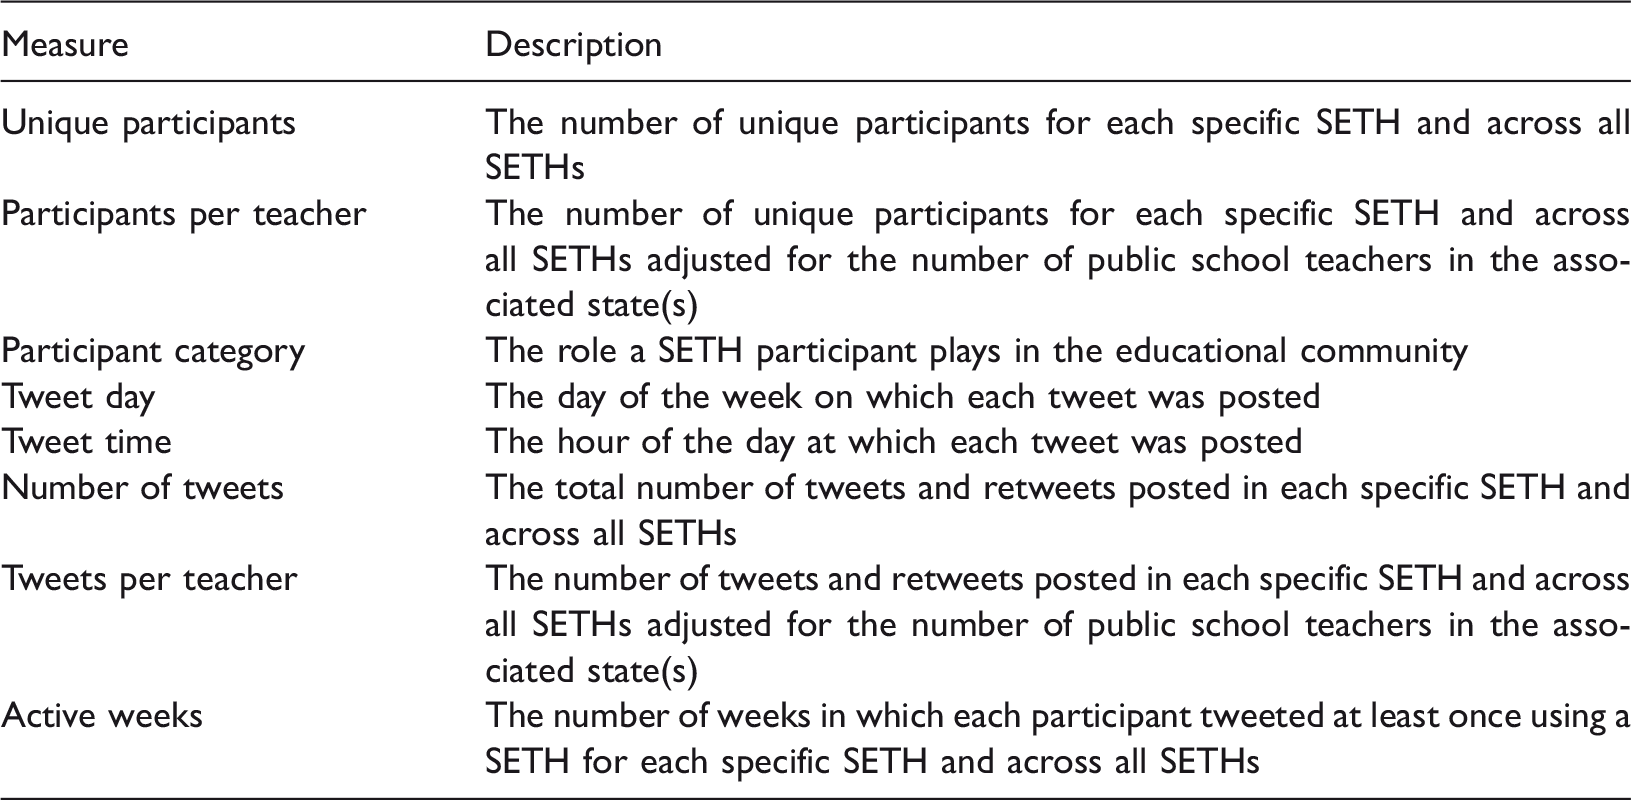
We first calculated the unique participants measure, which allowed us to measure the size of these affinity spaces in terms of participants. We calculated this measure by counting the number of unique participant names associated with both each specific SETH and all SETHs generally. We note that because participants may use more than one SETH, the sum of the number of unique participants per SETH is greater than the total number of participants across all SETHs, which only allows participants to be counted once.
While the unique participants measure lends insight into the raw number of participants per state, our participants per teacher measure corrects these numbers for the size of each state’s educational community, drawing from data on the number of public school teachers for each state (National Center for Education Statistics, 2014).
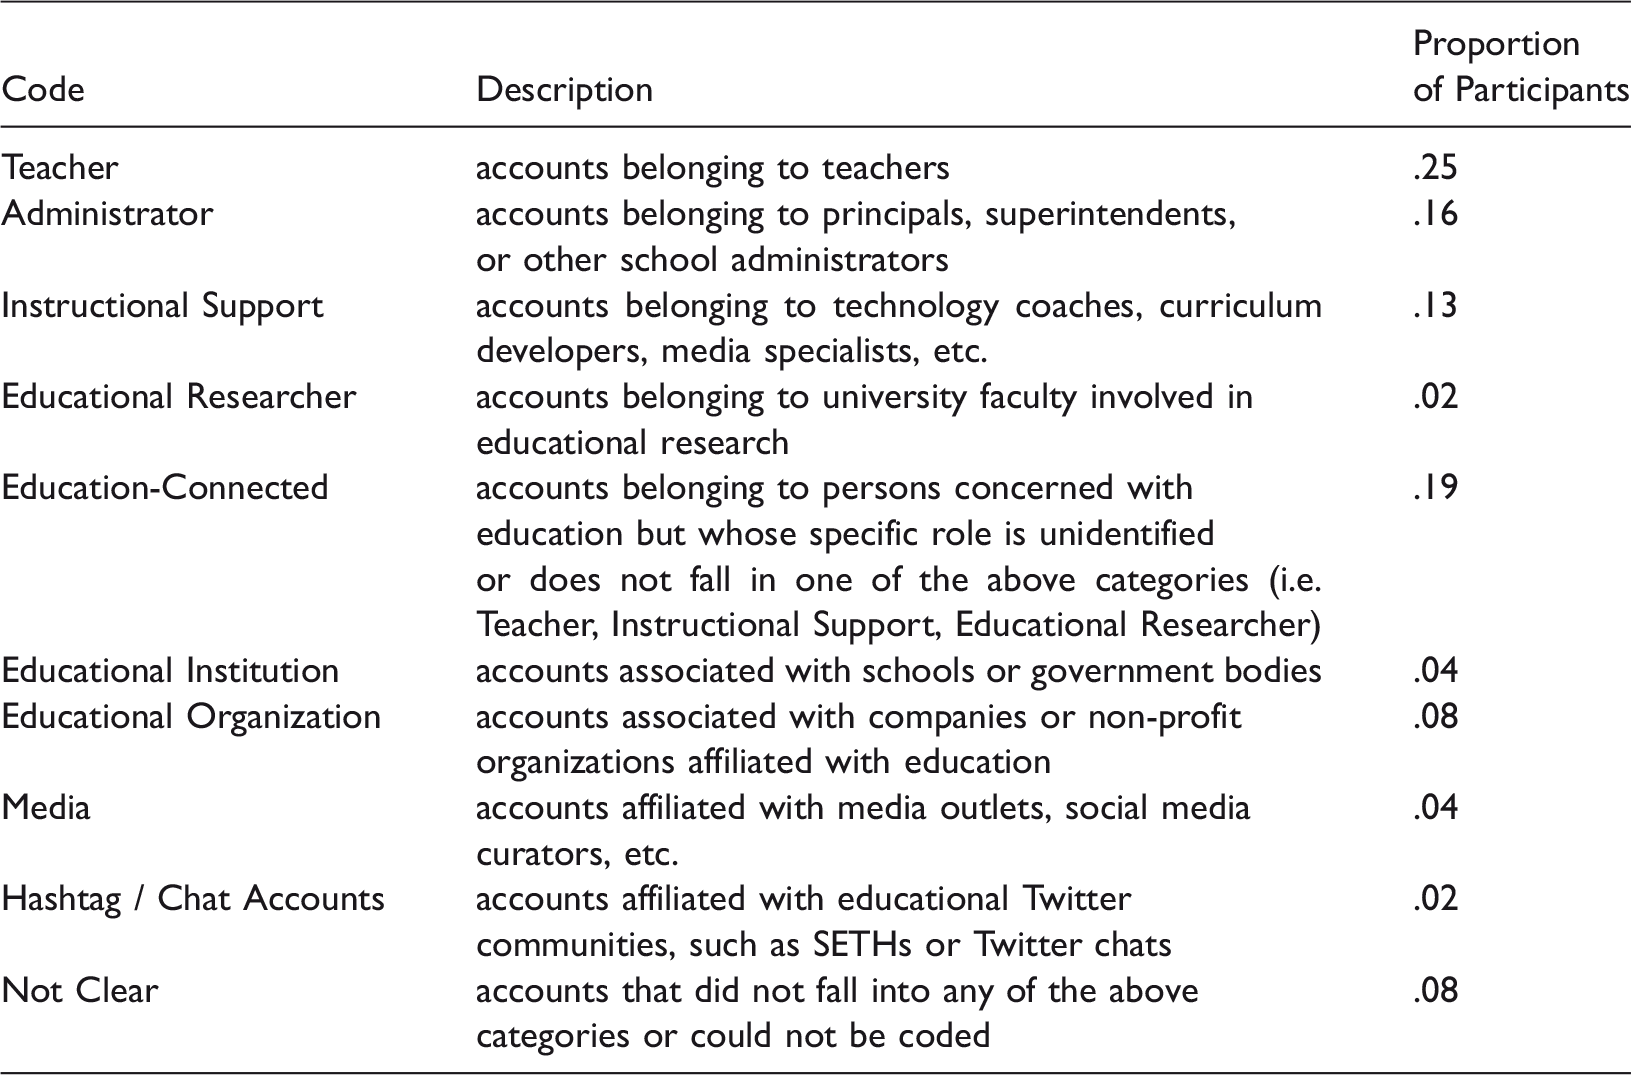
Codes, descriptions, and proportion of participants for different roles. These proportions are based on 500 participants’ profiles.
Our tweets per teacher measure provided further insight into the activity across and within SETHs by correcting these numbers for the size of each state’s educational community as measured by the number of teachers. As before, we made these corrections based on data about the number of public school teachers working in the United States (National Center for Education Statistics, 2014).
Finally, we developed an active weeks measure. Previous research (e.g. Java et al., 2007; Veletsianos, 2012) has used the figure of one tweet per week to signify active Twitter participation. We therefore used an R script to count the number of weeks in which each participant tweeted using a SETH at least once.
Results
In this section, we report results for our three research questions, beginning with findings related to who is participating in these SETH-based potential affinity spaces and then addressing findings related to participants’ degree and time of activity.
RQ1: Who is participating in these affinity spaces?
Our unique participants measure allowed us to determine the size of these affinity spaces in terms of their participants. We found 68,552 unique Twitter users who participated in SETHs over the course of these 6 months, for an average of 1458.55 participants per SETH. As seen in Figure 1(a), states such as Oklahoma, Michigan, and California have high levels of unique participants whereas states such as Vermont, Montana, and Oregon have low levels.
Number of participants per SETH (a) and number of participants per SETH adjusted for the number of teachers in the associated state (b). Data was collected from 1 January 2015 through 30 June 2015. No data were available for Alaska, New Mexico, or West Virginia. The number of teachers for each state was retrieved from the 2013–2014 State Nonfiscal Public Elementary/Secondary Education Survey (National Center for Education Statistics, 2014).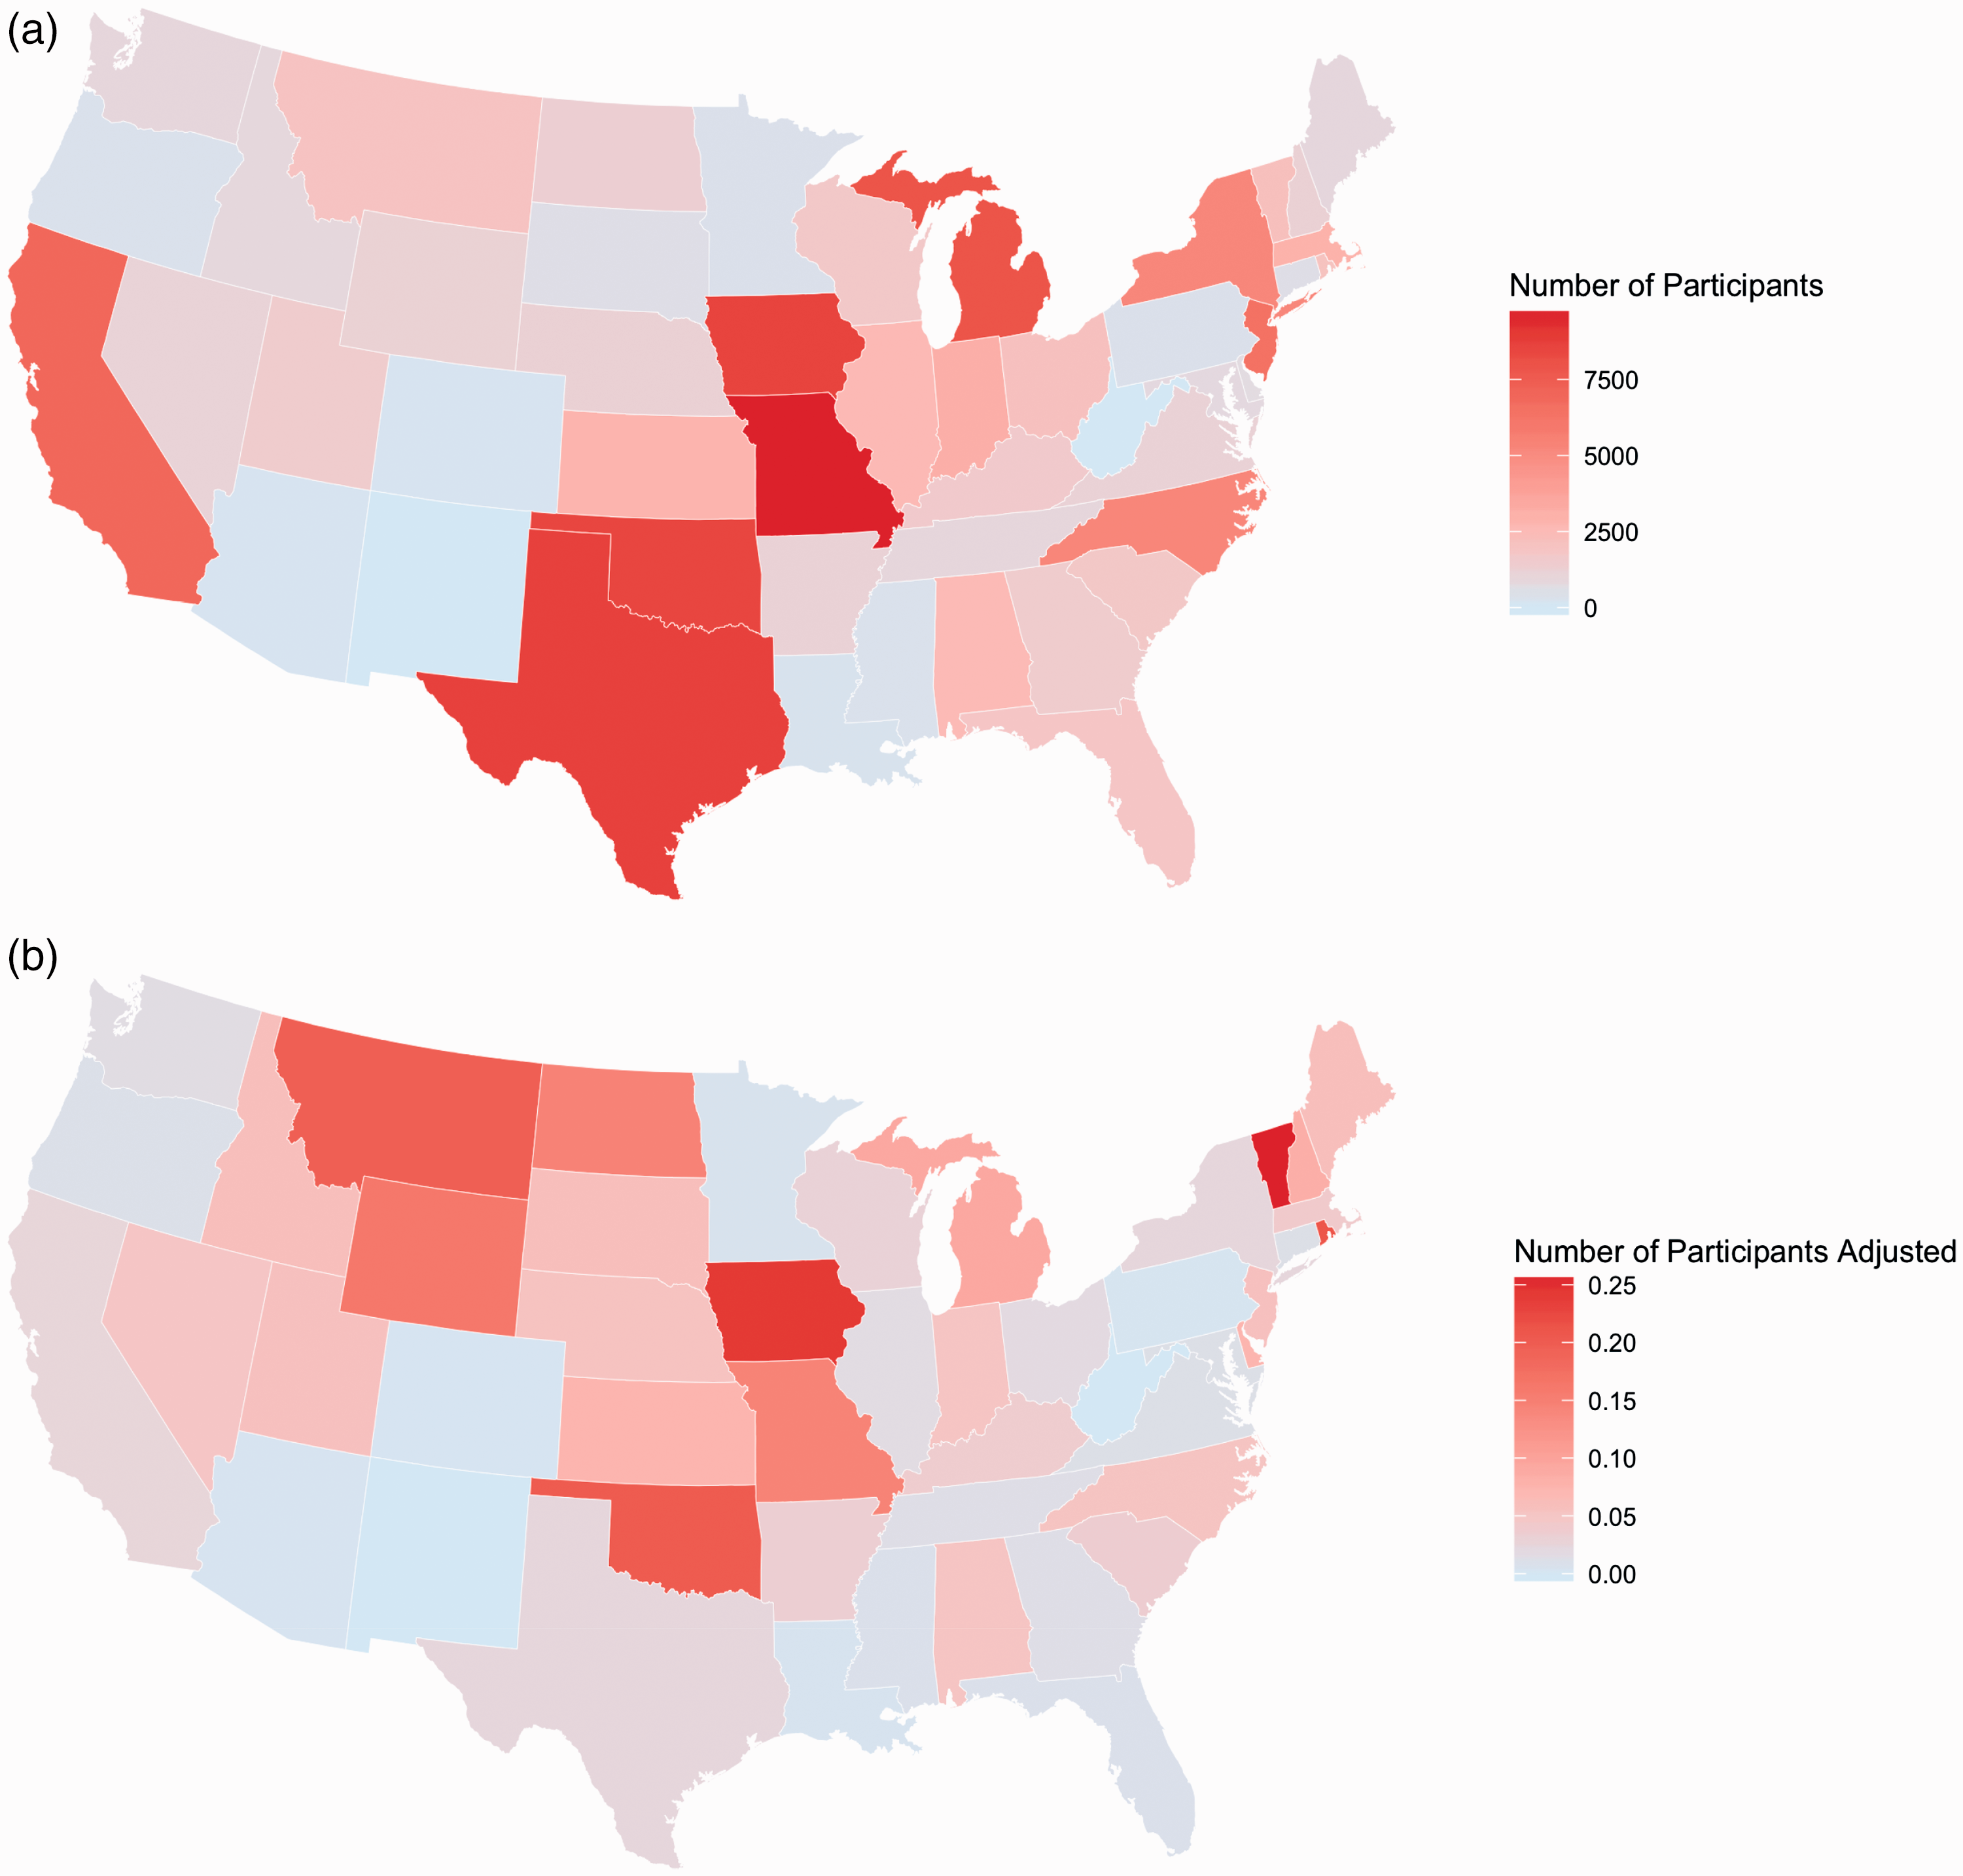
Our participants per teacher measure lends further insight by correcting the unique participants measure for the number of teachers in the states associated with each SETH. Figure 1(b) demonstrates that while some states with high levels of unique participants (e.g. Oklahoma) also had high levels of participants per teacher compared with others, states such as Michigan and California actually had more typical numbers of participants given the size of their educational communities. Furthermore, some states that did not initially appear to have many participants (such as Vermont and Montana) stand out after adjusting for the number of teachers in the state, suggesting higher relative numbers of participants when the size of the educational community in the state is accounted for.
Using our participant category measure, we drew specific conclusions about who was participating in SETH-based affinity spaces. As illustrated in Table 3—which also describes each category—self-identified teachers are the largest group associated with SETH-related tweets (25%), followed by other education stakeholders (19%), administrators (16%), and instructional support staff (13%). In total, practitioners (i.e. teachers, administrators, and instructional staff) are responsible for over half of SETH tweets.
RQ2: How active are participants in these affinity spaces?
To examine how active participants are in these affinity spaces, we used our number of tweets measure to determine the amount of activity across and within SETHs. This measure yielded 556,766 total tweets (and retweets) associated with all SETHs (N = 47), less than the sum of the number of tweets collected for each SETH individually (583,716), because 27,039 tweets included hashtags associated with more than one SETH and were therefore collected multiple times. This number represents an average of approximately 11,846 tweets per SETH and an average of approximately 3076 SETH-related tweets per day across the 47 states associated with SETHs (or approximately 65 tweets per SETH per day), suggesting high levels of activities in this affinity space. However, Figure 2(a) shows that the actual number of tweets per SETH over the entire 6 months varies from state to state, with some SETHs having much higher levels of activity than others.
Number of tweets per SETH (a) and number of tweets per SETH adjusted for the number of teachers in the associated state (b). Data was collected from 1 January 2015 through 30 June 2015. No data were available for Alaska, New Mexico, or West Virginia. The number of teachers for each state was retrieved from the 2013–2014 State Nonfiscal Public Elementary/Secondary Education Survey Data (National Center for Education Statistics, 2014).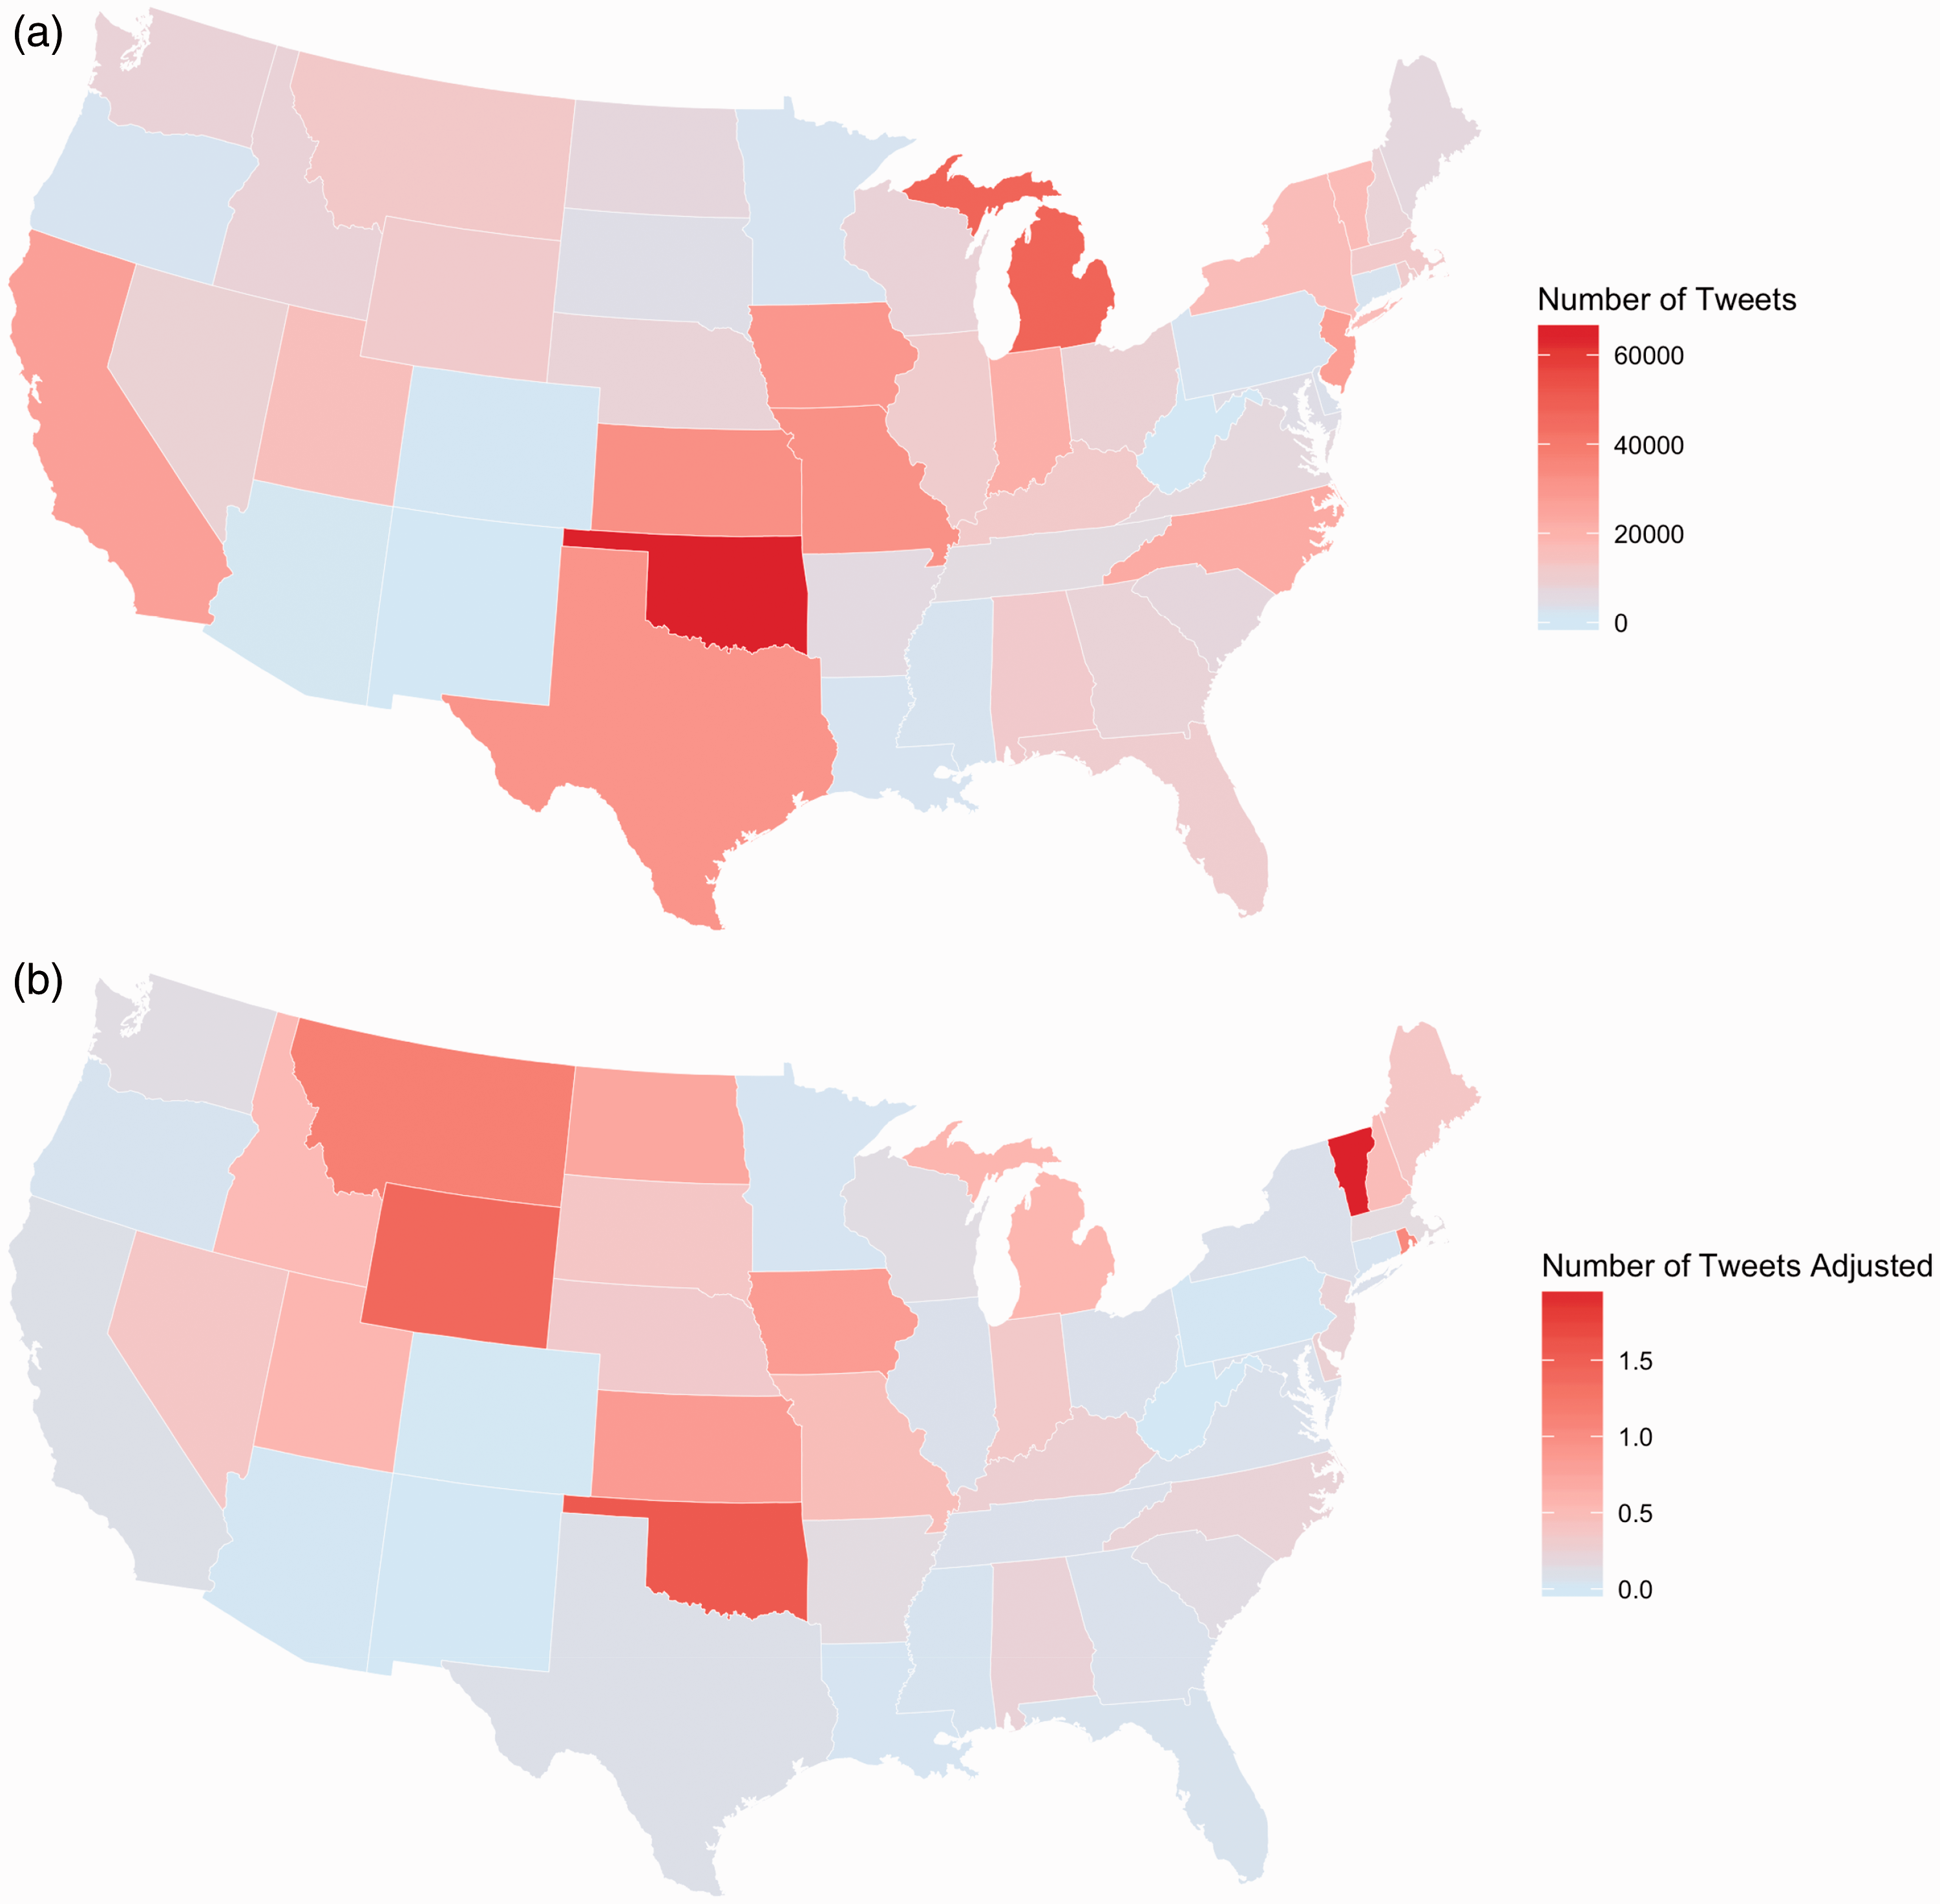
Correcting these numbers for the size of each state’s educational community allowed us to gain further insight through our tweets per teacher measure. Applying this measure across all 47 SETHs results in a figure of about 0.19 tweets per teacher in these 47 states over the course of these 6 months. As with the previous measure, however, this measure varies from SETH to SETH; the nature of this variance can be seen in Figure 2(b). Correcting these numbers for the number of teachers in each state is instructive. Similarly to our unique participants and participants per teacher measures, some SETHs retain relatively high levels of activity, others are no longer as prominent, and yet others that were unremarkable in terms of raw activity do stand out when that activity is corrected for number of teachers.
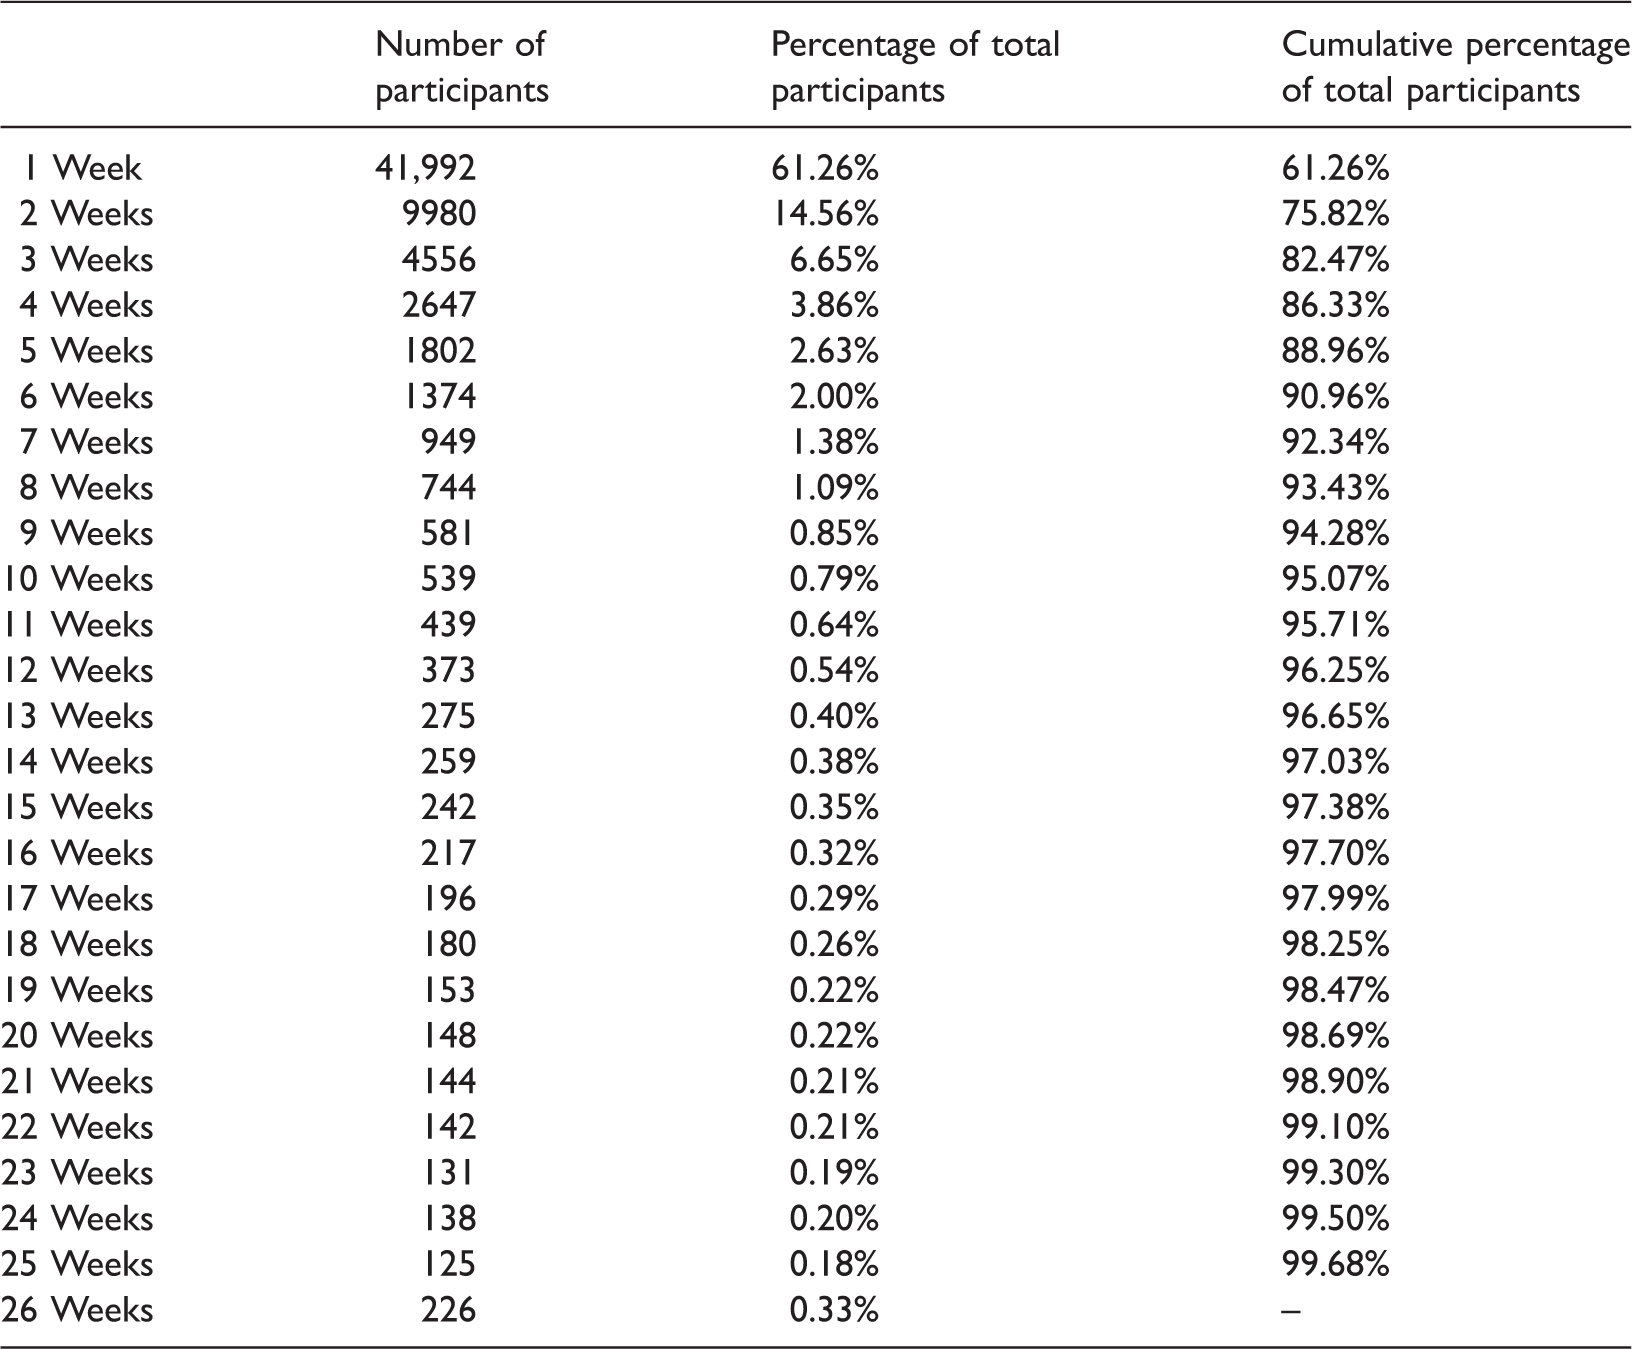
Distribution of participants by number of weeks with at least one tweet. Total number of participants is 68,552. Week 26 was only 6 days long.
RQ3: When are participants active in these affinity spaces?
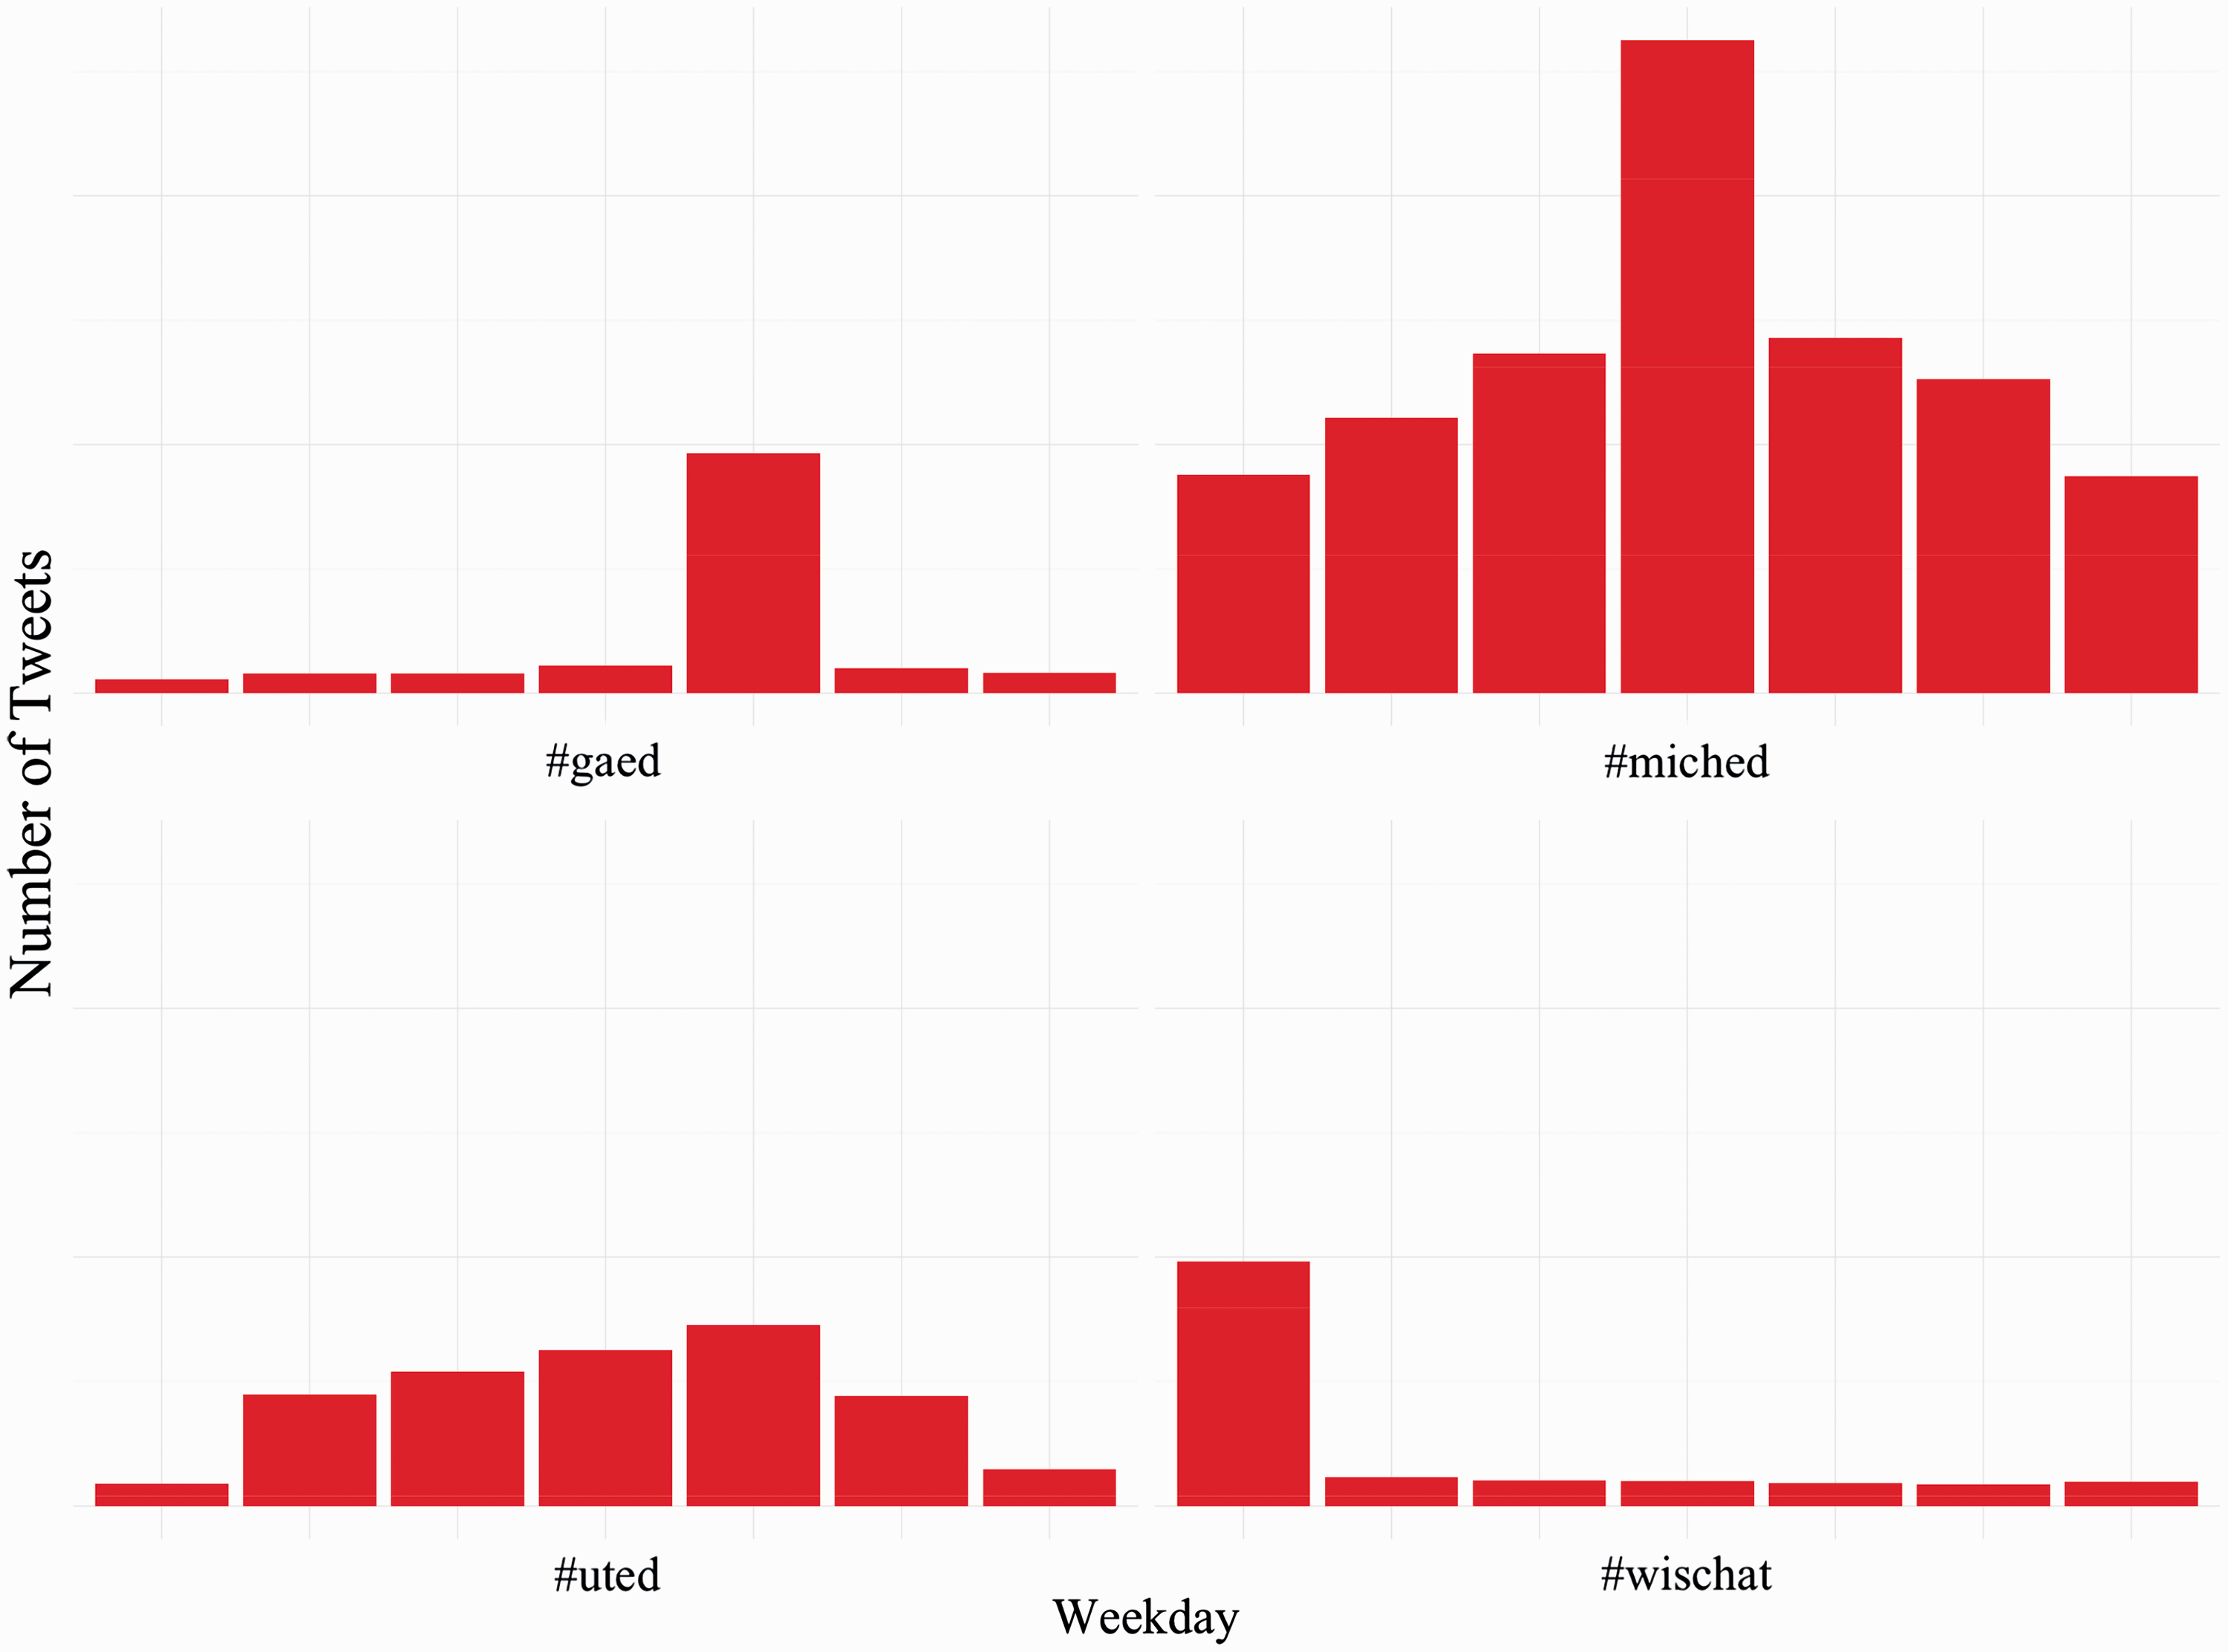
Our tweet day measure allowed us to determine the number or percentage of SETH tweets corresponding with each day of the week. Figure 3 shows these results across all 47 SETHs; the most SETHs traffic happens on Sundays and Thursdays (over 15% of tweets on each day), with the least amount of traffic on Fridays and Saturdays. This contrasts with overall patterns of use for Twitter; according to Sysomos (2014), Tuesday, Wednesday, and Friday generally see the most tweet traffic. Examining select SETHs, as in Figure 4, helps to illustrate some of the variation in terms of the day of the week during which engagement occurs. While #gaed is most active on Thursday (with very low activity during other weekdays), #miched is most active on Wednesday (but retains relatively high activity across other weekdays), and participants for #uted demonstrate relatively consistent engagement throughout the week. Some of these individual patterns also contrast with the Sysomos (2014) report, in that they see a sharp peak on one day of the week whereas general Twitter use—despite higher levels on some days than others—remains relatively consistent throughout the week.
Percentage of tweets by day of week for all SETHs. Number of tweets by day of week for select SETHs. Note. The days of the week are the same as in Figure 3.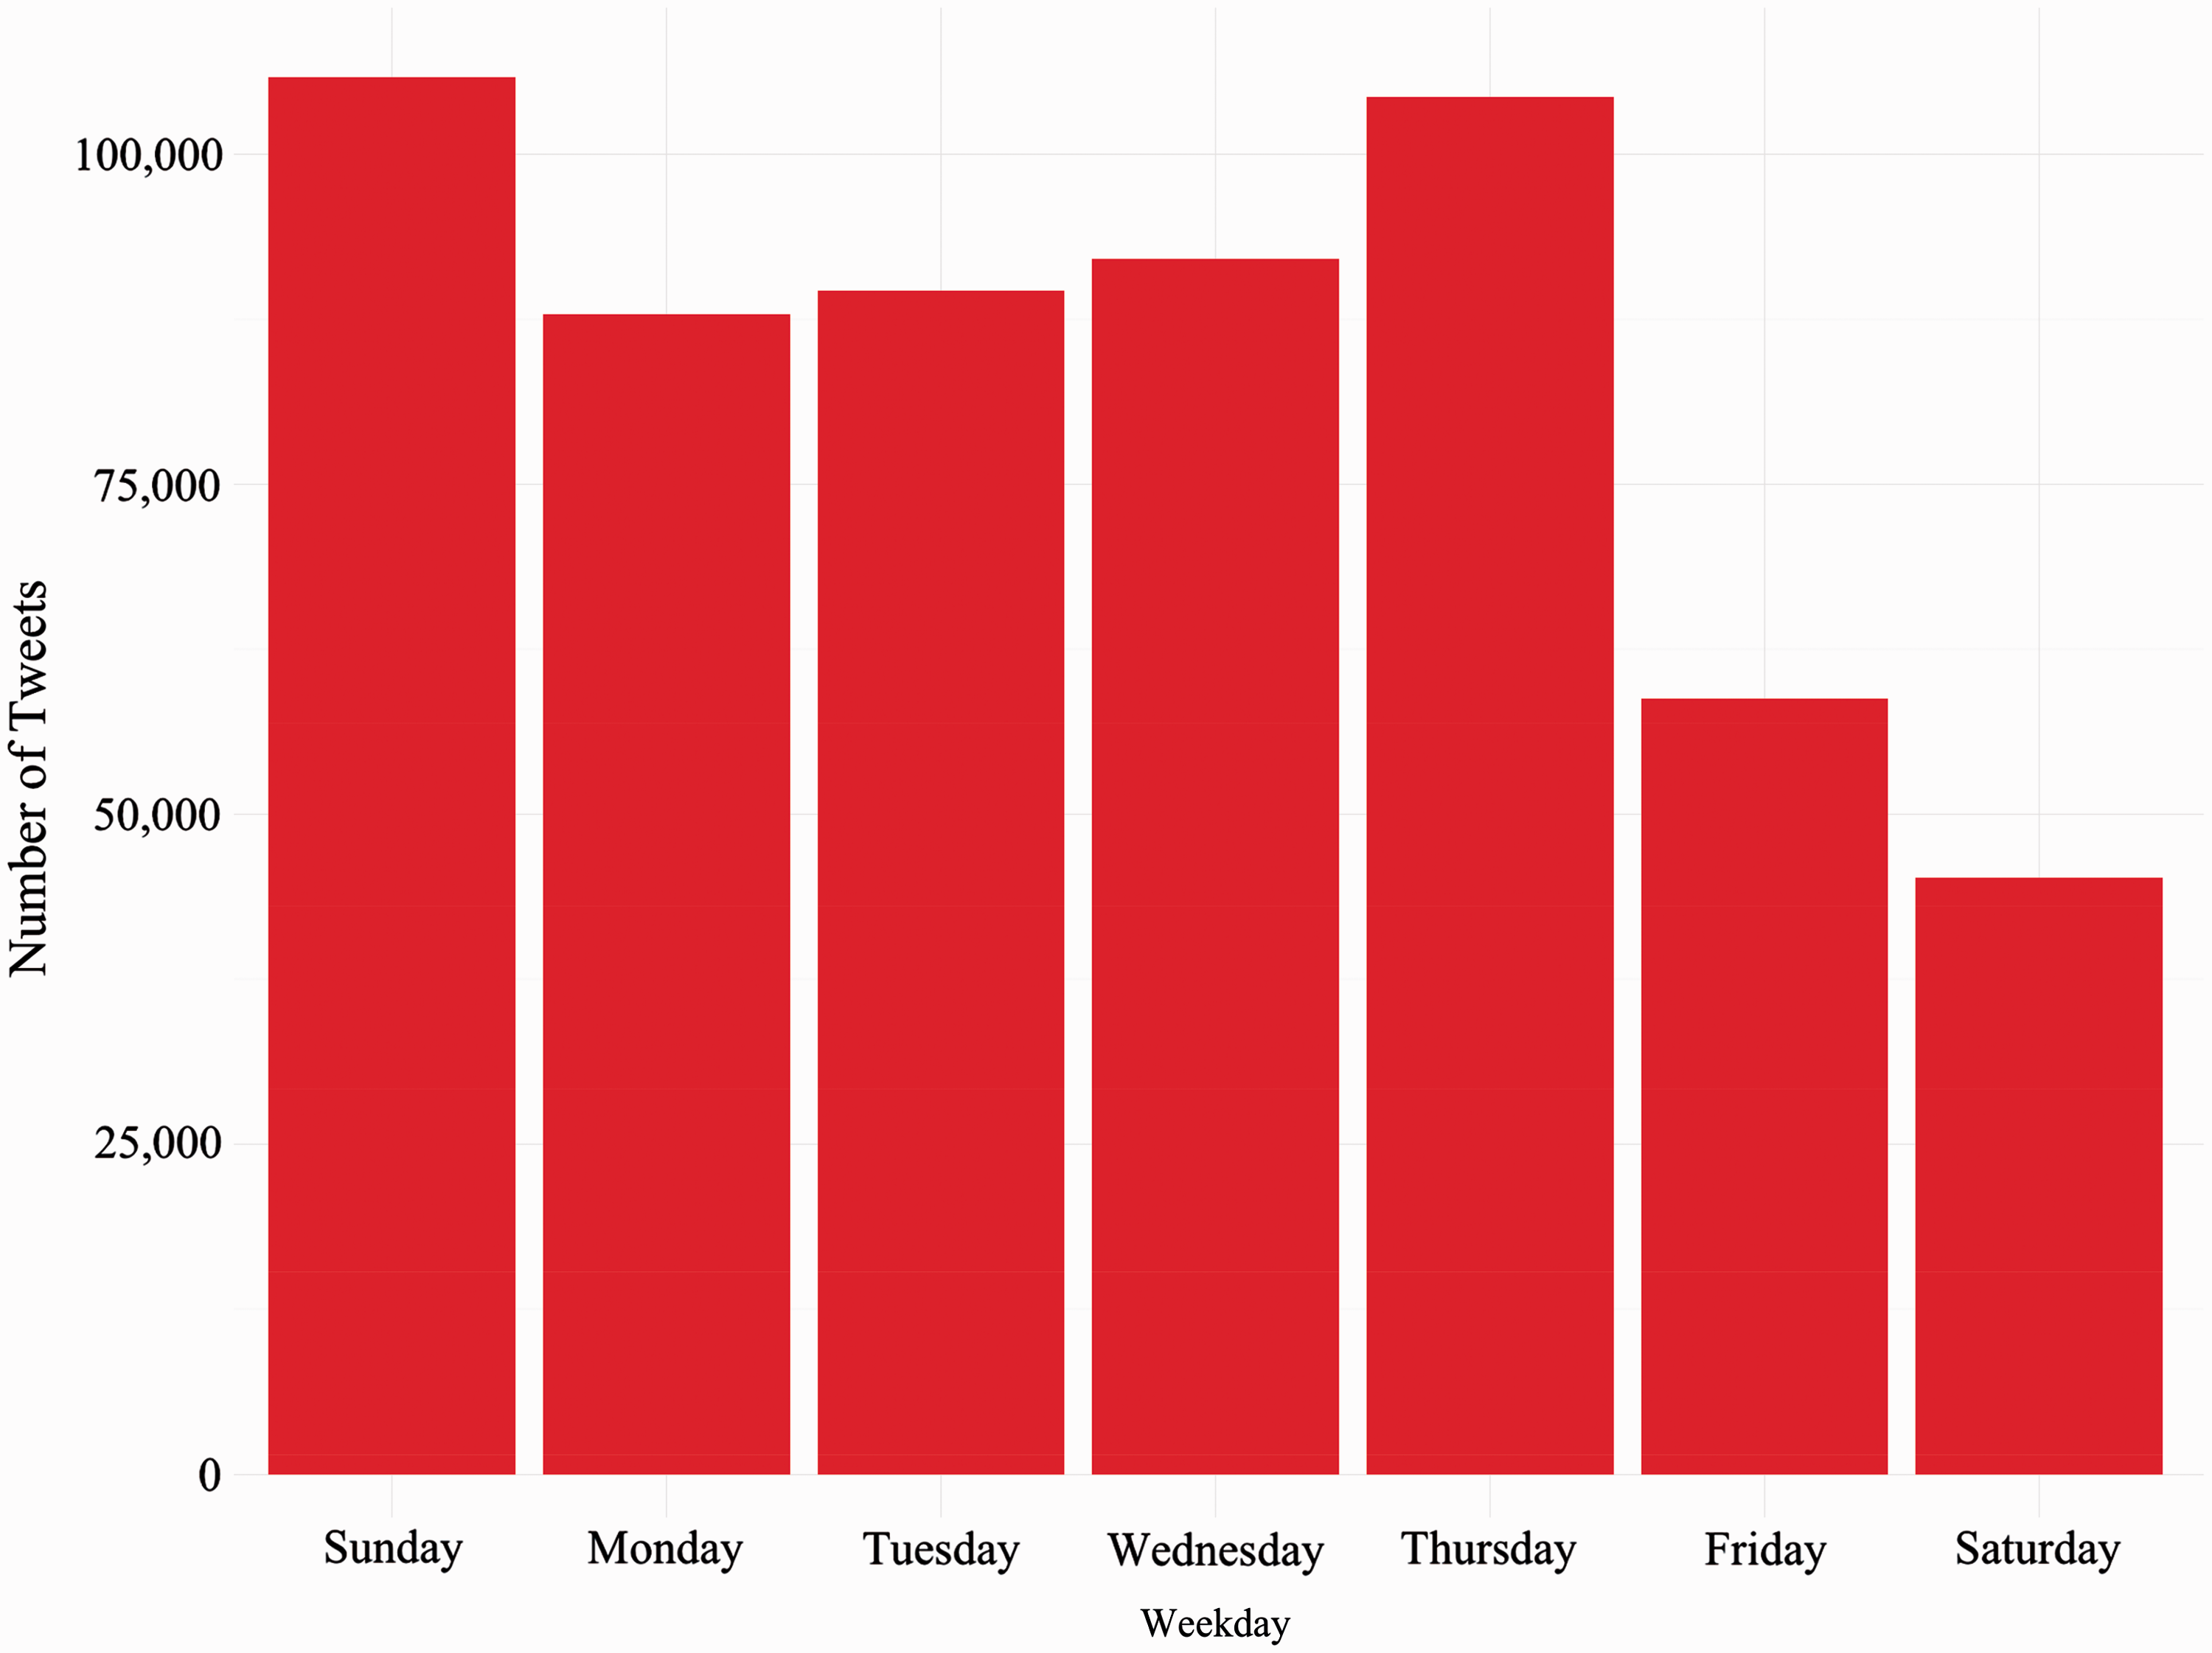
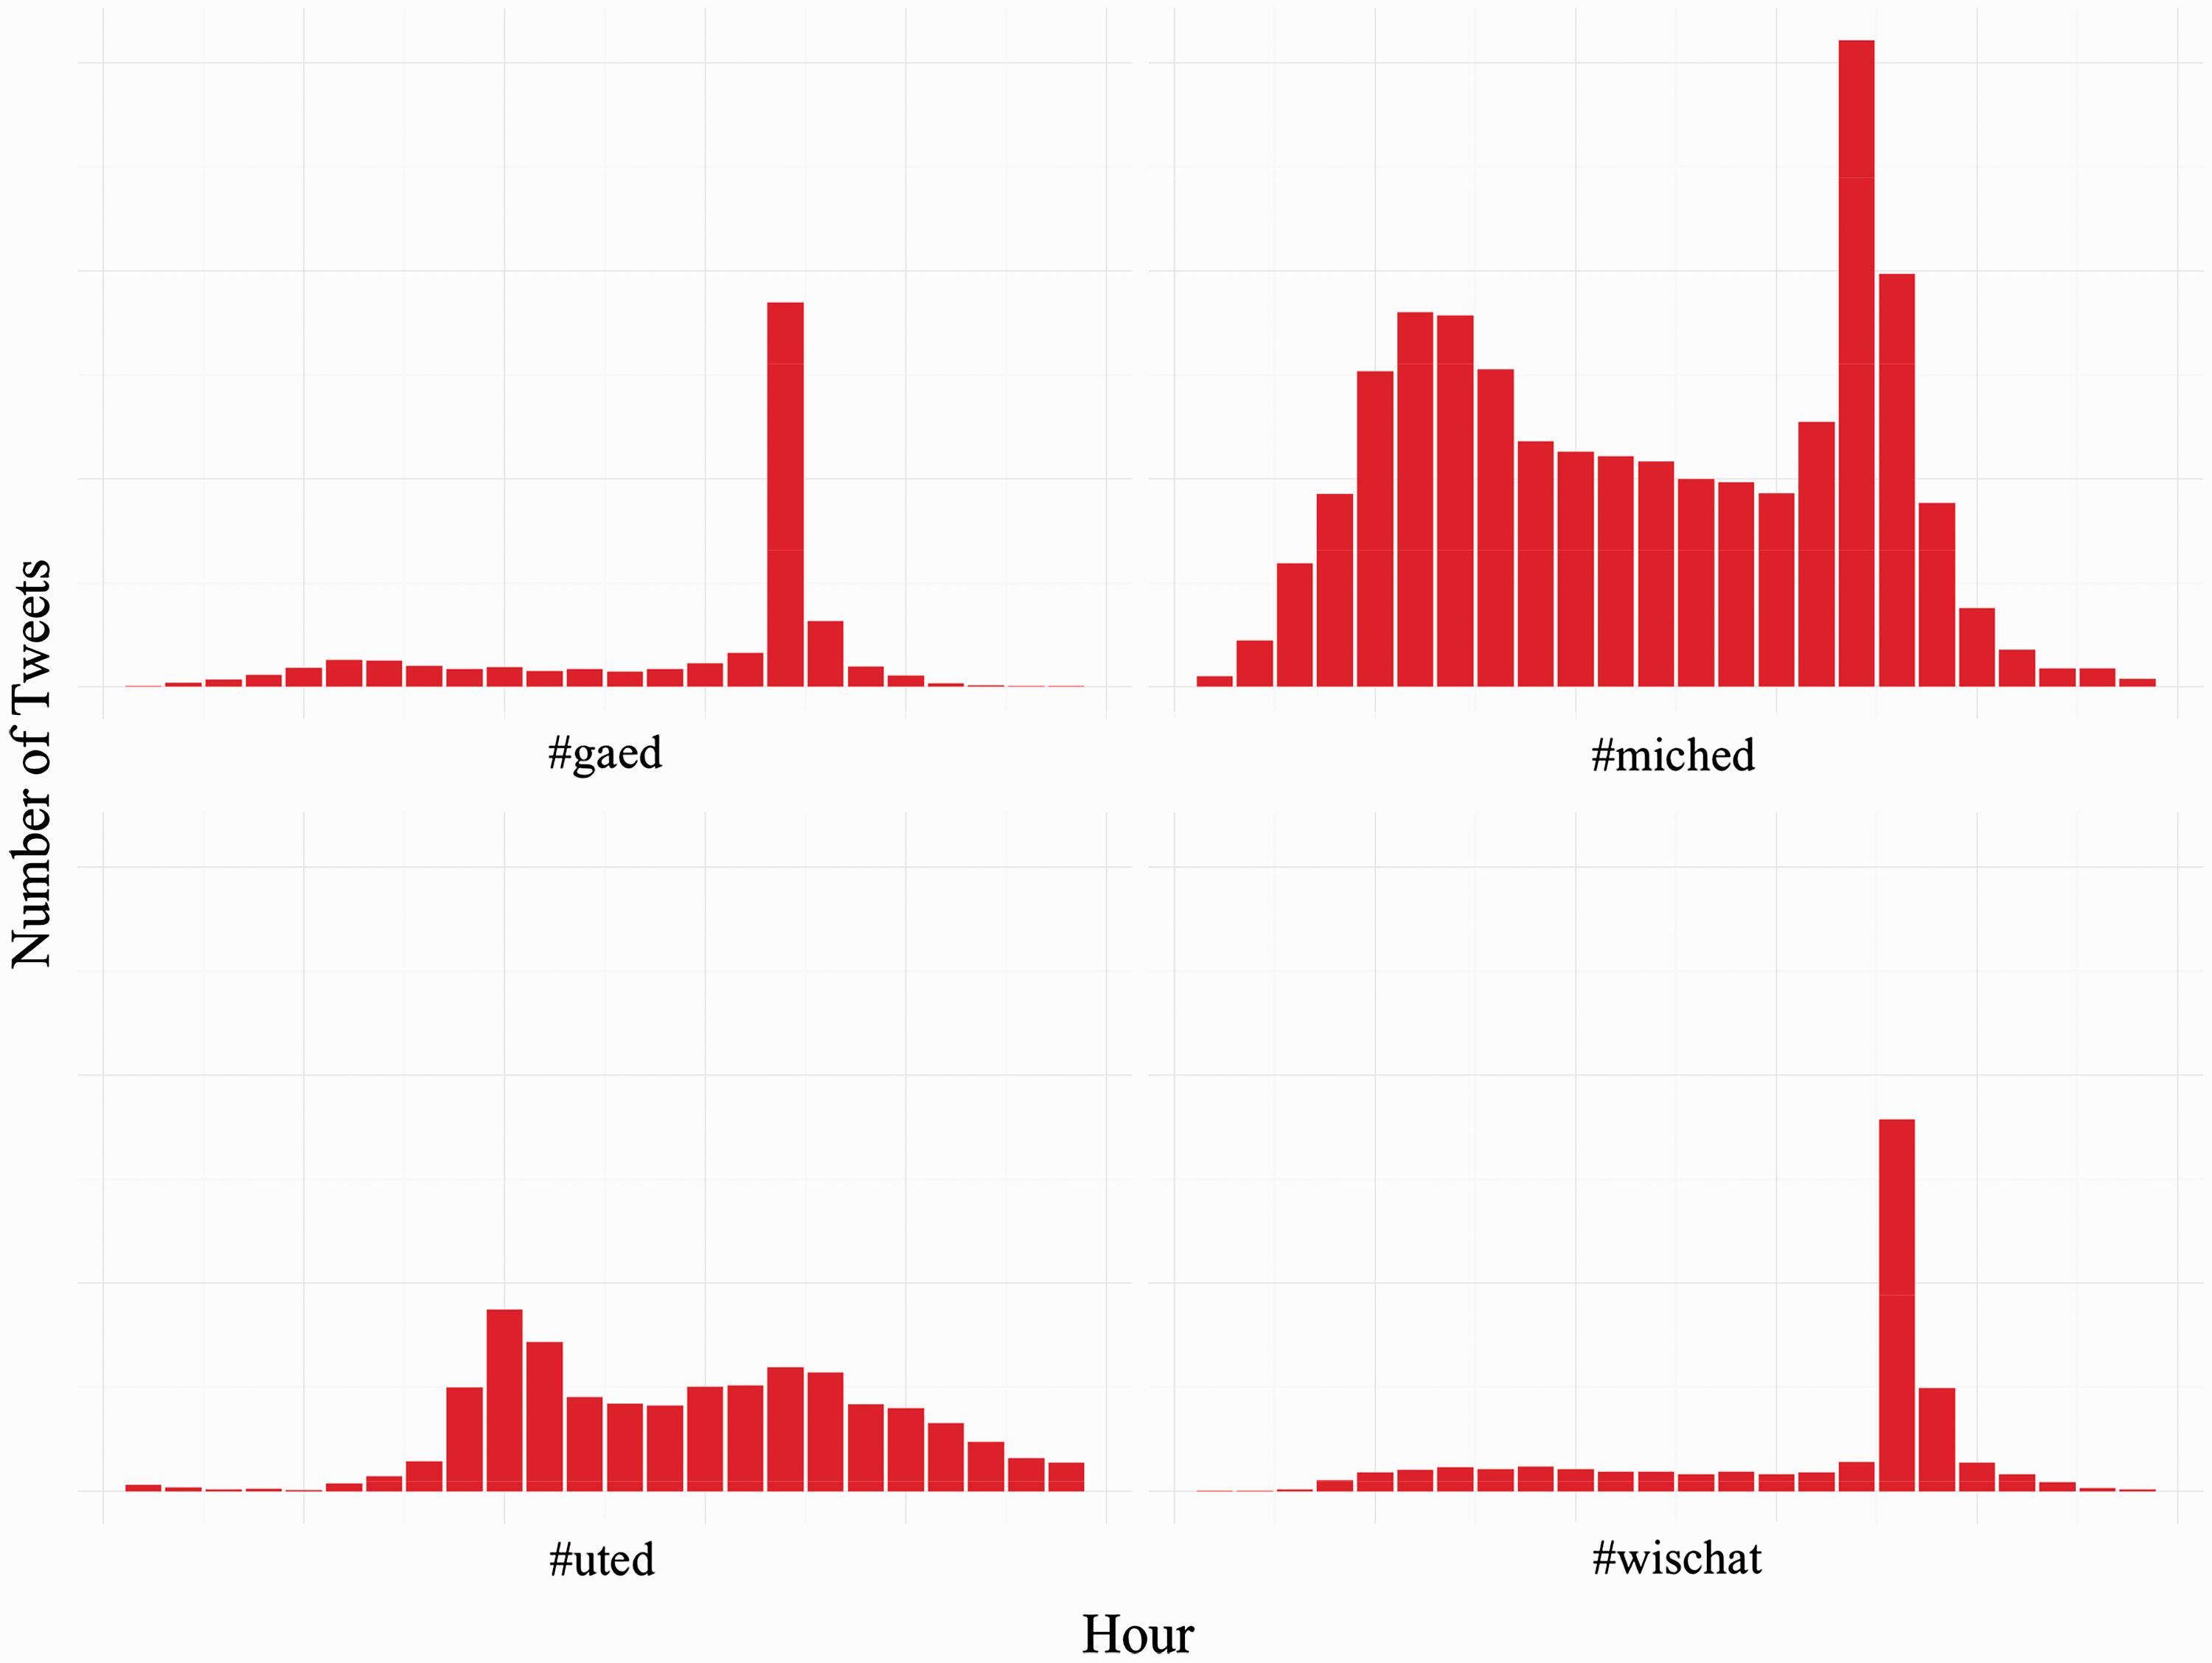
Likewise, our tweet time measure allowed us to determine the percentage of SETH tweets by the hour of the day. As can be seen in Figure 5, SETH usage picks up between 5:00 am and 8:00 am (presumably as teachers are getting ready for school), decreases between 9:00 am and 3:00 pm (presumably during the school day), and then peaks between 4:00 pm and 9:00 pm, once teachers have returned home. Figure 6 shows that this pattern is consistent across #gaed, #miched, and #wischat (but not #uted), although #gaed and #wischat see only a slight morning bump. Just as with days of the week, the hours associated with peak SETH traffic differ from those associated with peak general Twitter traffic. Sysomos (2014) reports that peak hours for Twitter are between 11am and 3 pm, precisely when SETH traffic is seeing a lull.
Number of tweets by hour of day for all SETHs. Number of tweets by day of week for select SETHs. Note. The hours of the day are the same as in Figure 5.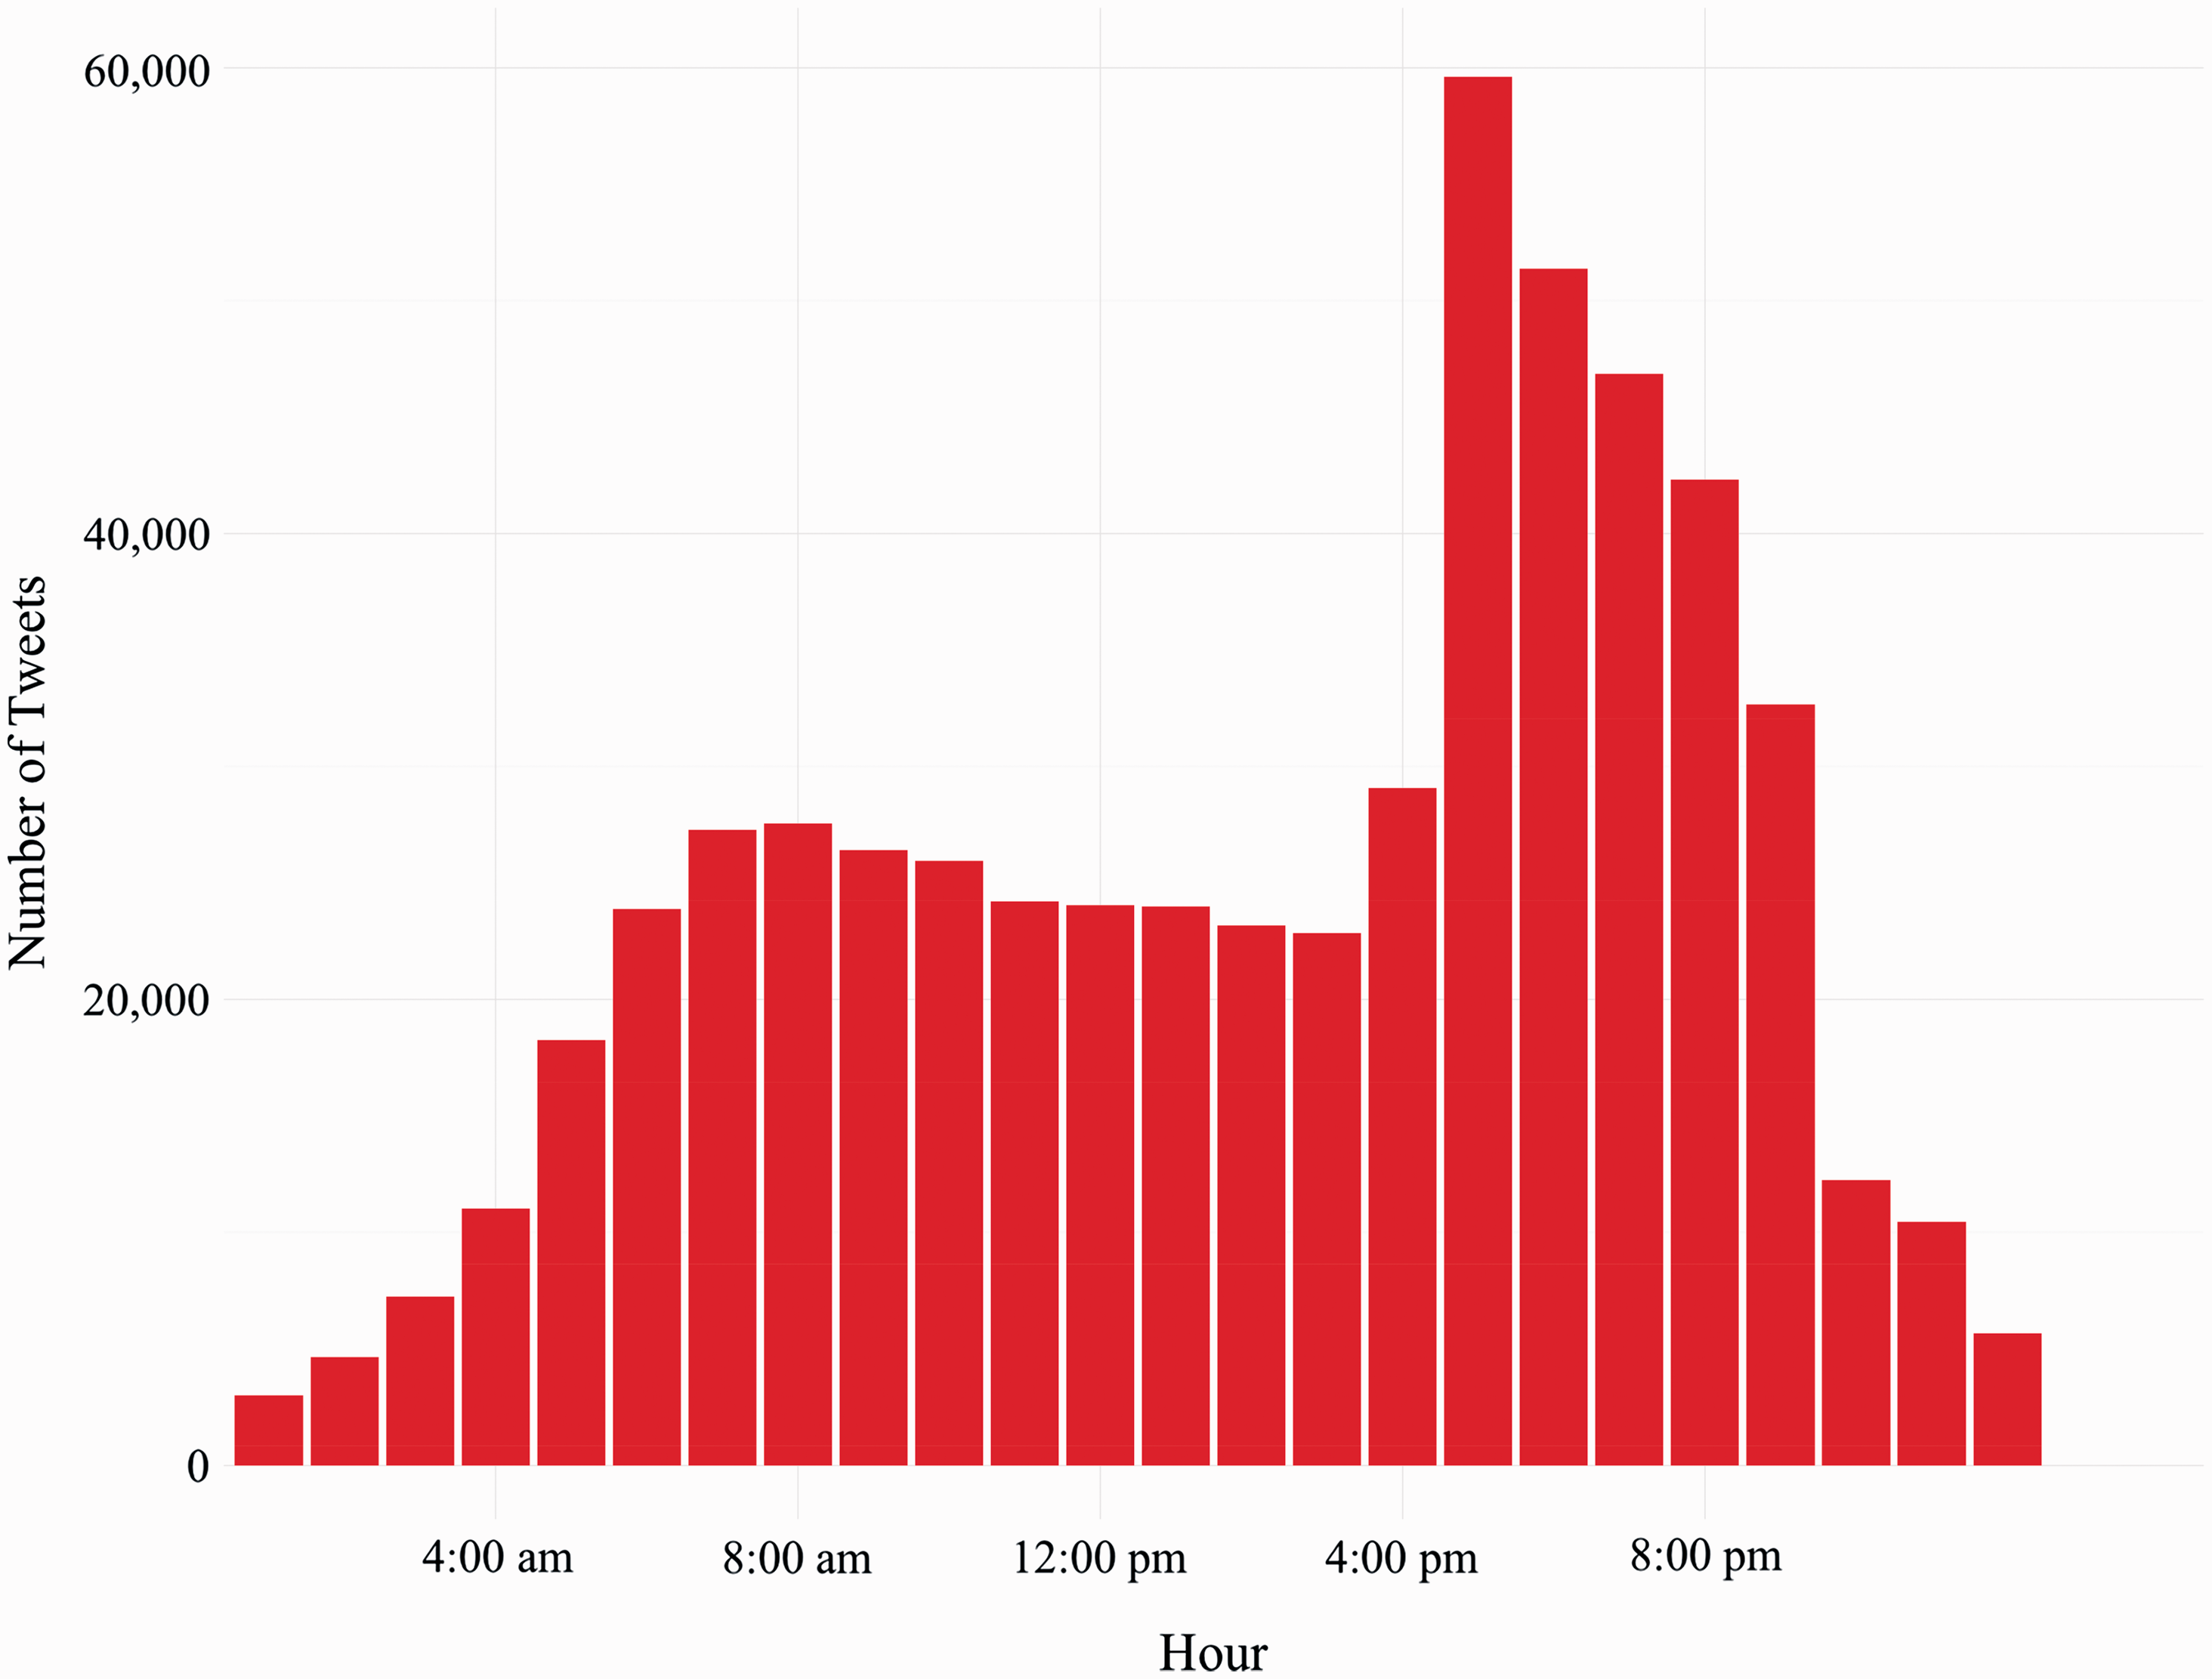
Discussion
In this section, we discuss the results of our study, focusing on key findings, implications for practice, limitations to this study, and recommendations for future research.
Key findings
Our findings help illustrate the nature of potential affinity spaces based around SETHs. In particular, these spaces are highly active. We collected 556,766 unique SETH-related tweets sent by over 68,552 unique individuals over the course of 6 months. These participants tweeted or retweeted an average of nearly eight times each over the 6 months: In short, SETHs feature a great deal of interaction, one of the three tenets of Gee’s (2004) depiction of affinity spaces. Although these numbers are admittedly a drop in the bucket compared with overall Twitter use, it remains noteworthy that a participant in an average SETH on an average day can expect to see more than 60 tweets that provide information, advice, and other resources related to teaching and education. Moreover, this high degree of interaction over a sustained period suggests agreement about the nature of the portal—in this case, the specific SETH used—another of the three tenets of affinity spaces. SETHs may, therefore, represent a steady stream of professional development that can be accessed from anywhere with an Internet connection.
Participation in SETHs seems to be largely self-driven and voluntary and demonstrates features of Gee’s (2004) depiction of affinity spaces. Peak SETH traffic is consistently outside of school hours and often—depending on the hashtag—on weekends, suggesting not only a new place but also a new time for teachers to engage in their professional learning. We note that while these findings may seem obvious (teachers use Twitter primarily outside of the school day), this empirical data confirms our commonsense assumptions. It is well known that US teachers spend considerable time on evenings and weekends continuing the work that they began in the classroom, but participation in a Twitter conversation is hardly part of the regular teaching routine in the same way that planning lessons and grading homework is. A number of scholars (e.g. Gee, 2004; Squire, 2008) have used the example of video games to provide compelling examples of the learning that happens in informal groups, communities, and spaces. Although SETHs are (much) more closely tied to professional obligations than activities such as video games, our findings suggest that they may be just as voluntary and potentially beneficial for participants.
The voluntary nature of SETH-based tweets is even more important when one considers the makeup of the participants sending these tweets. It is not difficult to imagine a “top-down” version of SETHs where educational institutions, researchers, or administrators compose most of the tweets in the hopes that teachers will read them. Instead, SETHs demonstrated a near absence of educational institutions and researchers; furthermore, we found that self-identified teachers and instructional support staff are collectively responsible for more than twice as many tweets as administrators.
These results also show that those who consider themselves members of the broader educational community have appropriated general-use Twitter conventions (i.e. hashtags) to serve as portals for separate and distinct spaces. Many technologies are not explicitly intended for educational purposes and must therefore be carefully adapted for use in teaching and learning (Mishra and Koehler, 2006); our results therefore suggest that educators—and those interested in education-related topics and forums—have adapted Twitter and Twitter conventions to fit their needs. That SETH traffic tends to peak on different days and at different times than general Twitter traffic shows that educational communities across the United States have succeeded in taking a general-purpose technology with corresponding general trends and imposing their particular purposes (and corresponding trends) onto it.
Implications for practice
The levels of SETH-related activity that we have identified indicate that many teachers are already using them on a regular basis, suggesting new ways of thinking about teacher professional development. Over 60% of participants were active in only one of the 26 weeks that we collected tweets for. Because it is possible to read a SETH’s tweets without composing any of one’s own, the possibility should be left open that some of these participants continue to participate more passively in SETHs; it is even possible that a number of users that have never posted nonetheless stay abreast of SETH-based discussions. However, it may be of interest to know what drives some participants to continue posting from week to week while others’ participation is sporadic or drops off, as well as what factors seem to relate to or help support participants to become more active in the group.
Participants in SETHs and others should be aware that there seem to be vast differences among SETHs. Although SETHs as a whole may be serving as affinity spaces for teacher collaboration, interaction, and learning, the differences among SETHs (and therefore among the associated spaces) may be even more remarkable. Even when participation in these spaces is corrected for the number of teachers in each state, SETHs such as #oklaed and #wyoedchat stand out for their levels of activity; on the other hand, we were entirely unable to find SETHs associated with Alaska or New Mexico, and many states with relatively large number of teachers (such as Minnesota), demonstrated very low numbers of participants and activity.
Some possible explanations for the diversity that exists between SETHs are those related to when participants were active, which has important implications for others seeking to support teacher professional development through Twitter or related platforms. Most SETHs see a peak number of tweets on a particular day of the week, but that day of the week changes from SETH to SETH. This may reflect different schedules for synchronous “Twitter chats” in which participants log onto Twitter at the same time in order to rapidly answer questions and exchange ideas. By this same logic, SETHs without a peak day may be those that do not hold a Twitter chat, suggesting opportunities for organizers and participants to create opportunities for synchronous interactions and chats.
Limitations to the study
We note that an examination of why people participate in SETHs and the content of their interactions, two aspects we did not examine in this study, are critical to establishing them as affinity spaces. In particular, an examination of the content of tweets is ripe for future research to help us understand what topics participants are discussing. Although we used Gee’s conception of an affinity space to guide our study, we focused our examination on which portals (SETHs) are used, who their participants are, and how often and when participants interact rather than a deep examination of the content of these spaces and motivations for interaction.
Nonetheless, the present work sets the stage for this examination by establishing who participates and what their patterns of activity look like. This will allow further research to target specific participants at specific times. Furthermore, we identified evidence that SETHs may be used in different ways: For example, while some states exhibit consistent activity throughout the day, others exhibit patterns in terms of the hour of day and day of week suggestive of weekly synchronous chats. These adaptations may help SETHs to be adapted by participants to create a shared space suitable to their needs.
Recommendations for future research
We treated tweets as actions rather than as content generated by Twitter users, and examining the content of tweets, as mentioned in the previous section, is critical for future research. Moreover, there are a number of kinds of data associated with this content, including the number of words, characters, hashtags, links, and mentions in each tweet as well as the number of times each tweet was retweeted or favorited. The significance of each of these measures and the relationship between them may not be immediately obvious, but we are confident that continued disciplined analysis could use this information to make observations of and draw conclusions about SETHs and other Twitter spaces related to education. The textual content of the tweets may also provide valuable insight into how people participate in educational spaces on Twitter.
Furthermore, there may be value in looking into organizational characteristics of SETHs in order to explain differences among them in terms of participation and engagement. A brief survey of these SETHs indicates that some are highly structured (i.e. with regular organizers and announcements and external websites) while others are more loosely organized. Likewise, educational institutions such as universities and state departments of education formally or informally support some—but not all—SETHs. Determining these characteristics of SETHs can extend beyond looking at individual tweets to examining the relationships among individuals. Research from a social network analysis perspective in particular may begin to illustrate how participants begin to engage with the network and may be able to help explain how participants’ individual-level characteristics affect their transition from beginners to central members of the community.
Finally, in addition to examining the content of tweets and the organizational characteristics of SETHs, investigating synchronous Twitter chats in these different communities may be fruitful for future research. We have hypothesized that synchronous chats are responsible for some the different patterns of use we have seen in this paper, most notably the days that SETHs see the most activity. However, Twitter chats may also be associated with other differences between states, such as overall rates of participation or the makeup of the population of participants. A better understanding of what leads to increased participation and engagement in educational Twitter communities may be of interest to researchers and practitioners. Eventually, this understanding could lead to the development of best practices—or pretty good practices (Greenhalgh and Koehler, 2015; Mishra, 2008)—for those who are trying to create their own vibrant Twitter communities in the field of education.
Conclusion
We investigated SETHs as potential affinity spaces, digital or physical spaces in which participants interact with one another around content of shared interest through a shared portal. We found support for two of Gee’s (2004) tenets of affinity spaces, in particular many interactions through a shared portal. Collecting over 550,000 tweets over 6 months, our analysis focused on who is participating in SETHs, how active participants are, and when participation occurred. Though the content of tweets was not the focus, this study’s findings lend support to efforts to identify which particular SETHs will be best suited to subsequent analysis of their content and at what times, or when, subsequent analysis might most productively focus.
Funding
This research received no specific grant from any funding agency in the public, commercial, or not-for-profit sectors.
Footnotes
Author biographies
![]() .
.
![]() .
.
![]()
![]() .
.