
Abstract
Standardised methods for characterising the mechanical properties of materials were mainly developed for metals or alloys with isotropic behaviour. They are consequently poorly suited to characterising materials that exhibit orthotropic and space-varying behaviour, such as polymers, composites, and natural materials like wood. The focus of this work is on guitar soundboards made of Adirondack spruce (Picea rubens, also known as red spruce). Tests are conducted on 12 quarter-sawn plates. This work compares the practicality of methods to estimate the Young's modulus and the structural loss factor of these soundboards, while the variability of results for each method is outlined. A first interest of this work is to determine the trade-off between measurement methods and systems of variable cost and complexity. In addition, the viability of an asymptotic method is demonstrated for such structures (a technique based on mobility measurement and the assumption of an infinite structure). At the same time, the importance of considering the sensor mass is confirmed for low-density structures by comparison with measurements on aluminum and medium-density fibre board panels.
Introduction
The dynamic behaviour of homogeneous and isotropic structures is mainly described by four material-dependent parameters: Young's modulus, shear modulus, elasticity modulus, and Poisson's ratio. Hooke's law links these quantities. 1 Their values are often taken directly from reference tables and sometimes measured in practice. Laboratory test methods for determining Young's modulus E and Poisson's ratio ν include static or quasi-static methods (tensile, 2 torsion, three- or four-point bending tests 3 ), dynamic methods (measurement of resonance frequencies 4 ), and ultrasonic wave propagation methods. 5 Estimating the mechanical properties of wood with ultrasonic methods as in Longo et al. 6 is feasible but require small specimens. In this study, the methodological approach is centred on dynamic analysis, which is particularly suited to the intended application.
Two vibration-based and standardised methods exist for indirectly estimating E, ν and the structural loss factor η, which is a measure of structural damping: the Oberst beam method 7 provides E and η, and the impulse vibration excitation method provides access to E, ν and η.8,9 The requirement of samples with precise shape and size has a significant influence on the quality of the results.
This requirement is indeed highly influential for several techniques. A first example is the dynamic mechanical analysis—DMA—which allows measuring materials’ mechanical and viscoelastic properties as a function of frequency and temperature. 10 The high-frequency limit is a hundred Hertz for a conventional DMA machine, and the sample dimensions are generally small (typically 25 × 12.5 × 5 mm³). A second example concerns ultrasonic methods generally based on determining longitudinal and shear wave propagation velocities. 11 Again, as shown in Longo et al., 6 they can be applied to materials like wood, but as other methods require specific and consuming preparation (cubic specimens of 10 mm edge in Keunecke et al. 12 ). This requirement comes mainly from the fact that contact probes must be placed on the materials. Such small sample sizes required by DMA and ultrasound do not always accurately represent the properties of the overall structure to be implemented, especially when anisotropic and heterogeneous materials such as wood are involved.
The time-of-flight method has also been tested to estimate quantities like the wavenumber on wood, but it has been shown that the measurement error is significant for specimens having dimensions smaller than 30 cm. Additionally, it requires acquisition systems with a large sampling frequency to ensure a small-time resolution, thereby limiting the error in the time-of-flight estimation. 13
Apart from the fact that they require the preparation of coupons or samples of specific or tiny dimensions, the two other limitations of the methods described above are (1) being generally destructive and (2) only allowing the estimation of mechanical properties in a single direction, often without frequency dependence. These methods have generally been designed to characterise metallic engineering materials and are poorly suited to polymers, composites, and bio-based materials like wood. 14 Such materials exhibit anisotropy and spatial variability in their mechanical properties. Regarding such materials, approaches using wavenumber identification were developed lately, such as the High-Resolution Wavevector Analysis (HRWA) 15 which allows the characterisation over a wide frequency range and can extract the in-plane and out-of-plane mechanical properties. The Algebraic Wavenumber Identification (AWI) technique was also proposed, but specifically to address periodic structures. 16 Those methods are based on fitting the measured vibrational field of the structure with numerical plane waves.
If we now focus on wood, this material is used in various fields, as a construction material, 17 to make tools, furniture, and paper, 18 but also to manufacture musical instruments.19–21 By measuring its mechanical properties, one can determine how it will perform in terms of structural strength in the building industry or sound quality in the manufacture of instruments, for example. Adirondack spruce (Picea rubens), also known as Eastern red spruce or Appalachian spruce, is a conifer found primarily in New England, the Appalachians, and eastern Canada. This wood has been historically used in producing fancy foods such as spruce beer and spruce gum (from the needles especially), but also as construction lumber, pulpwood, and Christmas trees. Adirondack spruce's wood began to be used in the nineteenth century for piano, guitar, and mandolin soundboards. Before Second World War, it was the preferred soundboard tonewood for several guitar makers and is still widely used. Despite its significant use in various fields and as other wood types, Adirondack spruce's mechanical properties (like Young's modulus in longitudinal and radial directions, structural loss factor, and accounting for their frequency dependence) are poorly documented. This arises from the fact that wood properties exhibit significant variability, which is challenging to tackle with current laboratory approaches, and even more so in field testing for forestry. 22 This directly impacts the documentation of typically expected values or the generation of reliable databases for mechanical properties.
Our work focuses on the mechanical characterisation of Adirondack spruce panels, which are intended for guitar crafting (soundboards). The two quantities of interest in this work are the Young's modulus and the structural loss factor. Other parameters as the shear modulus or Poison's ratio will appear in the document but will not be investigated. A 2-page proceeding, laying out the foundations of this work, was published in 2022. 23 Three different methods for evaluating Young's modulus for orthotropic structures are considered, and two methods for estimating the structural loss factor (see Table 1).
Summary of methods and their frequency domains of application.
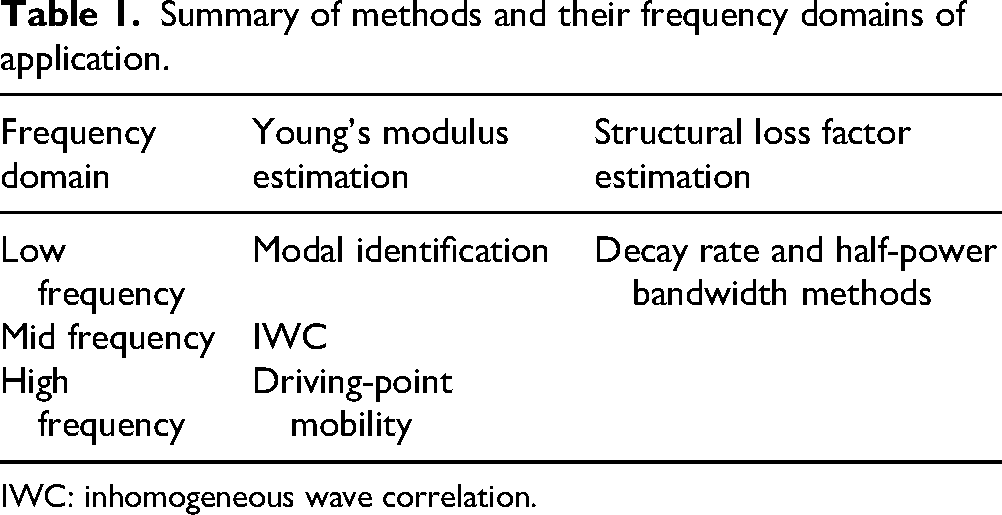
IWC: inhomogeneous wave correlation.
Figure 1 visually describes this manuscript's outline.
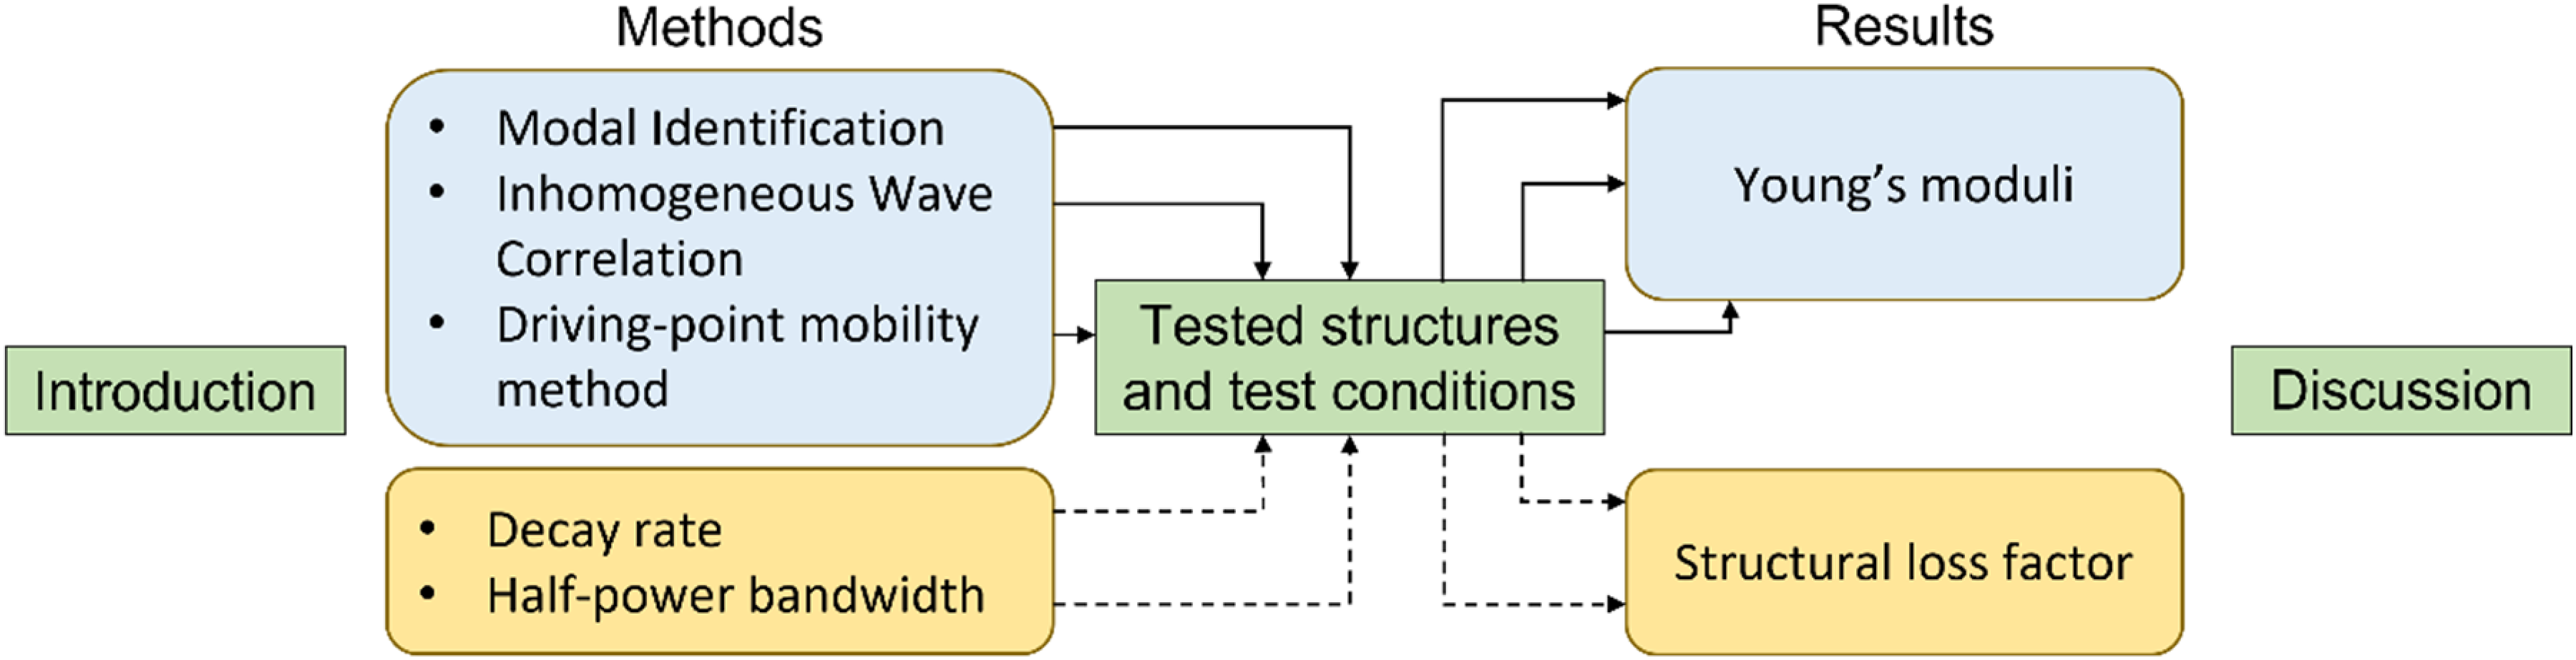
Visual summary of this work's outline.
Methods for estimating the Young's modulus
Modal identification
McIntyre and Woodhouse
24
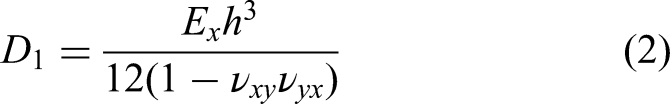
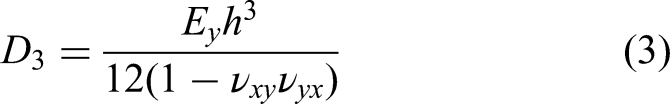
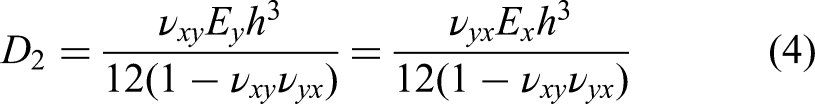
suggested a simple yet reasonably accurate method for determining ‘elastic and damping constants of orthotropic sheet materials’. To apply this method and estimate the other constants, let us recall the equation of motion of an orthotropic plate, given by: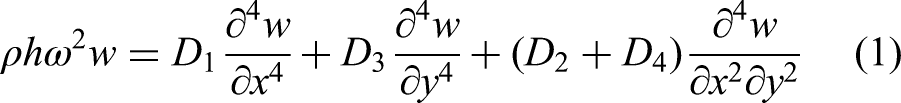
We emphasise that our denomination of variables differs from reference, 24 since our chosen referential considers the x-axis along the grain and the y-axis across it (inverted referential compared with McIntyre and Woodhouse 24 ).
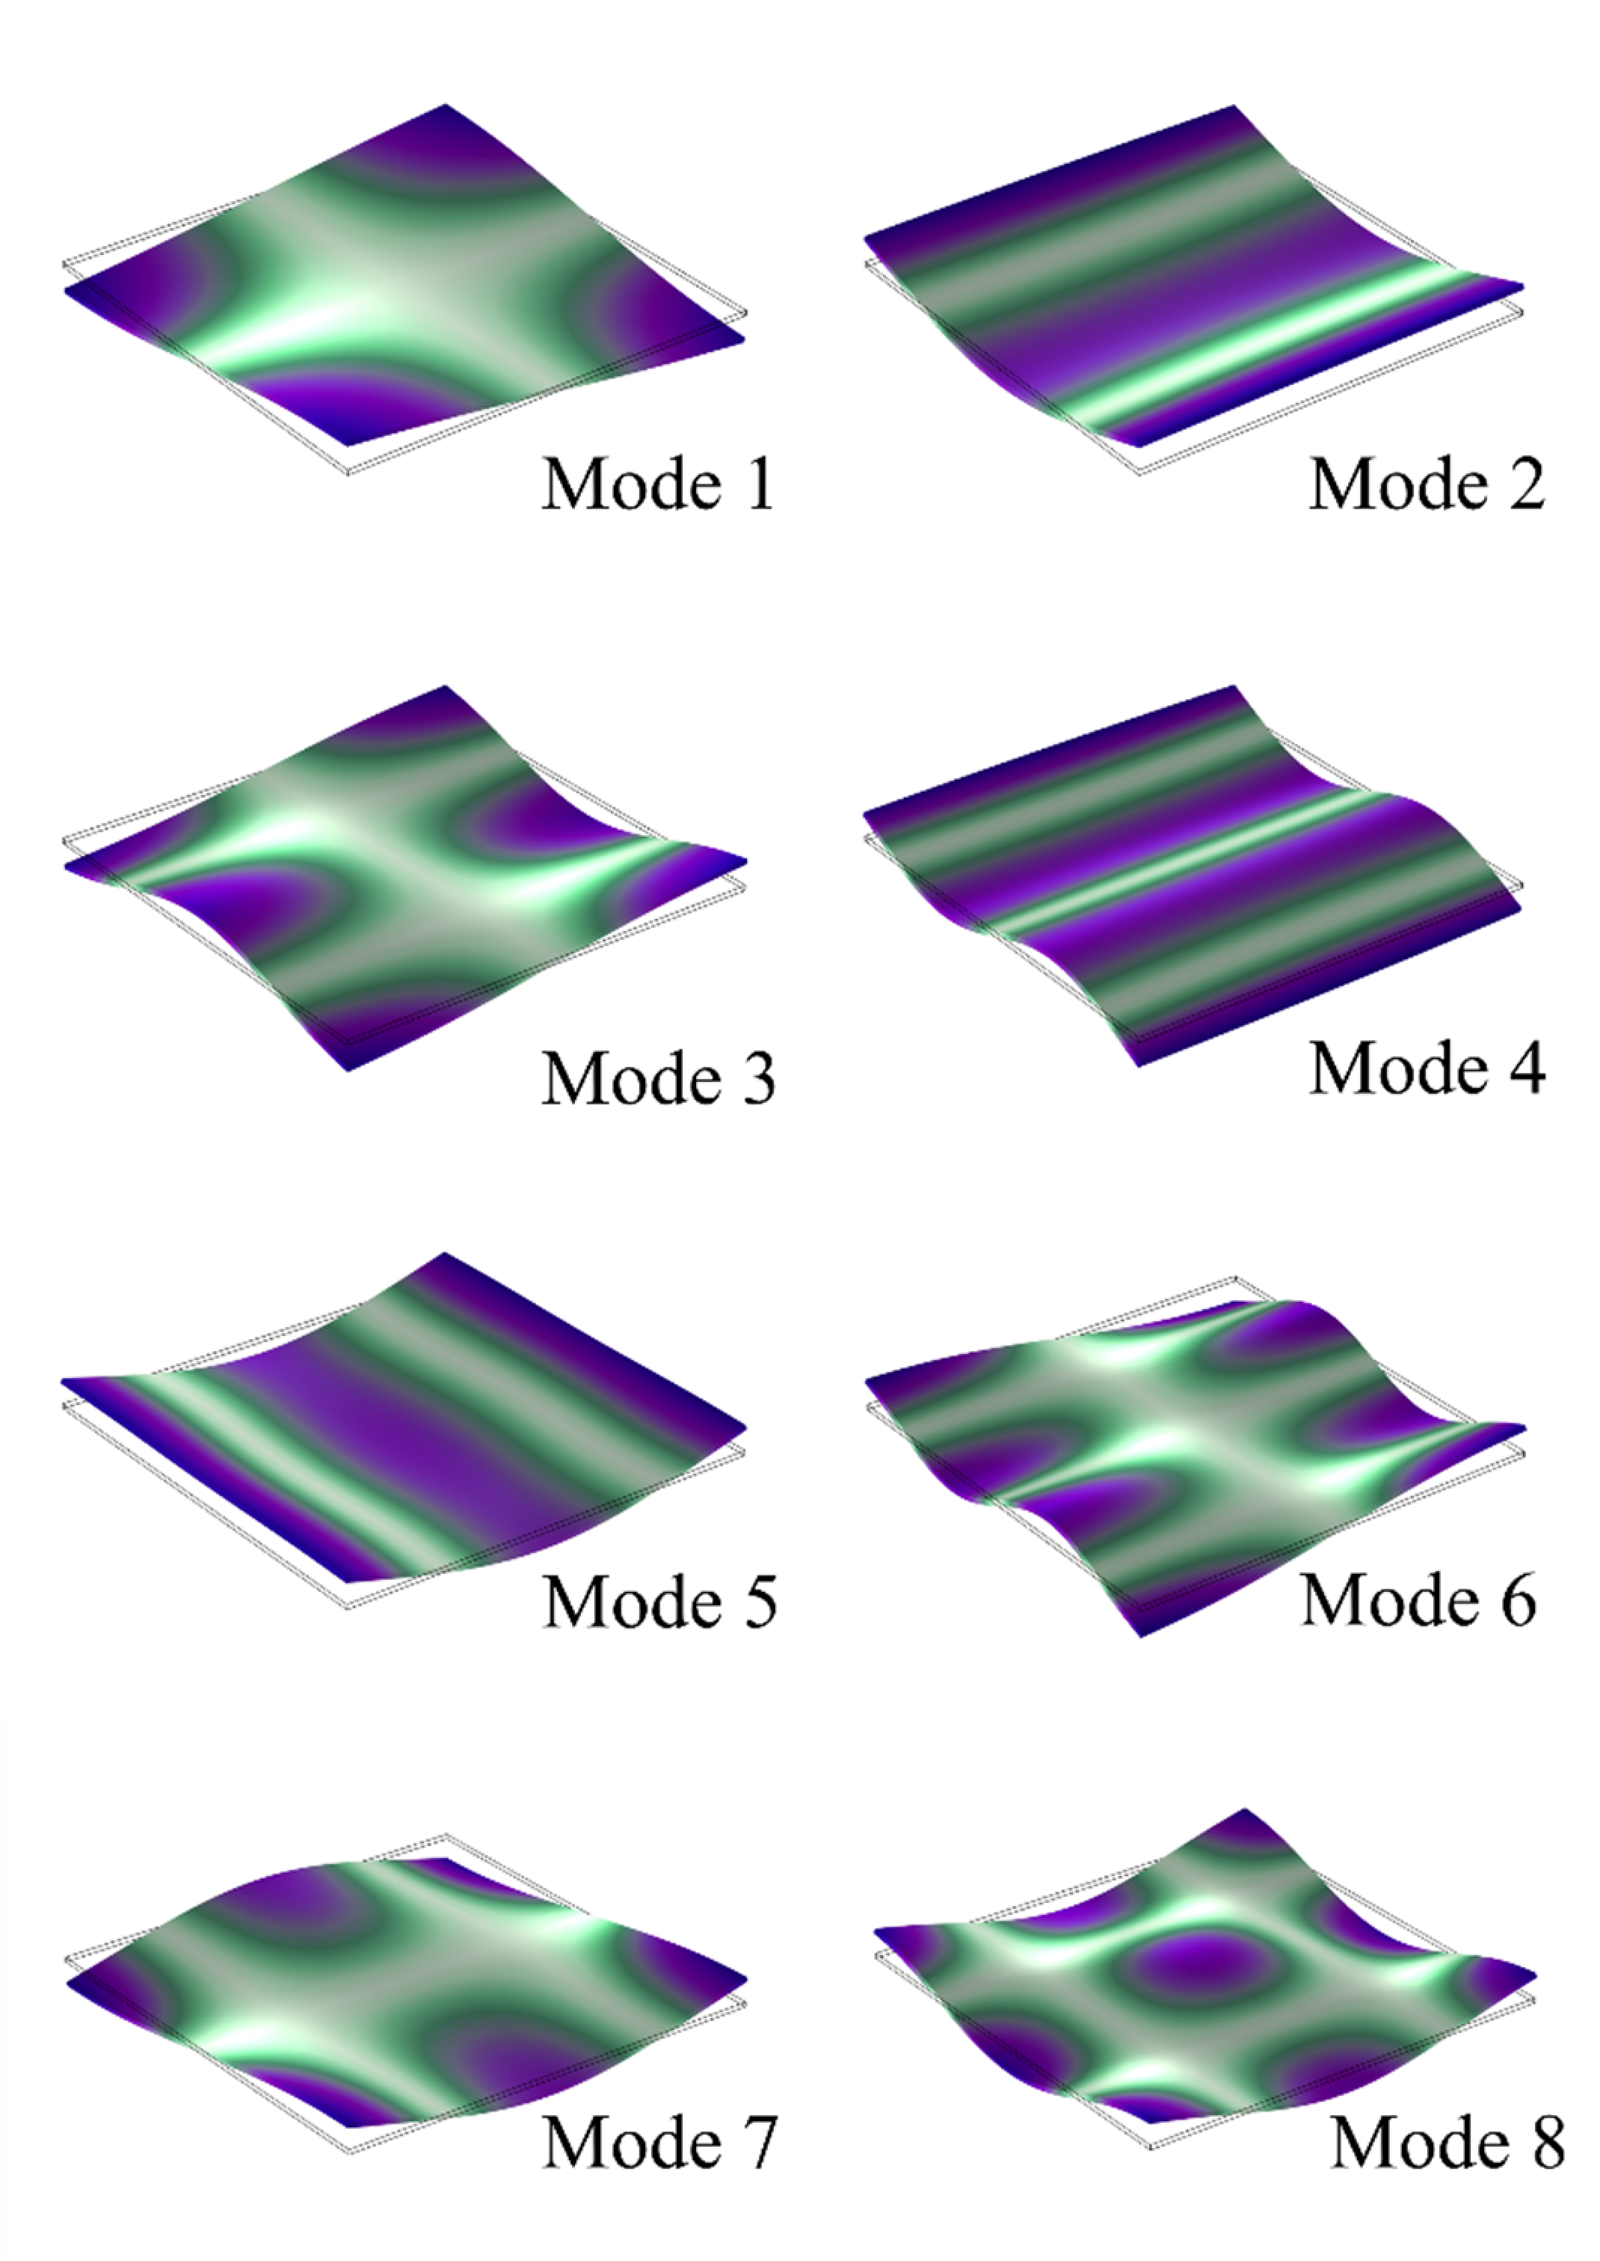
The first eight vibration modes of a free-edged orthotropic plate.
As 

The calculation steps for this method are graphically explained by Figure 3.
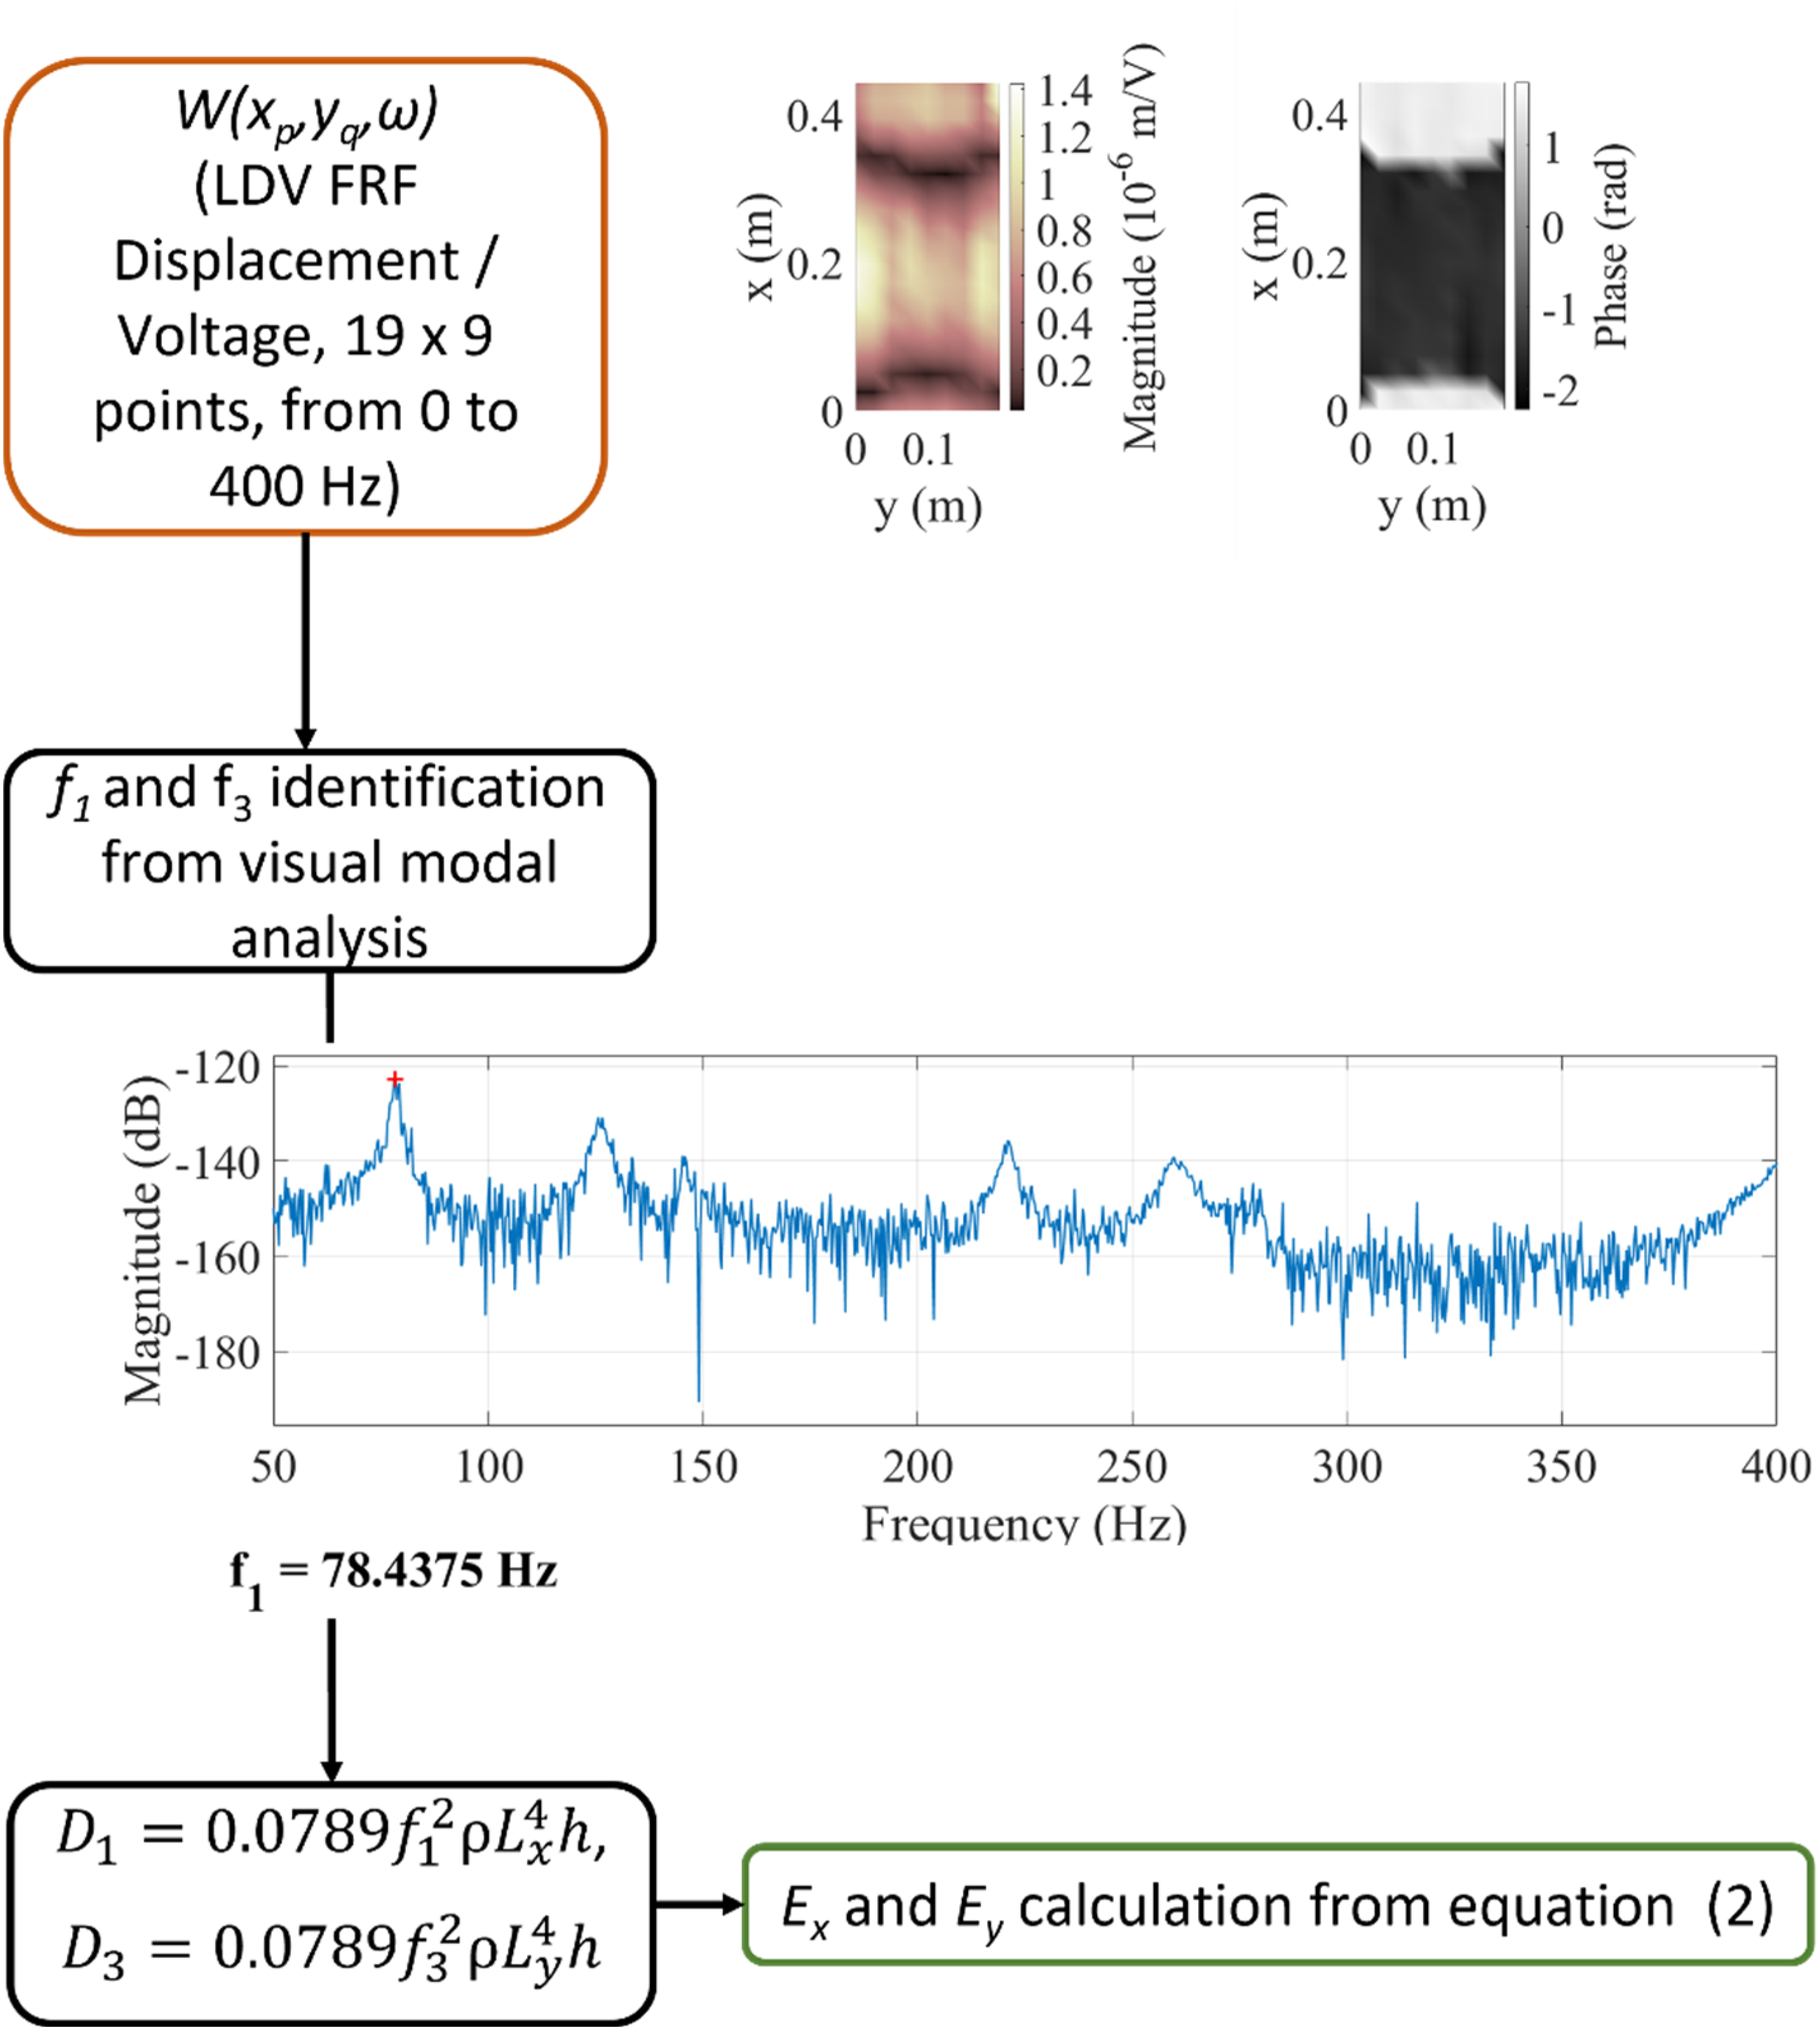
Block diagram of the modal identification method.
Inhomogeneous wave correlation
The inhomogeneous wave correlation (IWC) method uses the spatial Fourier transform of the measured wave field of a vibrating plane structure
The purpose of this comparison is to identify a complex wave number.
25
This inhomogeneous wave (the damped plane wave), called 
The correlation coefficient 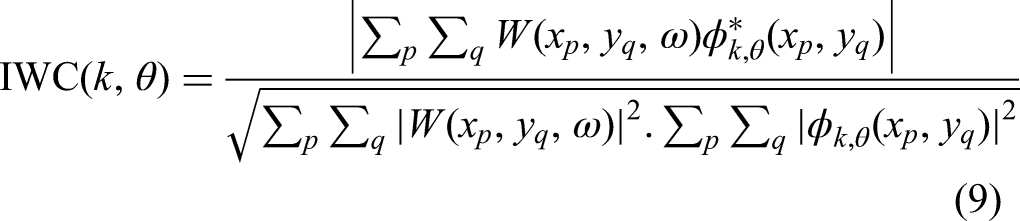
The general dispersion relation is written as: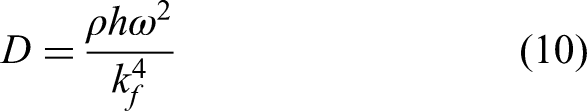
This work uses the real part of the identified wave number in the longitudinal and radial directions to estimate the corresponding Young's moduli. Different cases of anisotropy are considered. Our work focuses on elliptical orthotropy. In this case, 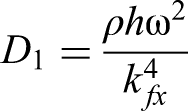
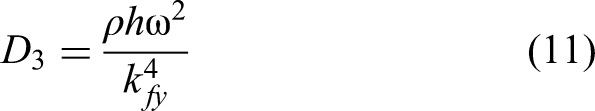
Figure 4 illustrates the followed calculation steps.

Block diagram of the inhomogeneous wave correlation (IWC) method.
Driving-point mobility method
In the mid- and high-frequency domain, the structure's frequency response to a driving point force tends to a smooth curve. The vibration can be described, ultimately, as a diffuse wavefield.27–30 The admittance of the structure at a point A, noted
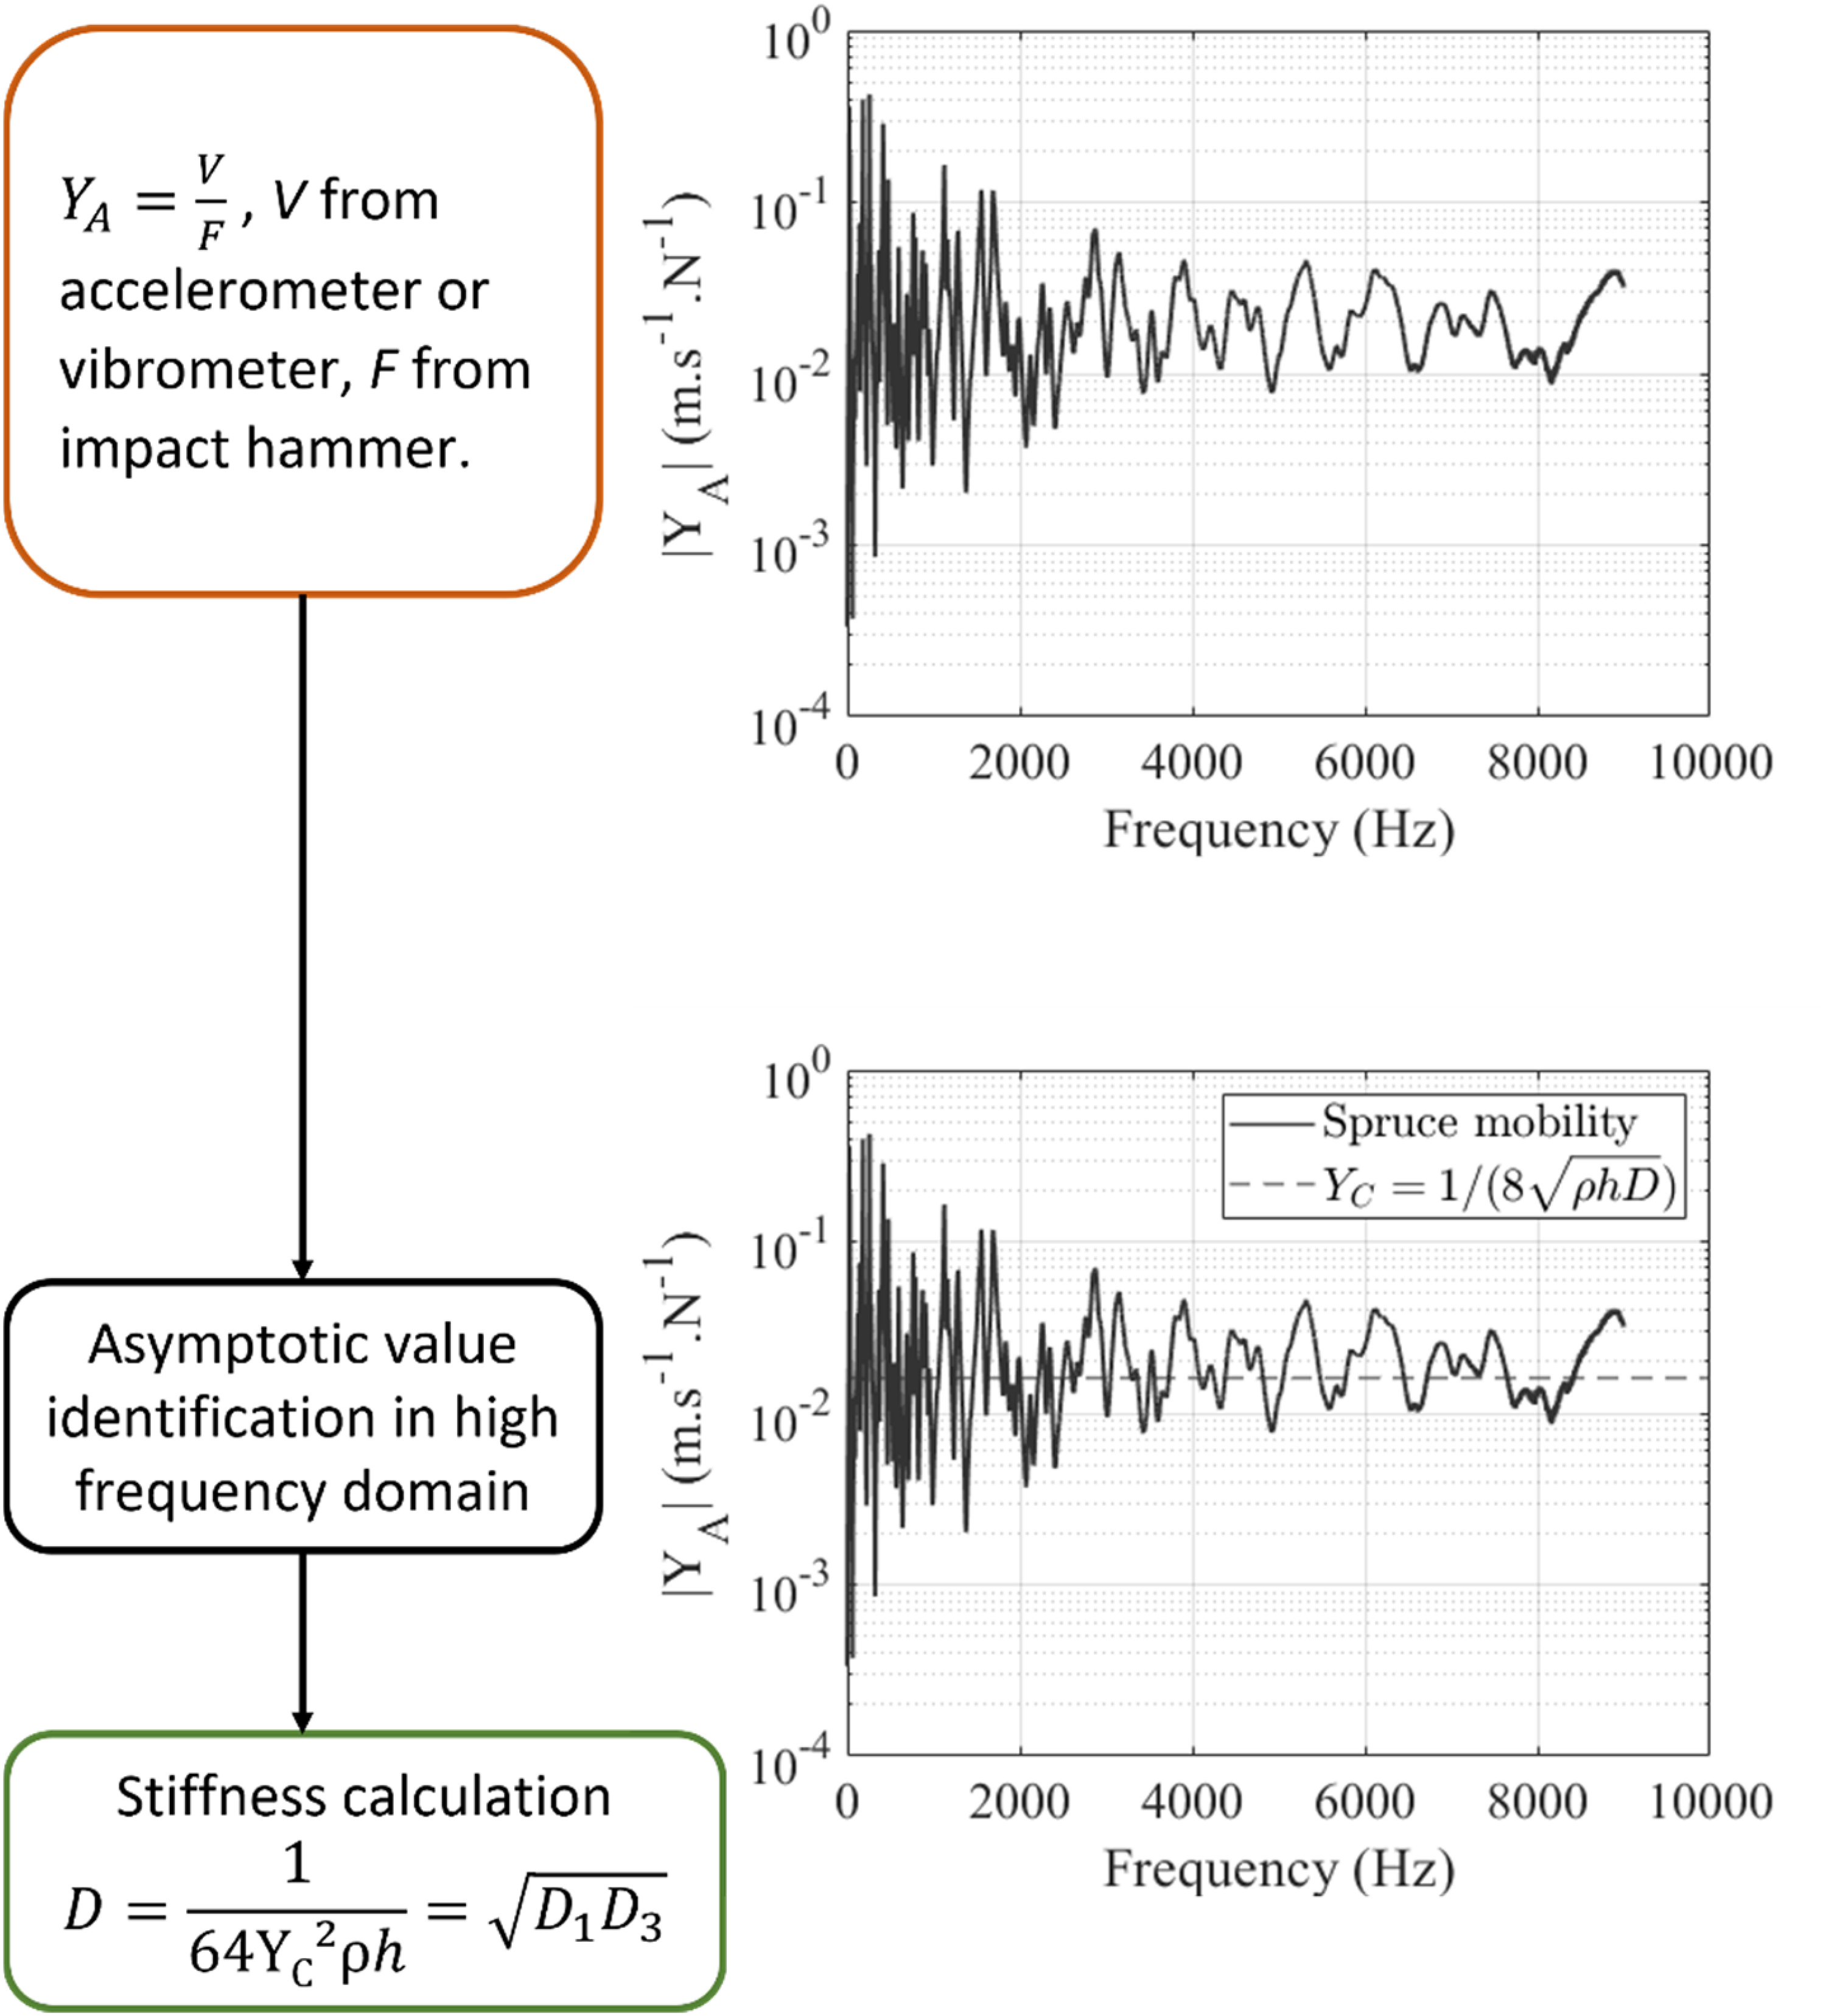
Block diagram of the driving-point mobility method.
The detailed Skudrzyk's theory is developed in the following paragraphs.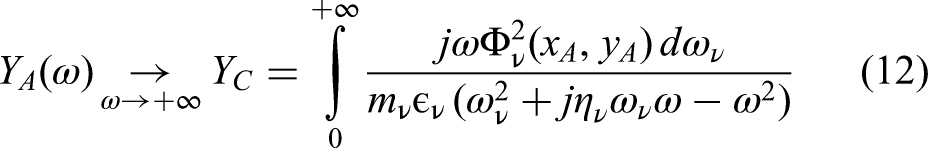
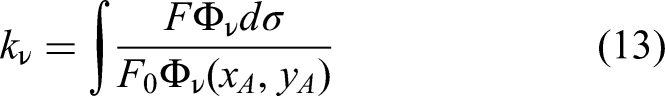
At high frequency, the real part of the driving-point admittance 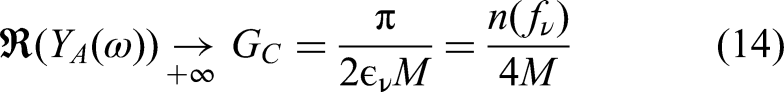
In this frequency domain, the real part of the admittance depends only on the modal density and the mass of the structure. For a thin isotropic plate, the imaginary part of 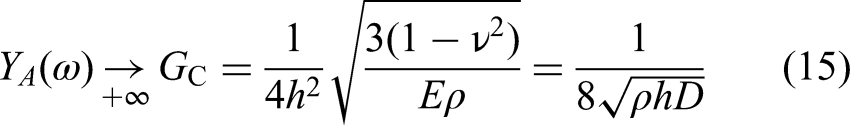
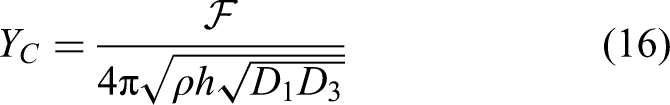
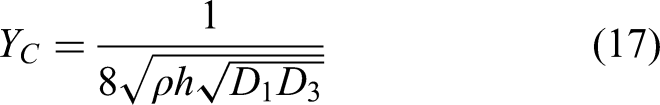
For an orthotropic plate, equation (15) becomes
35
We simply apply this formula with the result of the last measurement: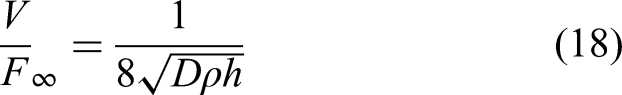
We are using equation (15) instead of equation (17) because at this moment, the distinction between
To consider orthotropy, two directions should be distinguished to evaluate
In summary, Skudrzyk's mean-value method predicts the envelope, the mean value, and the asymptotic value of the driving-point admittance of a weakly dissipative vibrating structure. Contrary to statistical methods (Statistical Energy Analysis (SEA) for example, see Lyon 36 ), only valid in the high-frequency domain, this method gives indications on the mean behaviour of the structure from the first resonance up to the highest frequencies.
Methods for estimating the structural loss factor
Decay rate method
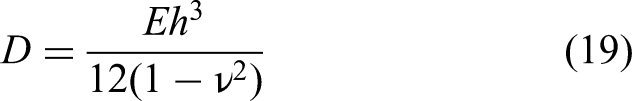
The structural loss factor is a measure of the intrinsic damping in a structure. Applying the decay rate method involves three postprocessing steps described in Figure 6. First, the measured impulse response from the impact testing measurement is filtered in the time domain using third-order bandpass Butterworth filters (with lower- and upper-frequency bounds defined following those of third-octave bands between 125 and 1250 Hz). Second, Schroeder's backward integration method
37
is applied to each time-filtered signal. Third, the energy decay is identified over a 10 dB range using a first-order polynomial curve fitting, and the structural loss factor
Block diagram of the decay rate method.
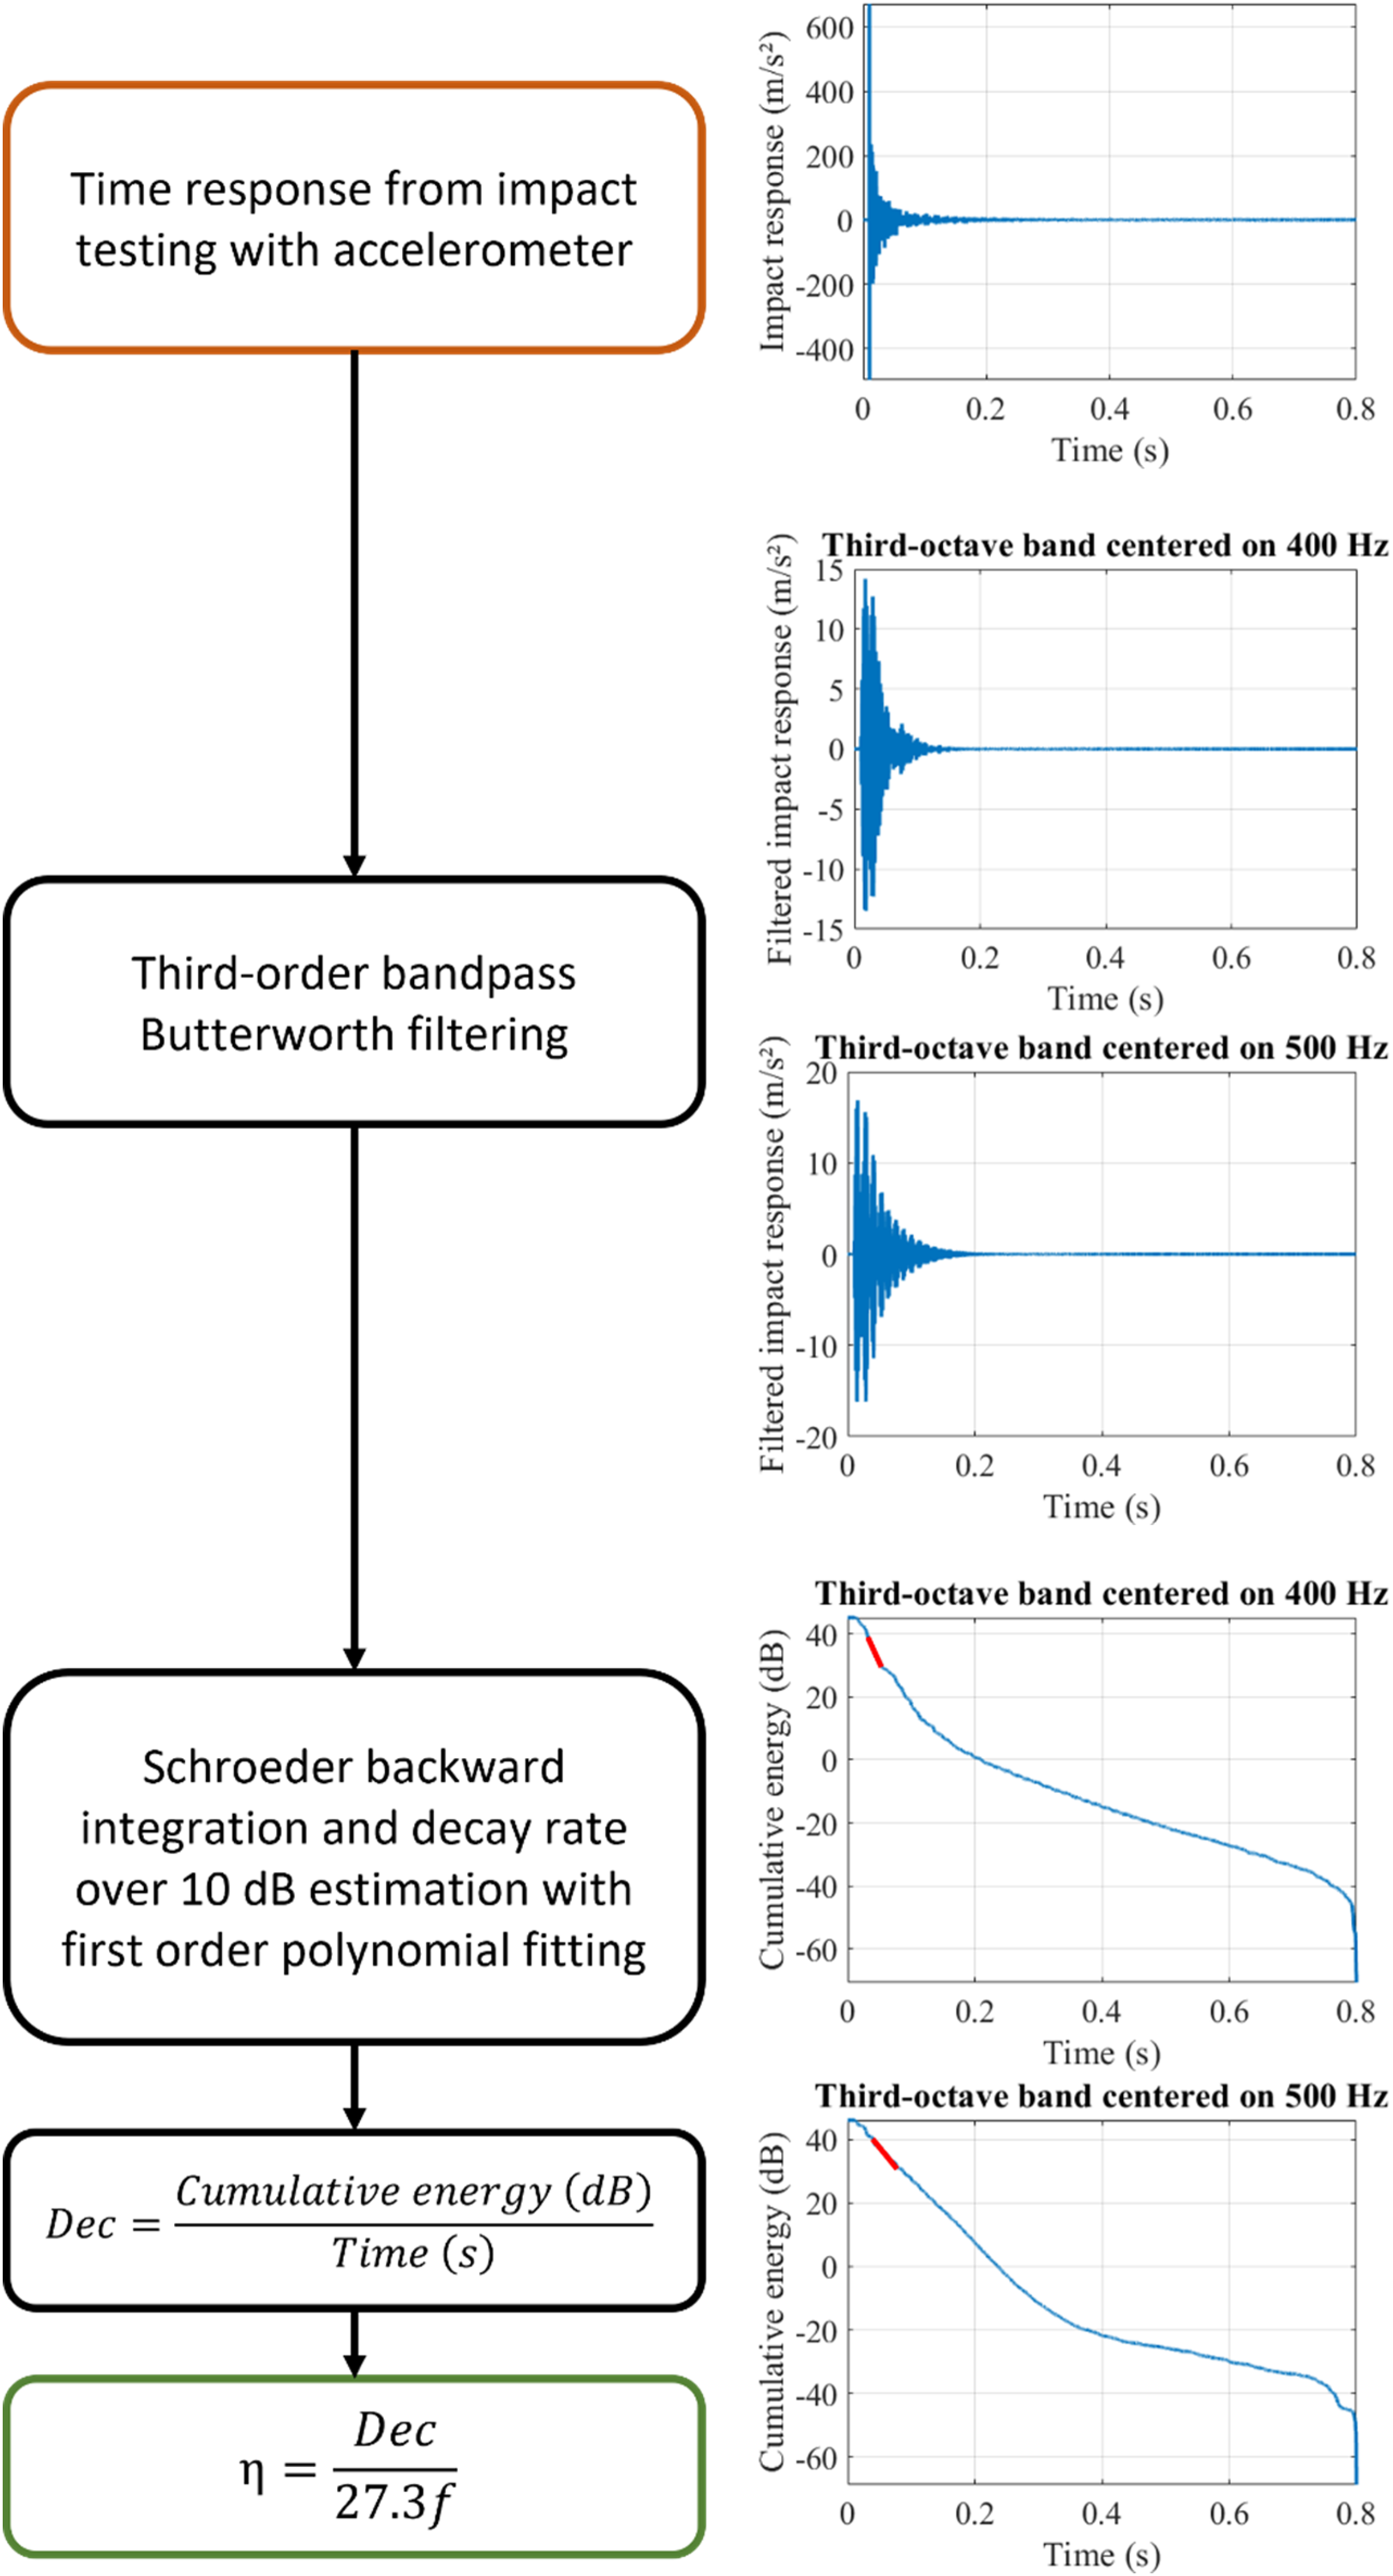
Half-power bandwidth method (−3 dB method)
In this method, the resonant frequency
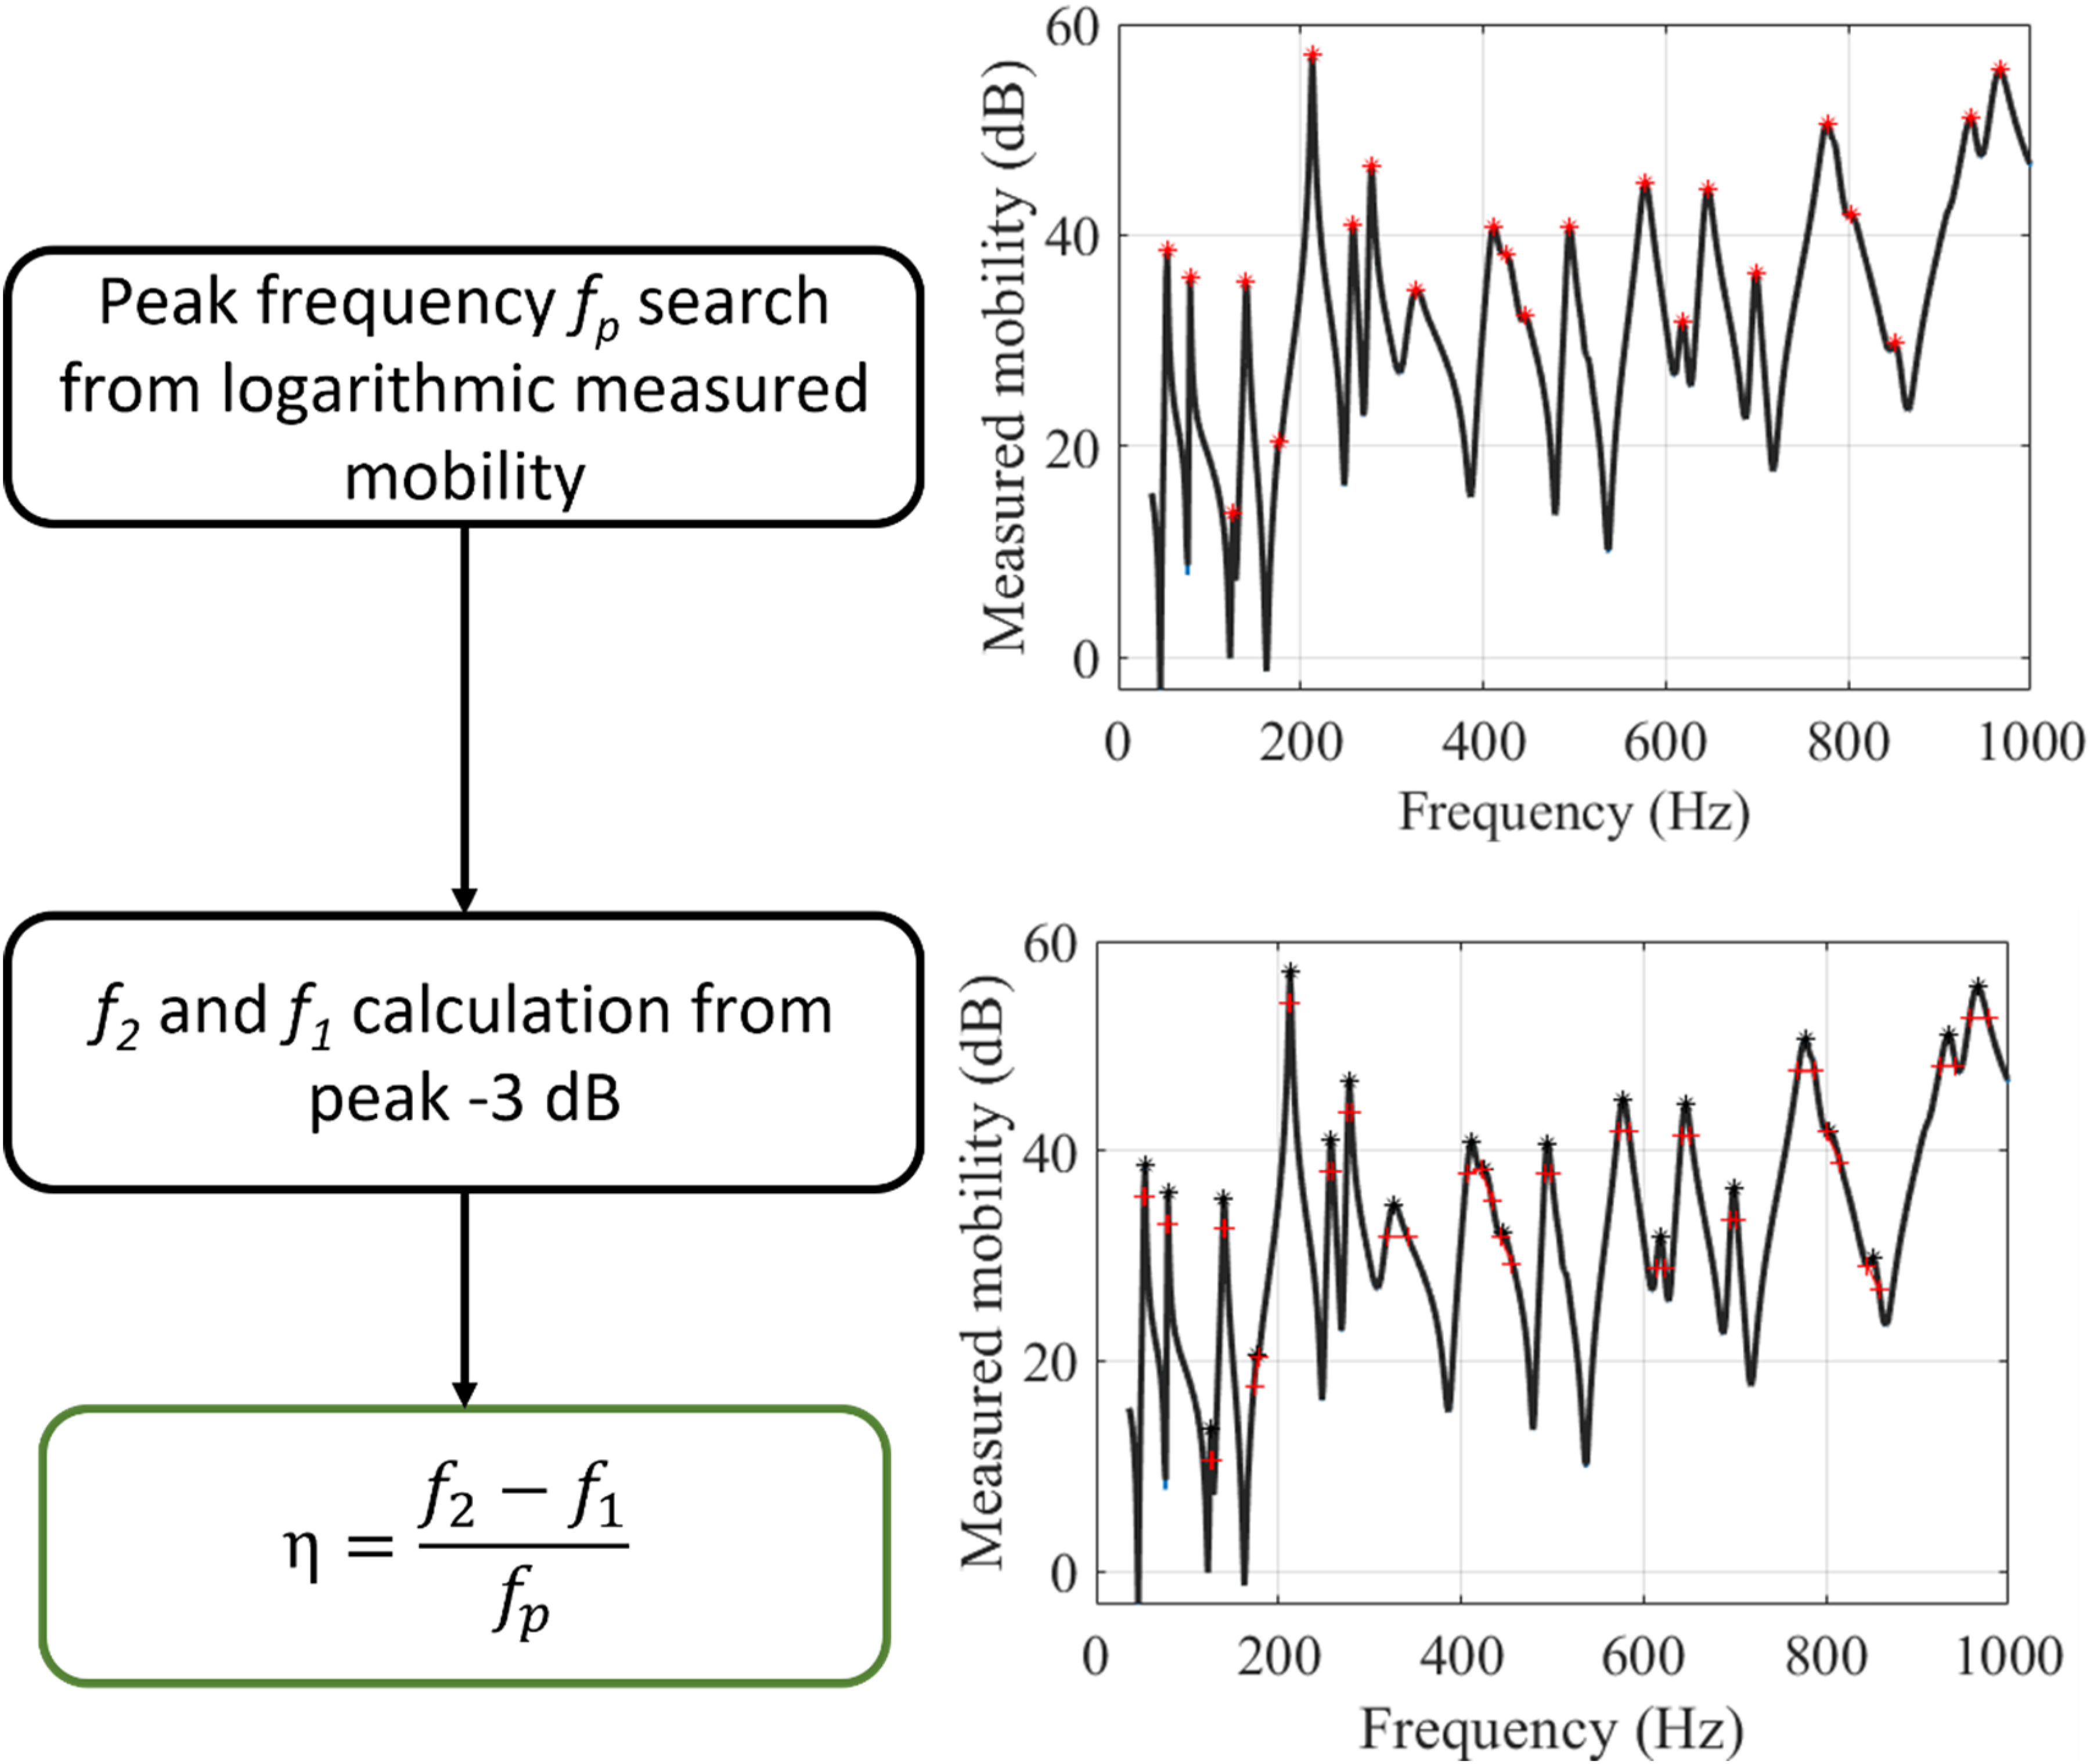
Block diagram of the half-power bandwidth method.
Tested structures and test conditions
Table 2 summarises which specimen and test conditions were used for each method. The following paragraphs explain in more detail how the tests were conducted. The tested structures are 12 quarter-sawn Adirondack spruce panels intended to be used as left and right parts of six guitar soundboards (see Figure 8). Those panels are on loan from Bruand luthier school at Longueuil, Quebec, Canada. The specimens are categorised as 2A and come from a 200 years old log cut down a few years ago in northern Maine in the United States. From now on, these 12 half soundboards will be numbered from 1 to 6 with the letter L for left part and R for right part. The measured mean dimensions of the plates are 560 mm × 227 mm × 5 mm (length
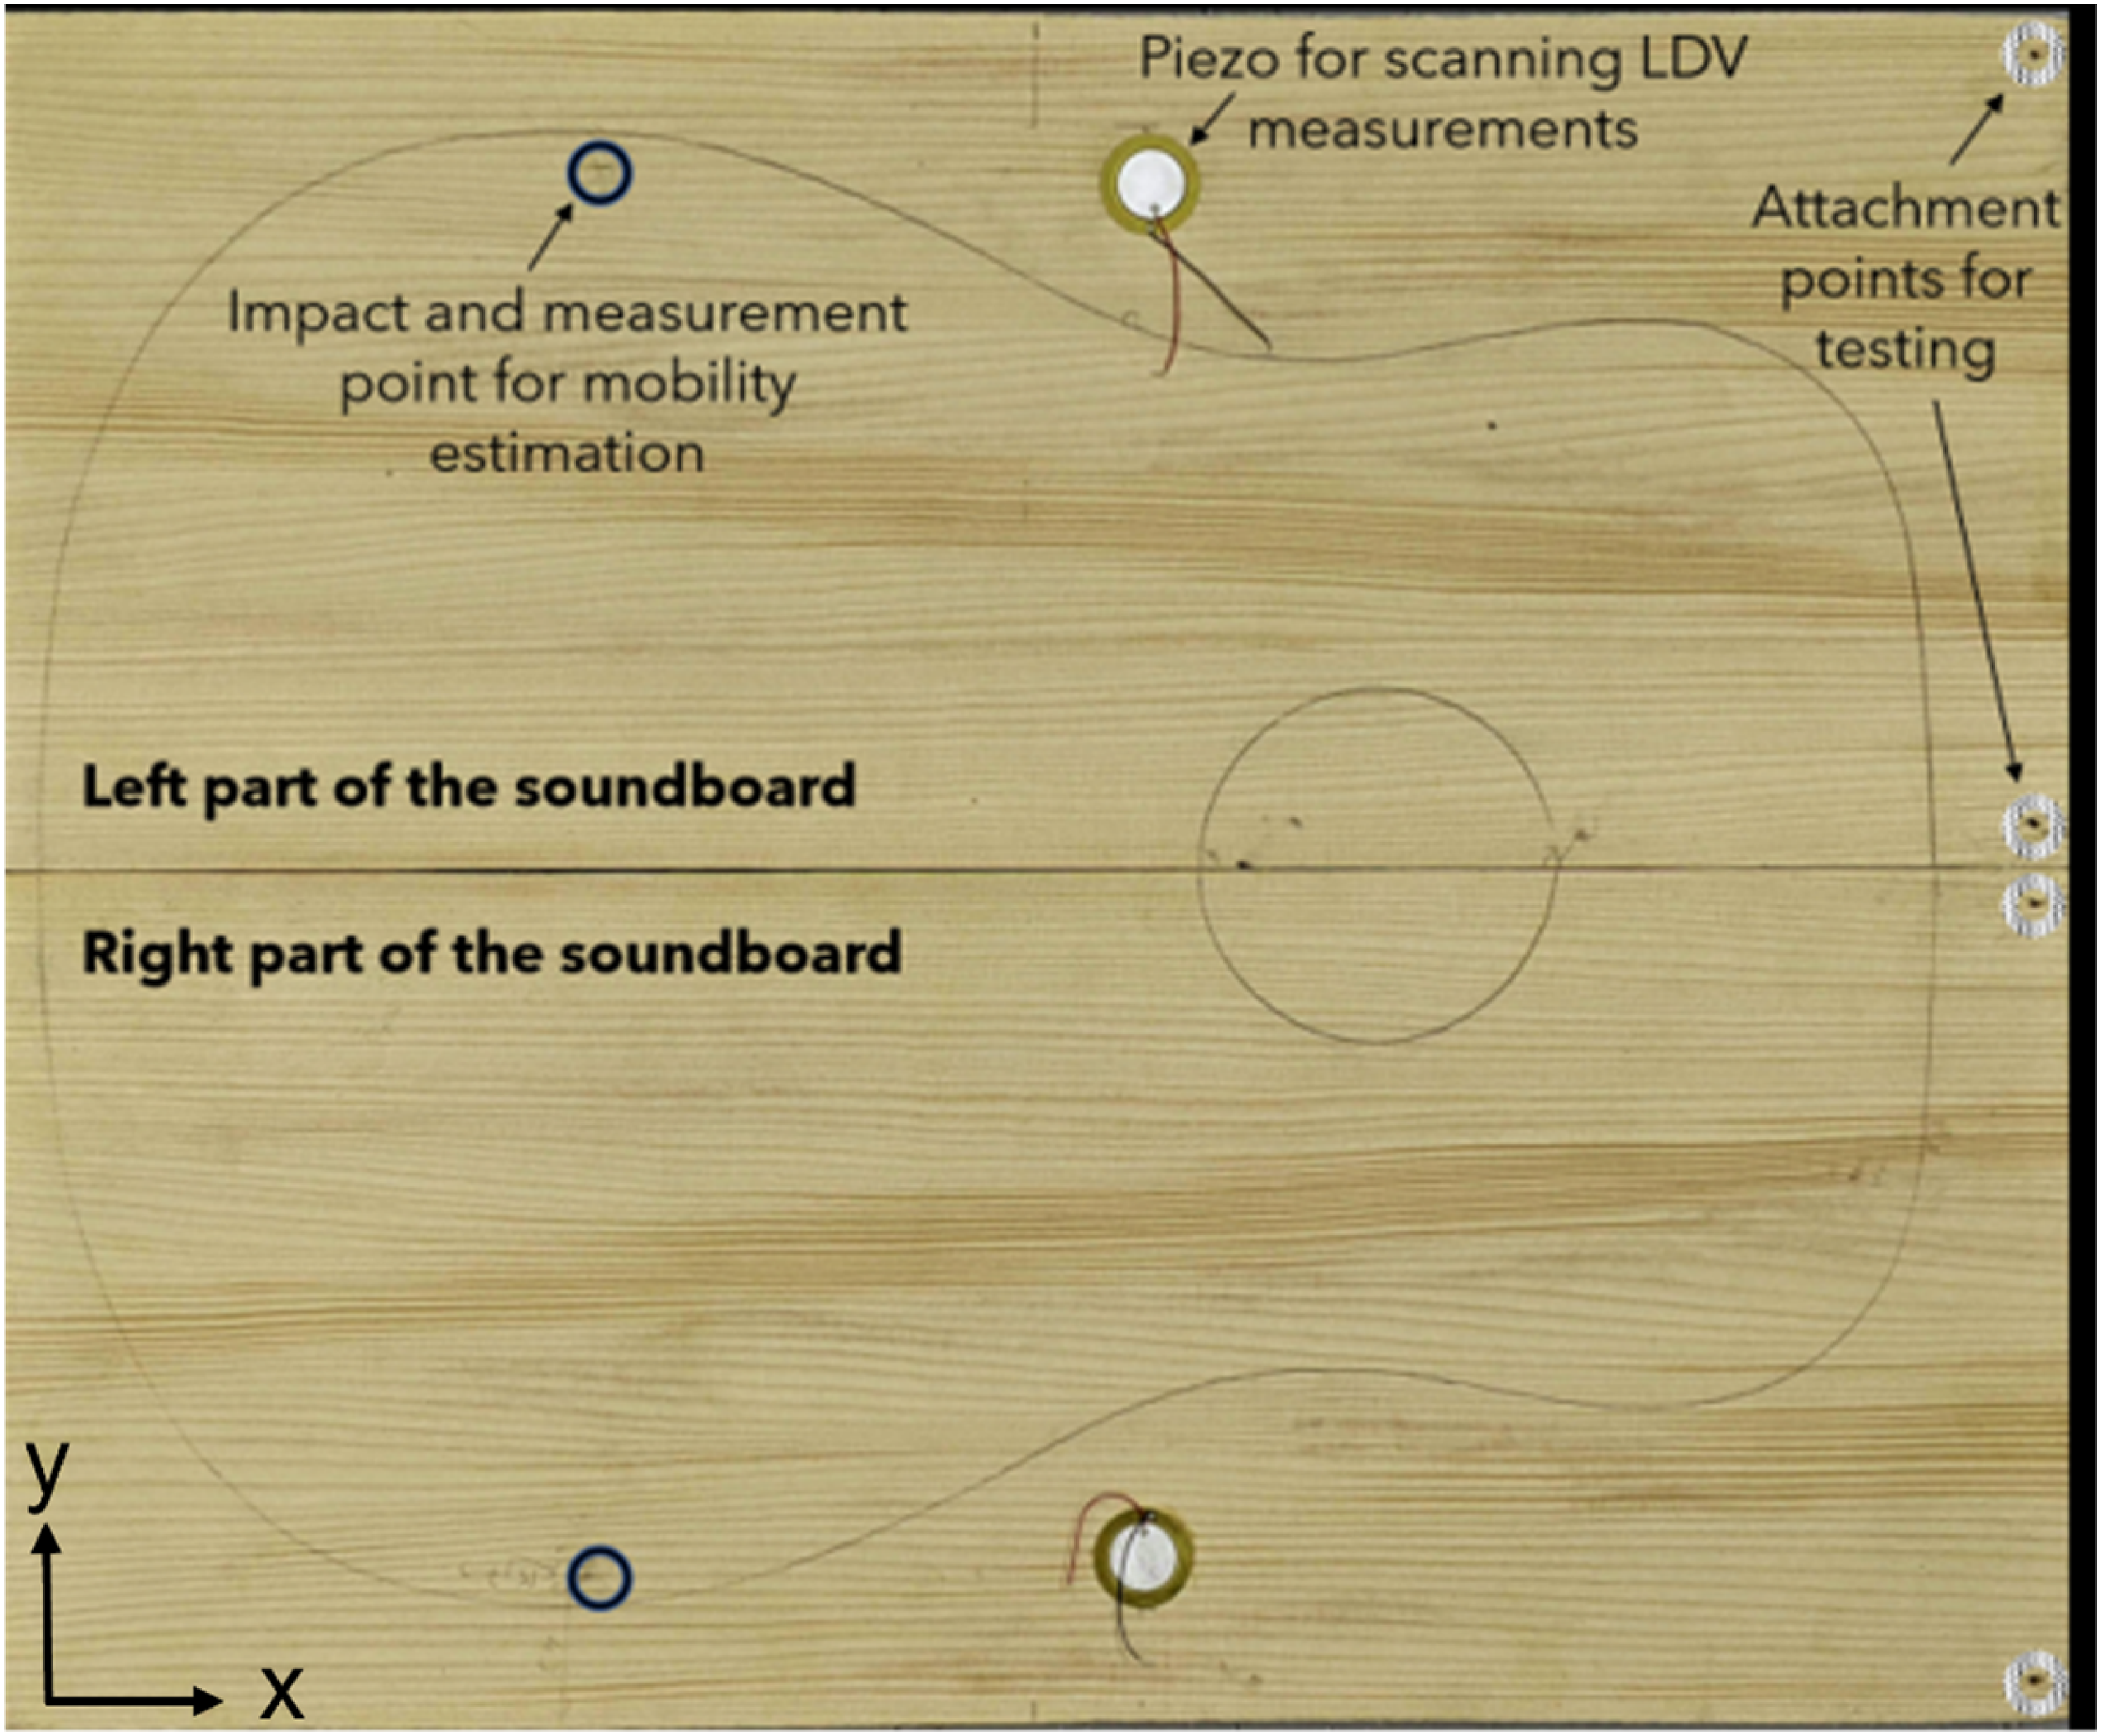
Left and right parts of soundboard 6, including position for mobility measurement, position of the piezo exciter and attachments points.
Tested structures and test conditions for each method.
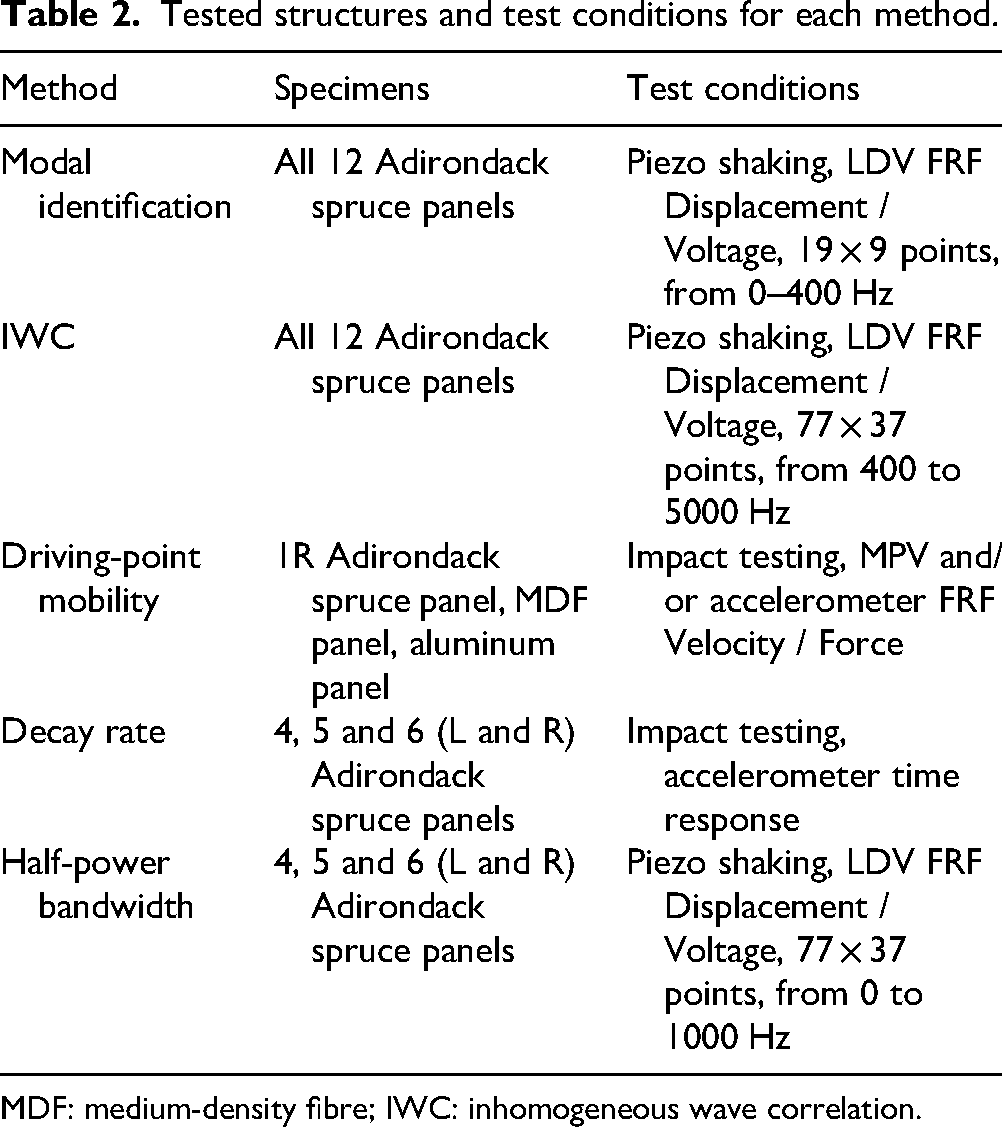
MDF: medium-density fibre; IWC: inhomogeneous wave correlation.
Three series of measurements are conducted: (1) and (2) for modal identification, IWC, decay rate and half-power bandwidth methods and (3) for the driving-point mobility method. The first consists of impact testing using a miniature impact hammer (PCB 086E80) and a single-axis accelerometer (PCB 353B18). Excitation and measurement points are identical and positioned on each soundboard side. Acceleration-over-force FRFs are calculated using five averages and the H1 estimator (sampling frequency is 20280 Hz and frequency resolution equals 1.25 Hz). The decay rate method uses the raw time-domain signal from the accelerometer to calculate the structural loss factor. The second series of measurements uses a piezo exciter (see Figure 8) with a white noise input. Using a scanning laser Doppler vibrometer (LDV Polytec PSV400), the spatial vibration measurement is measured over two grids corresponding to two frequency ranges: 19 × 9 points (for modal identification between 50 and 400 Hz), and 77 × 37 points (for IWC method between 400 and 5000 Hz). The boards are supported by two bungees at two attachment points for these two tests, as shown in Figure 8. For the decay rate and half-power bandwidth methods, only 6 over 12 soundboards were tested.
The last series of measurements are conducted on three different panels: one is made of aluminum, the second is made of medium-density fibre board (MDF), and the last is one of the Adirondack spruce soundboards (see Figure 9a–c). The purpose of this experiment differs from the other methods and will be explained in a separate section. The measurement on a single soundboard was sufficient to achieve the objective.
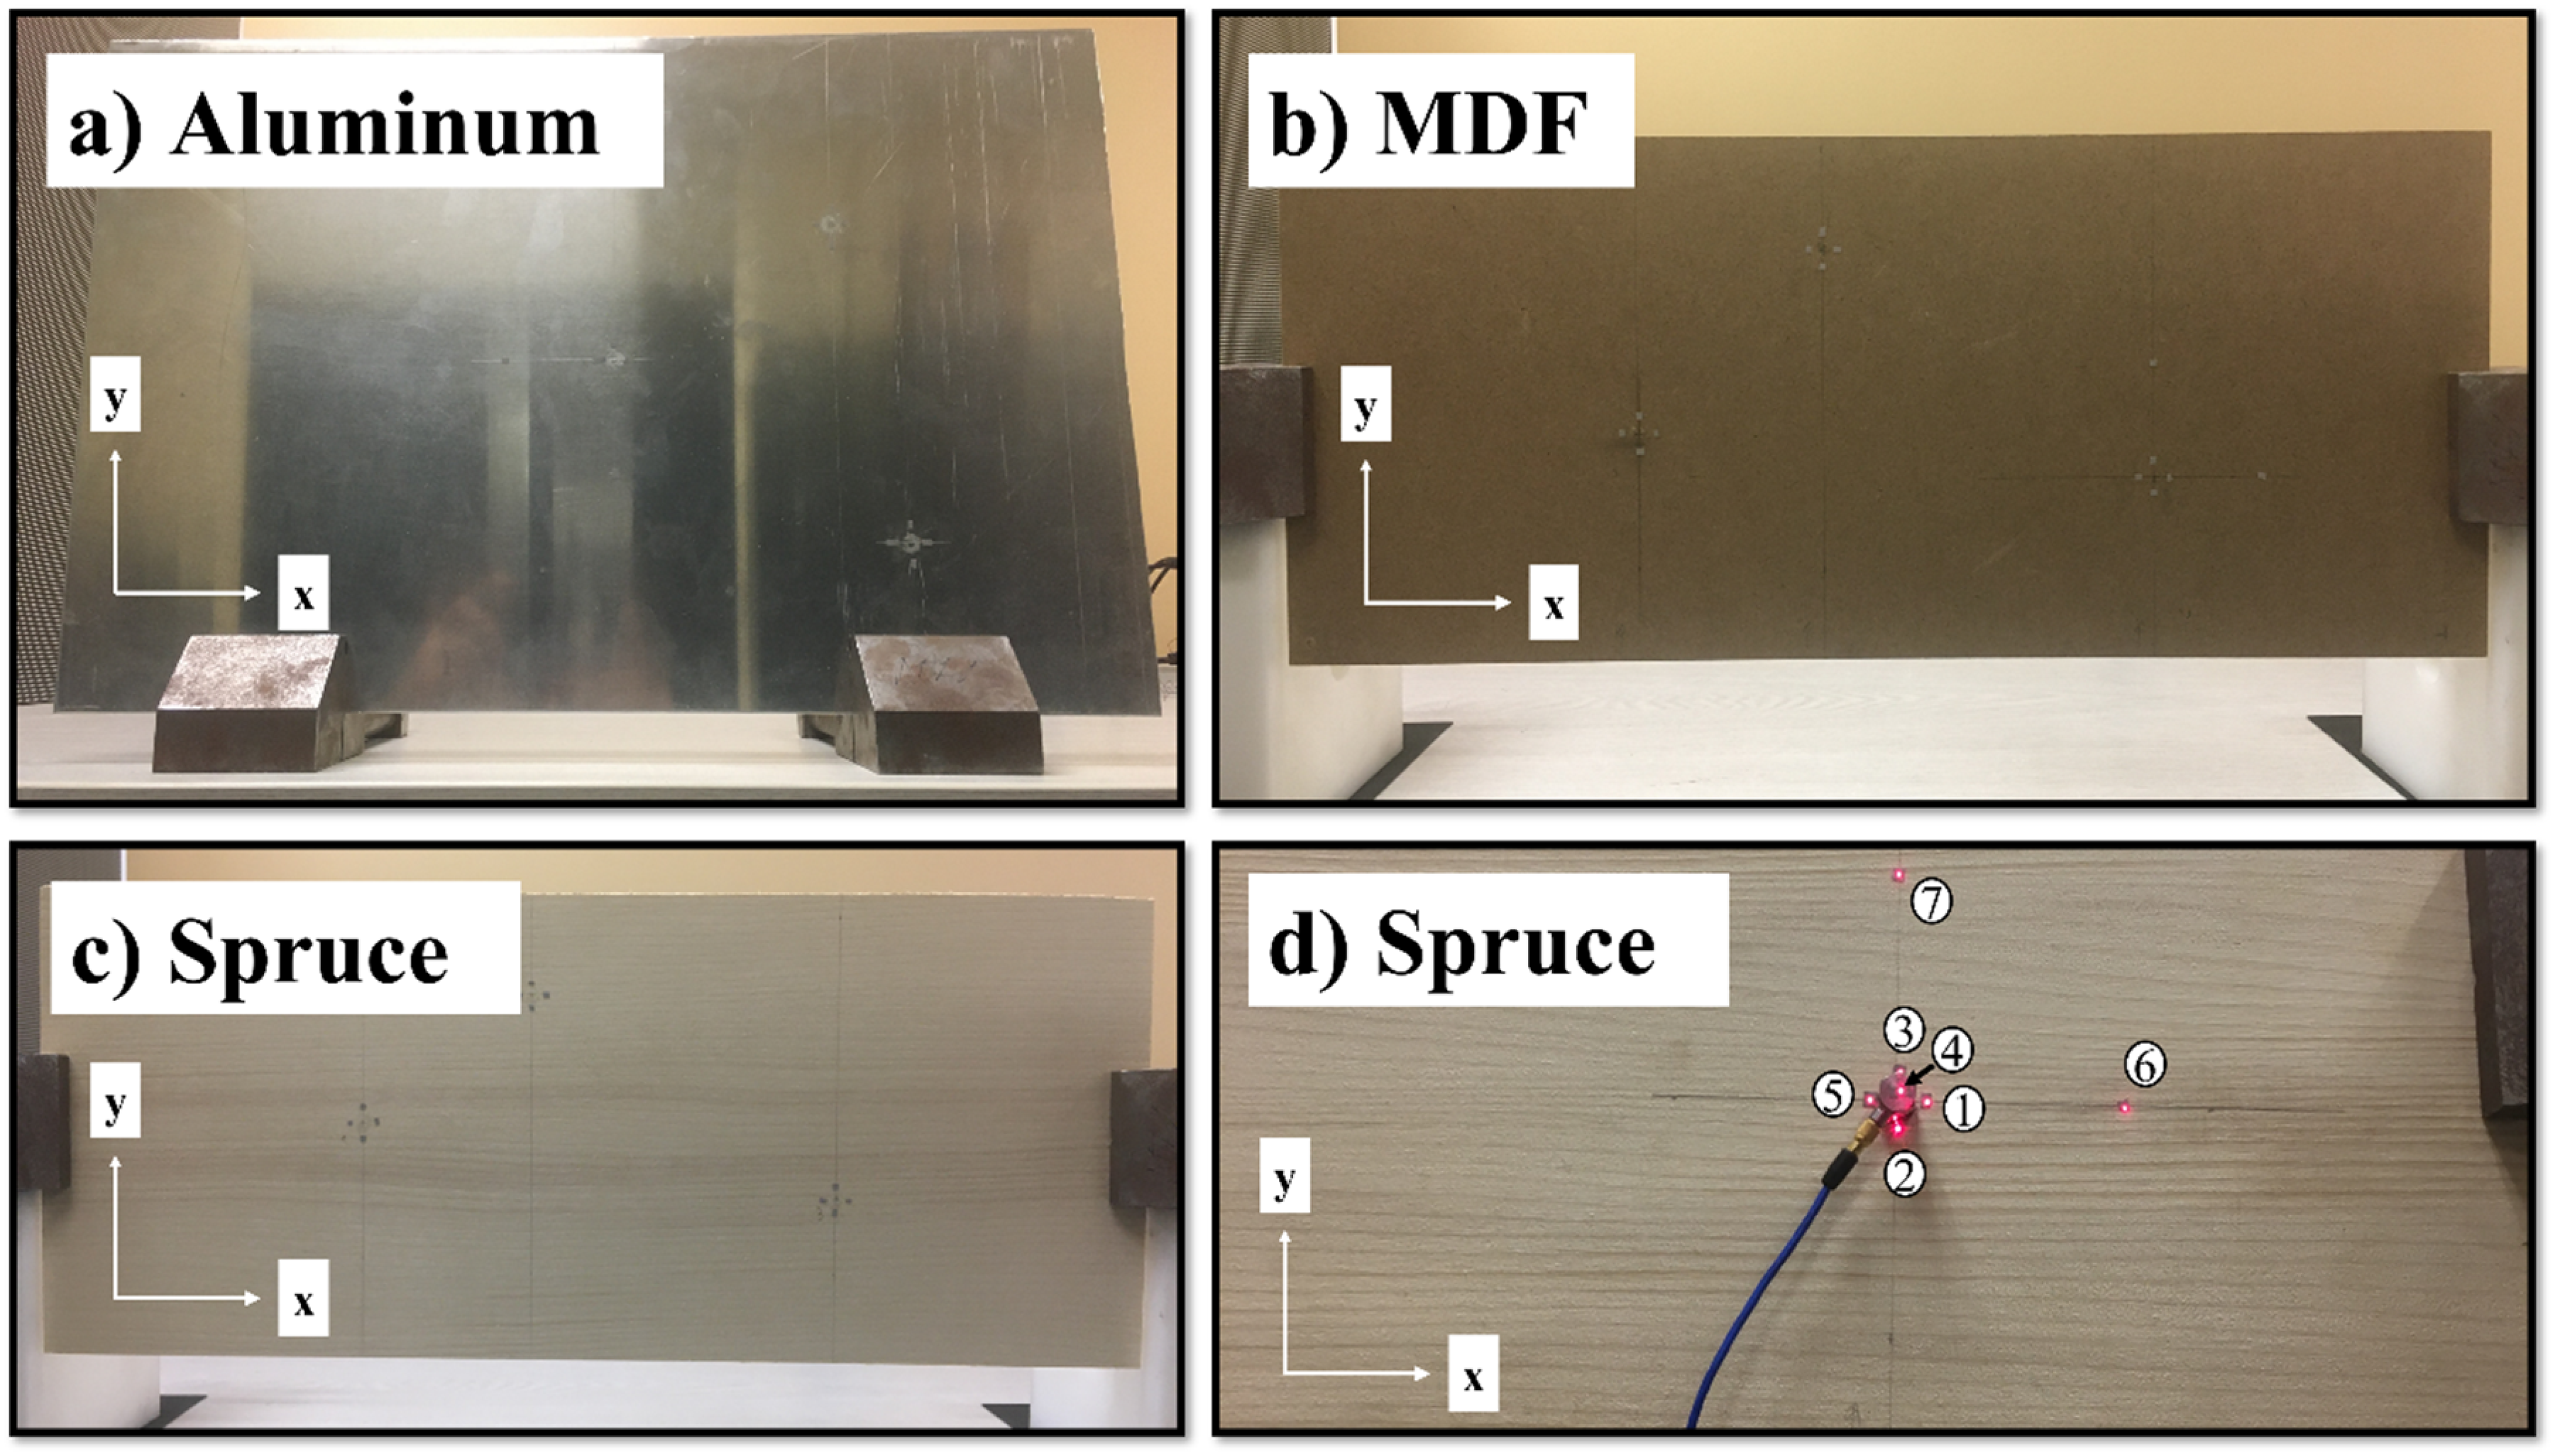
Pictures of the three plates used to evaluate the driving-point mobility method; (a) aluminum plate; (b) medium-density fibre (MDF) panel; (c) spruce soundboard 1R; (d) a zoom on the spruce soundboard to highlight the positioning of the accelerometer (point 4) and the laser point.
On Figure 9d, seven laser points are displayed but all results shown later are those obtained from measurements at point 4, as this is the point collocated with the accelerometer. The results from the other measurement points are not displayed in order to remain concise.
Densities and dimensions of the three panels are reported in Table 3.
Dimensions and densities of the three panels used for mobility measurements.
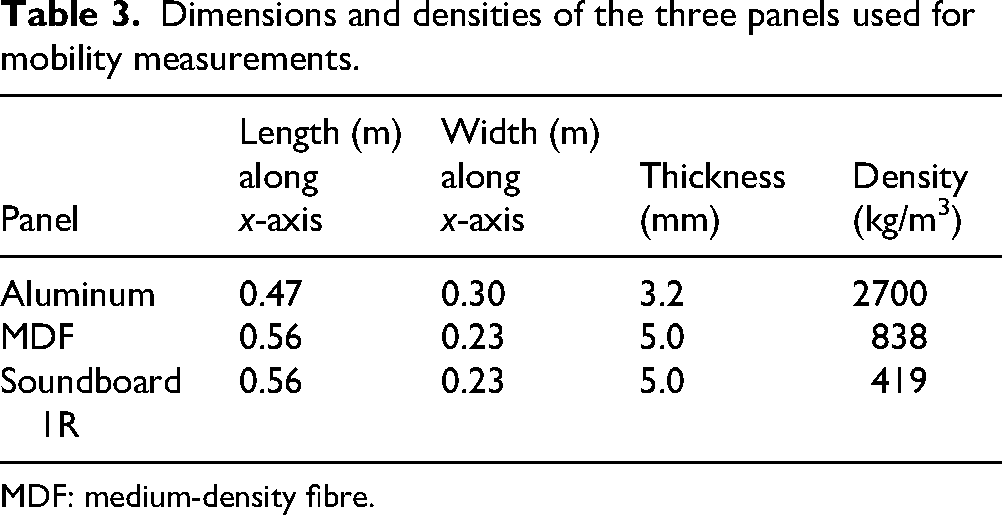
MDF: medium-density fibre.
Figure 10 shows the experimental set-up.
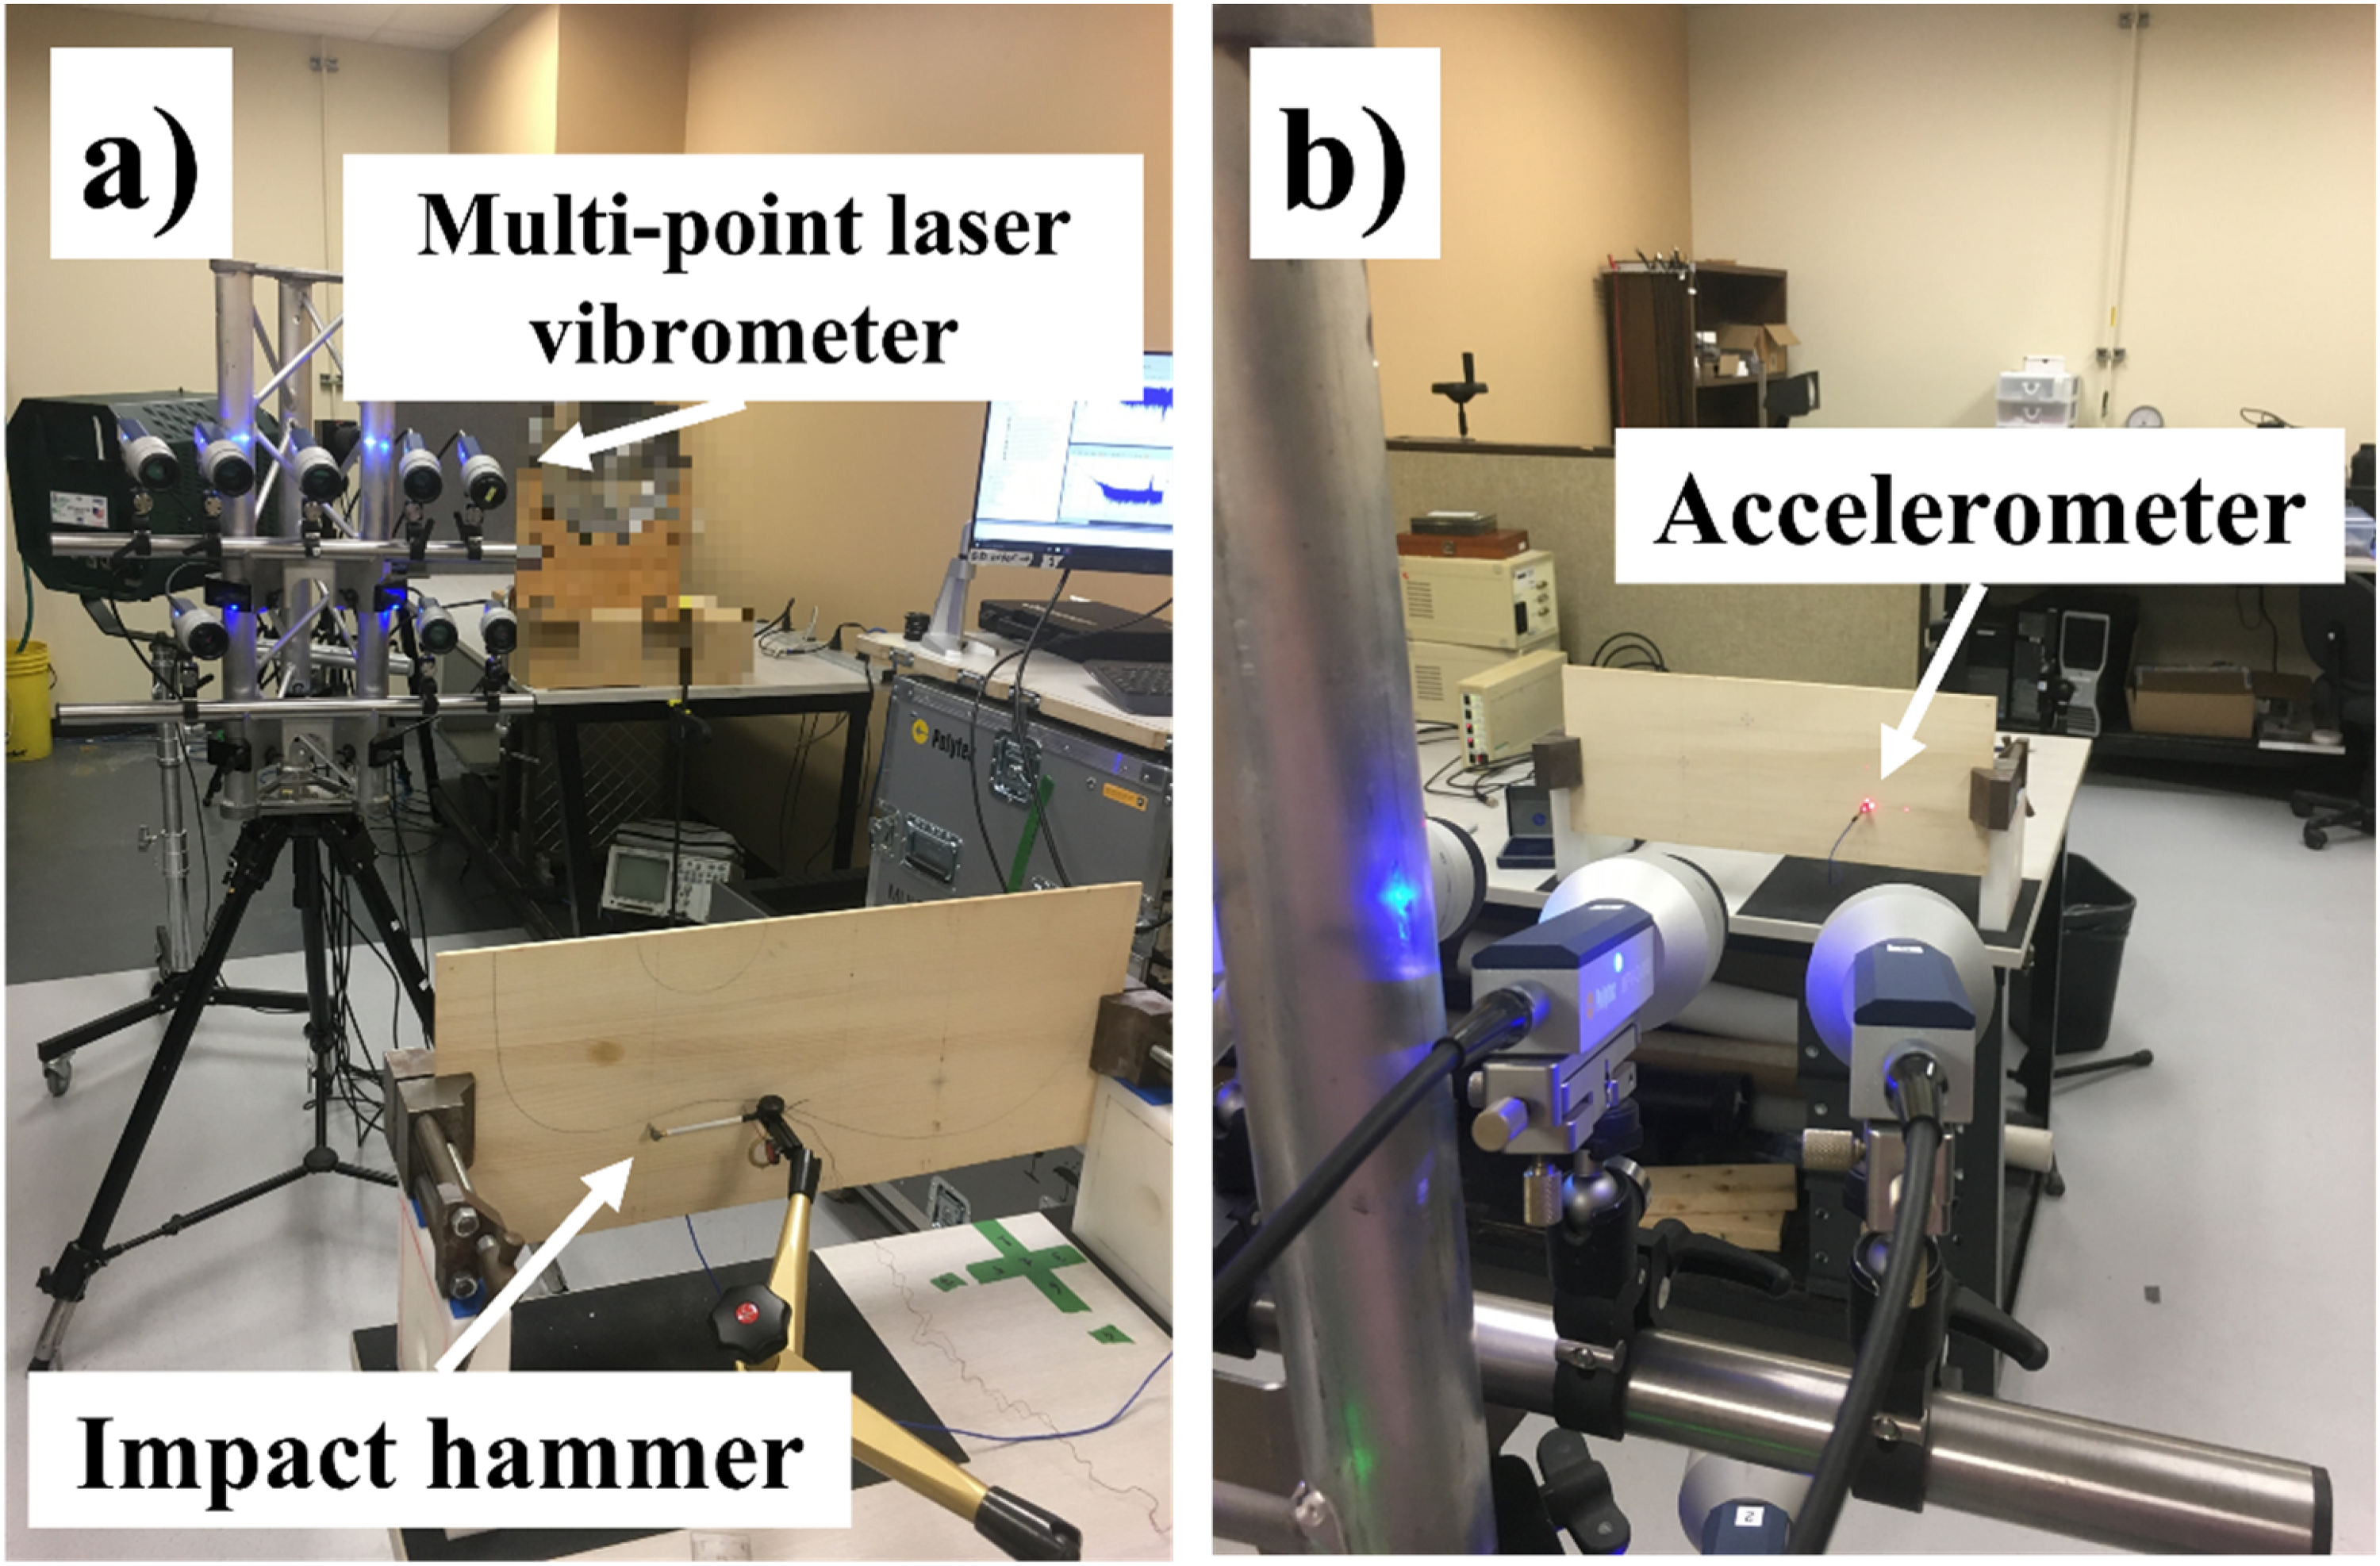
Experimental set-up for the application of the driving-point mobility method.
The measurement uses the same impact hammer and accelerometer as the impact testing for the application of the decay rate method. In addition, a multipoint laser Doppler vibrometer (Polytec MPV-800) is used. The driving-point mobility, calculated from the velocity over force FRF, is used to estimate the high-frequency bending stiffness. These FRFs are measured using three averages per location at three locations per panel and the H1 estimator (sampling frequency is 32 kHz, frequency resolution equals 0.25 Hz). Measurements are then studied at each location separately. Results only show one location of the accelerometer and impact hammer.
At one location, the first measurement only uses the vibrometer. The second one uses the vibrometer and the accelerometer, but the accelerometer is not wired. The last measurement uses the vibrometer and the accelerometer is wired. The raw data of the vibrometer and the accelerometer (when wired) is used to calculate the FRFs. Table 4 resumes the plan of this last experiment.
Third experiment plan.
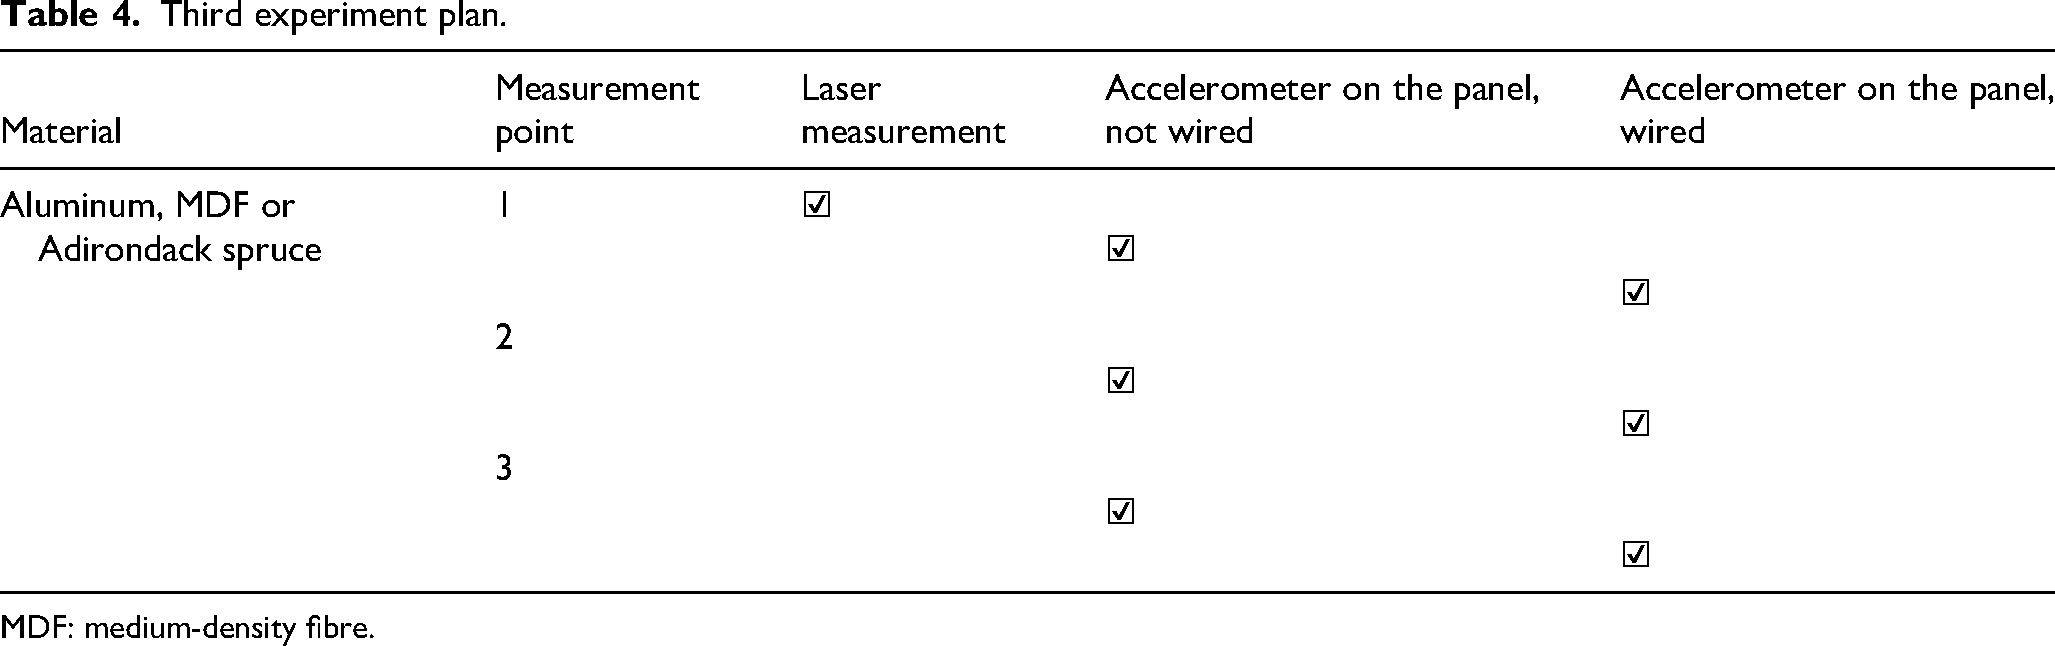
MDF: medium-density fibre.
Results
Young's modulus
To apply the modal identification method in practice, modes 1 and 3 are visually identified from FRFs and mode shapes as shown in Figure 3. The postprocessing is initialised using a target resonance frequency, and three subfigures are plotted. With the FRF plot, we determine the two frequencies of interest which are
These results are compared with those obtained using IWC method in Figures 11 and 12. An example of the IWC map used for the IWC method is displayed on Figure 4 at 2 kHz. The elliptical curve is optimised to fit the maximum values of the IWC coefficient.
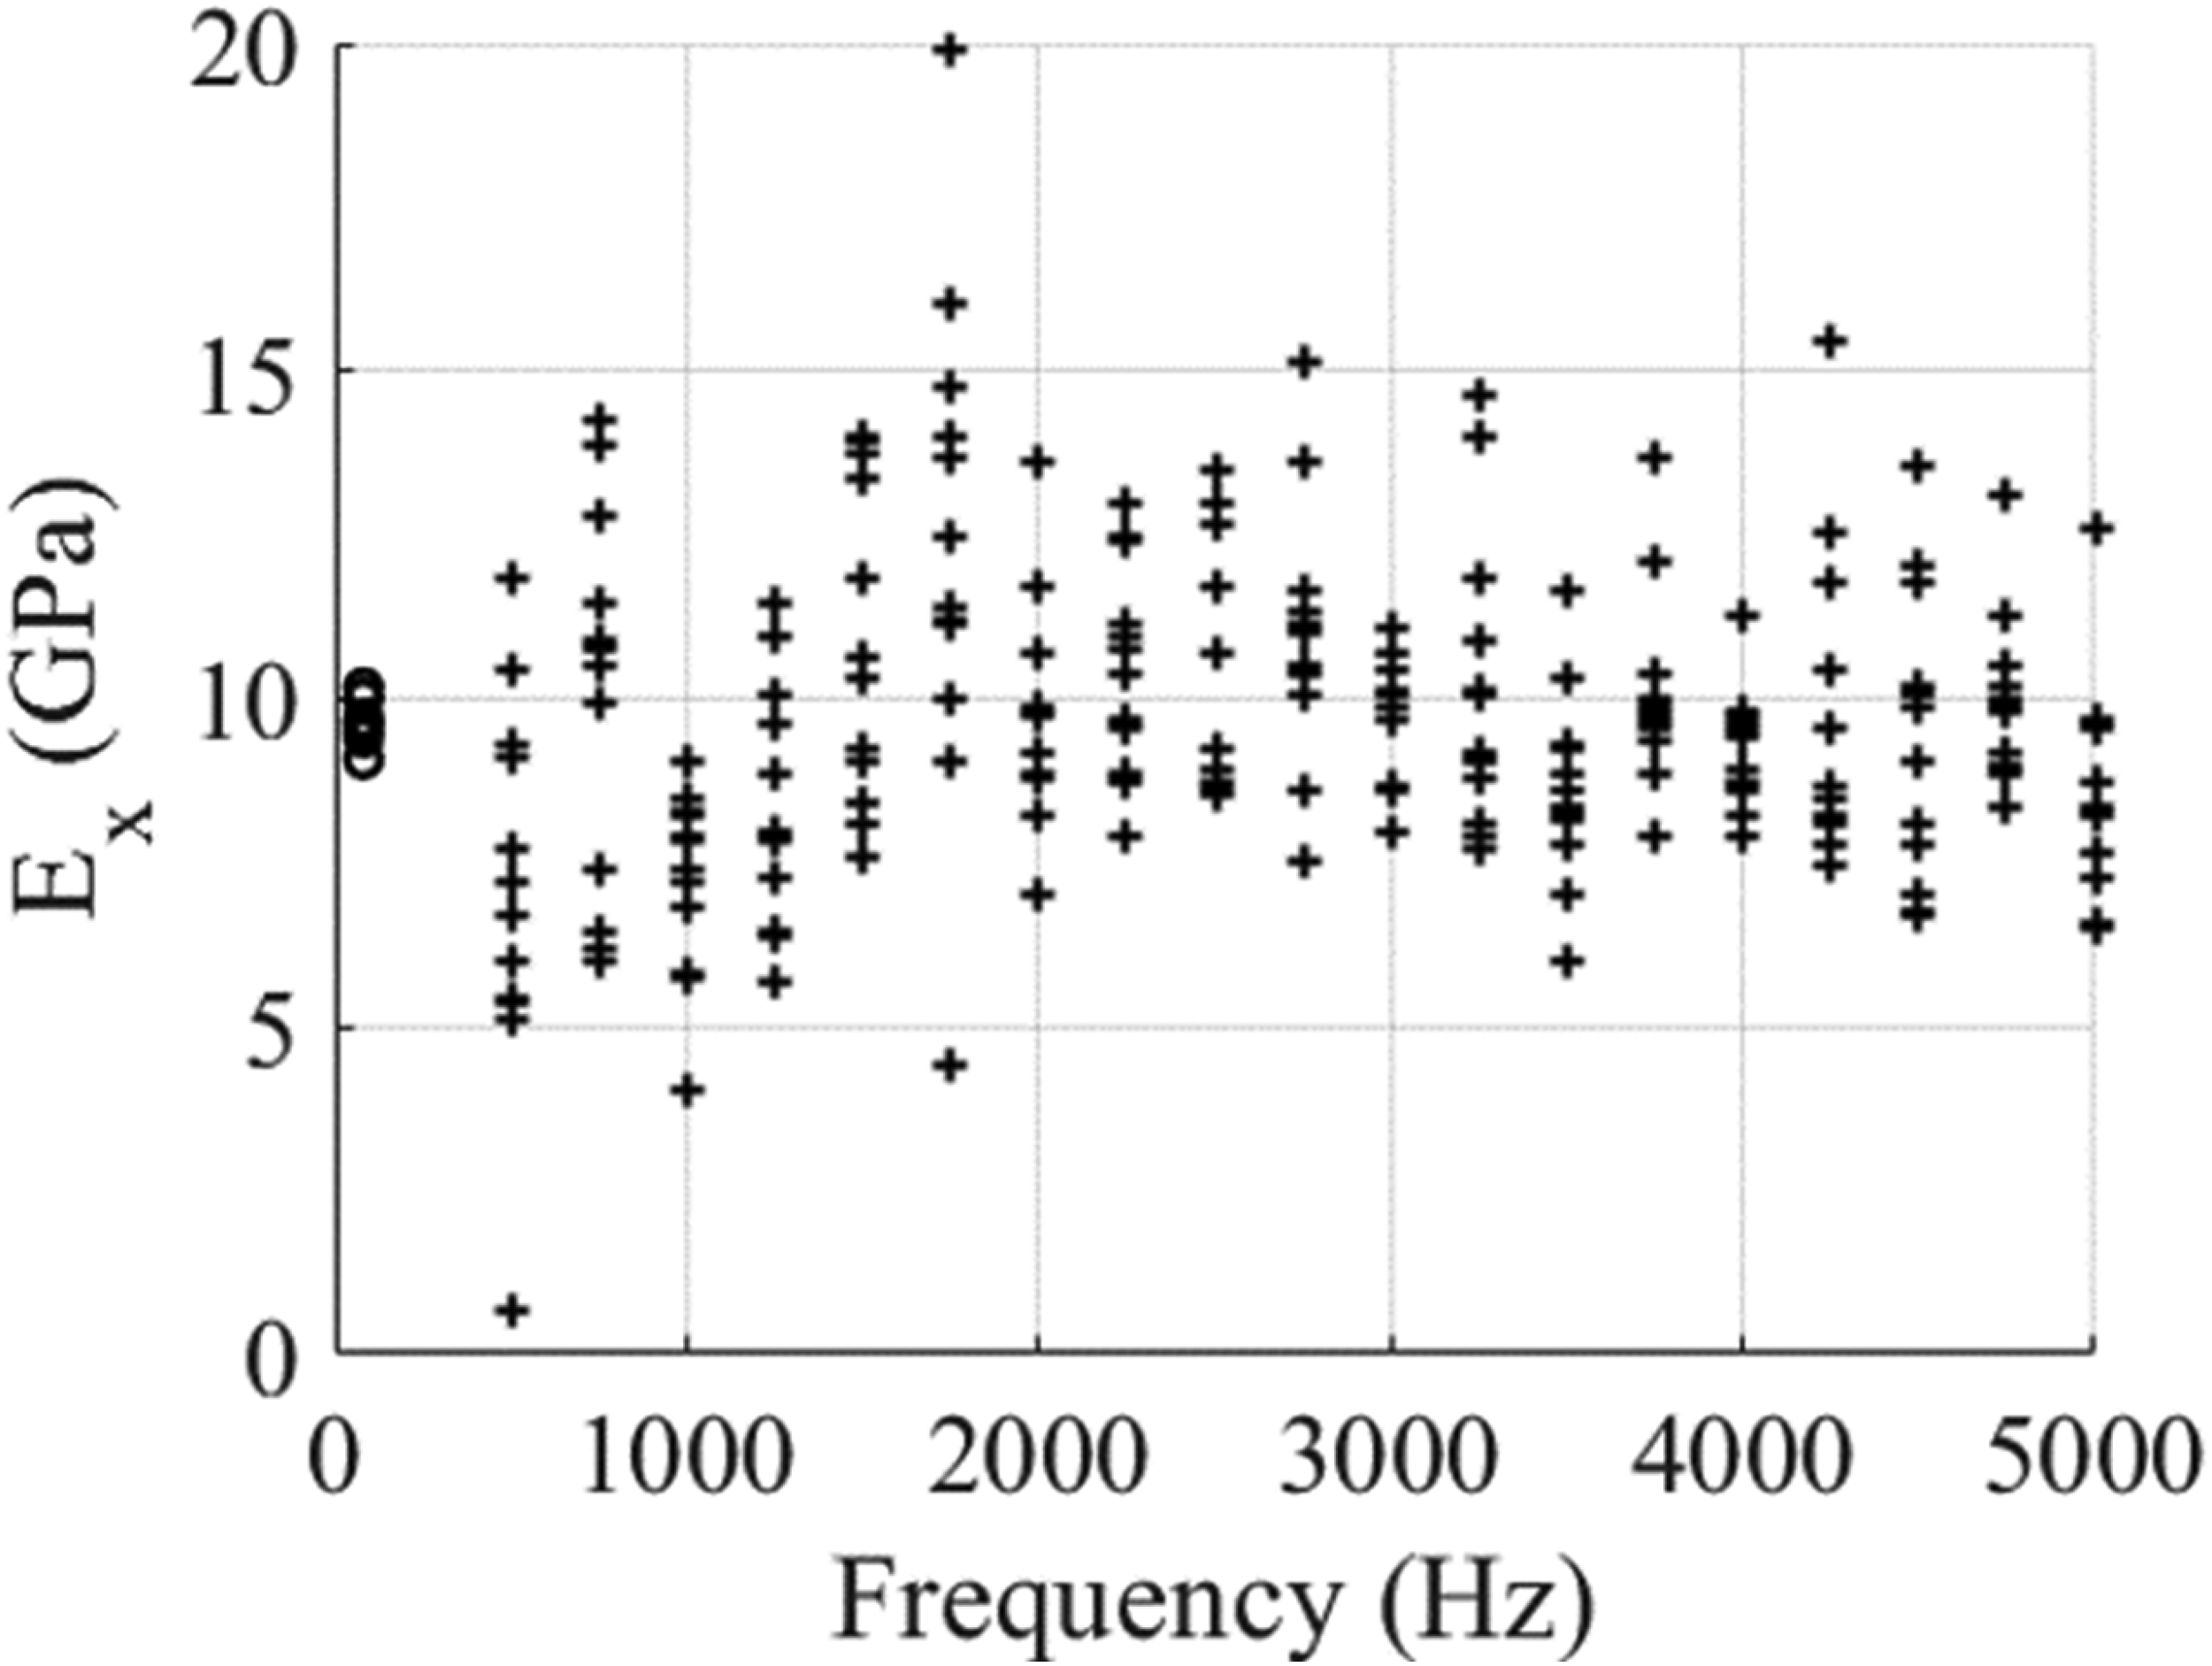
Estimation of
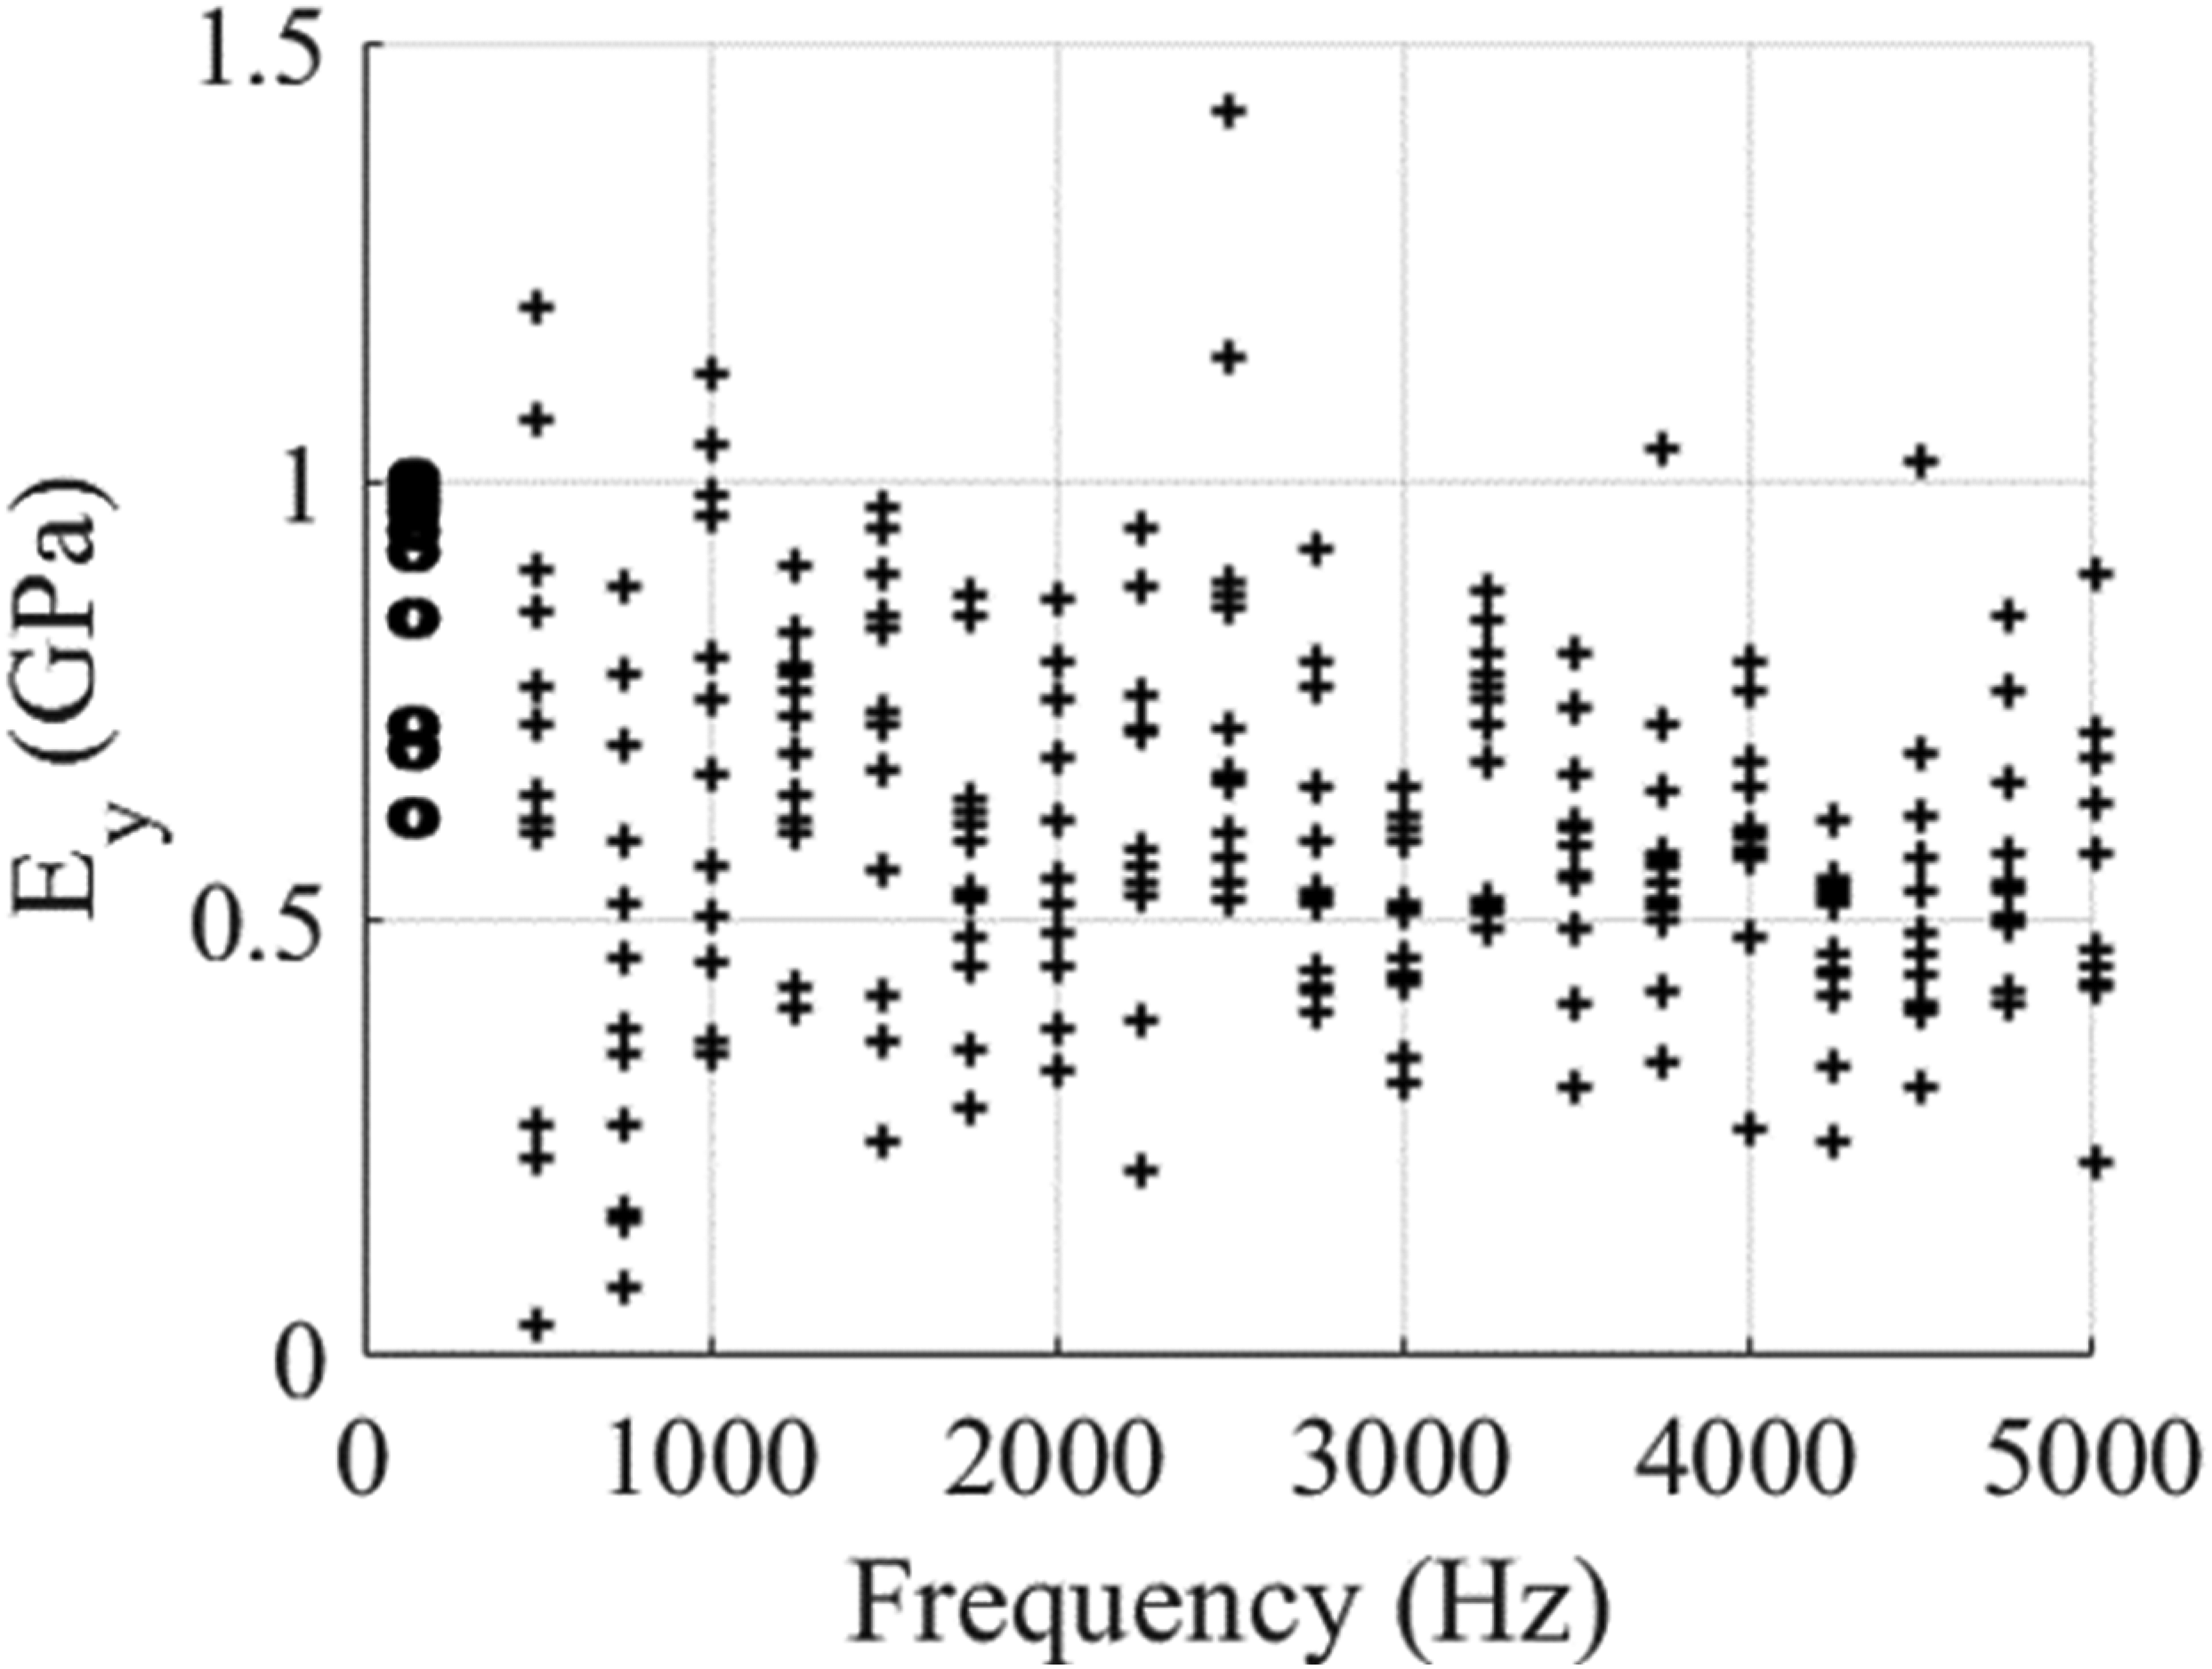
Estimation of
The estimated value of
Young's moduli results for the modal identification and IWC methods.
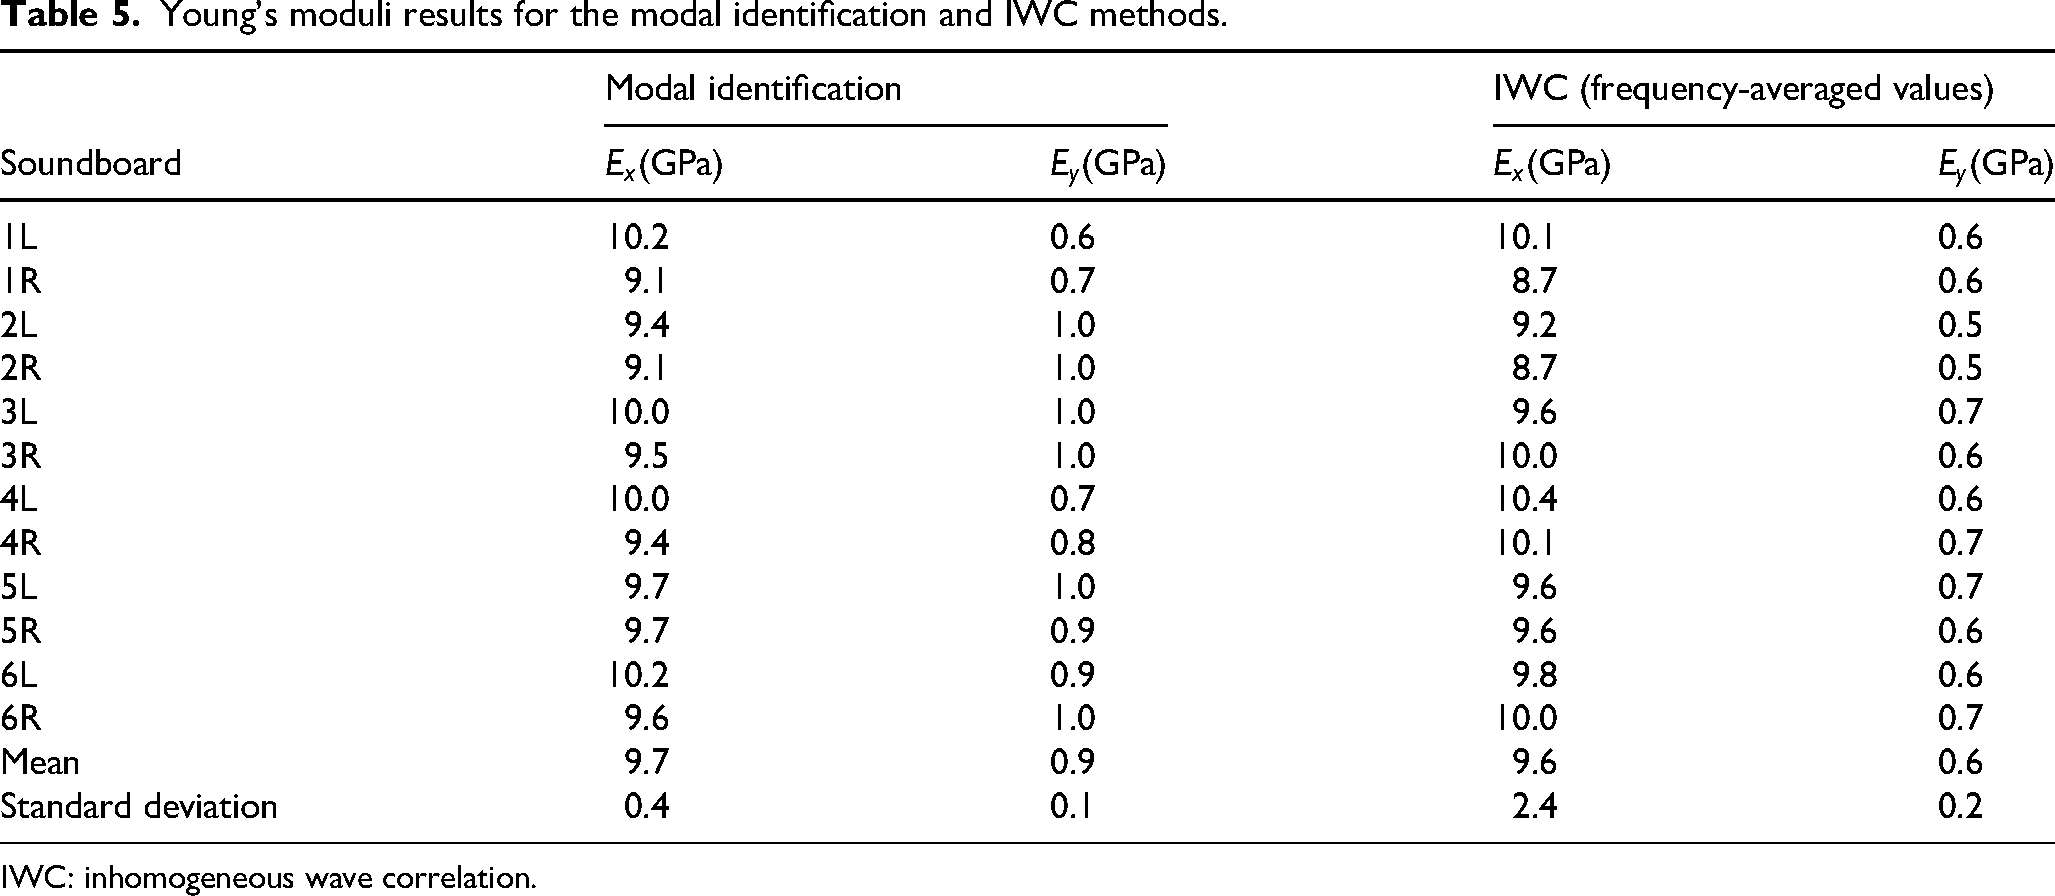
IWC: inhomogeneous wave correlation.
The estimation of
While the modal identification method is applied to a low-frequency band, IWC is performed over a much wider frequency band. The IWC method provides more biased estimations in the high-frequency domain when the energy is more localised near the source.
Some values obtained with the IWC method are out of range, approaching a few hundred megapascals. This is especially noticeable at low frequency and is attributed to the presence of noise in the processed data. It underlines the limitation of choosing an arbitrary frequency increment for computations, 250 Hz in this work. Indeed, the estimation provided by the IWC method may be poor when the signal-to-noise ratio is low and coherence is not sufficiently high. A finer selection of frequency bands with optimal characteristics could be done before estimating the wavenumbers, rather than selecting an arbitrary fixed-frequency step.
Based on these initial results, the method will be implemented in the future with a finer frequency step, and an additional signal processing step (using, for example, a criterion based on signal-to-noise ratio and coherence). We plan to include other directions, beyond only longitudinal and radial ones, as well as structural loss factor estimation.
The results obtained using the driving point mobility method are described in a later section of this document, as the method was not intended to be use to estimate directly the mechanical properties of the soundboards.
Structural loss factor
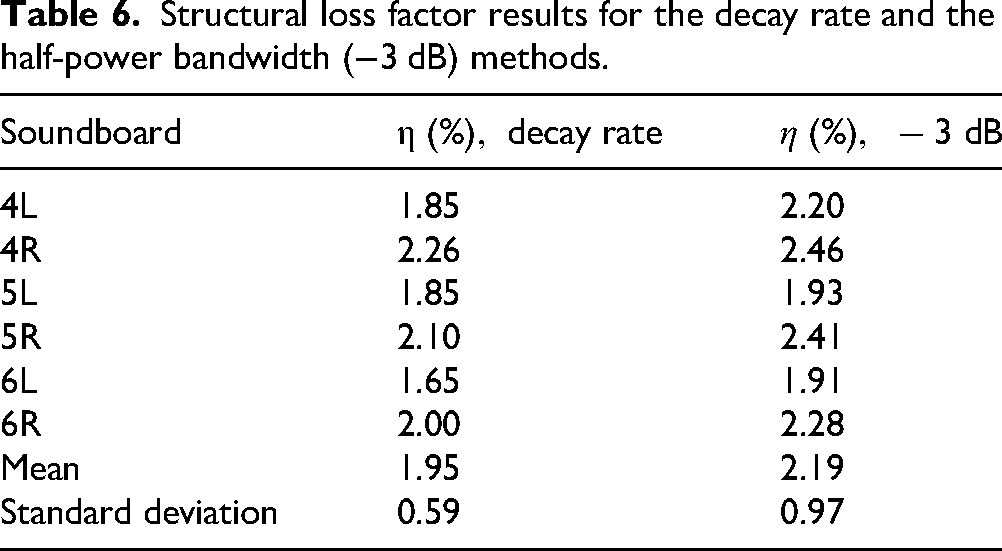
Figure 13 shows the structural loss factor values estimated using the half-power bandwidth for soundboards 4, 5 and 6 (left and right). Figure 14 shows results obtained using the decay rate method on those same soundboards. Those two estimations are consistent except for one soundboard. The mean estimated values using the decay rate and half-power bandwidth method are 1.95% and 2.19%, respectively. The estimated standard deviations are 0.59% and 0.97%, respectively. Table 6 summarises these data.
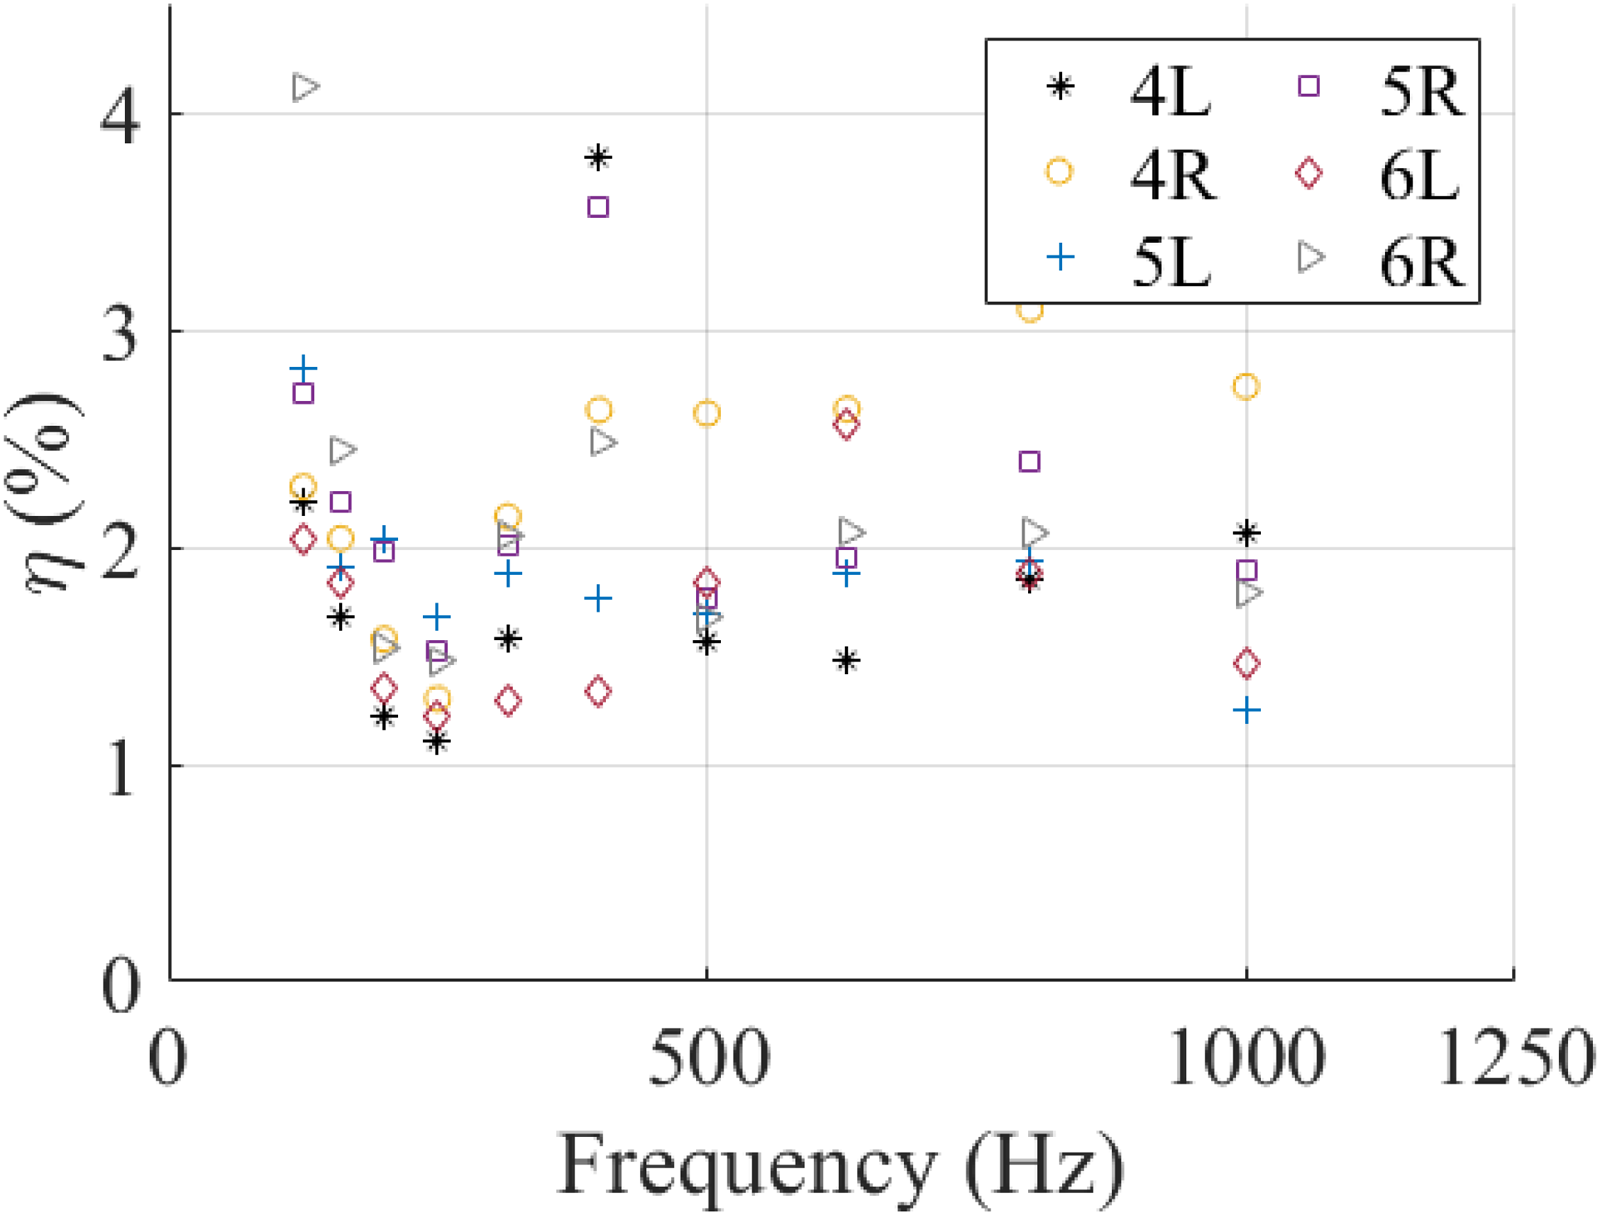
Estimation of the structural loss factor using the half-power bandwidth method on soundboards 4, 5 and 6 (left and right).
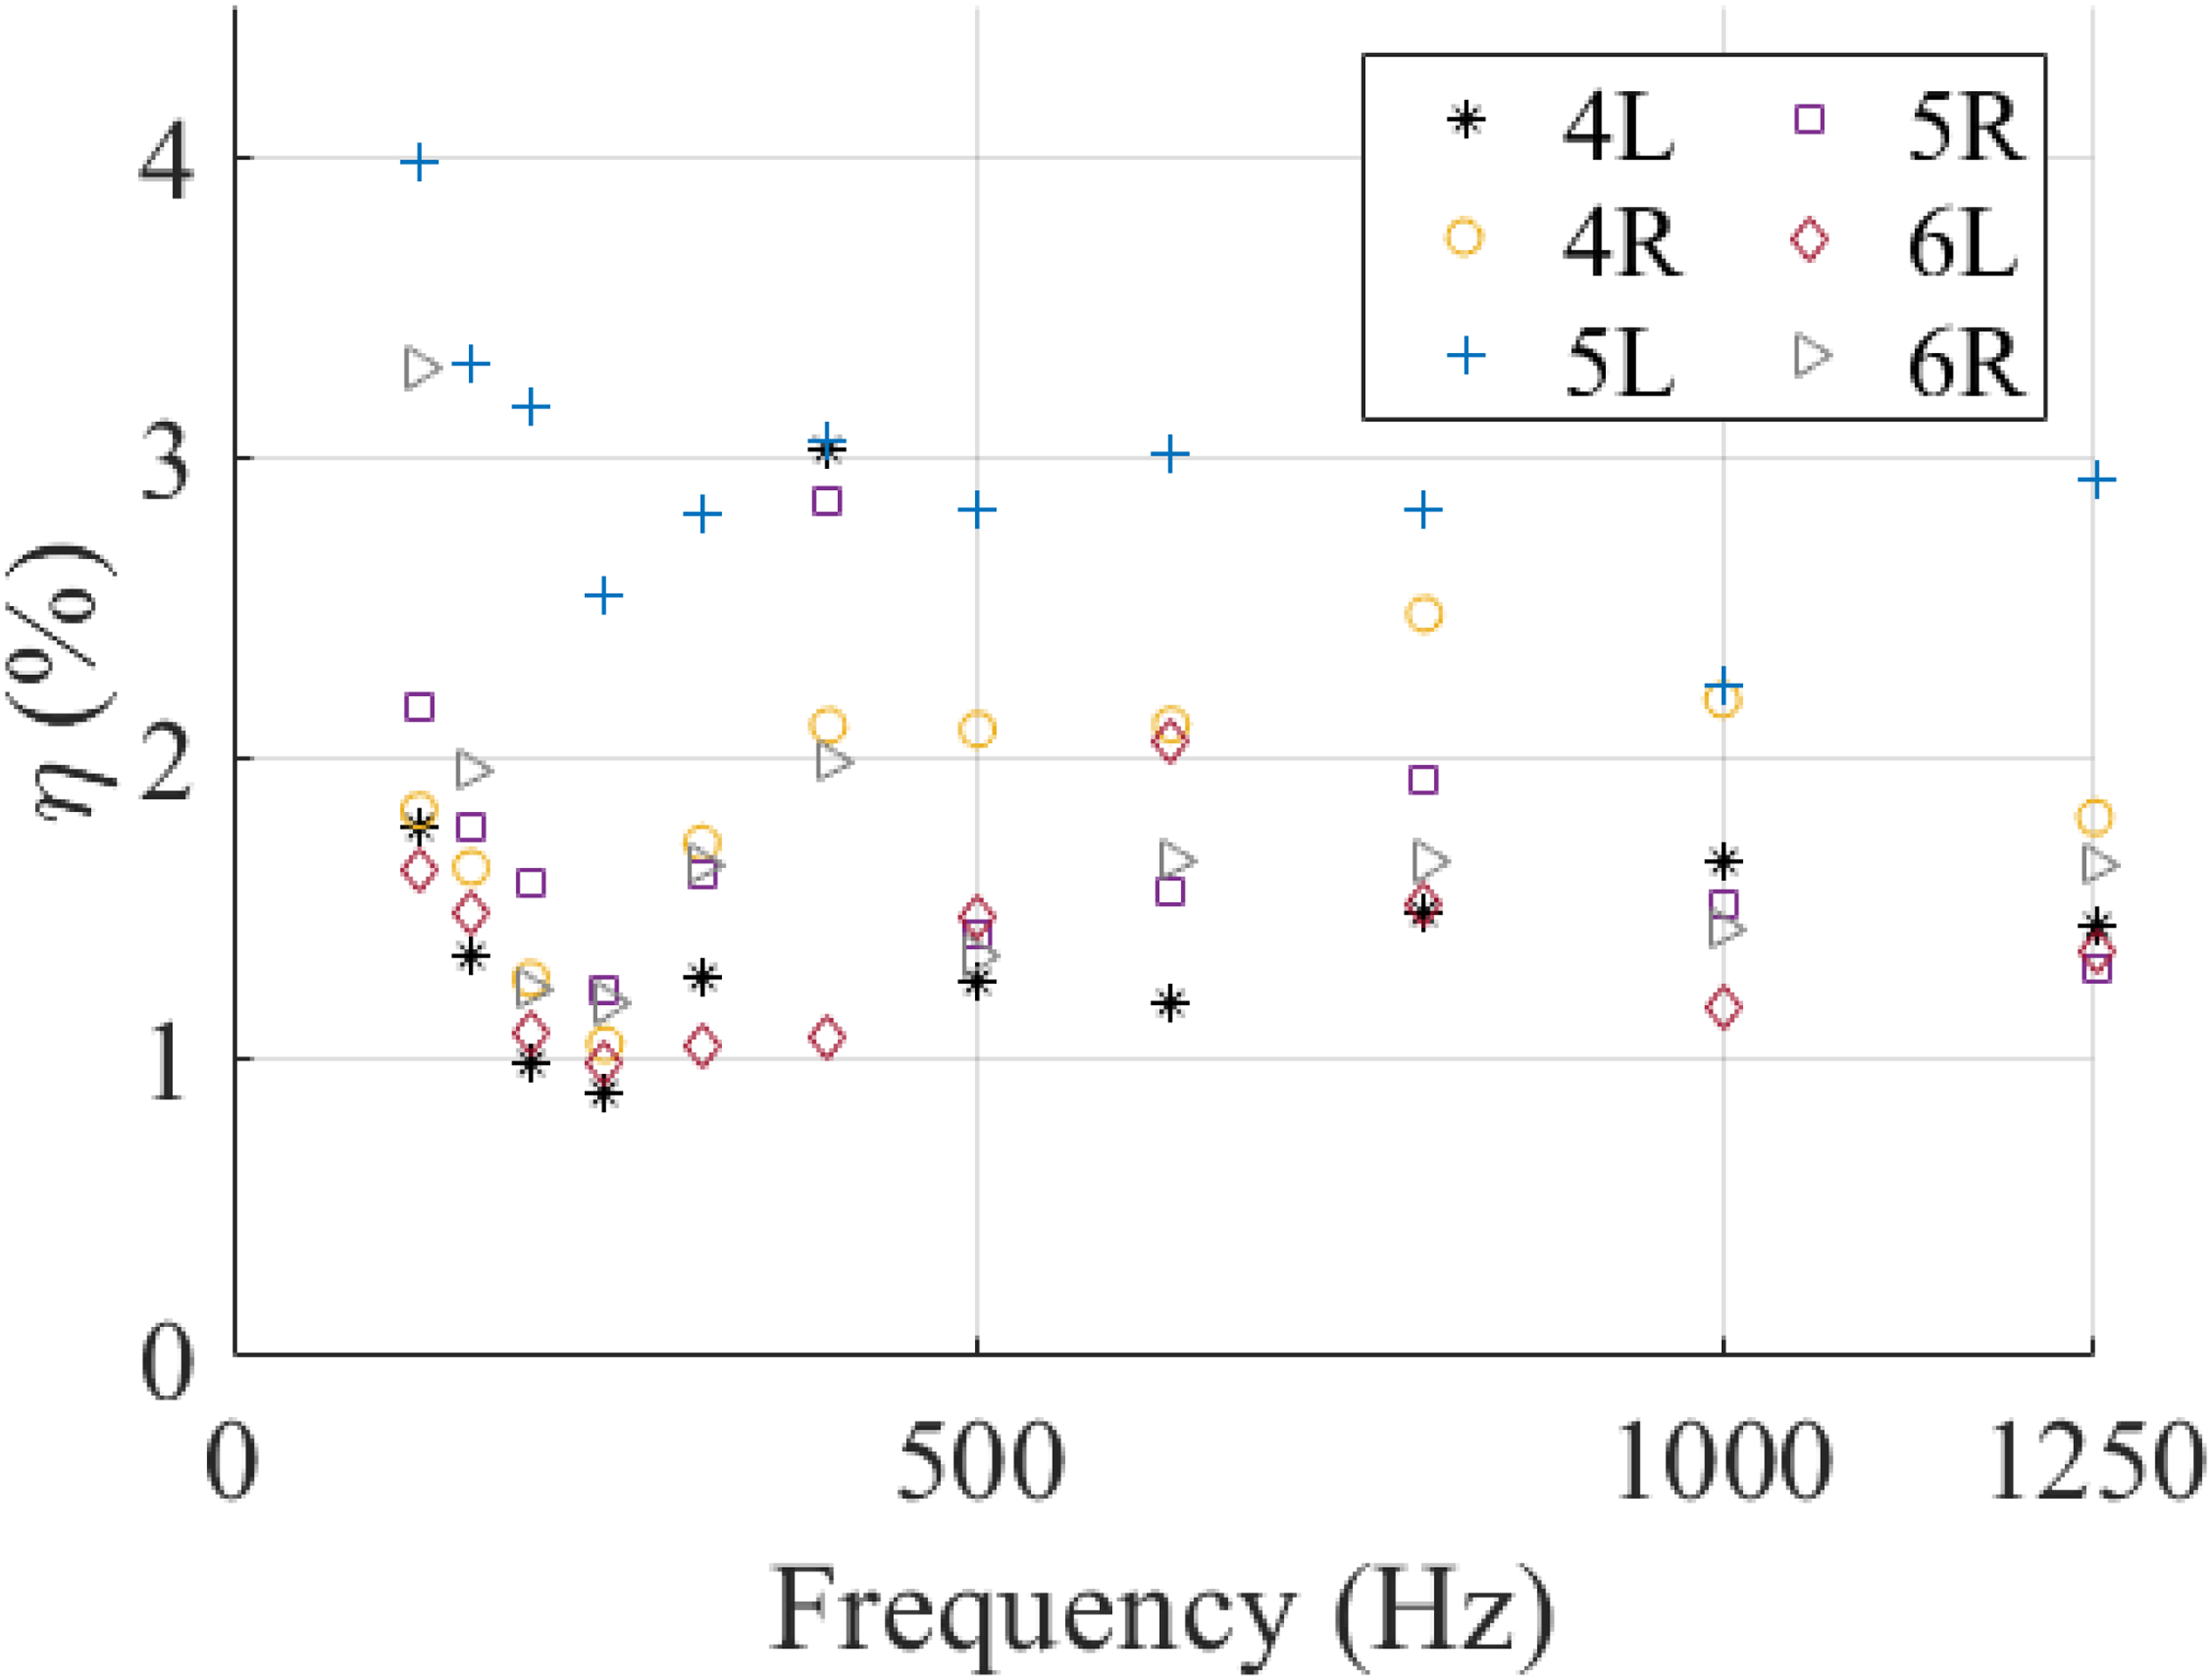
Estimation of the structural loss factor using the decay rate method on soundboards 4, 5 and 6 (left and right).
Structural loss factor results for the decay rate and the half-power bandwidth (−3 dB) methods.
Driving-point mobility and mass correction
In the high-frequency domain and for a light structure, the added mass 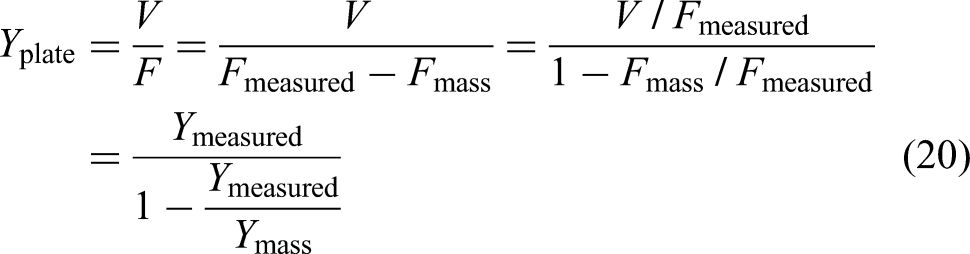
The results obtained for the driving-point mobility are shown in Figure 15a and b. For the aluminum and MDF panels, the influence of the accelerometer's added mass is minimal compared to the panel's inertia. The mobility for the aluminum panel does not depend on the sensor for the inertia of the accelerometer is very low compared to the panel's. Furthermore, the mobility tends to the asymptotic value
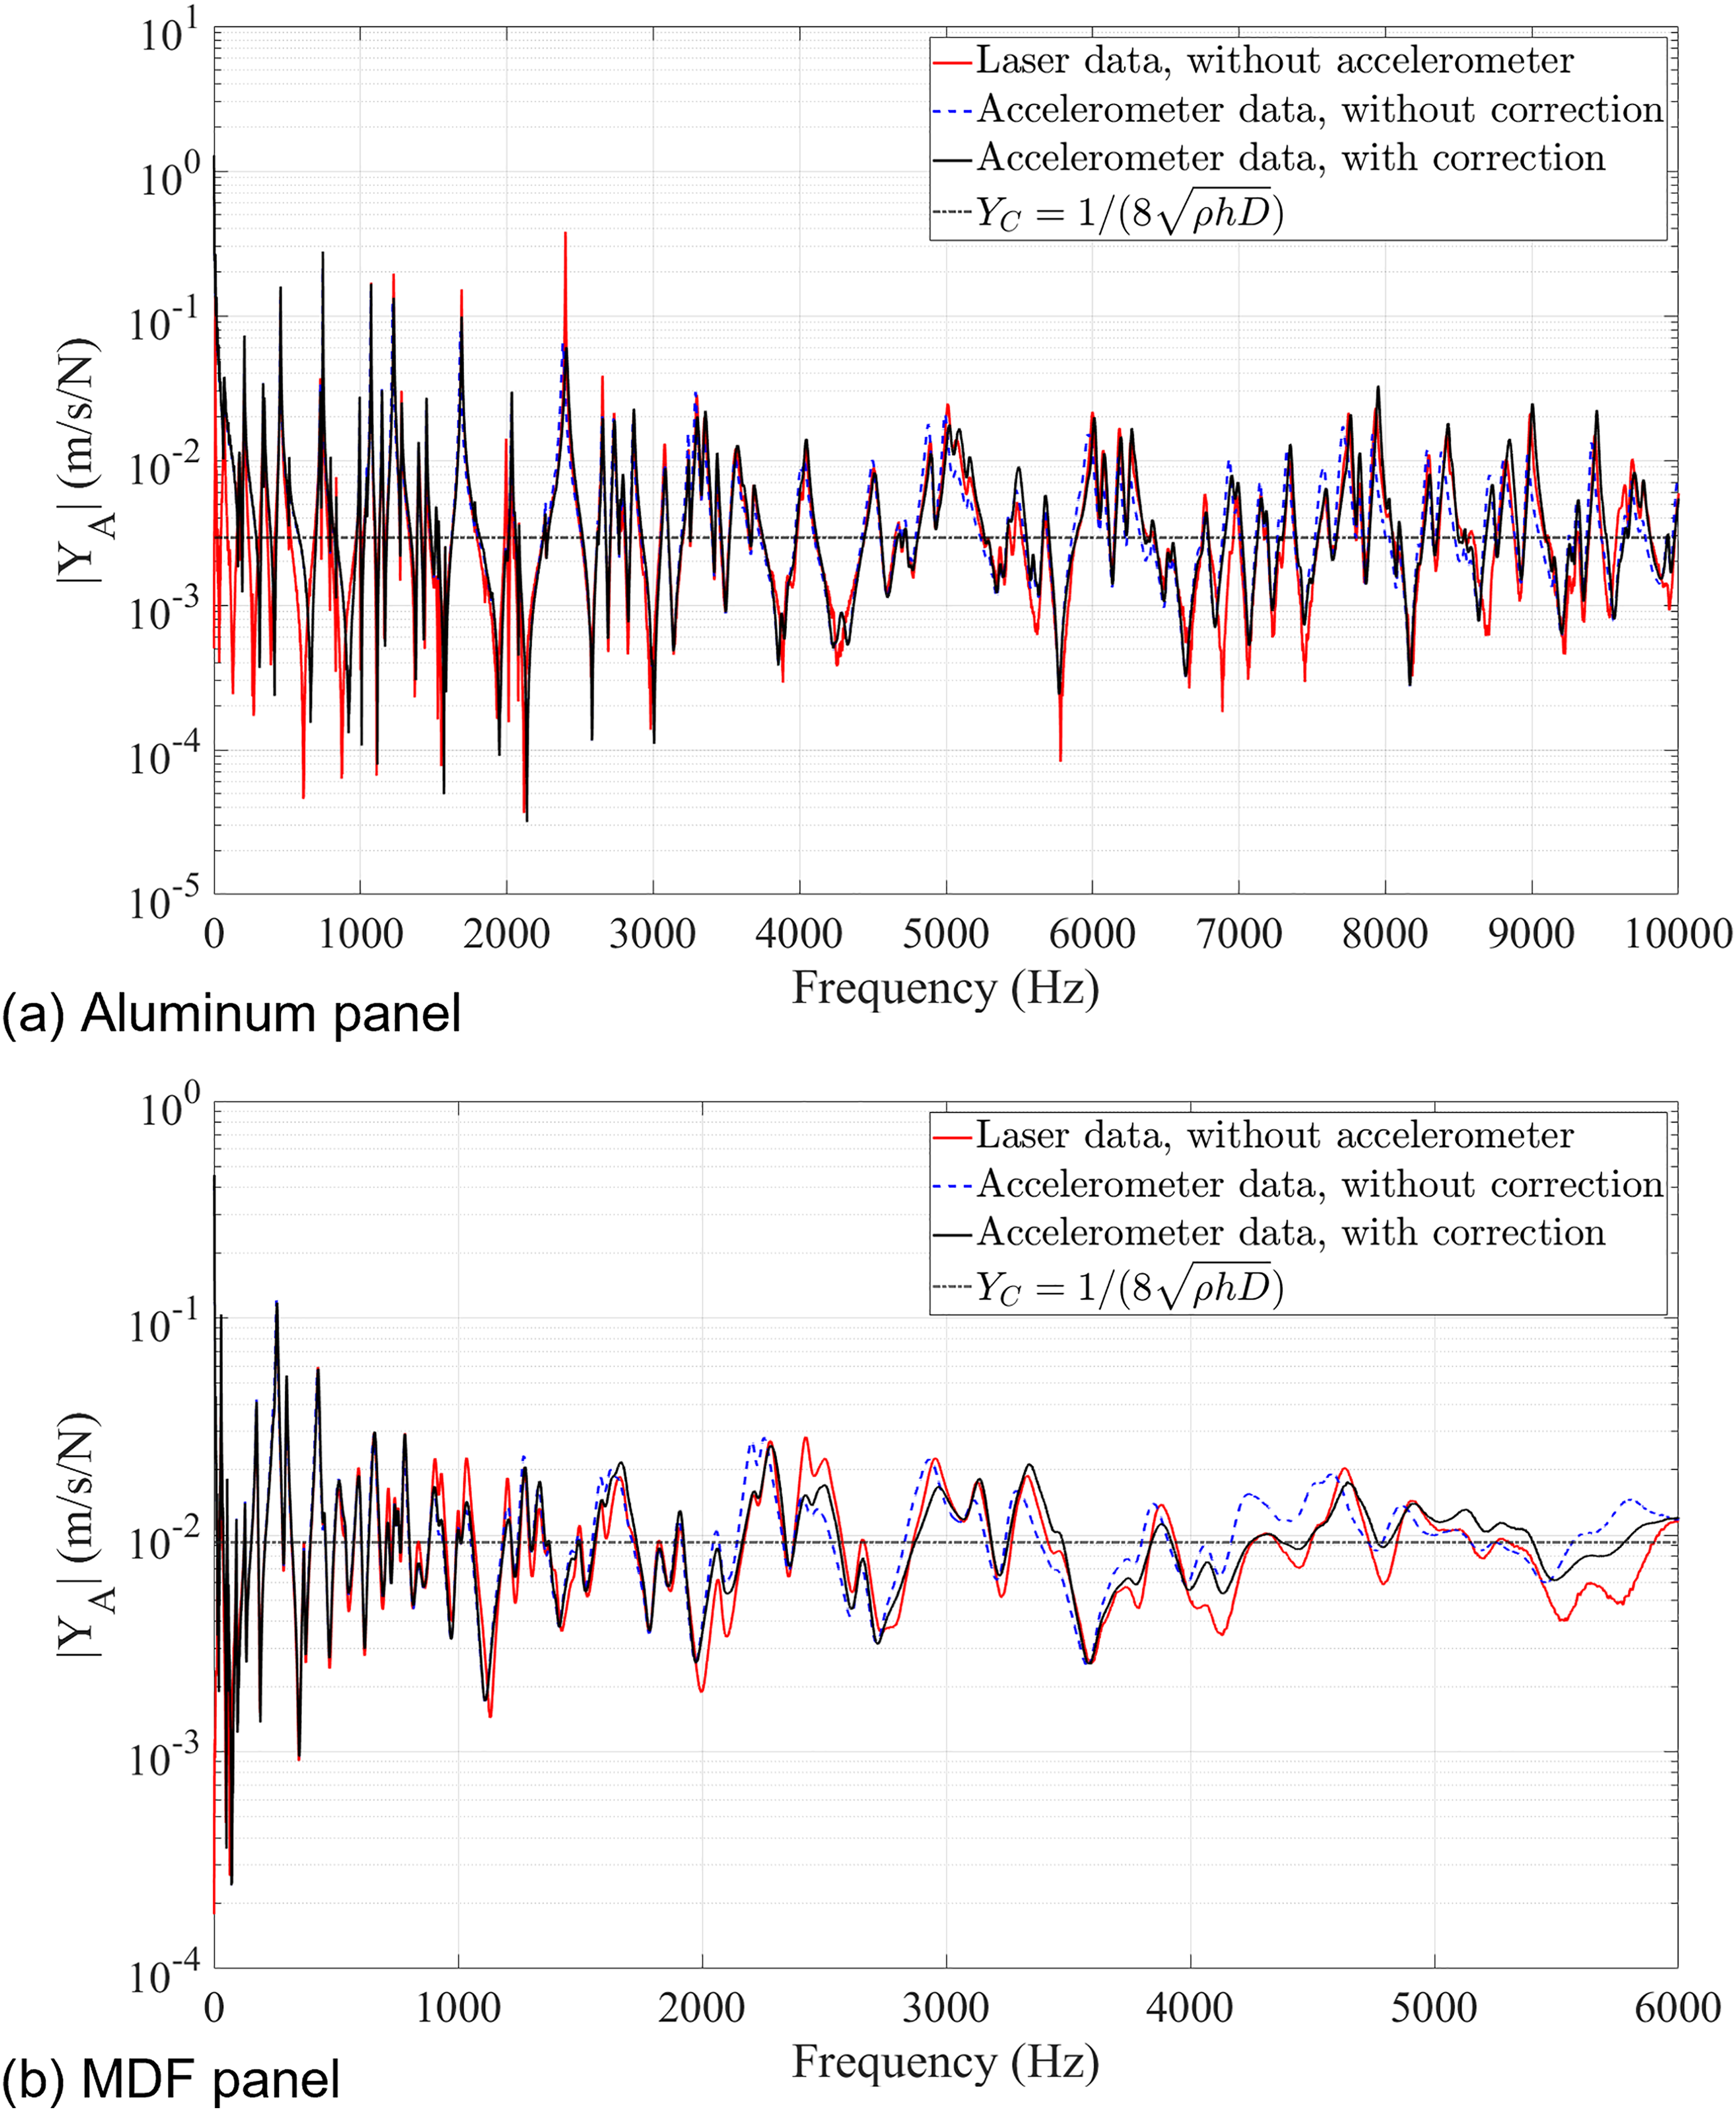
Results of the driving-point mobility method for (a) aluminum and (b) medium-density fibre (MDF) panels.
For the MDF panel, the asymptotic tendency starts at a lower frequency, around 4 kHz. At higher frequencies, the modal overlap and the significant structural loss factor cause the mobility to tend towards a curve with little variation, which fluctuates around
The mass correction for the soundboard's measurements proves its relevance. This panel is lightweight, and the accelerometer's mass is no longer negligible, see Figure 16. This mass-effect is translated into a progressive amplitude reduction with frequency increase (dotted blue curve). However, this effect can be corrected by using equation (20), as shown by the result plotted using a continuous black curve, now aligned with the theoretical asymptotic value.
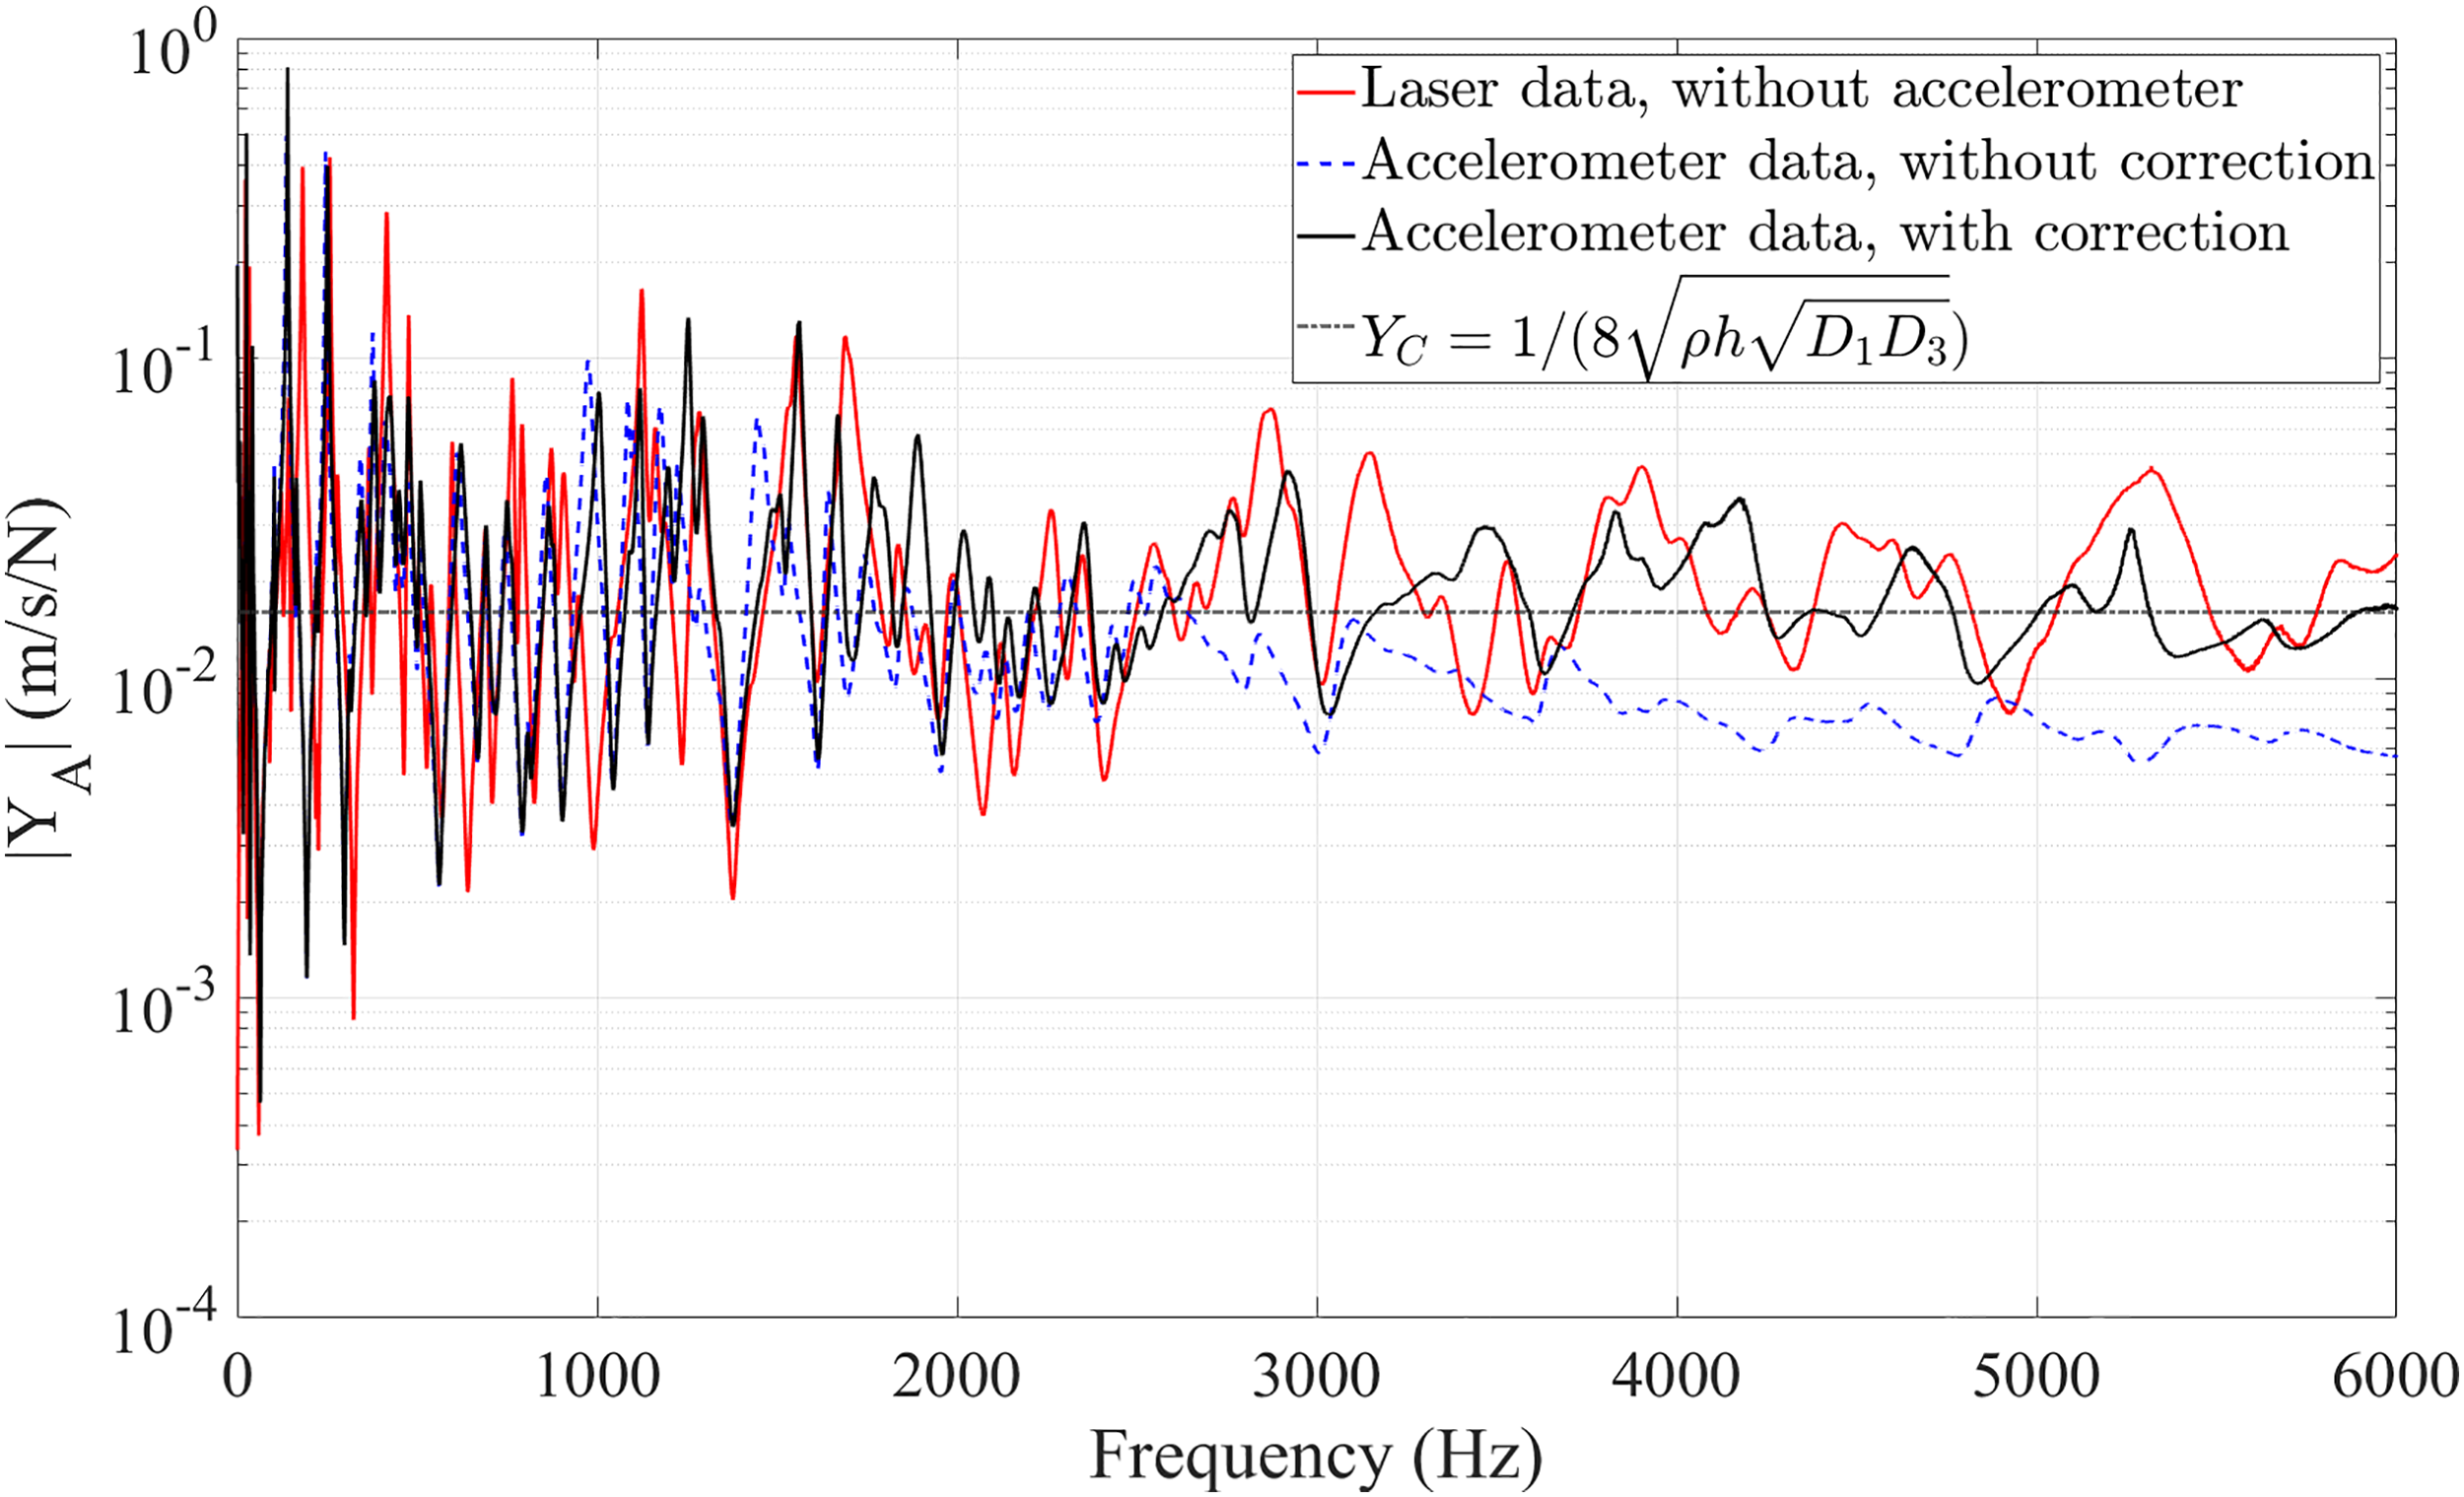
Result of the driving-point mobility method for spruce soundboard 1R.
As a reminder,
Comparison with literature data
The values presented in the previous section for Adirondack spruce are now compared to those reported in the literature for spruce. The most significant results of these studies are summarised in Table 7, and briefly described in the following paragraphs:
In reference [41] the age and thinning effects on wood properties were studied, and the authors provide an average Young's modulus estimated with the ASTM D-143 standard testing using samples from thinned and not thinned red spruce stands, and from mature and juvenile wood. The value indicated in Table 7 corresponds to the average value of the mature wood from the unthinned stand. In reference [42] two small strips were cut in each sample of various woods, including red spruce. One has its length aligned with the grain and the other has its length perpendicular to it. This allows the estimation of elastic moduli, taking orthotropy into account. The article on simultaneous non-destructive identification of mechanical properties of spruce tonewood
14
used a vibrational method (the FEMU-3DVF method) on quarter-sawn European spruce samples which results in the estimation of in-plane elastic moduli (along and across the grain). The modal identification method was used to estimate elastic moduli of European spruce in reference [43]. New descriptors and traditional ones are used to grade materials (spruce, maple and rosewood) traditionally employed for stringed instruments soundboard crafting. In reference [44], the influence of the growth ring distance on acoustical properties for violin top wood qualification was studied for red spruce. In reference [12], small cubic specimens of yew and Norway spruce were characterised with ultrasonic waves. Young's modulus in the longitudinal direction was estimated with the measure of ultrasonic wave velocity. Transverse wave velocity was used to measure the shear moduli.
Average density, Young's moduli and index of merit of spruce from literature.
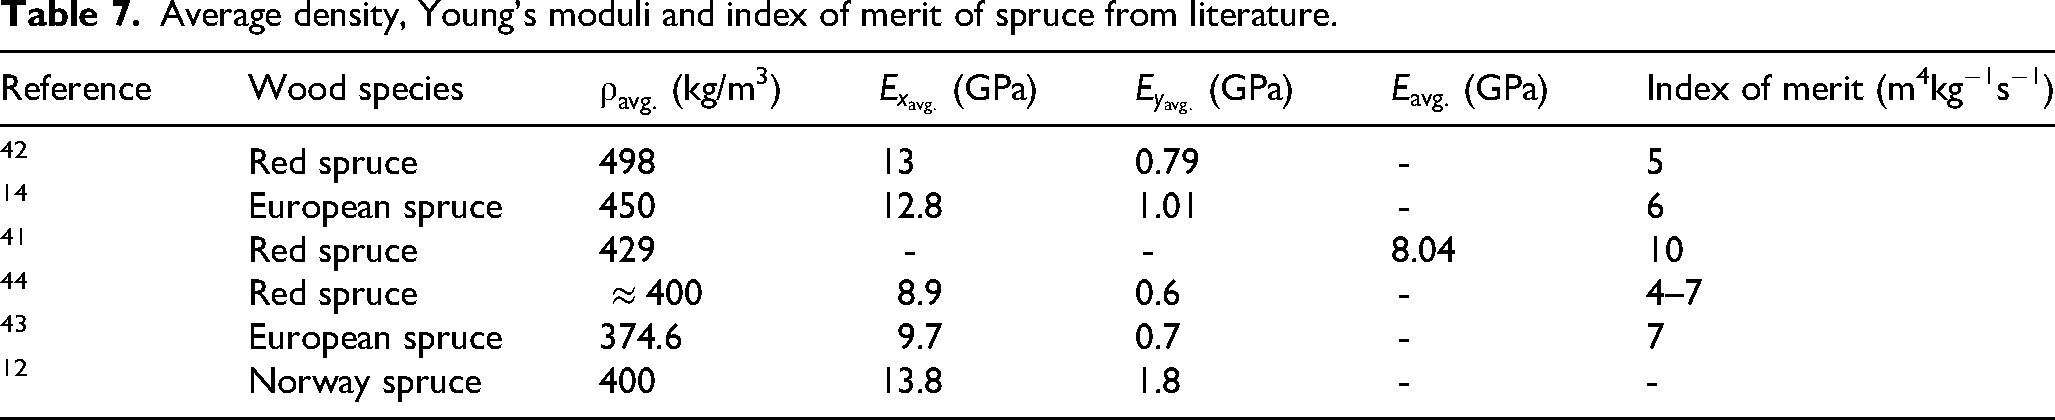
Table 8 provides a comparison between the average values of the mechanical properties measured on the soundboards and the literature's data in Table 7.
Soundboard's averaged density, Young's moduli, index of merit and structural loss factor.
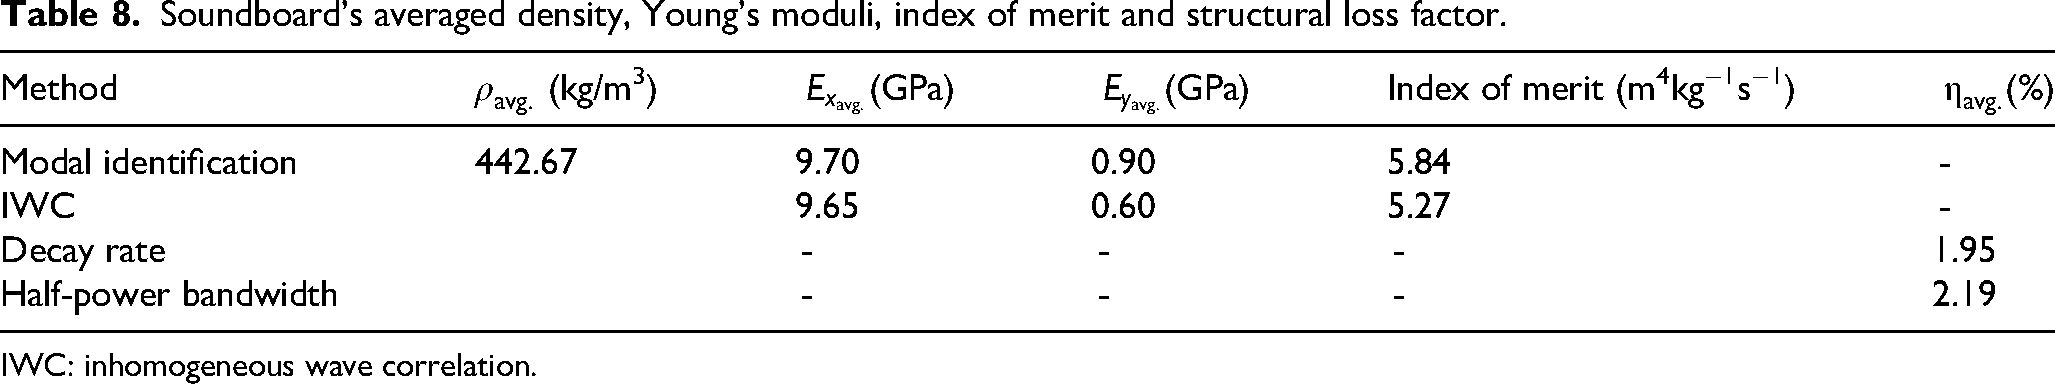
IWC: inhomogeneous wave correlation.
Extracting indicators using these determined values can be especially useful for ranking different wood plates or structures, like instrument-making soundboards. Bremaud
45
provides an exhaustive review of these different indicators. They are mostly based on a ratio of Young's modulus to density and may include the dissipative effect (in this case, the acoustic conversion efficiency). A well-known indicator is the radiation ratio R, expressed as 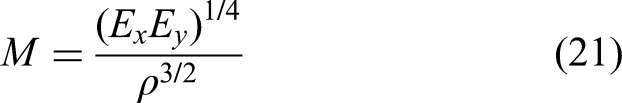
In practice, woods with higher values of M or R are deemed more suitable for soundboards.
Softwoods, mainly corresponding to spruces, tend to provide a favourable
We note that estimating the structural loss factor of wood for musical instruments up to 1 kHz is not a standard practice in the literature, making direct comparisons difficult. However, Young's modulus values and the identified orthotropic ratio (
Discussion
The various measurement methods have proven their effectiveness over different frequency ranges. The measurement results are also consistent with the literature.
The decay rate and driving-point mobility methods are straightforward to implement, requiring minimal equipment (an impact hammer and an accelerometer). Moreover, these tests are quick and can be completed in a single session. However, the driving-point mobility method does not allow Young's moduli to be determined in both x and y directions. This is a point to be explored for future work, such as considering a finite-difference scheme. The correction of the mobility due to the accelerometer mass is necessary if the measurement is done with this sensor.
The modal identification and IWC methods require larger and more costly equipment, primarily due to the vibrometer. The tests also take more time, and the postprocessing for the IWC method requires computing power.
The modal identification method yields consistent results with the IWC method, but the information on Young's moduli is no longer frequency-dependent. The results from the IWC method showed a variation on
The half-power bandwidth method provides a discrete evaluation of the structural loss factor values, since they are estimated at discrete frequencies. The test requires minimal equipment and straightforward postprocessing.
Some mechanical properties have not been explored in this work, like the shear modulus or Poisson's ratio. This investigation could be the subject of future work.
The advantage of these measurement methods is that some take into account the orthotropy of wood and are not limited by the sample size being measured. Moreover, the frequency dependence gives much more detailed information than standard methods. Therefore, they are adaptable to many areas where non-homogeneous or orthotropic materials are used, particularly when sample sizes are large and standard characterisation methods may not accurately represent the overall structure. Such fields might include construction or crafting music instruments, for example.
Footnotes
Acknowledgements
Andre Brunet and Ecole de Lutherie-Guitare Bruand (Longueuil, Canada) are warmly thanked for providing the soundboards used in this study. The authors also thank Elie Garot for experimenting and collecting data for the decay rate, half-power bandwidth, IWC and modal identification methods during his internship at the Centre de Recherche Acoustique-Signal-Humain.
Author contributions
KE worked on the driving point mobility method and the driving point mobility and mass correction sections. OR wrote the abstract and introduction sections and parts of the comparison with the literature data. They wrote the sections on the theoretical development of the methods. RJ rearranged the sections, helped on writing the results and discussion sections, added the tables, graphics and figures. He did the experimental work on the driving point mobility method. All the authors contributed to the drafting and correction of this manuscript.
Funding
The authors disclosed receipt of the following financial support for the research, authorship, and/or publication of this article: The support of the Canadian Foundation for Innovation/Fondation Canadienne pour l'Innovation (Grant 43420 - Fonds des leaders John-R.-Evans) is acknowledged for the acquisition of the multi-point vibrometer system. The support of the International Research Project Centre d’acoustique Jacques-Cartier, supported by the National Center for Scientific Research (CNRS, France) is also acknowledged. The authors thank the University of Sherbrooke for their financial support. Finally, this work was also supported by an NSERC Discovery Grant (RGPIN-2022-04907). The authors thank the International Research Project “Centre Acoustique Jacques Cartier”, Université de Sherbrooke and Natural Sciences and Engineering Research Council of Canada (NSERC) for their financial support.
Declaration of conflicting interests
The authors declared no potential conflicts of interest with respect to the research, authorship, and/or publication of this article.
Data availability
Data are available on request from the authors.