
Abstract
This study aimed to characterise two little-known woods and discuss their potential to replace those heavily exploited in Cameroon's forests. Amouk (Detarium macrocarpum) and Dabema (Piptadeniastrum africanum) were characterised for their physical and mechanical properties. Density, shrinkage, desorption kinetics, shear strength, tensile strength and modulus of elasticity (MOE) in compression and flexion were determined. A Weibull analysis was performed to predict their failure. It was found that Amouk and Dabéma can be classified as medium-heavy wood with low shrinkage and desorption, following Midilli's empirical model. The physical and mechanical characterisations show that the density, strength and MOE parameters of the woods are close to each other and enable them to be classified as medium-strength woods. The probability of failure in compression follows Weibull's law. These woods can, therefore, be used in structural applications such as construction, replacing common woods.
Introduction
In most Central African countries, and particularly in Cameroon, timber is a strategic resource for industrialisation 1 with a variety of species and more than 150 2 that could individually provide annual production of between 2.97 M m3 and more than 3 M m3 of logs 3 . According to the Food and Agriculture Organization of the United Nations, the forests of Central Africa cover an area of 200 million hectares, 3 making up the second-largest block of tropical forests on the planet 4 after the Amazon. 2 Cameroon is the second country in Central Africa with high timber potential, 5 with 22.5 M hectares of tropical forest. 6 It accounts for a large share of its formal production, with nearly 700,000 m3 of logs and a processing rate of almost 75% since 2016. 7 Sawn timber dominates this industrial production in Central Africa, representing 80% of industrial production by volume in 2015 7 and a transformation rate of around 70% since 2021. 2
However, the timber sector in Cameroon and Central Africa makes a significant contribution to national economies 8 but remains under-industrialised, 9 as it is limited to primary processing products. 8 Its contribution to gross domestic product and job creation 10 is not negligible; it has often increased from 3.5% in 1989 11 to 6.7% in 1995 and 12% in 2000. 10 It was estimated at 4% in 2016, with 9000 jobs created in logging and 6000 jobs in the timber industry. 7 According to ITTO in 2007, the second and third wood processing industries generate several activities and products that create jobs. 2 With this in mind, the Libreville meeting in June 2018, as part of the African Wood Forum, resulted in a strategy for local wood processing by 2030, highlighting 100% local primary processing and 50% local secondary and tertiary processing. 7 Despite the measures envisaged, these trends pose a severe problem for the industry, which remains focused on four key species, 2 Okoumé (Aucoumea klaineana) (36%), Sapelli (Entandrophragma cylindricum) (19%), Ayous (Triplochiton scleroxylon) (14%) and Tali (Erythrophleum suaveolens) (8%), which account for the bulk of large-scale production, estimated at around 70%, 12 and which are in danger of running out in the long term. 13
Other ‘promotional’ but ‘lesser-known’ wood species are still underused, with technological properties similar to those prized and sufficiently available in the forest. 14 Most of the wood species in the forests of Cameroon and other Central African countries suffer from insufficient knowledge of their technological properties, 13 which leads to the intensive exploitation of traditionally used species and, consequently, their scarcity on the market. Therefore, to diversify the wood species harvested, investigations into the technological properties of lesser-known species could provide a large database of wood species classified according to the similarity of their characteristics. Tropical wood users would therefore have the possibility of choosing among a wide range of available species from a group with similar structural performance. 15 It has been clearly demonstrated that the use of wood in engineering construction requires a good knowledge of its physical properties, such as moisture content, density, PSF, shrinkage and their mechanical properties, such as modulus of rupture (MOR) and longitudinal modulus of elasticity (MOE). 16 In addition, the technological properties of wood are linked to the species’ environment. 17 In Central Africa, and more specifically in Cameroon, Tshiamala-Tshibangu et al. 18 were able to characterise the second-grade woods Essia (Petersianthus macrocarpus) and Mubala (Pentaclethra macrophylla) through the determination of their physicochemical and mechanical properties, thus guiding their use as structural wood. Their study highlighted the silica content, anisotropic ratio, volume shrinkage coefficient, density and axial cohesion characteristics such as compression and bending. However, these results are still insufficient. Mvogo 19 uses non-destructive methods such as vibration MOE and MOR to group woods. Lissouk et al. 20 used multi-criteria analysis applied to glued laminated wood to obtain correlation coefficients that guided the different wood groupings. Nsouami et al. 21 showed that the mechanical behaviour of wood is strongly influenced by density. In addition, Nyobe et al., 13 using Monte Carlo simulations, studied the influence of the mechanical strength of tropical woods on the optimal choice criteria for these woods.
Therefore, the literature shows that the use of physical and mechanical properties to elucidate the properties and establish a classification of lesser-known woods from the Congo Basin has only been poorly investigated.
Amouk (Detarium macrocarpum) and Dabema (Piptadeniastrum africanum) from the forests of the South Cameroon Region were chosen for this study, based on their net volume, estimated at around 105.212 m3 and 761.686 m3, respectively, 7 and their availability in the forest. 22
This work aims to assess these woods’ physical and mechanical properties as the potential substitutes for the most widely used woods.
Methods
Collection and preparation of wood samples
Samples were taken at 1.30 m from the ground, corresponding to the average diameter measured at the breast height of the trees. The requirements recommended by the ASTM D 5536 23 were met in selecting four trees of each species, giving preference to those that did not present singularity defaults such as knots, epicormic shoots or grain slope. The minimum operating diameter (MOD) was calculated as a reference for selecting harvested trees according to the specific requirements of each species. By focusing on this methodology, sampling was more reliable, as described by researchers.24,25 The trees selected by the certified MOD for each species were closer to mature individuals regarding stem length, free woody generative base and average stand volume.
For each tree harvested, 1.50 m long logs were cut at the base of the trunk between 0% and 25% of the useful length of the stem. The logs were then quarter-sawned to make removing the sapwood easier and obtaining blocks of wood containing no heartwood. The various quarters were sawn into planks using a circular saw, dried, and planned to final dimensions of 1500 mm (length) × 200 mm (width) × 20 mm (thickness). Thirty samples per tree were taken from the resulting planks before any selective sorting, for a total of 240 samples for 120 samples per species, avoiding areas with surface irregularities, knots and grain slopes. They were then cut and measured following the standards recommendations.26,27 The sampling method, dimensions and shapes of the samples are shown in Figure 1.
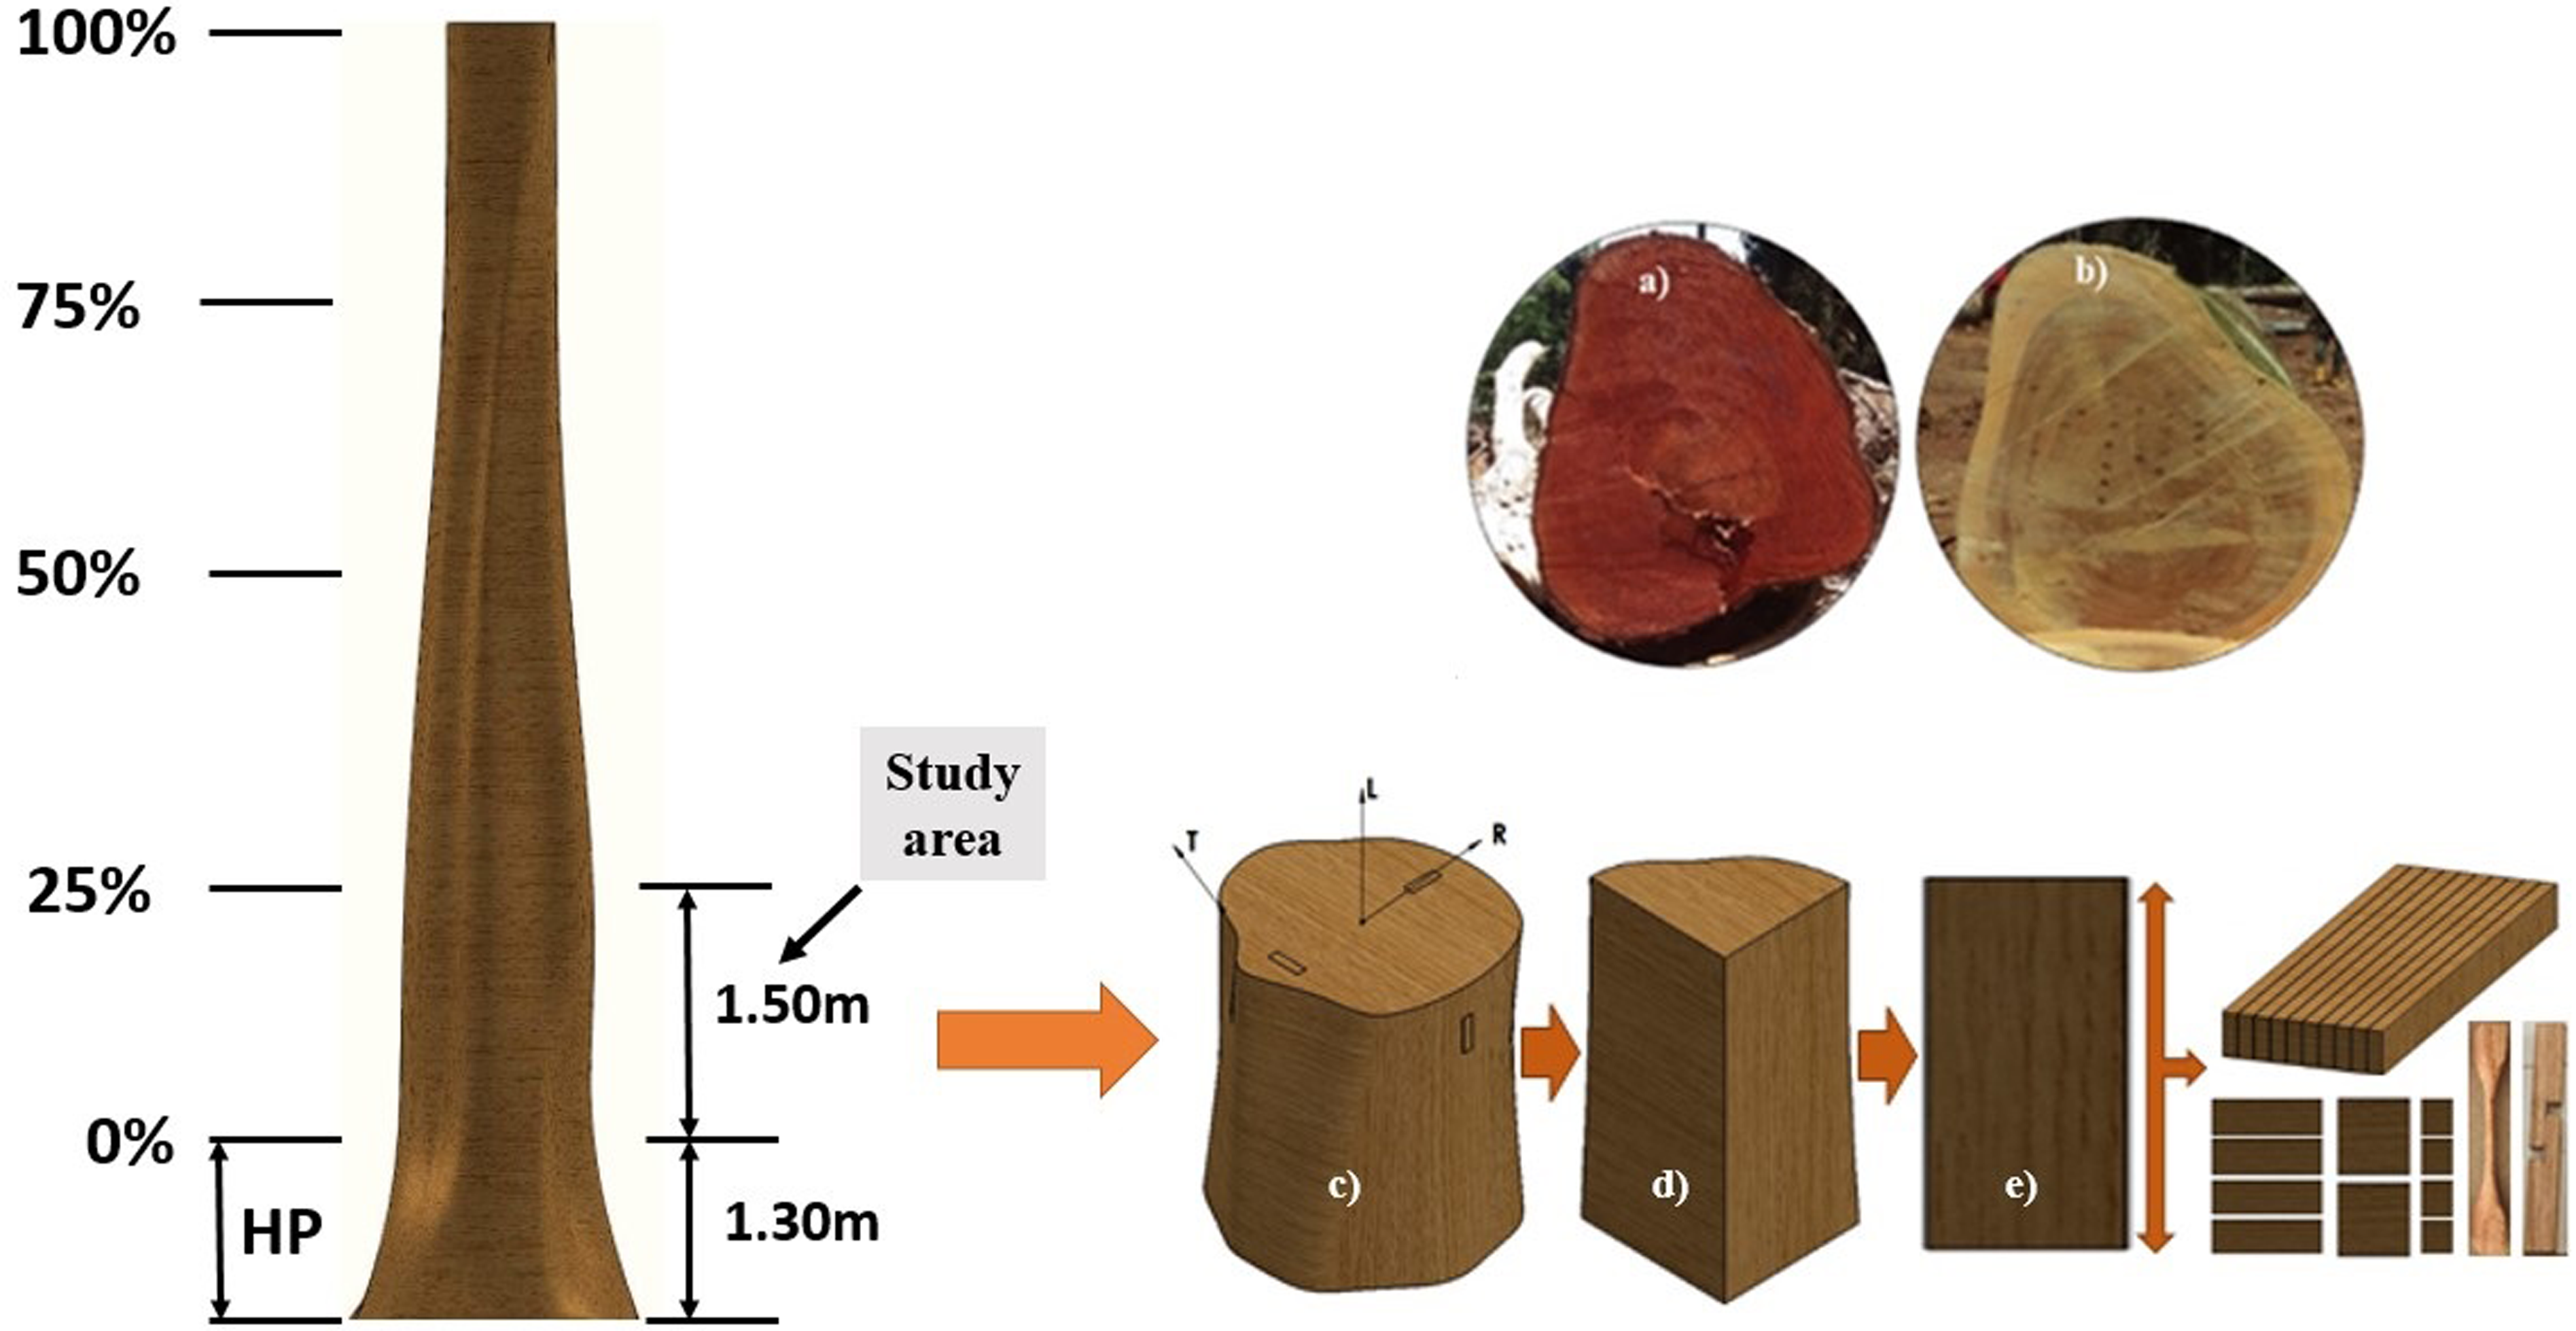
Sampling of the species studied: (a) Amouk (Detarium macrocarpum), (b) Dabema (Piptadeniastrum africanum), (c) log, (d) log quarter-lot, (e) board, (f) samples for physical and mechanical characterisation.
Physical characteristics
Moisture content
The moisture content, calculated using equation 1, was determined by oven drying at 103°C until there was no further weight loss.28,29 For this purpose, 20 samples of cubic shape with dimensions 20 × 20 × 20 mm3 were used.31,32

Densities
Densities were determined following the standard.
31
Two sets of 20 cubic samples measuring 20 × 20 × 20 mm3 were used by de Melo et al.
30
The volume of the samples was determined by measuring the specimens using a sensitive digital caliper with a resolution of 0.01 mm. The mass was then determined by weighing on a precision balance. Equation (2) was used to determine the wet density with the first set of samples.


Fibre saturation point
The FSP corresponds to the limit of moisture content at which the cell walls of the wood material no longer absorb water. 33 According to the literature, the moisture content at FSP varies from 22% to 44% and depends on the wood species. 28 The FSP was determined on 20 specimens of 50 × 50 × 10 mm3 ± 0.5 mm3 each. The specimens are those used to determine the various shrinkages, and the data collection method is the same as the one described for the shrinkage calculation. During the drying phase, radial and tangential measurements were taken at regular intervals to plot shrinkage curves as a function of moisture content R = f (H), corresponding to FSP. 28
Shrinkage
Shrinkage was measured per the standard.
34
Twenty samples measuring 50 × 50 × 10 mm3 ± 0.5 mm3 were used by de Melo et al.
30
The samples were immersed in distilled water until the fibres were saturated. The dimensions (RS and TS) in the radial (R) and tangential (T) directions were measured using a caliper. The samples were air-dried, and then oven-dried by slowly increasing the temperature to 103 ± 2°C. The consistency of the mass after 24 h indicates the anhydrous state in which the dimensions R0 and T0 were measured. The total shrinkage and shrinkage coefficients RR and RT; rR and rT in the radial and tangential directions were determined using equation (5). During the drying phase, radial and tangential dimensions were taken regularly.

For volumetric shrinkage, the volume of the saturated sample VS after immersion in distilled water was determined. The sample was air-dried and then oven-dried to an anhydrous state to determine the volume V0. The total volume shrinkage RV and the volume shrinkage coefficient rv are determined by equation (6). 35

Desorption kinetics
Desorption kinetics were determined by an empirical experimental approach
36
on 40 samples of dimensions 50 × 50 × 10 mm3. The ambient temperature of the laboratory varied between 25°C and 28°C and that of the Memmert oven model UF110 was set at 103°C.
37
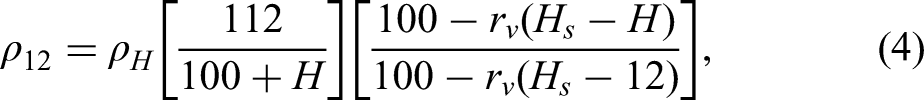
The desorbed moisture content W (%) over a period of time (t) was determined by equation (7).

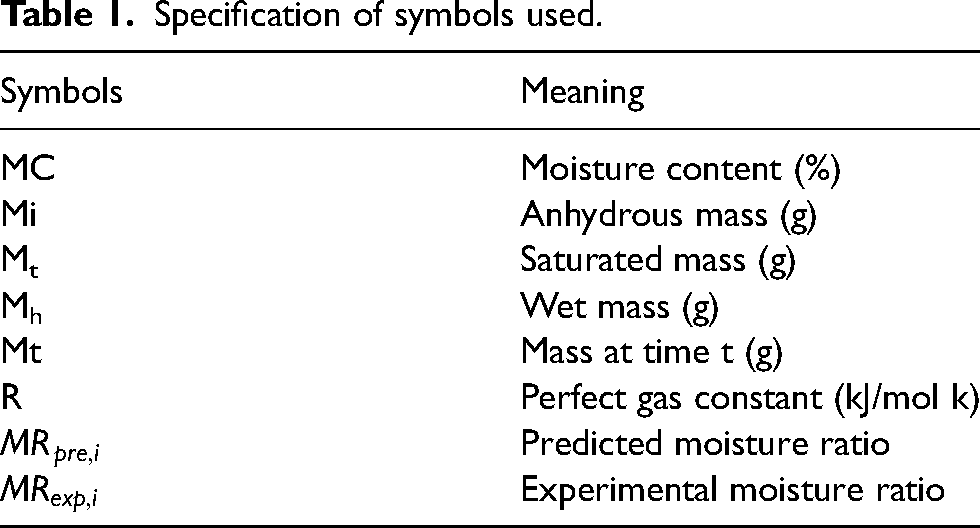
Specification of symbols used.
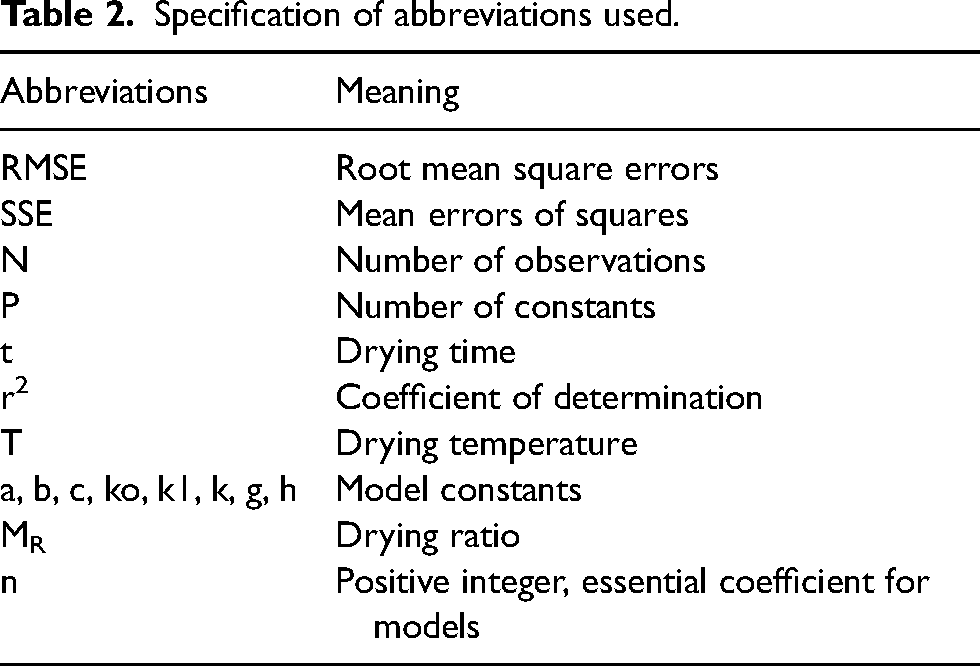
Specification of abbreviations used.
The experiments made it possible to determine the desorbed water content of the species studied and the corresponding desorption curves using the steaming method following the standard.
38
This method involves soaking wood samples in distilled water for a long period until the mass stabilises after three successive weighs. They were then removed and weighed using a 0.001 g precision digital balance to obtain the masses (Mt) at the time (t) before being introduced into the oven. After getting the initial masses (Mh), they were introduced into a Memmert UF110 oven with a precision of ±5°C set at a temperature of 103°C.
39
The samples were reweighed at 15-min intervals until the mass was constant. One of the control samples was taken and weighed at a reduced time to determine the wet mass at the time (t). This sample's dry mass (mo) was then measured after obtaining a current mass for the defined time (t). The desorption ratio (MR) is determined from the mass at time Mt, the wet mass Mh and the mass of the material in the anhydrous state Mi according to equation (8).
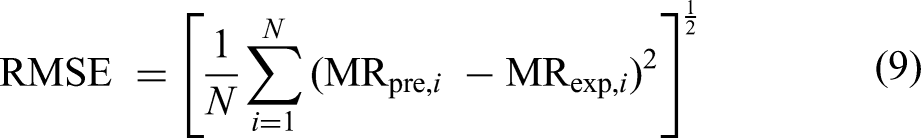
Mathematical models tested.
Mechanical characterisation
Axial compression test
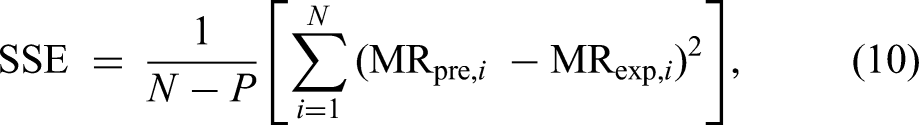
The axial compression test was carried out using an M&O universal machine (Figure 2) with calibrated dynamometric rings with a capacity of 30 kN.
42
Twenty samples measuring 20 × 20 × 60 mm3 were used to carry out a test according to the standard
40
described and used by de Melo et al.
30
It consists of positioning sample 11 between supports 4 and activating handwheel 7 until the sample breaks (Figure 2(a)). The stress at break σCH and MOE ECH were determined by equations (11) and (12). Then, equations (13) and (14) were used to calculate the failure stress (σC12) and MOE (EC12) at 12% mc from σCH and ECH.
32


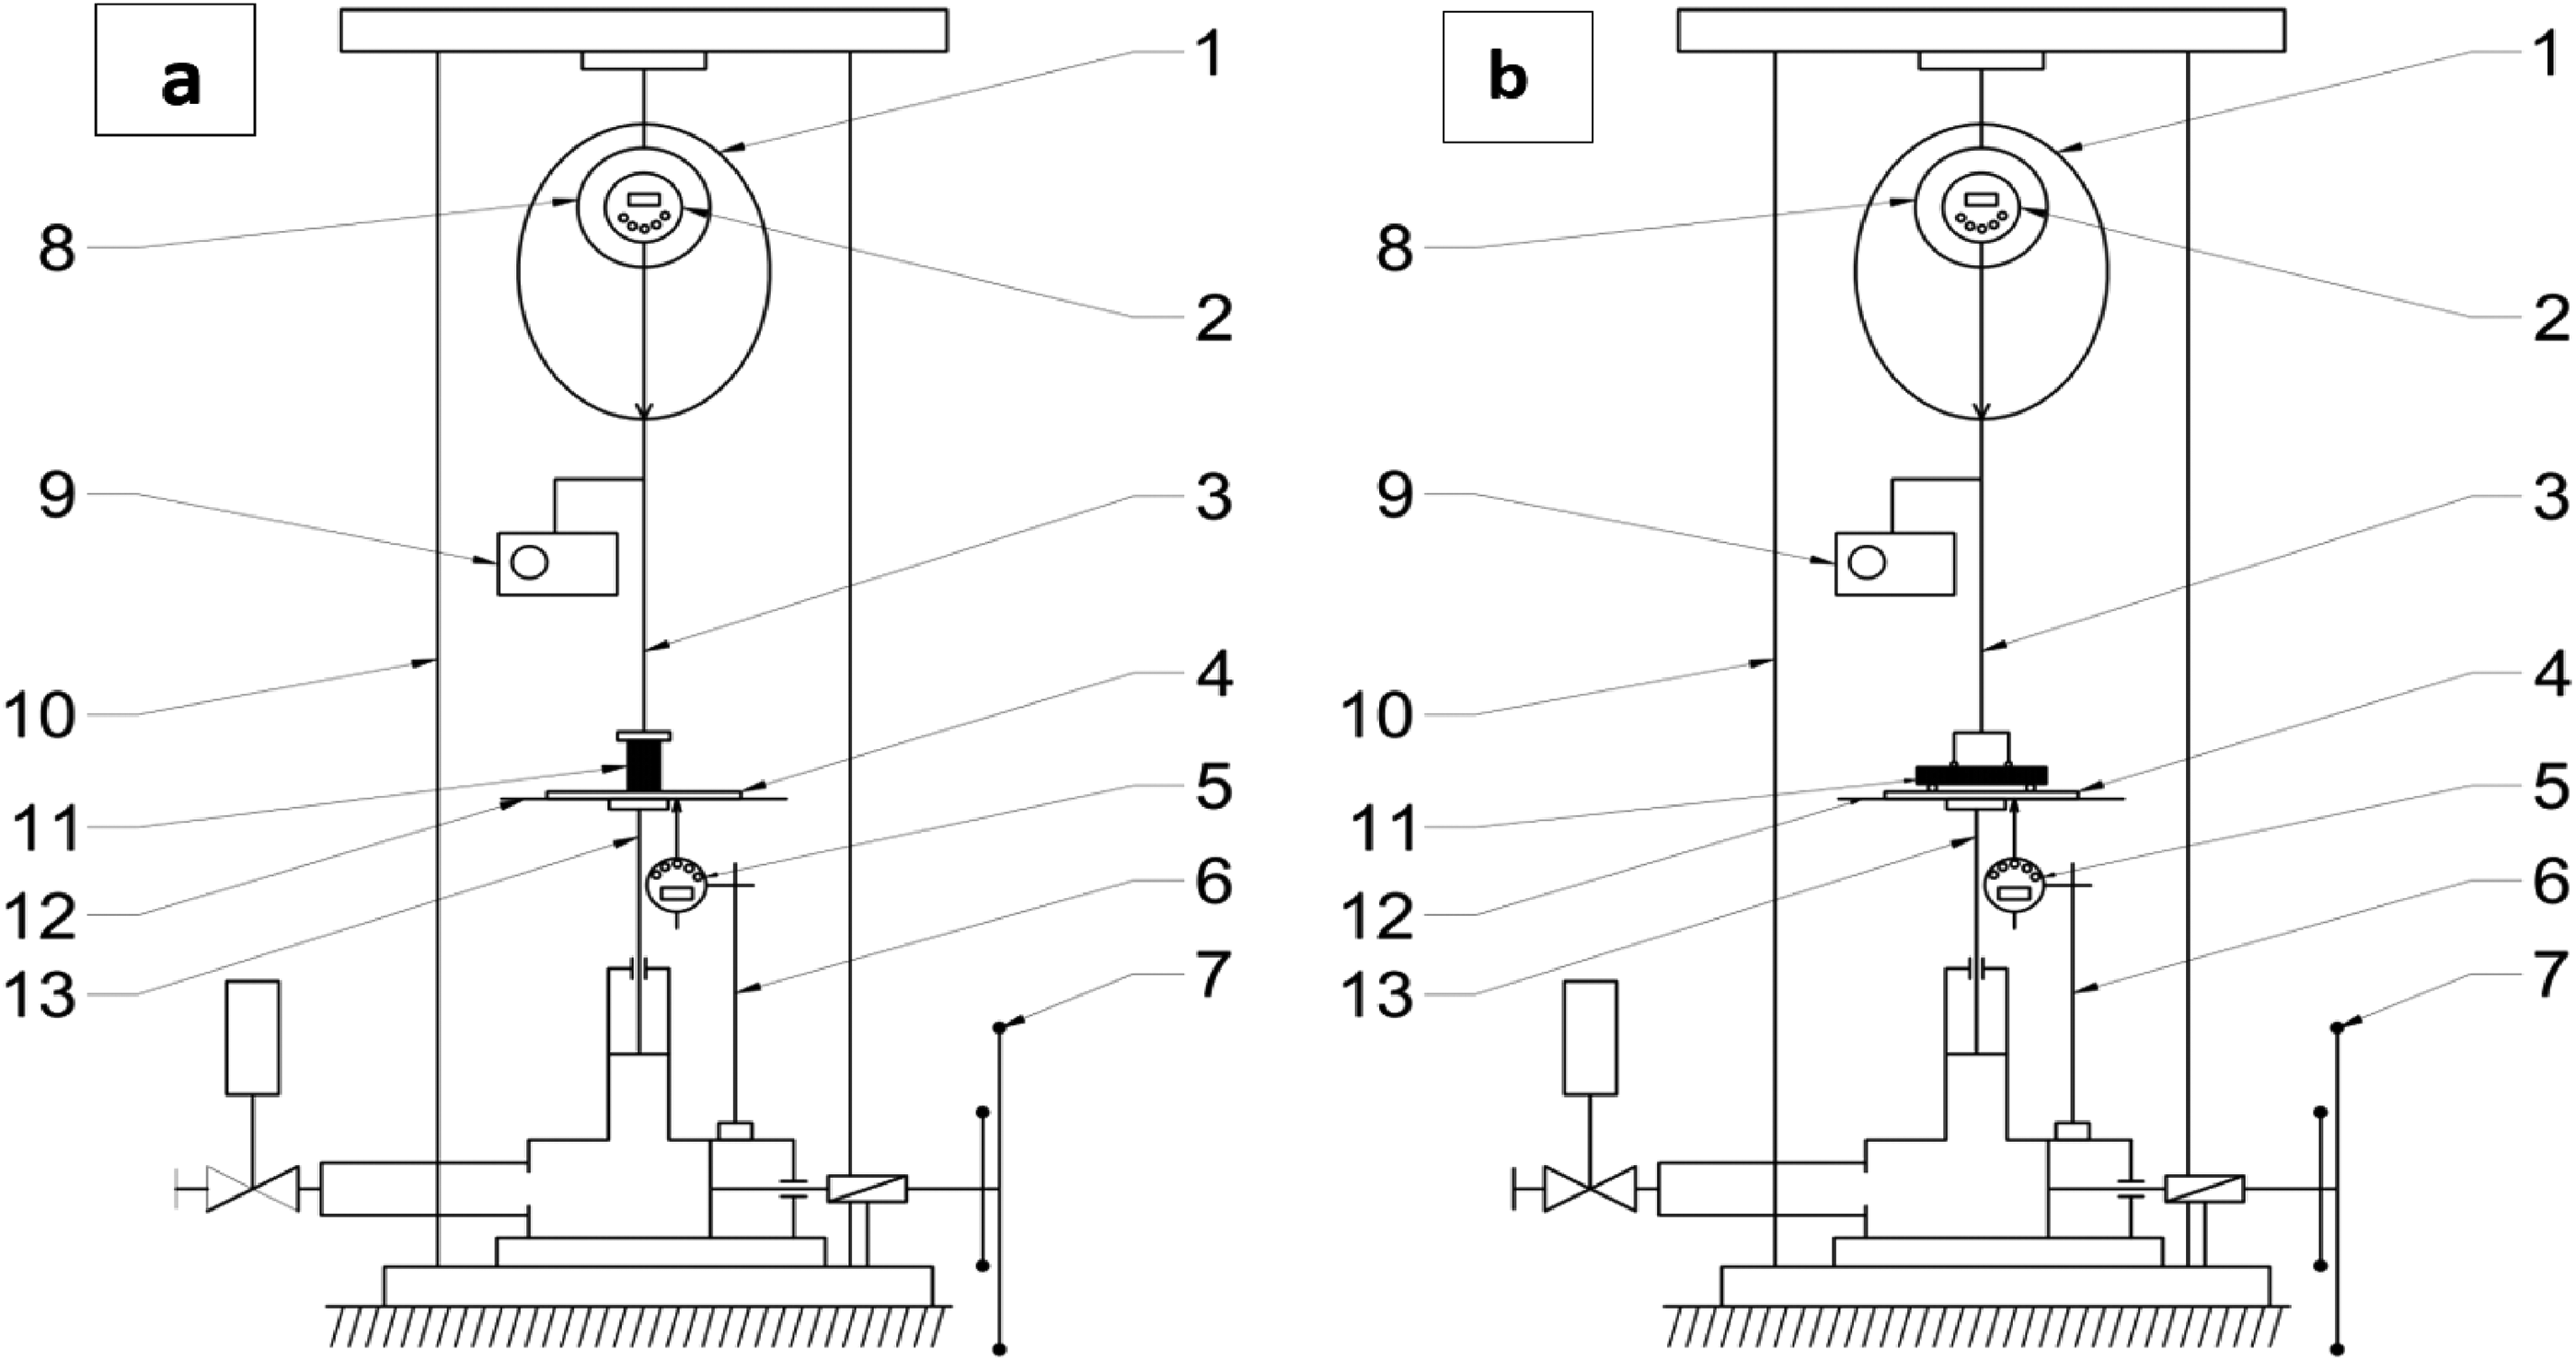
Diagram of the compression (a) and bending (b) test. 42
Static three-point bending test
The three-point bending test and the samples were carried out following the standard
41
used by Ndapeu et al.
42
Twenty specimens
31
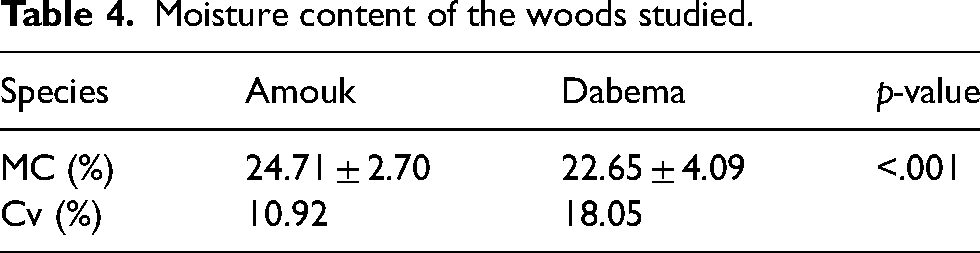
of dimensions 20 × 20 × 360 mm3 were tested on a universal tensile testing machine (Figure 2(b)), the principle of which has been described previously. The ultimate tensile stress σfH is determined by equation (15); and then the apparent MOE EfH is determined from the force (P) and strain (f) curves in equation (16). The breaking stress σf12 and the MOE Ef12 at 12% moisture content are deduced from σfH and EfH by equations (17) and (18).


Tensile strength test
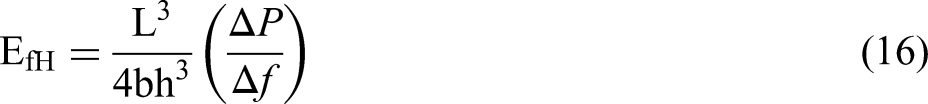
Tensile strength was determined using 20 dog-bone-shaped specimens
31
of dimensions 20 × 20 × 150 mm3 each (Figure 3(a)) as defined by ASTM D143-94.
26
The load is applied progressively until the specimen breaks (Figures 3(b), (c) and (d)). The value of the tensile stress at failure σth is given by equation (19), which is the ratio between the maximum load (P) and the most loaded section (S) of the specimen, while the failure stress at 12% mc σt12 is deduced from σth by equation (20).

Tensile procedure: (a) tensile specimens, (b) schematic principle of the longitudinal tensile test, (c) specimen before testing and (d) specimen after testing.
Where σtH is the tensile strength, 42 σt12 is the tensile strength at 12% moisture, C is the tensile strength correction coefficient and H is the moisture, in percent, corresponding to the FSP.
Longitudinal shear test
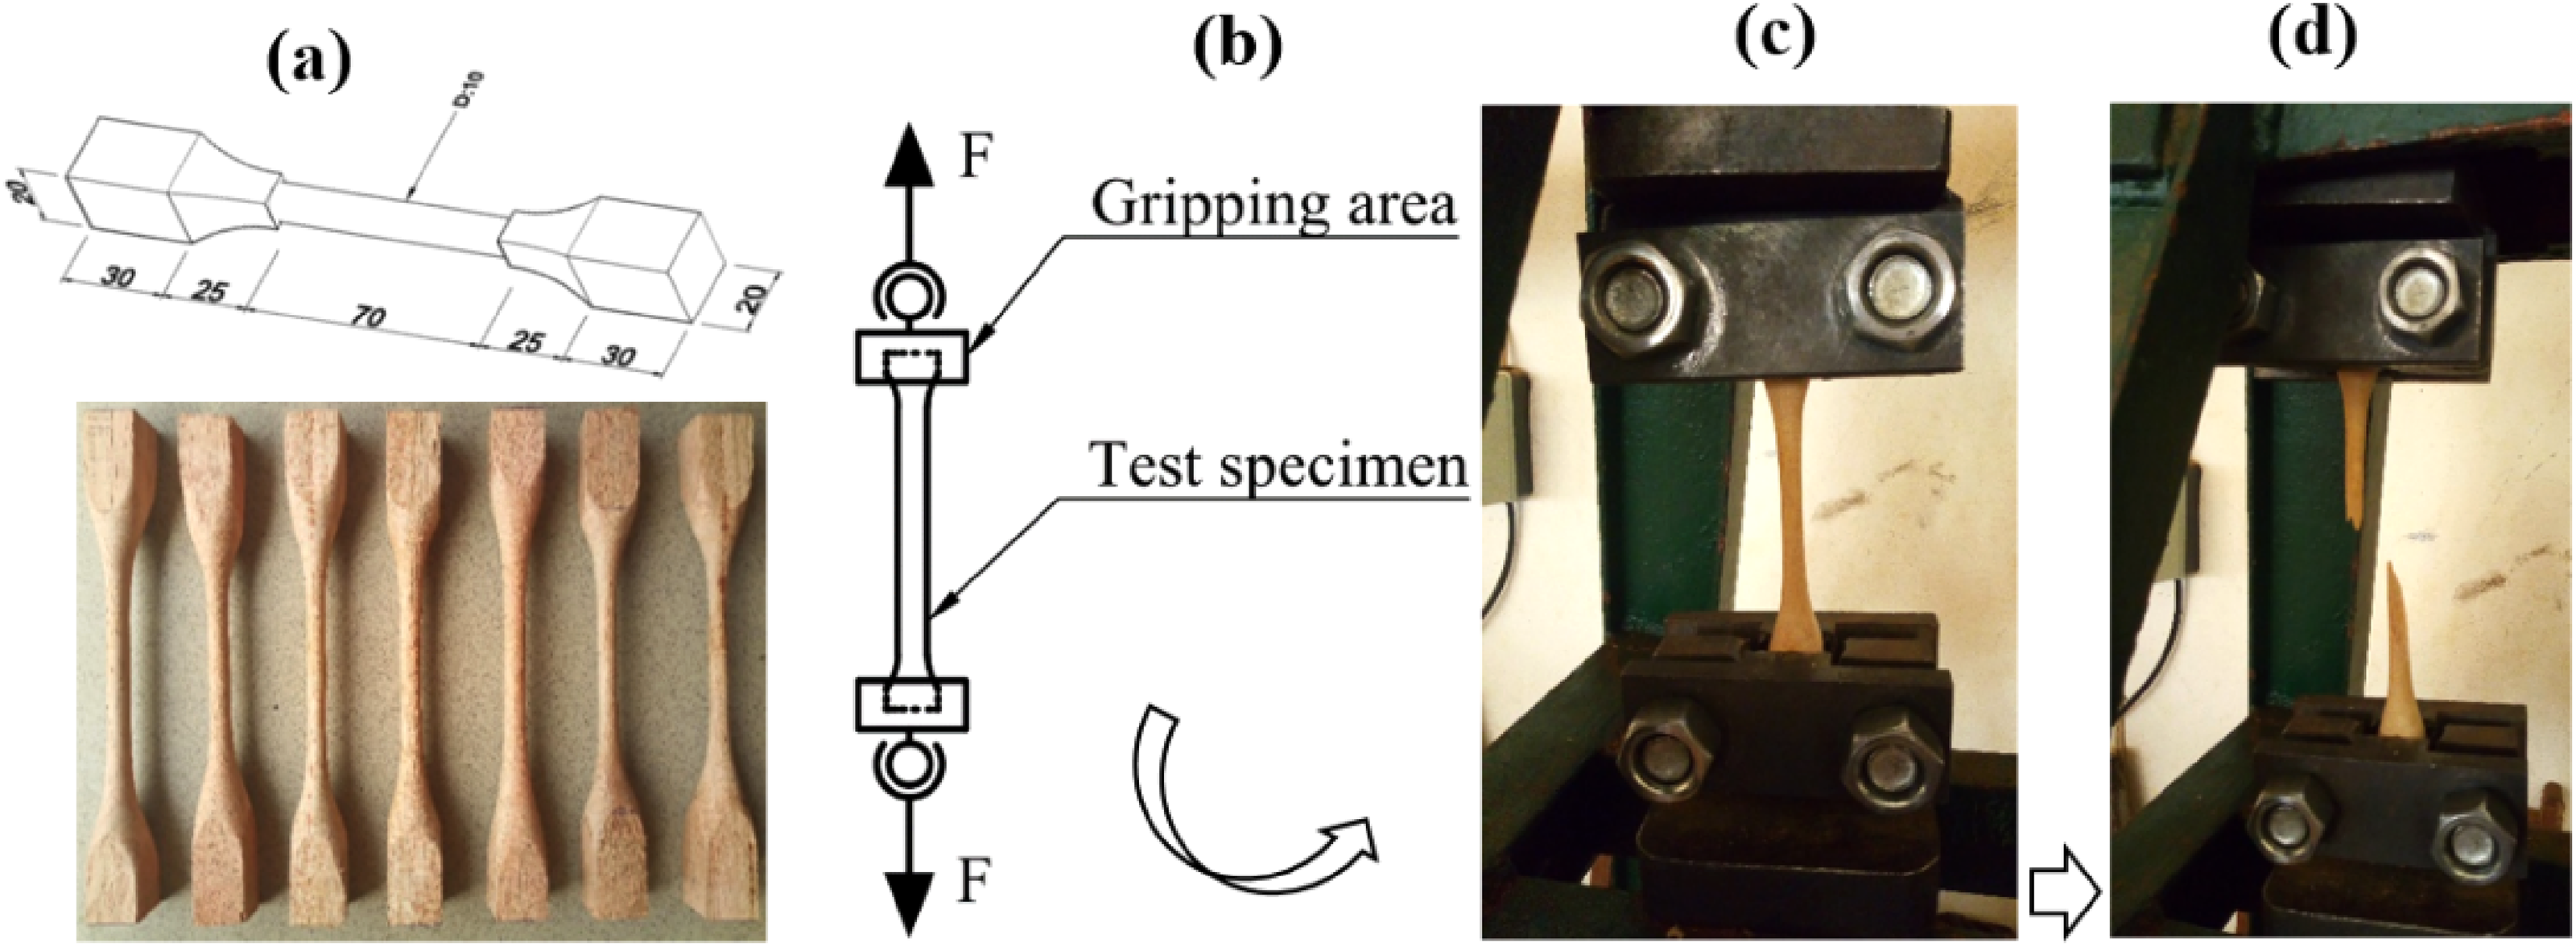
The shear test was performed on prismatic specimens (Figure 4(a)), complying with the standard 43 as described by Saoud et al. 44 Twenty specimens were tested, and the forces were applied until failure (Figure 4(d), (c) and (d)). The shear stress γH of moisture H was determined using equation (21).
Shear test procedure: (a) shear specimens, (b) shear principle diagram, (c) specimen before testing and (d) specimen after testing.
The shear stress at 12% mc γH12 is deduced from γH by equation (22).

Weibull analysis
Weibull analysis is highly appreciated when a considerable scatter in test results is observed.
45
It predicts microstructural causes and the probability of material failure and survival.
46
The two-parameter Weibull statistical distribution has the advantage of being expressed as a function
47
that describes the failure probability of tropical woods with high accuracy.
48
The density function of the two-parameter Weibull distribution is given by equation 23.
49
The cumulative probability of failure is obtained by equation (24) integrating the density function.
50


The probability of rupture (equation 26)
Results and discussion
Physical properties
Moisture content
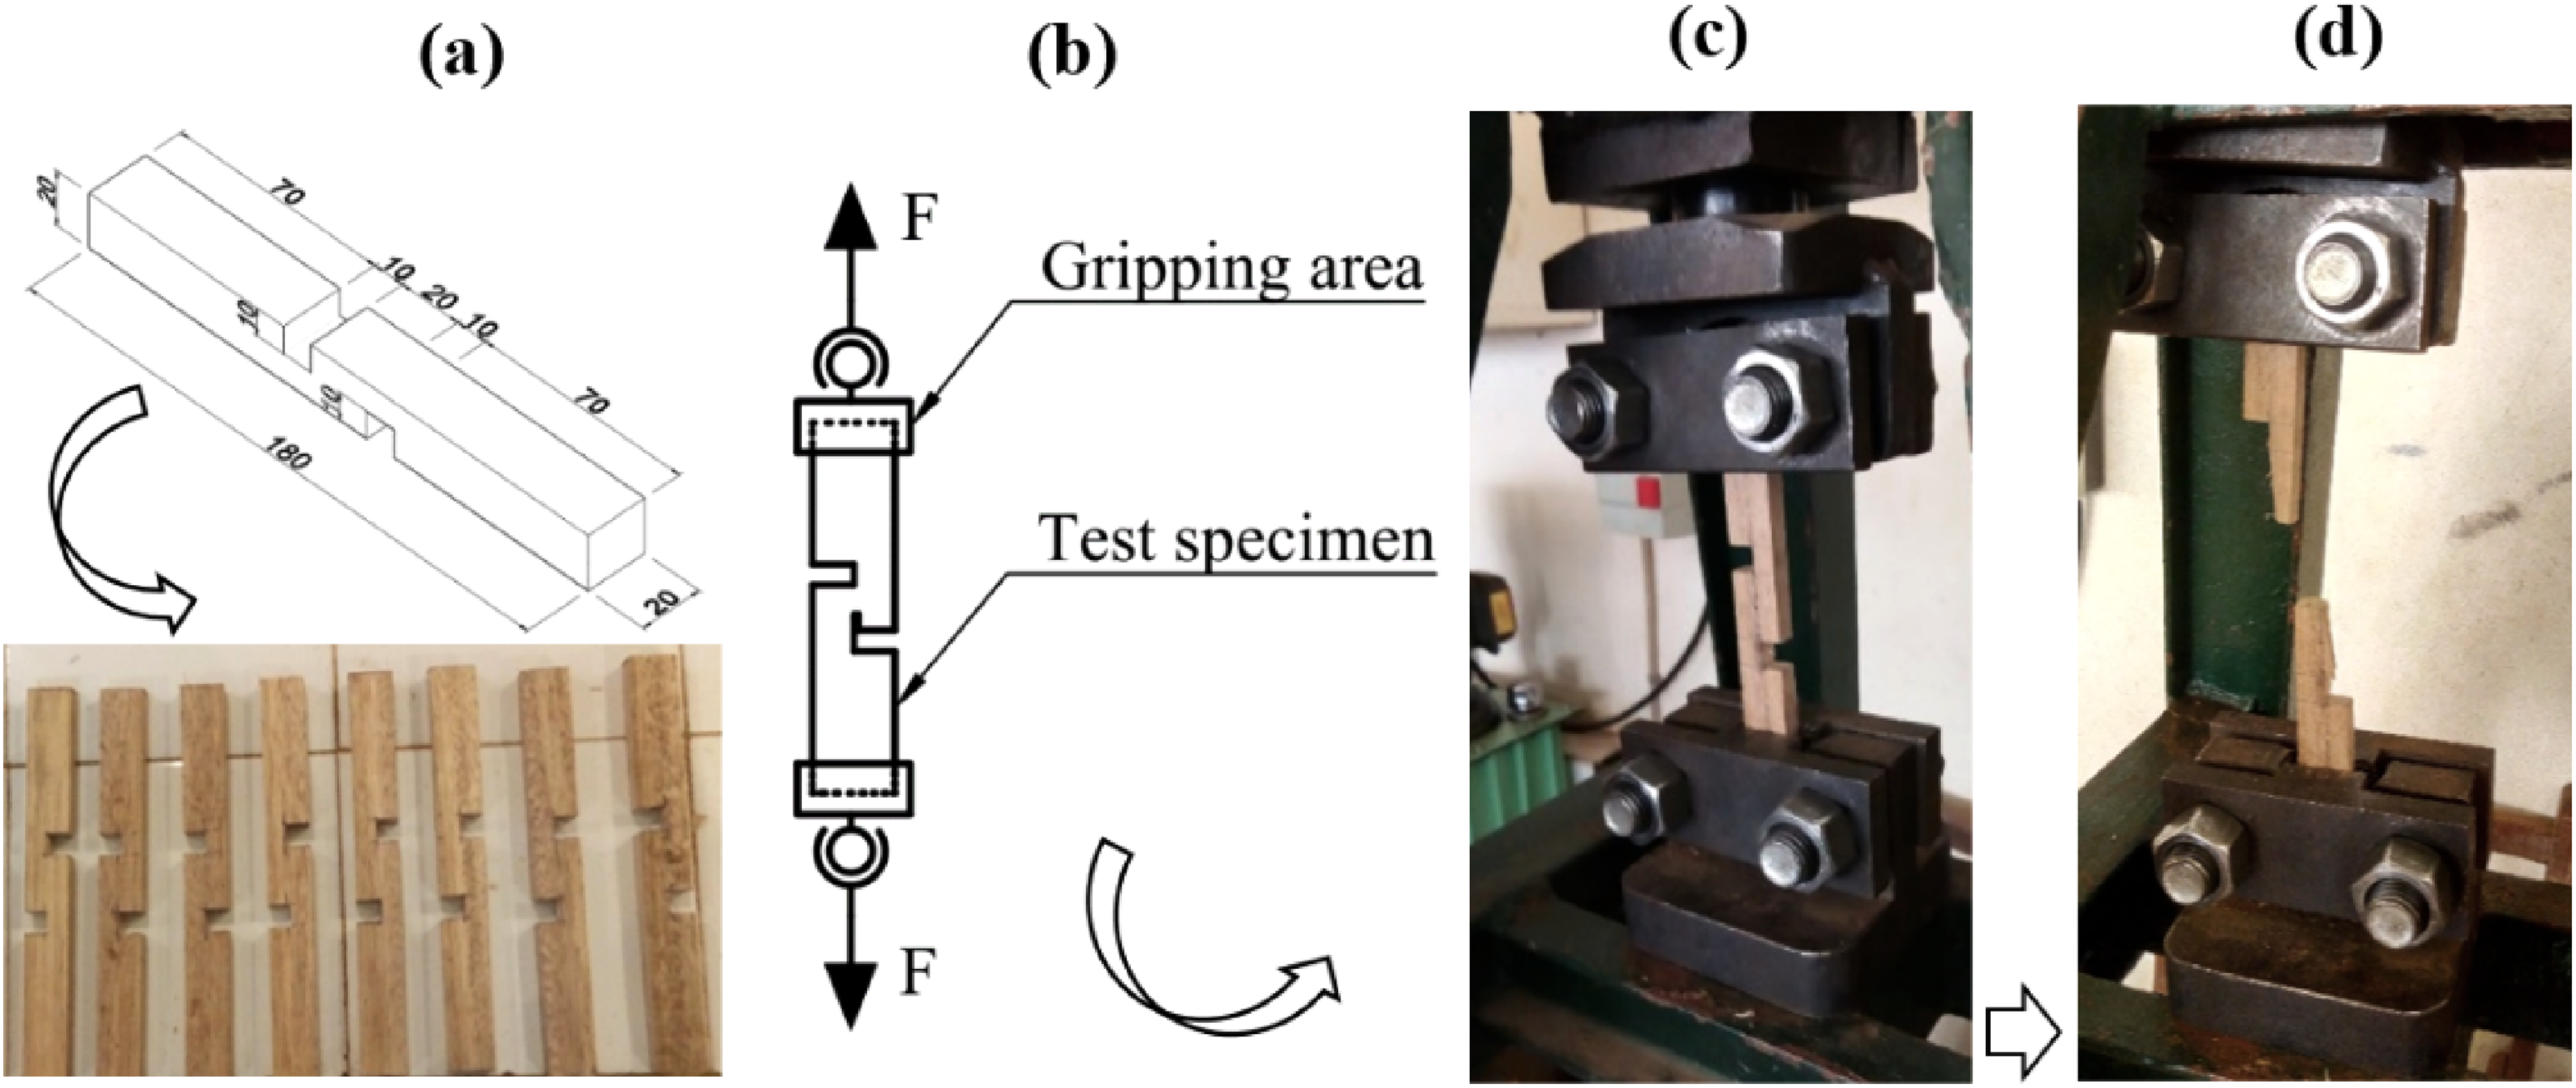
Moisture content (mc) is a critical characteristic for determining the properties of tropical woods. Table 4 shows that the moisture content of the Amouk wood (24.71 ± 2.70) was significantly higher than that of Dabema (22.65 ± 4.09). Indeed, the difference in variation estimated at 2.06% found for these two woods could be justified by the very slow water loss from this wood during air drying due to its sap's very sticky and viscous nature. According to the literature, the results align with the French standard principles, 29 which recommends moisture contents below the FSP (25–30%) for testing clear and flawless wood specimens. 54
Moisture content of the woods studied.
Densities
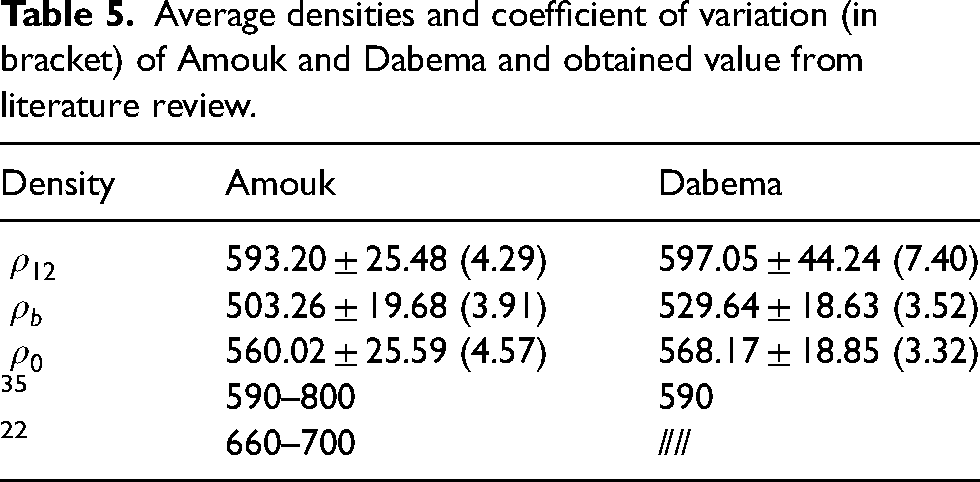
Table 5 shows the results indicate no significant difference in density between the two studied wood species (p-value = .925). In addition, the small variations of around 1%, 2% and 5% for the density average ρ12, ρo and ρb, respectively, of the species studied (Amouk and Dabema) also show that there is no difference between the two woods. these results are close to previous studies made by Gérard et al. 35 and Tropix7 cirad. 55 These results suggest that the species studied wood can be considered to be of average resistance and, therefore, can be used in construction engineering, flooring, and joinery, as suggested by several authors.13,19,55–57
Average densities and coefficient of variation (in bracket) of Amouk and Dabema and obtained value from literature review.
Fibre saturation point
The hygroscopic behaviour of the species studied is shown in Figure 5. Water diffusion of the species studied took place in two phases: a rapid absorption phase (Phase 1) up to (FSP) and a stabilisation phase (Phase 2). The average (FSP) values obtained were 24.1% for Amouk and 26.7% for Dabema. These values are close to those reported in the literature (24% and 27%, respectively),35,55 with a marginal difference of around 1% compared to those reported by Gérard et al. 35 and Tropix7 Cirad. 55
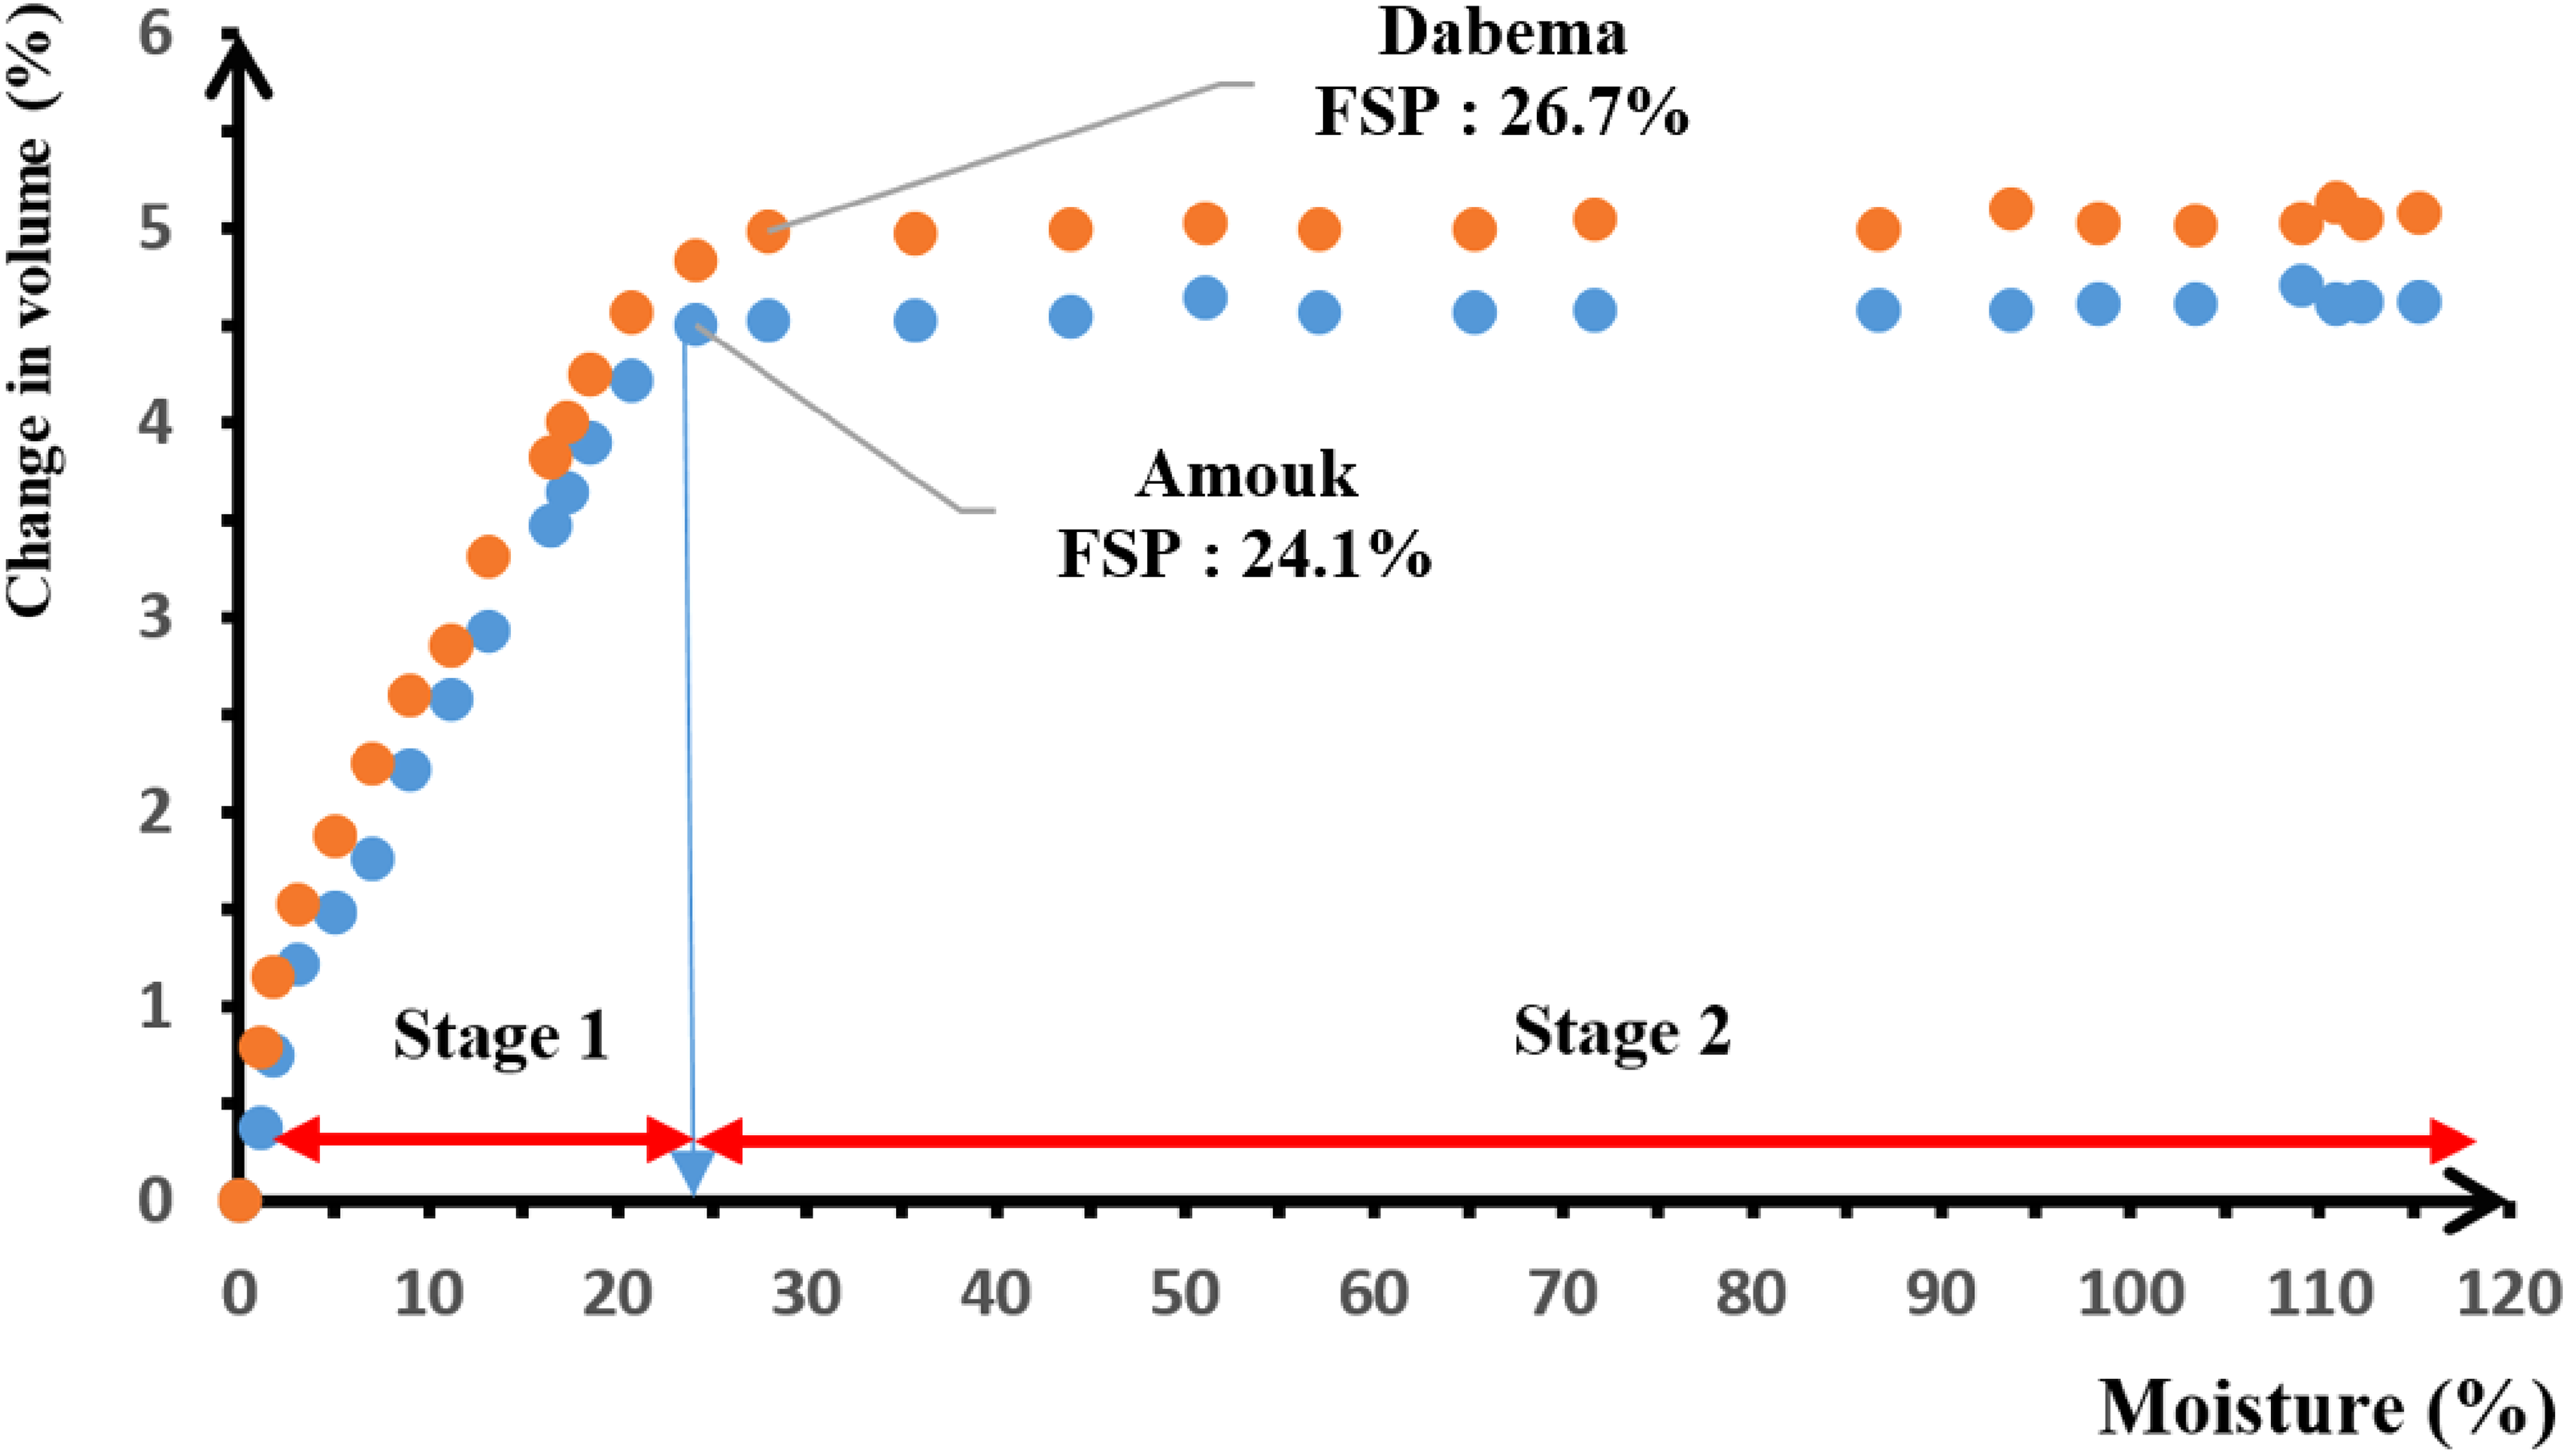
Shrinkage curves as a function of moisture content.
Shrinkage and shrinkage coefficients
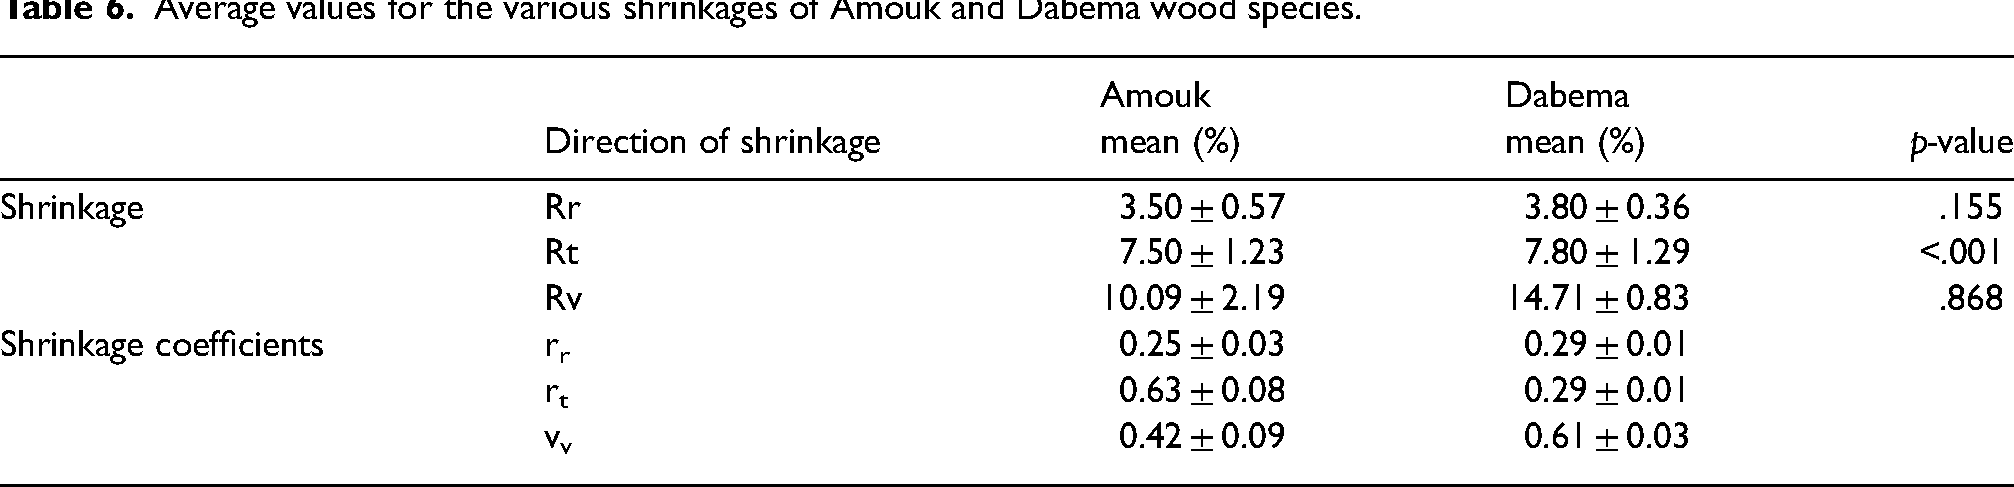
The shrinkage tests indicate no significant difference between the species studied for radial and volume shrinkage, except for tangential shrinkage where this is noticeable (Table 6). It can be seen that both species have very low radial shrinkage, but deformations underwater load in the radial direction will be less significant. According to these results and certain authors these wood species could qualify as medium-shrinkage species.55,58 It is also important to note that the very low values of shrinkage coefficients in the radial direction obtained (0.25 ± 0.03 and 0.29 ± 0.01, respectively, for Amouk and Dabema) could be described as homogeneous and dimensionally stable species.35,55 Based on these results, the studied species could be recommended for work in which dimensional changes are less significant, such as interior joinery, flooring, panelling and heavy structural work (e.g., heavy frames, staircases, bonded laminates, vehicle or container bottoms).
Average values for the various shrinkages of Amouk and Dabema wood species.
Desorption kinetics
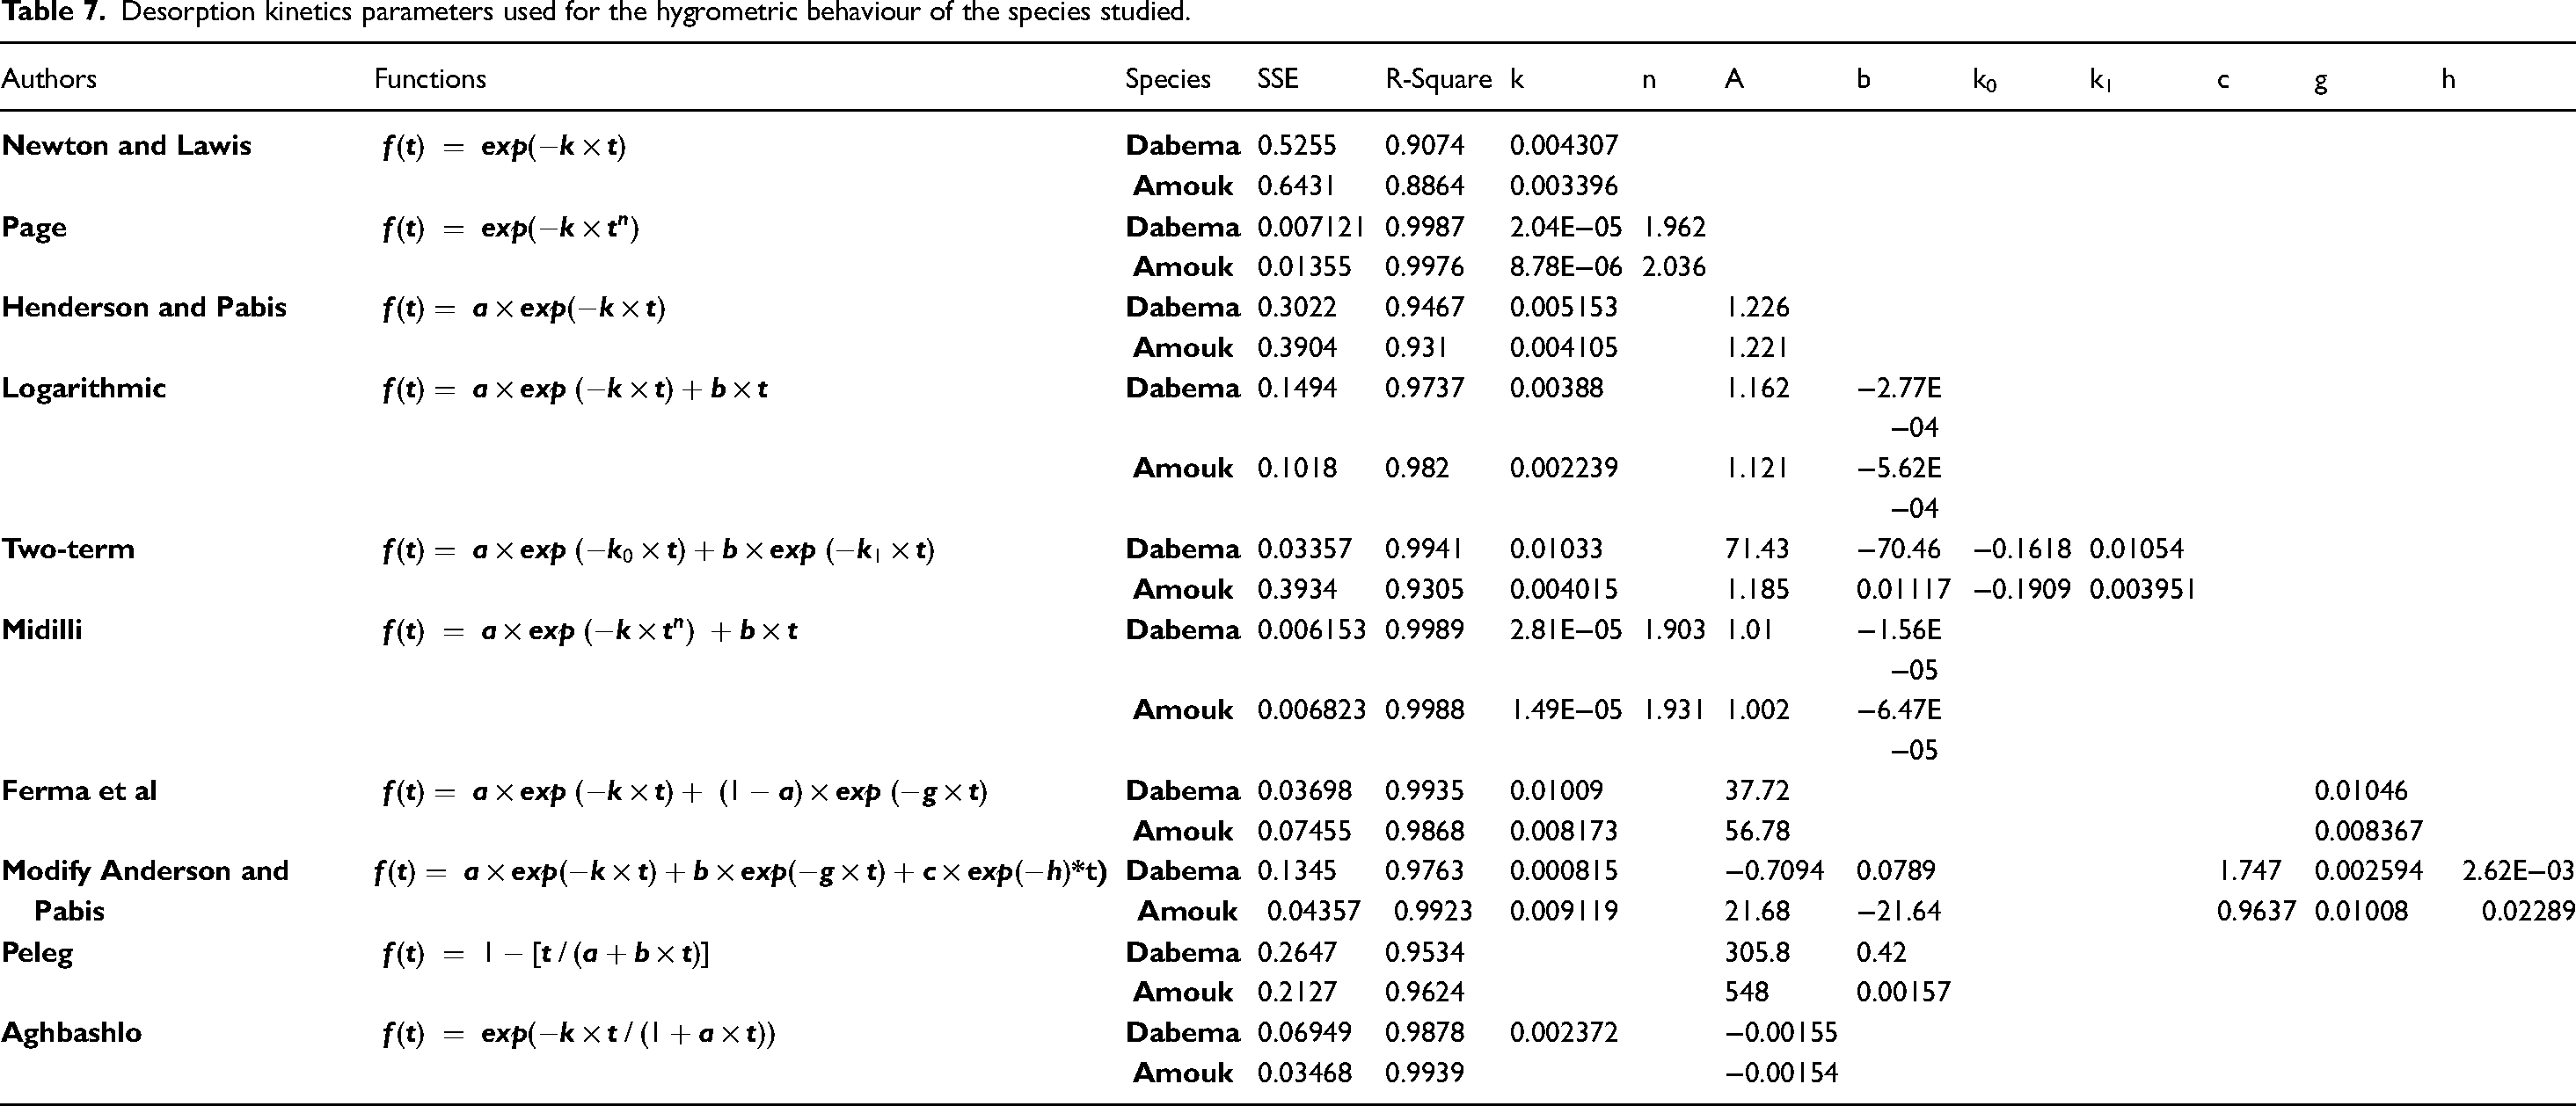
The results for desorbed moisture content showed that Amouk (123.55 ± 9.73) wood loses more and significantly water (p-value˂ .001) due to its higher desorbed moisture content than Dabema (90.64 ± 6.14) as found elsewhere by others authors. 59 It was found the mass of Amouk wood takes longer to stabilise at around 600 min (Figures 6(a) and 7) while the mass of Dabema wood stabilises at around 450 min (Figures 6(b) and 7). It was found that the modelling of desorption kinetics as a function of time for the single temperature of 103°C for the species studied was similar. At the start of the process, we also observed rapid drying, which is not new as it is well-known from the work of other authors.60,61 Table 7 shows that Midilli's model (f (t) = a × exp (−k × tn) + b × t) tested using Matlab software shows the best correlation for both woods. It could, therefore, be chosen as the reference model that best predicts the moisture behaviour of the species studied during drying.
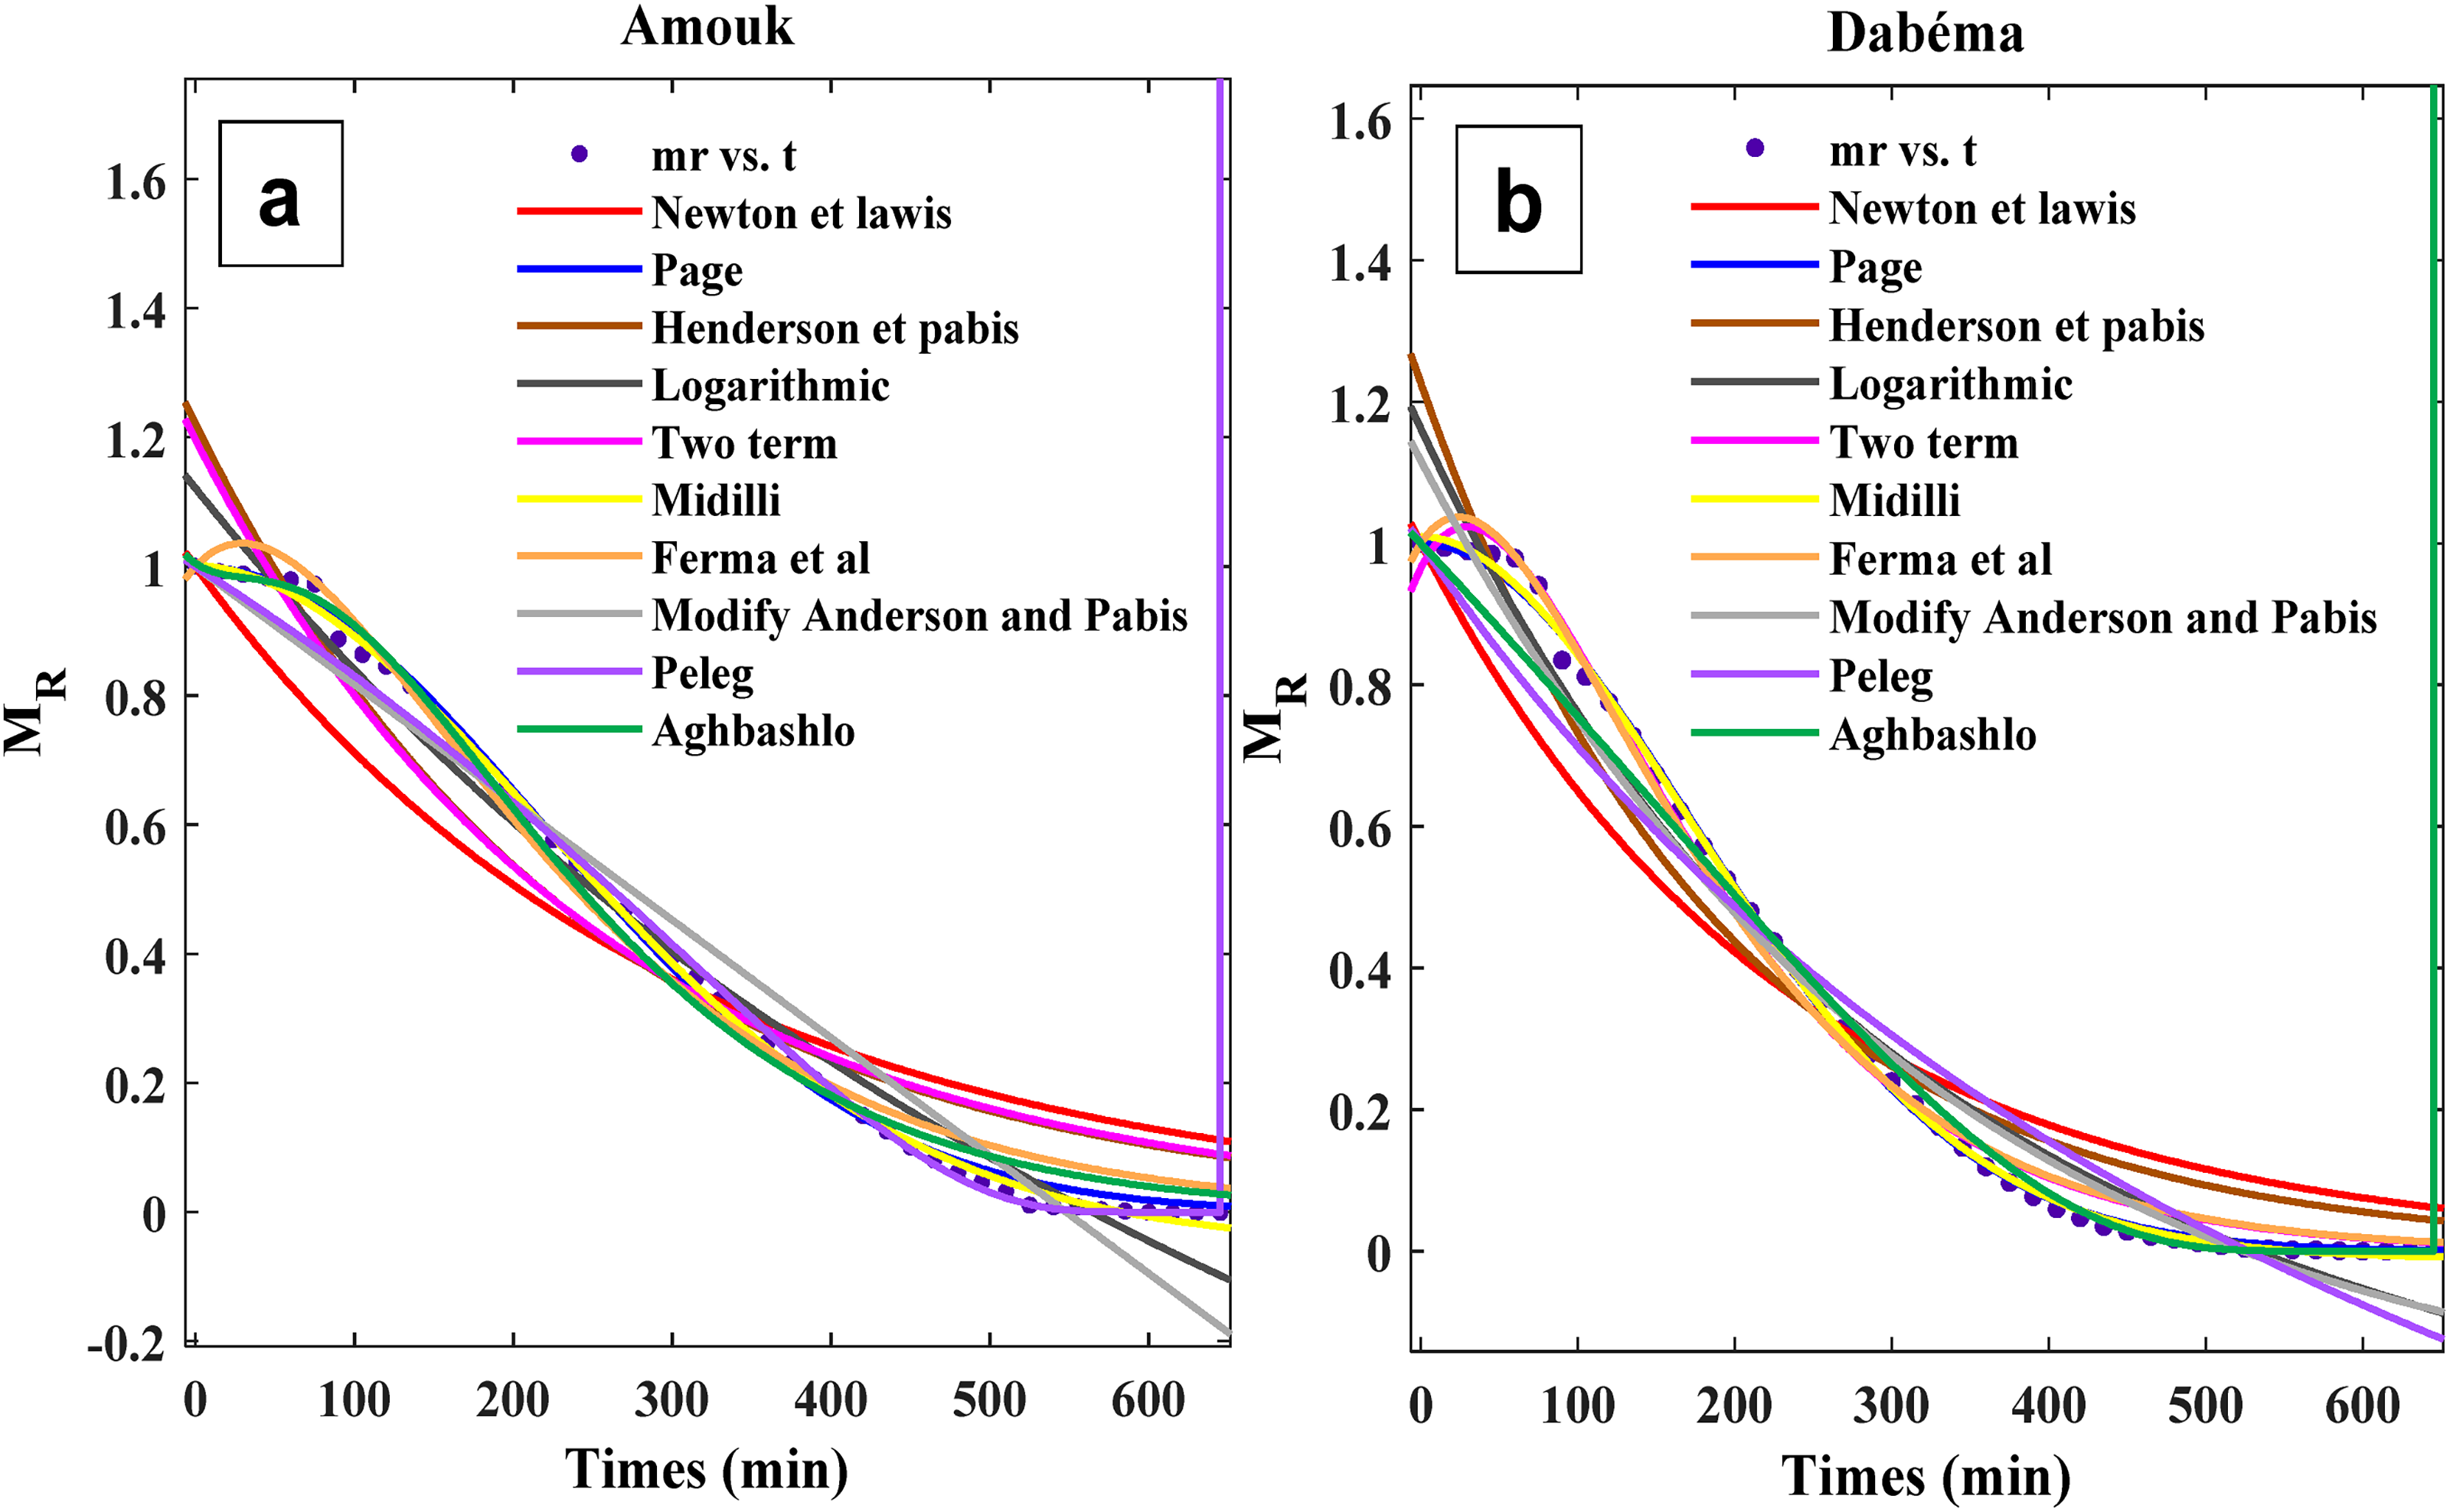
Modelling of wood desorption kinetics, (a) Amouk and (b) Dabema.
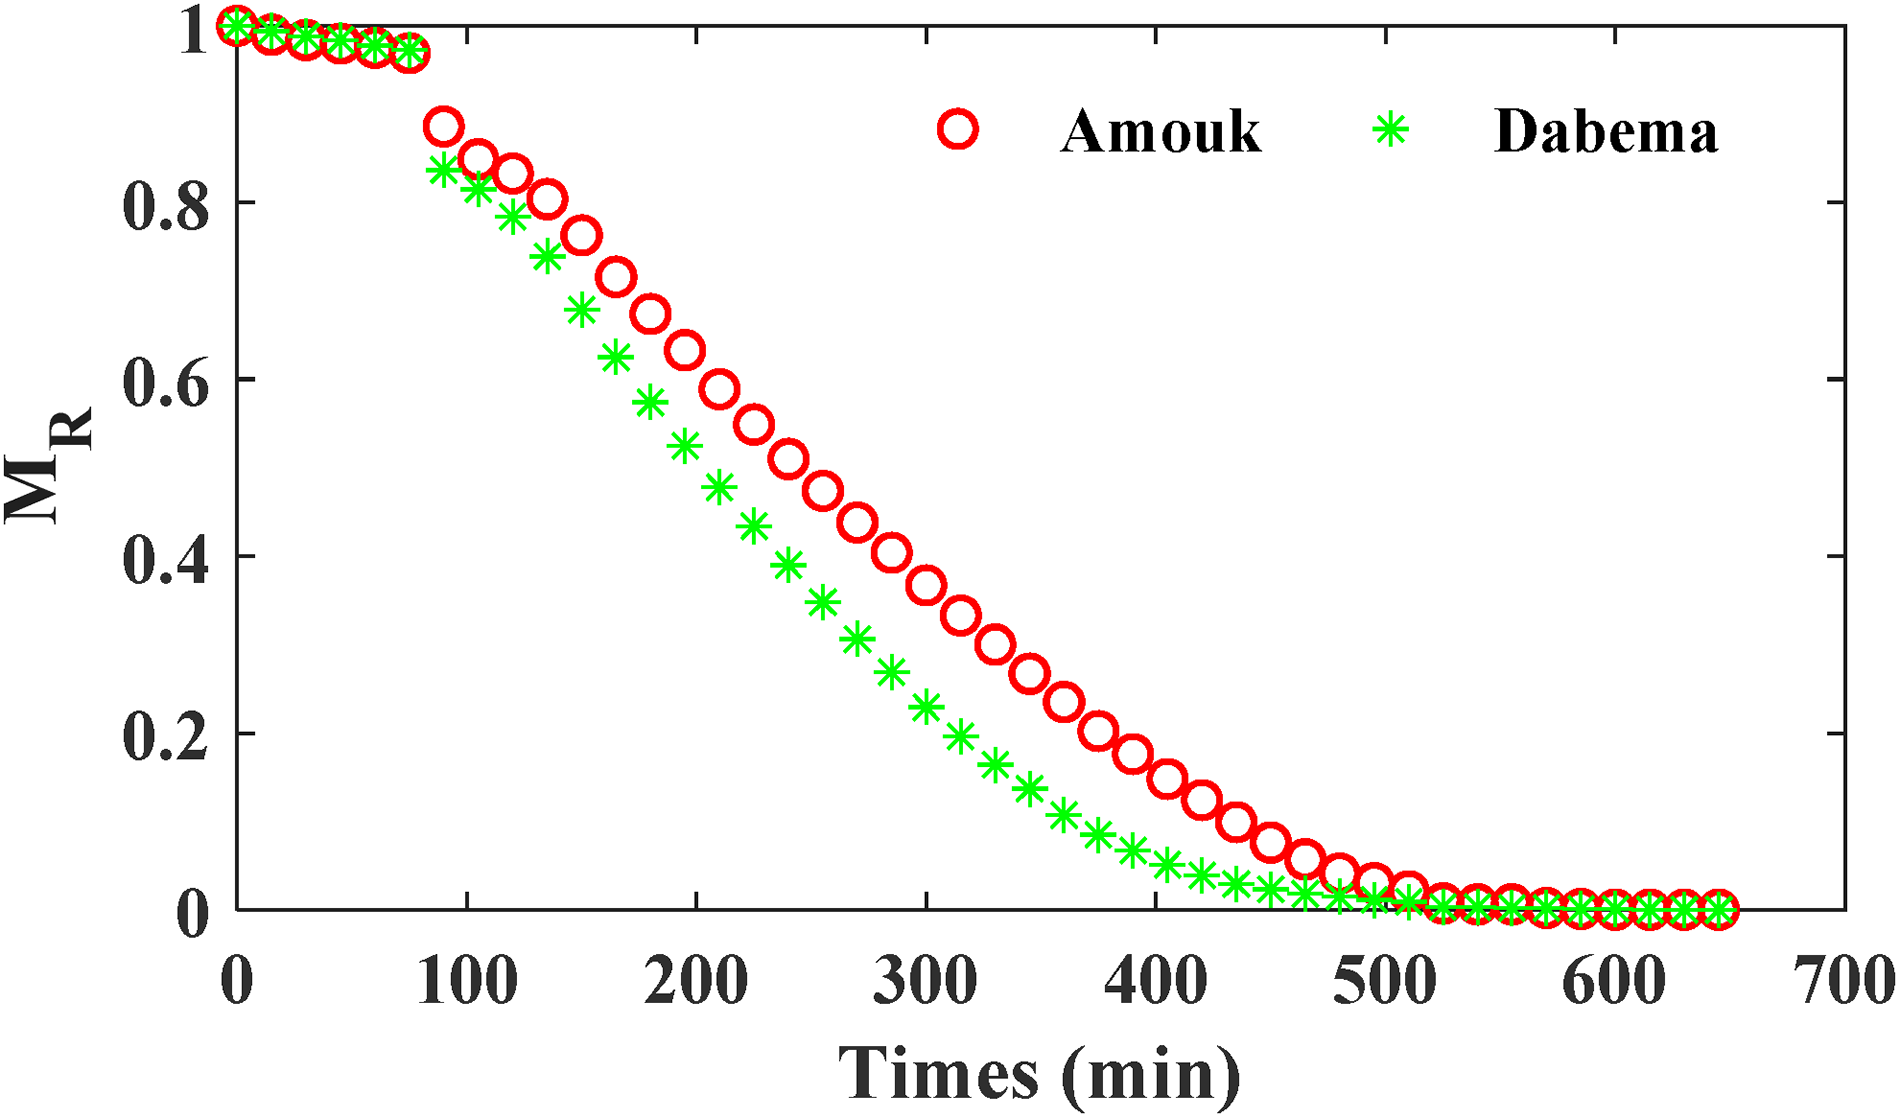
Experimental curves for Amouk and Dabema species.
Desorption kinetics parameters used for the hygrometric behaviour of the species studied.
Mechanical properties
Axial compression and static three-point bending test
It was that Amouk shows a plastic deformation (Figure 8(a)) after the linear elastic phase compared with Dabema (Figure 8(b)), which gives it a ductile character. In addition, both timbers showed abrupt failures during the bending test (Figure 8(b)) just after the plastic limit. This indicates that these timbers have brittle bending behaviour (Figure 8(b)). Generally, both woods showed behaviour close to a linear phase corresponding to the elastic zone, a slow failure phase in compression by crushing and a rapid failure phase in bending.
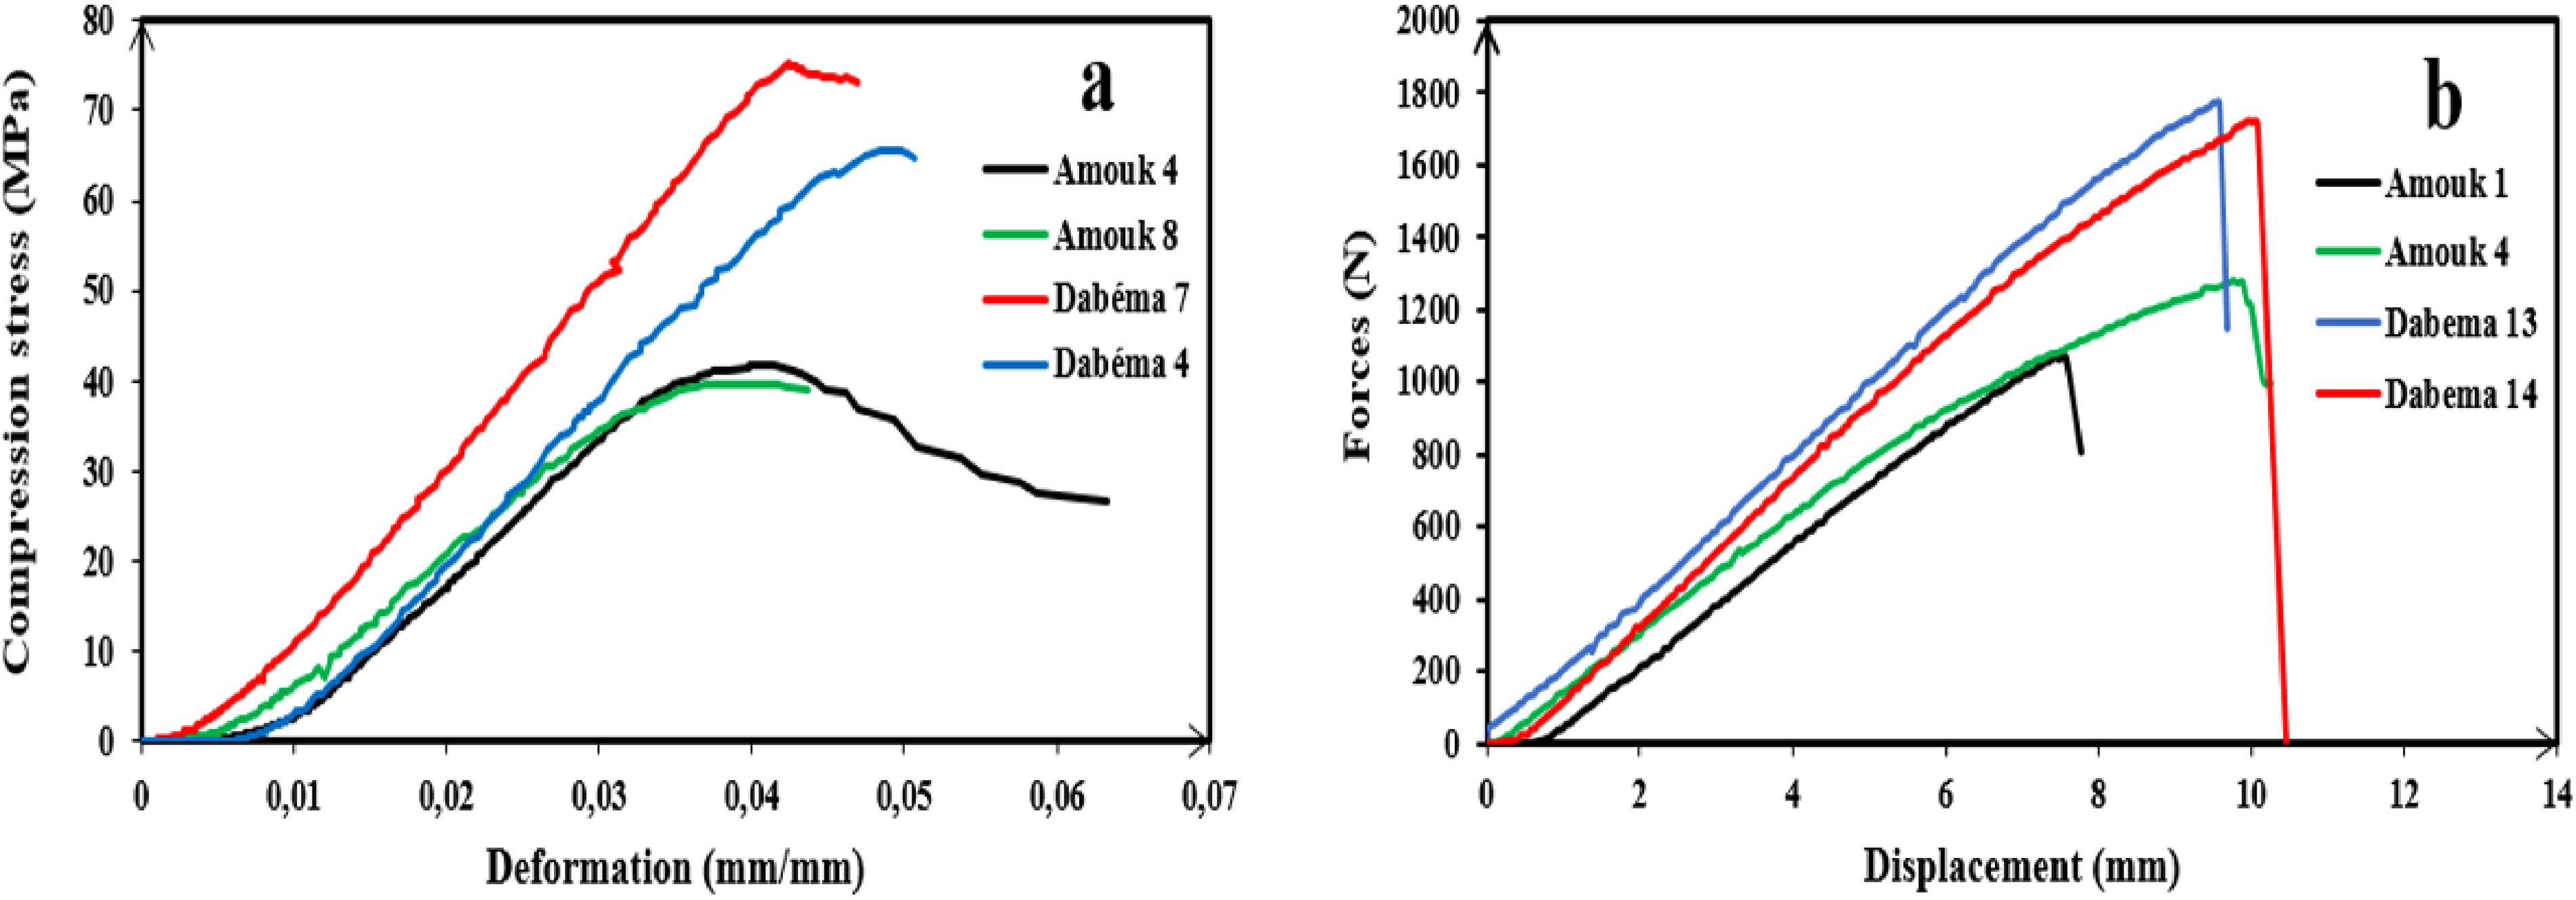
Mechanical behaviour of the species studied in (a) compression and (b) flexion.
The mean values of MOR and MOE for Dabema are significantly higher than those for Amouk in both cases (Table 8). Although these results are dispersive for certain values, they are close to those found in the literature.35,55 Amouk has a lower compressive strength (44.07 ± 4.11 MPa) than Dabéma (68.60 ± 6.97 MPa), which could be influenced by its high moisture desorption rate (123.55% ± 9.73) compared to Dabema (90.64% ± 6.14). The longitudinal MOE of Dabema in the present study is 14,638 ± 1556.58 MPa, close to the 15,190 Mpa obtained by Tropix7 cirad 55 and far from 12,300 Mpa found by Gérard et al. 35 This difference could be due to the high concentration of stresses applied to a single central point, as described in the principle of the three-point static bending test used in this study. 62 In addition, the variability of the sampling area, growing conditions and the non-homogeneity of the species studied within the same species could also explain these differences.33,63
Modulus of elasticity and modulus of rupture for compression and bending tests.
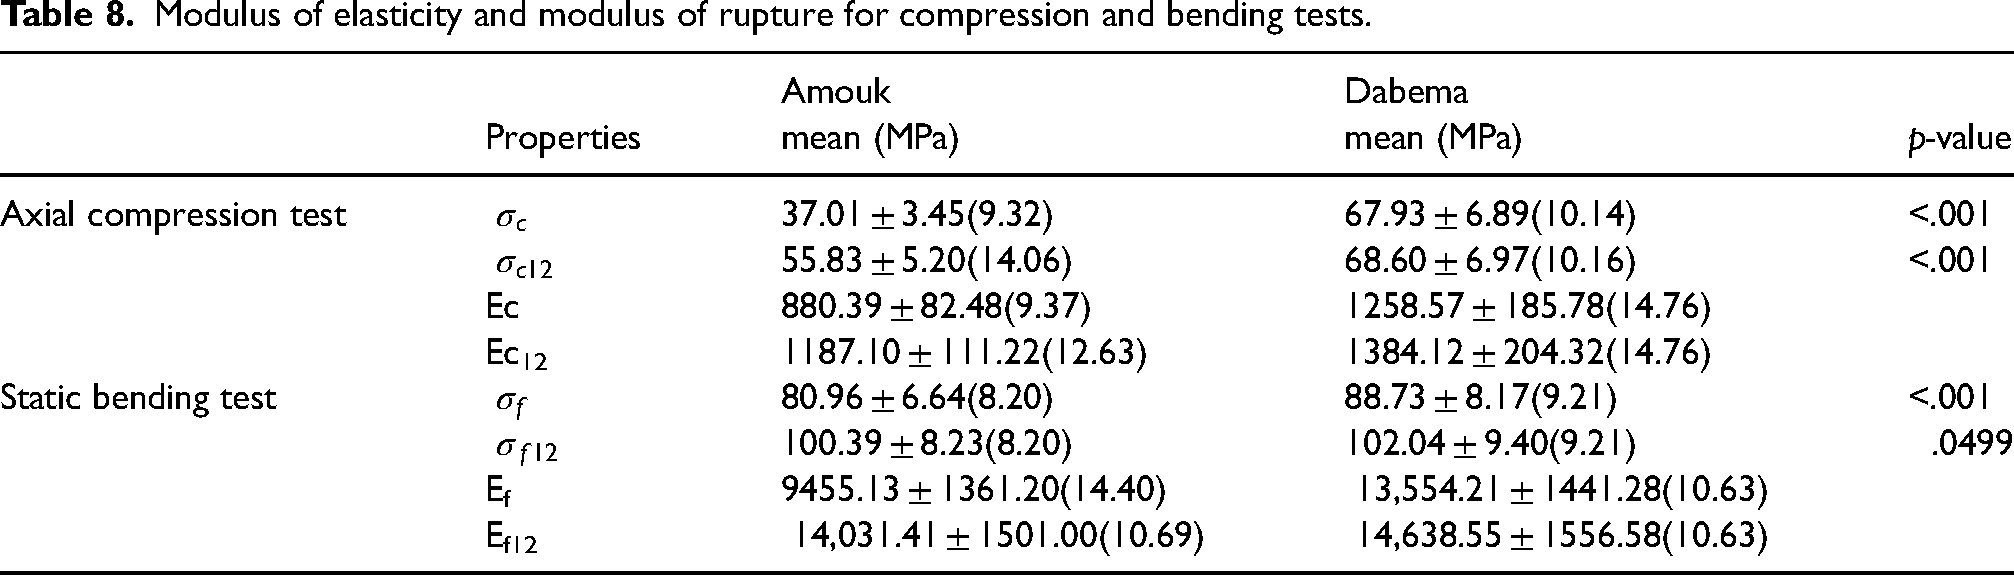
The lower moisture content of Dabema (22.65%) compared with Amouk (24.71%) also contributed to the improvement in its mechanical performance. Young's and rupture modulus strongly depend on this parameter. 64 According to the literature, a decreasing trend with increasing moisture content is observed for Young's moduli of tropical woods in all orthotropic directions. 33 This relevant observation is justified in this study for Amouk. These results are in line with the work reported by Mvondo et al., 31 which gives an overview of the literature data for Young's moduli as a function of moisture of several Cameroonian tropical wood species Bilinga, Iroko and Tali below the FSP. On the other hand, the very low values of MOE and MOR for Amouk subjected to compression show that this wood becomes more ductile as moisture content (MC) increases. Because of their very similar properties, the bending and compression failure stresses at 12% (MC) would allow these species to be classified as medium-stress wood. 64
Tensile and shear strength test
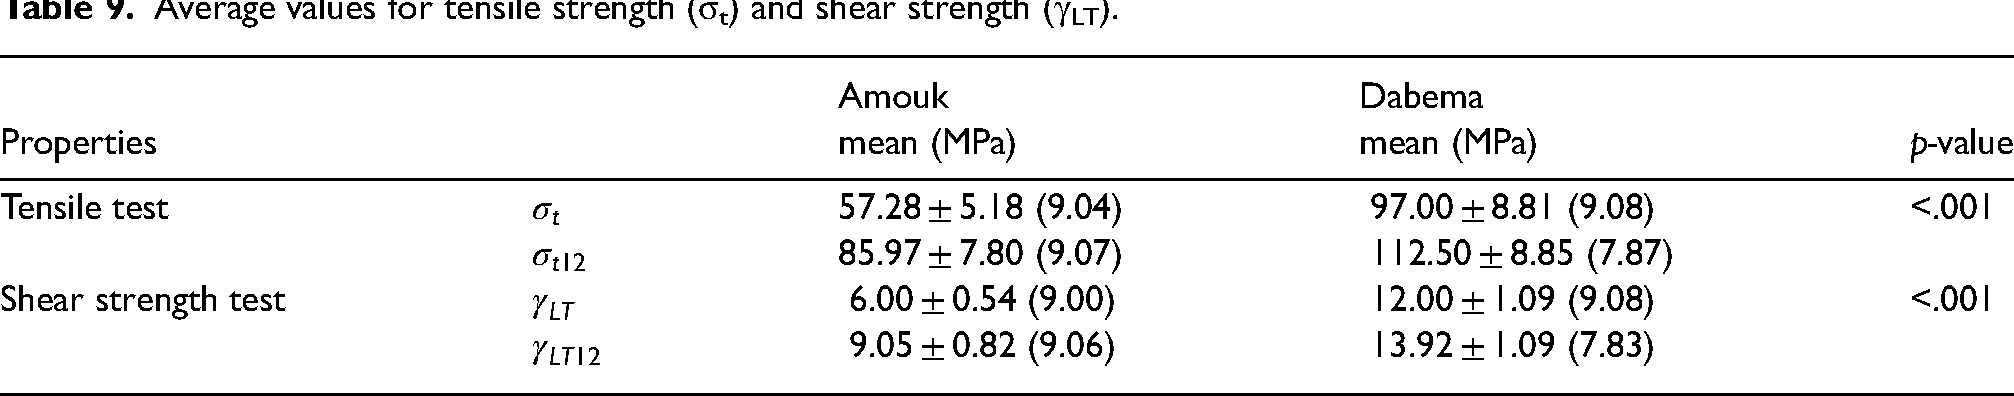
It was found that be seen that the maximum tensile and shear strengths and stresses at the break of Dabema wood are higher than those of Amouk wood (Table 9). This can be explained by its low MC. This theory of the influence of the MC of hardwoods in the Congo Basin has been justified by several authors.1,32 The values obtained for the tensile test are close to those obtained in the work of Mvondo et al. 31 for Bilinga (Nauclea Diderrichii) and Iroko (Milicia excelsa) woods.
Average values for tensile strength (σt) and shear strength (γLT).
Weibull distribution
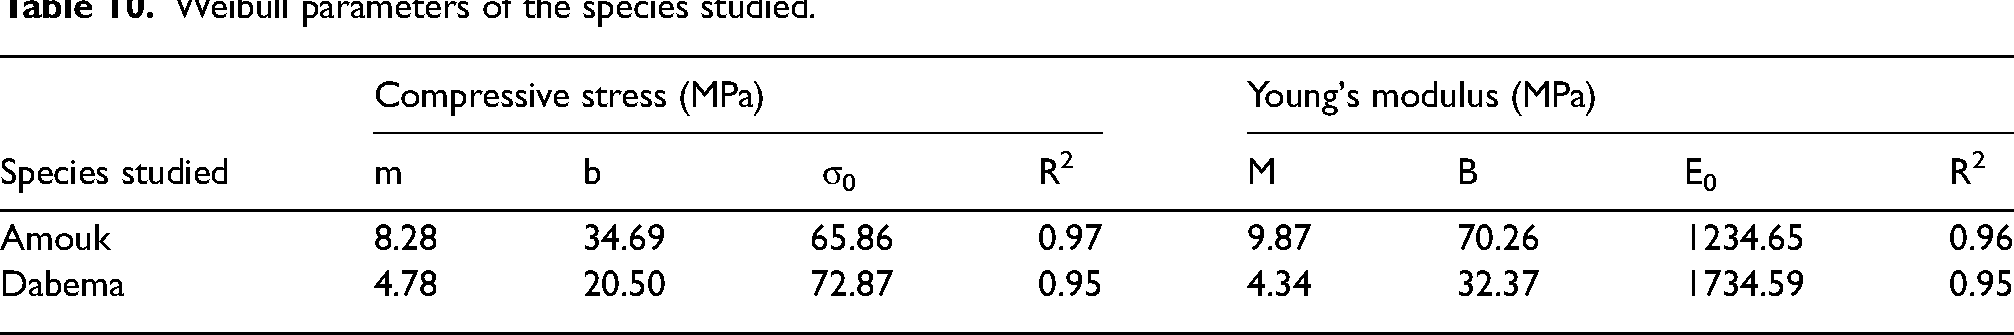
Figure 9(a) and 9(c) shows the compression linearisation curves for the two species studied and the parameters of the two-factor Weibull analysis. The Weibull parameters (Table 10) after the compression test of the species studied show that the failure of these orthotropic materials follows a Weibull law. Similar results have been observed for various tropical hardwood species in the literature. 53 The Weibull modulus (m) of between 4.34 and 9.87 shows that the material has a fracture rate comparable to that of Andiroba, 65 Azobé 66 and Gmelina arborea, which is an angiosperm of the Lamiaceae family and the genus Gmelina. 48 In view of these results, the woods studied could be an alternative to these species for construction applications such as parquetry, staircases, joinery, and in the furniture industry for cabinetmaking, turning, veneering and structural purposes, 22 Standard. 64 However, the use of wood for structural applications is envisaged based on knowledge of its mechanical properties. 33 In addition to fracture parameters, we have the density at 12% (MC), a relevant indicator for the classification of wood according to the standard 64 used by Eurocode 5 in structural applications.
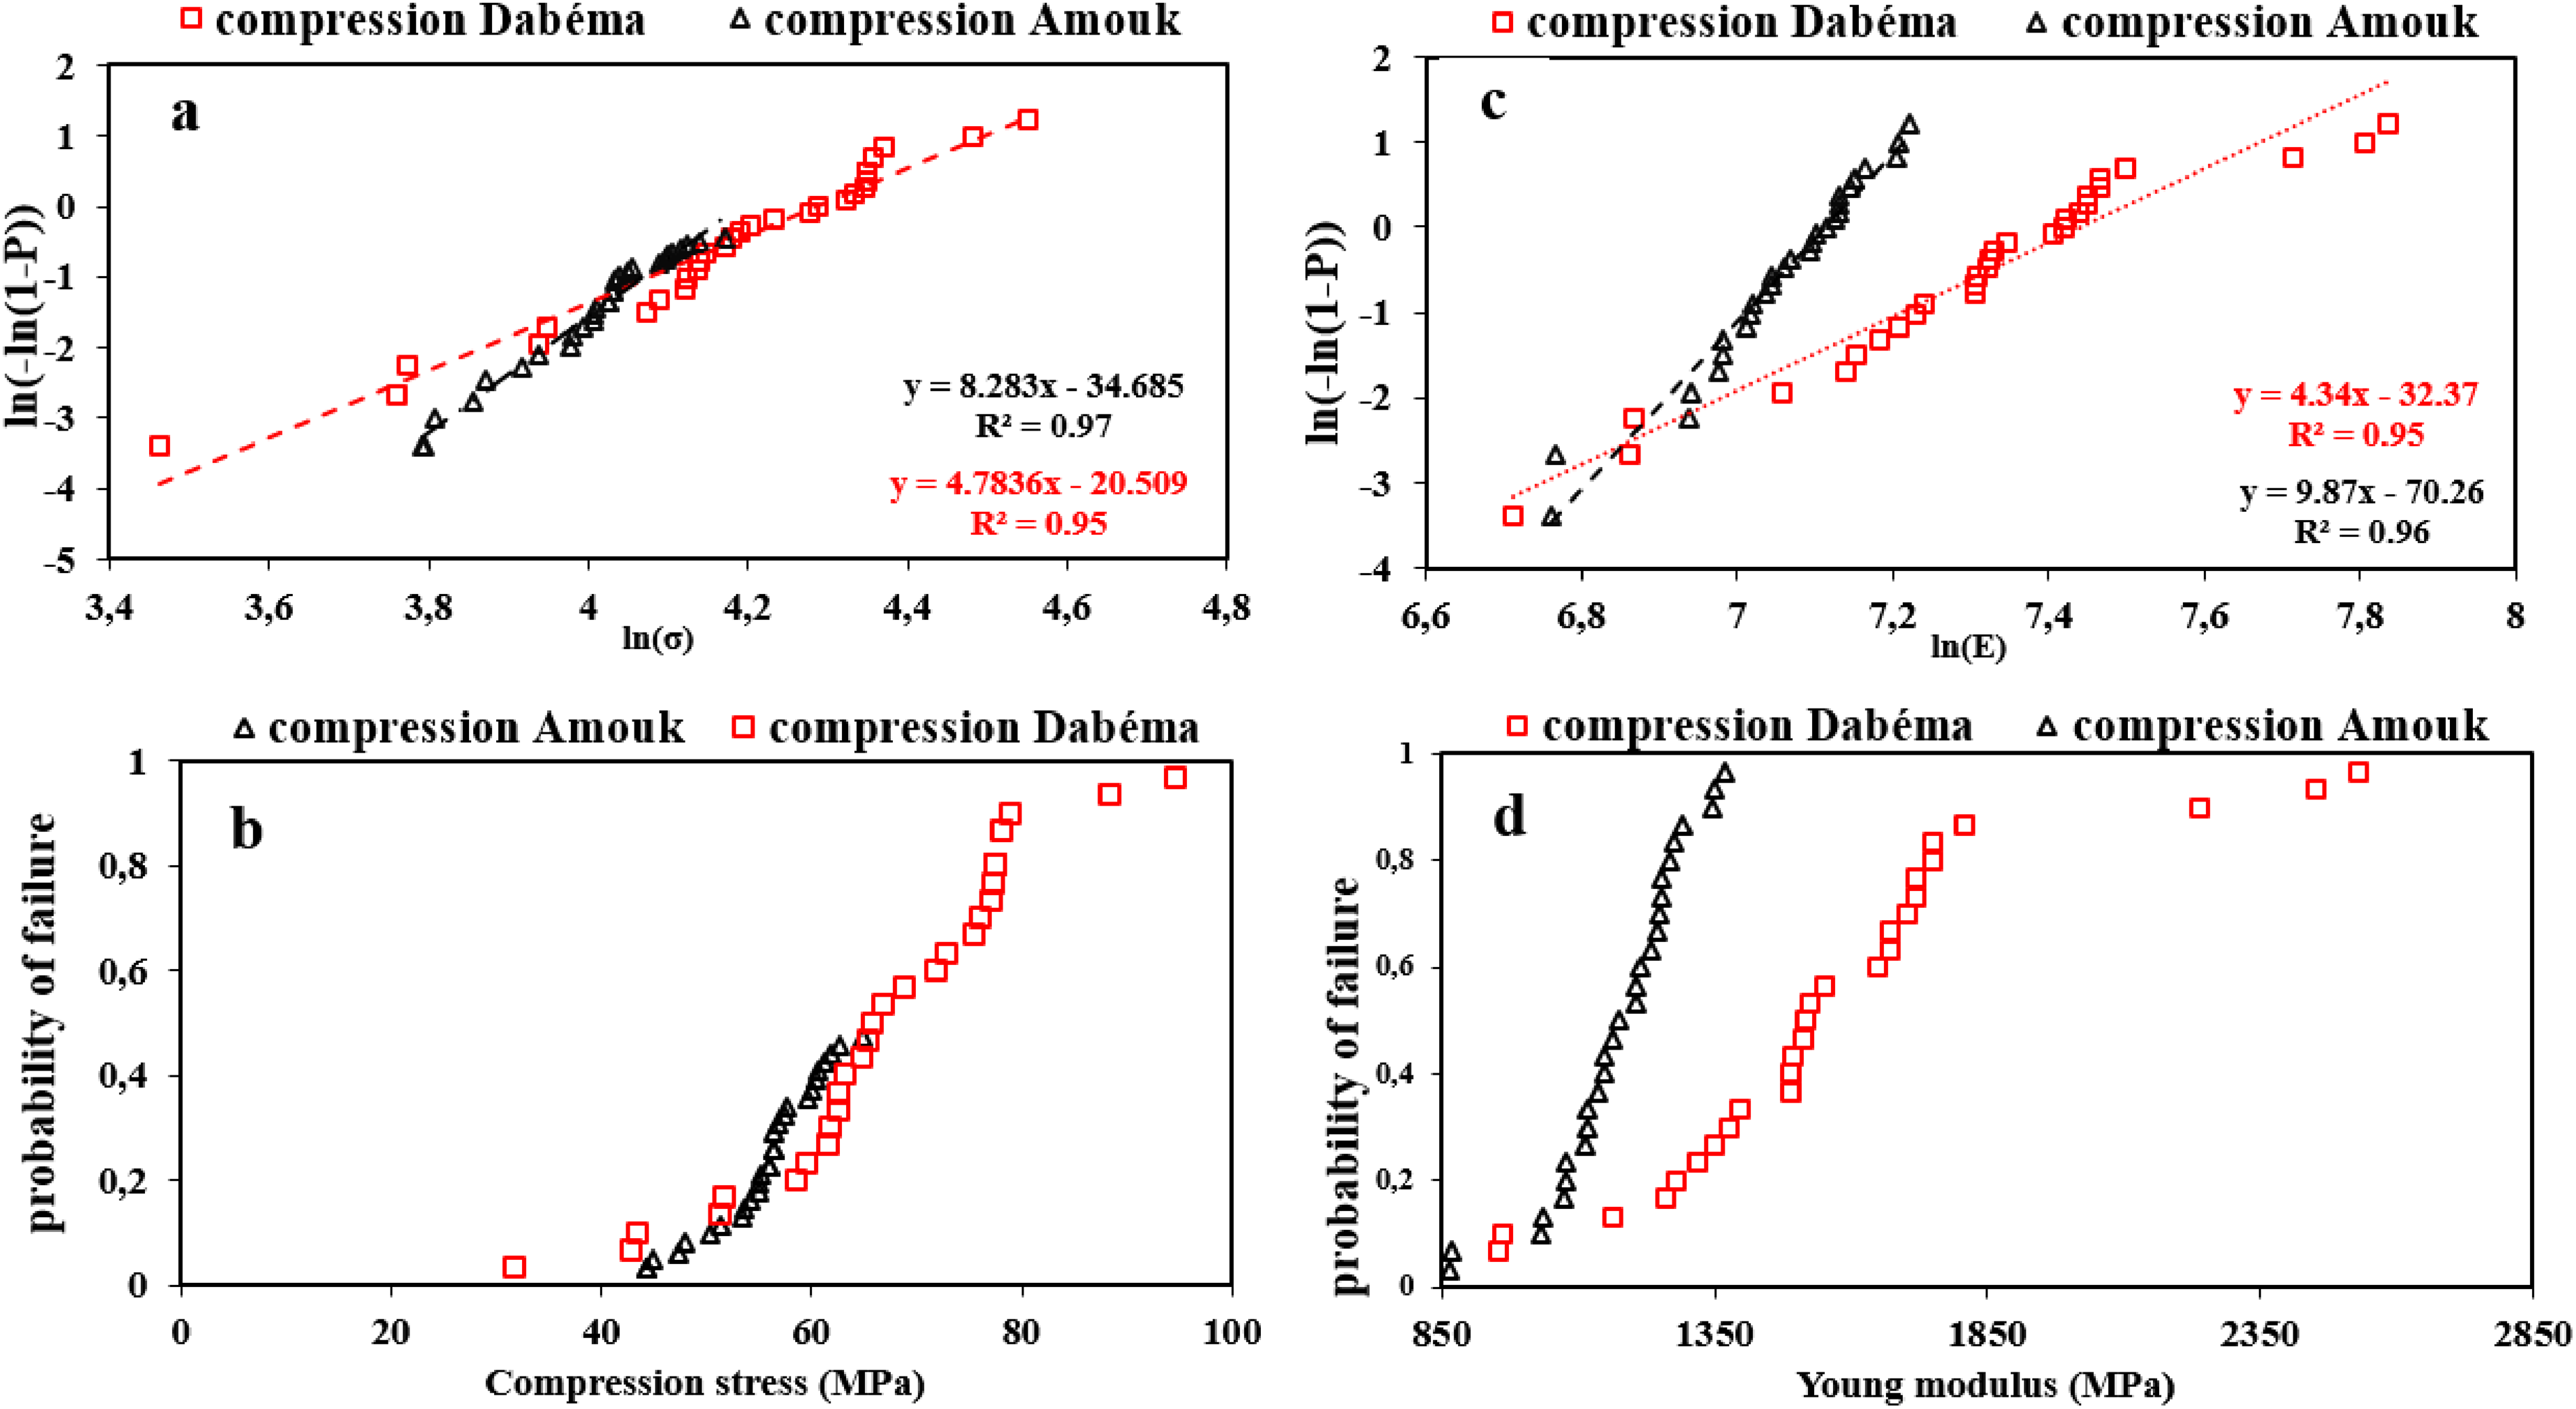
Weibull compression parameters of the species studied for (a) stress, (b) Young's modulus, (c) probability of failure for stress, (d) probability of failure for Young's modulus.
Weibull parameters of the species studied.
The very low Weibull modulus for both wood species (m < 20) reflects the fact that specimen failure is solely due to specimen compressive stress during testing and not crack propagation, showing the potential of Amouk and Dabema for engineering purposes. 48 Figure 9(b) and 9(d) show Herd Johnson fracture probability curves, from which it is evident that the curves represent slopes that decrease with increasing stress.48,53
Classification of the properties of central African woods into similar groups
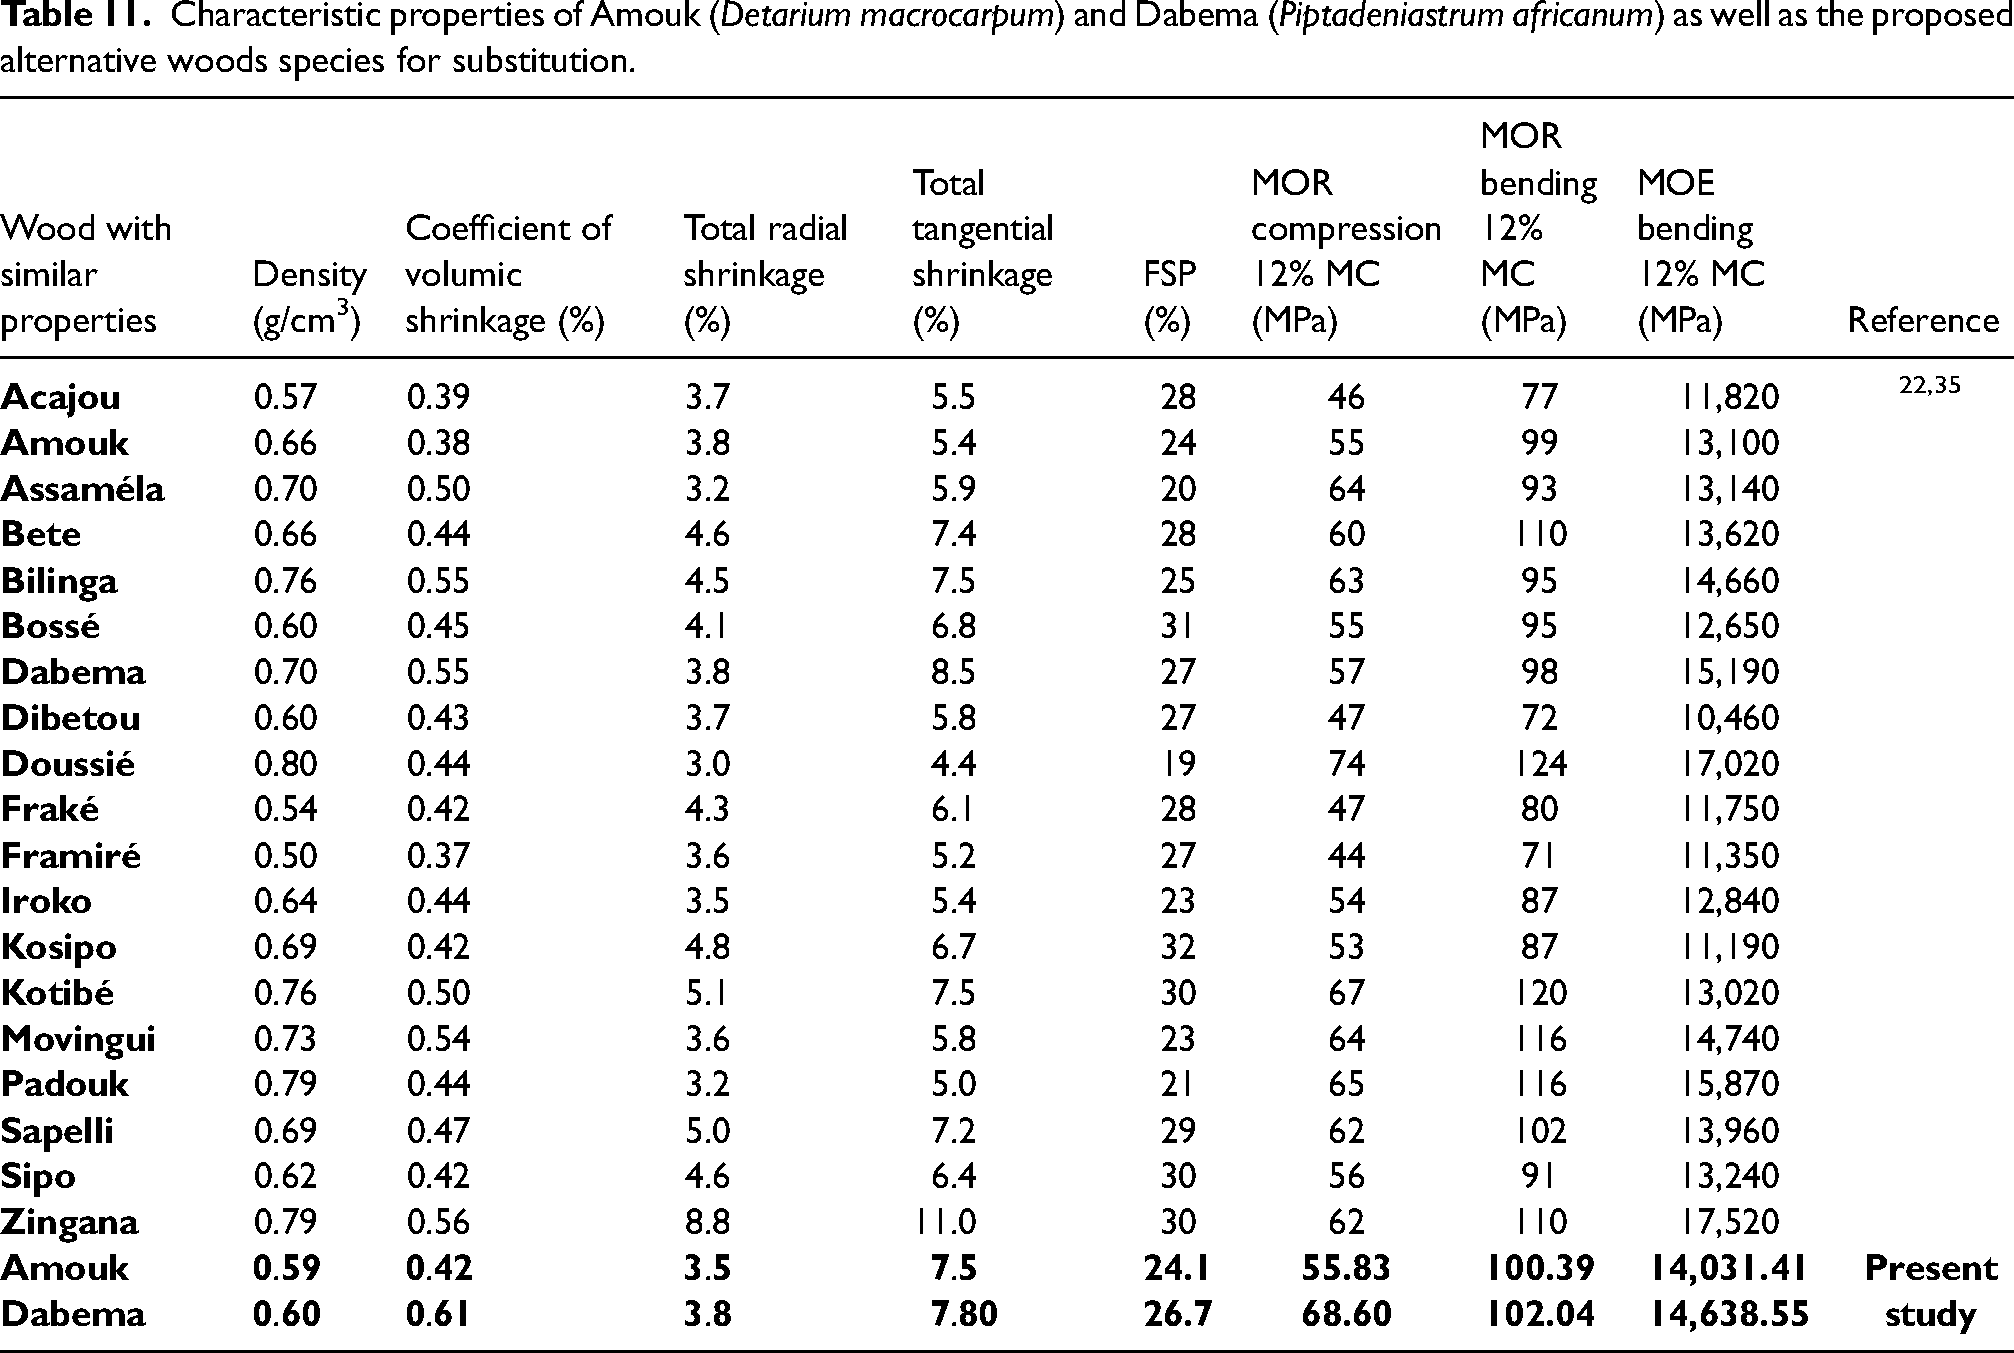
The physical and mechanical characteristics of the species studied make it possible to consider possible substitution by other woods with similar properties. Table 11 was drawn up to compare some previous results available in the literature13,15,67 with Amouk wood (D. macrocarpum) and Dabema wood (P. africanum). The EN 338 standard 64 has made it easier to decide which species could be considered substitutes for species heavily exploited in wood-processing units and dense forests in Central Africa. 67 Such approaches have been addressed by other authors such as Lissouck et al., 1 Nyobe et al., 13 Sout et al., 68 and Akter et al. 69 who have characterised orthotropic materials for the design of structural elements made from engineered wood products. Cirad can envisage areas of use for these two woods in construction applications such as parquetry, staircases and joinery; for the furniture industry such as cabinet making, turning, and veneering; and for structural purposes. 22
Characteristic properties of Amouk (Detarium macrocarpum) and Dabema (Piptadeniastrum africanum) as well as the proposed alternative woods species for substitution.
Conclusion
This study was carried out to improve the knowledge of the physical and mechanical properties of tropical woods from Central Africa as alternatives to the most widely exploited woods. Mechanical and physical characterisations were carried out on samples of Amouk and Dabema wood. Physical properties such as 12% (mc), anhydrous densities and volume shrinkage were determined, while mechanical properties were tested in flexure, compression, tension and shear. A statistical Weibull analysis of the compressive properties was also carried out. The physical properties obtained classify these woods as medium shrinkage species and, therefore, as medium-heavy. Mechanical properties such as MOR and axial MOE showed that the two species have similar properties, enabling them to be considered as medium-strength woods according to the criteria of EN 338 used by Eurocode 5. These properties suggest that these two species could replace Iroko and Sapelli, commonly used and overexploited in the Congo Basin for structural, joinery and cabinet-making applications. Statistically, the fracture properties obtained in compression can be predicted by Weibull's law, and the fracture observed in Amouk (D. macrocarpum) and Dabema (P. africanum) is due solely to the stress exerted on the samples.
Footnotes
Acknowledgements
The authors are grateful to Nicodem Rodrigue Tagne Sikame, Fabien Kenmogne and Fonyuy Godwin Banyuy for their contribution to the review of this article.
Declaration of conflicting interests
The authors declared no potential conflicts of interest with respect to the research, authorship, and/or publication of this article.
Funding
The authors received no financial support for the research, authorship, and/or publication of this article.