
Abstract
Density, as the most critical information for wood materials could be predicted by near-infrared (NIR) spectroscopy. Increment cores and thin wood samples of teakwood (Tectona grandis) served as research materials for this new approach to sampling for NIR spectroscopy, explained in detail. Density data were combined with their NIR spectra data for analysis using cross-validation partial least squares regression as chemometrics to produce a density prediction model. A new approach of increment cores from teakwood stands for NIR spectroscopy measurements for density predictions resulting in a 0.34 coefficient of determination for cross-validation (R2CV) and 0.40 of R2CV for thin wood samples as the best result from the first derivative with 25 smoothing points of NIR spectra. The improvement from the previous research for density prediction accuracy resulted in an R2CV value of 0.55. The smaller diameter of the increment core sample than the NIR light beam's diameter and illuminated mixed surface (transversal and radial) are supposed to give weaker prediction accuracy by this new approach.
Introduction
Density is always associated with the strength of wood materials for construction. Shmulsky and Jones 1 stated that it is possible to learn more about the nature of a wood sample by determining its density than by any other single measurement. Thus, information on density is the introductory statement for many testing methods of wood application for construction. Llana et al. 2 investigated in-situ density estimation by four non-destructive techniques on Norway spruce: pilodyn, woodpecker, screw withdrawal resistance, and core drill. At the same time, Schimleck et al. 3 mentioned many non-destructive tools for wood density measurement, such as near-infrared (NIR) spectroscopy, resistograph, pilodyn, SilviScan X-Ray densitometry, DiscBot, and computer tomography scanning.
Increment coring is the most common standing tree sampling for small wood samples taken into the laboratory until now. Increment borer is the primary tool used to extract cores from living trees to analyse growth trends based on inspection of the tree's ring patterns. 4 Increment coring is easy and quick to be done with small increment borers for field expeditions to collect many wood samples. The cores have information in the radial direction of the stem. Cores are transported quickly and immediately to the laboratory to analyse many wood characteristics. Maeglin 5 of Forest Products Laboratory wrote entirely about how to collect, handle, and use increment cores.
A combination of increment cores and NIR spectroscopy is supposed to be applied if an on-site NIR spectrometer is unavailable. This new approach to a small sampling method for NIR spectroscopy using increment cores is the main point of this research. A review of the application of NIR spectroscopy on wood has been written by many researchers.6–12 In particular, wood density prediction using NIR spectroscopy has been inspected by many researchers.13–21 However, the papers mentioned did not use increment cores for NIR spectra acquisitions as wood samples. Wood samples in tube shape of increment cores with small diameters for quality traits using NIR spectroscopy are mentioned only by Schimleck et al. 22 and in the tutorial on assessing wood with NIR spectroscopy by Sandak et al. 23 Thin wood samples obtained from the wood part near the bark acted as a cover sample for increment cores samples as it is also part of the whole increment cores samples.
This research investigated the use of increment cores in tube shape with a small diameter (0.5 cm) and thin wood surface in box shape from teakwood stands for density prediction model by non-destructive testing of NIR spectroscopy to simplify sampling without cutting whole trees in standing trees. The hypothesis is that NIR spectra could be acquired well from increment cores (with a diameter of 0.5 cm, although the diameter of NIR light beam to emit is wider from the cores samples) and the thin wood surface of standing trees.
Materials and methods
Materials
Increment cores in tube shape (r = 0.25 cm, h = 2 cm) and thin wood surface in box shape (4 × 6 × 0.5 cm3) samples were obtained from 30 standing trees of Platinum teakwood (Tectona grandis) growing in the backyard office of Research Center for Biomass and Bioproducts National Research and Innovation Agency (BRIN), Cibinong, Bogor, West Java, Indonesia. Figure 1(a) to (c) shows the sampling process and the sample's shape under air-dry conditions ready for NIR spectra measurement. The characteristics of this fast-growing teakwood species have been investigated by many researchers.24–26 There were 30 samples of thin wood surface representing 30 teakwood trees, and each tree resulted in around six to eight increment cores with a total of 211 increment core samples. Platinum teakwood stands as the research materials were planted in 2006 (around 15 years old) and had variations in the diameter of the stems with an average between 40 and 50 cm. Increment core samples were obtained using increment borers made in Haglöf Sweden AB (Langsle, Sweden) with core diameters of 0.5 cm. Thin wood surface samples were taken by hammer and wood chisel. Both samples were taken at a diameter at breast high (dbh), around 1.30 m.
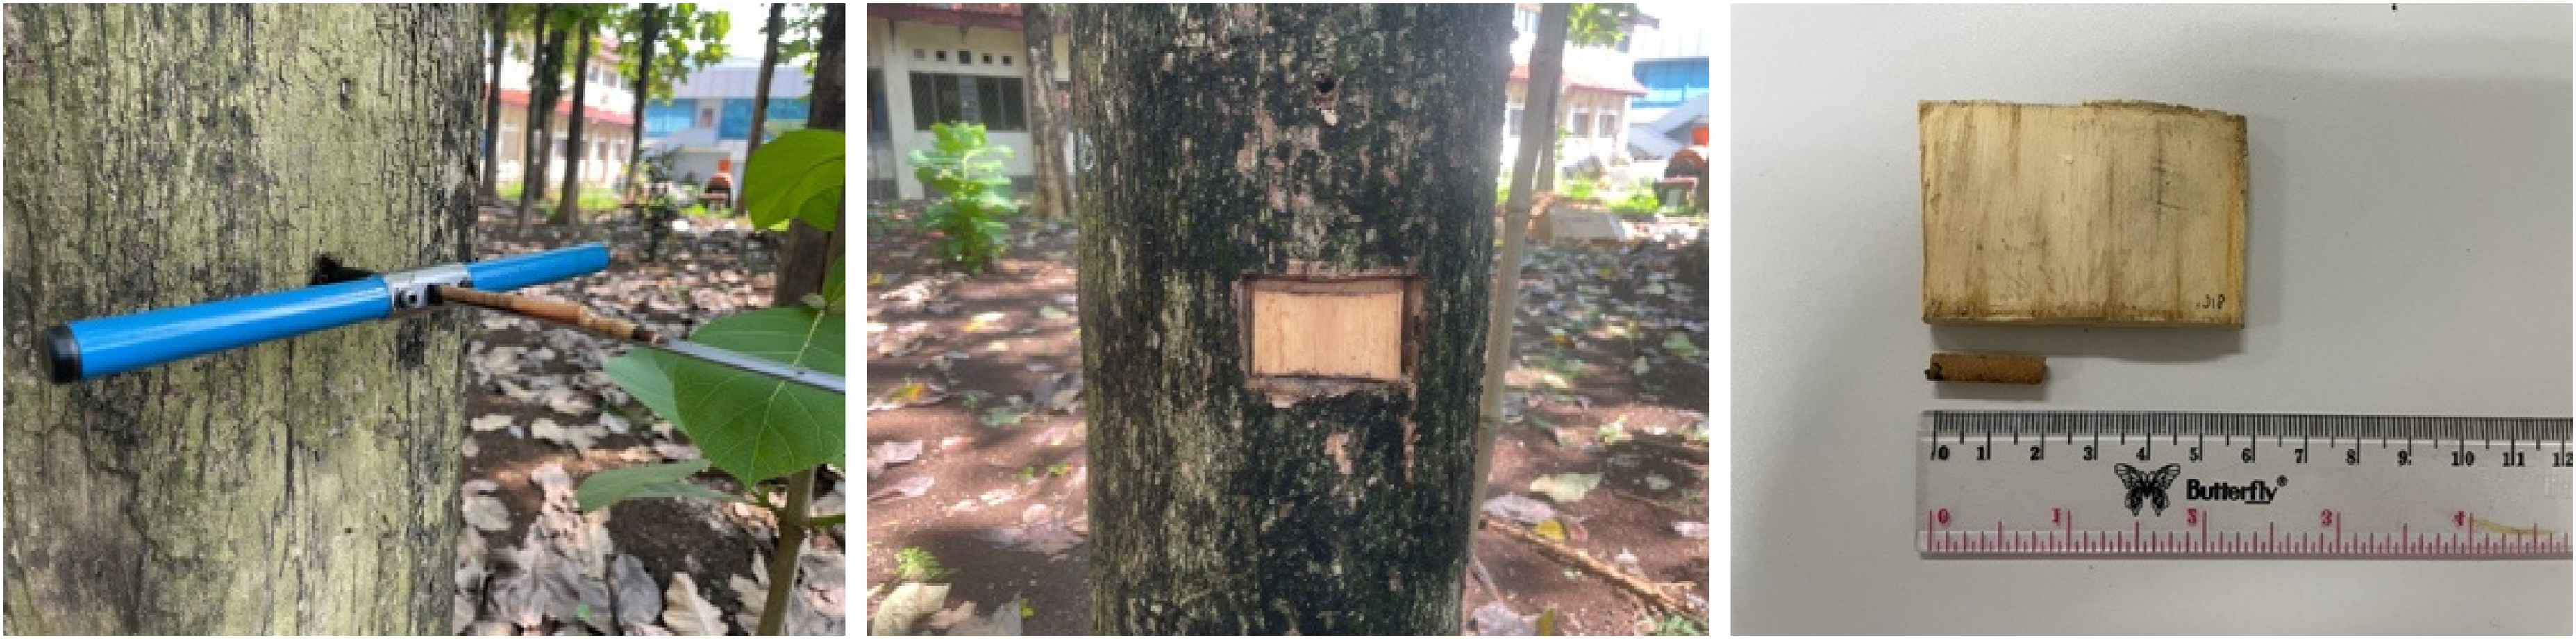
(a) Increment cores sampling, (b) thin wood surface sampling, (c) increment core and thin wood surface samples under air-dry conditions.
Diameter measurement
The diameter (cm) of 30 teakwood stands was measured by measuring the circumferences of the stems on their dbh with a band meter. Circumference data of the stem were calculated to diameter data with the formula:
Then, diameter data from 30 teakwood stands were classified into five class diameters from 21 to 70 cm. Increment core samples from five class diameters (for both reference values and NIR spectra) were also analysed for density prediction by chemometrics.
Density measurements
The density of the two sample shapes was determined from weight under air-dry conditions (12% moisture content (MC)) in g and volumes in green MC (V) taken directly after sampling in cm3 by dividing the weight of air-dry samples (W) by volumes of samples (V) in g/cm3. The W was measured by digital scales immediately after NIR spectra acquisitions. In contrast, V was obtained by the water-displacement method after the samples were taken from standing trees at the beginning of the research (sampling). Using air-dry conditions to determine the density was not intended to destroy the wood samples for NIR spectra measurements. This is to confirm that oven-dry weight was not applied for density determination in this research.
NIR spectra measurements
NIR spectra measurements for increment core samples and thin wood surface samples were done firstly under air-dry conditions (12% MC) before measuring the weight of the samples on a digital scale. The spectrometer used in this research is a Spectra 100N Fourier transform-near-infrared (FT-NIR) Spectrometer (PerkinElmer Inc., Waltham, Massachusetts, USA) as shown in Figure 2(a). NIR lights lit the sample from below on hybrid radial and transversal surfaces for increment core samples and on tangential surfaces for thin wood surface samples. Note that increment core samples have both transversal and radial hybrid surfaces as the samples in tube shape are taken in a tangential direction using increment borer of the standing trees. NIR spectra of both samples were acquired from 870 to 1630 nm with a scan resolution of 16 cm−1 and accumulations of 32 scans. NIR spectra measurements result in absorbance values according to its NIR wavelength. Figure 2(b) shows that the diameter of the NIR light beam is wider than the diameter of increment core samples of wood.
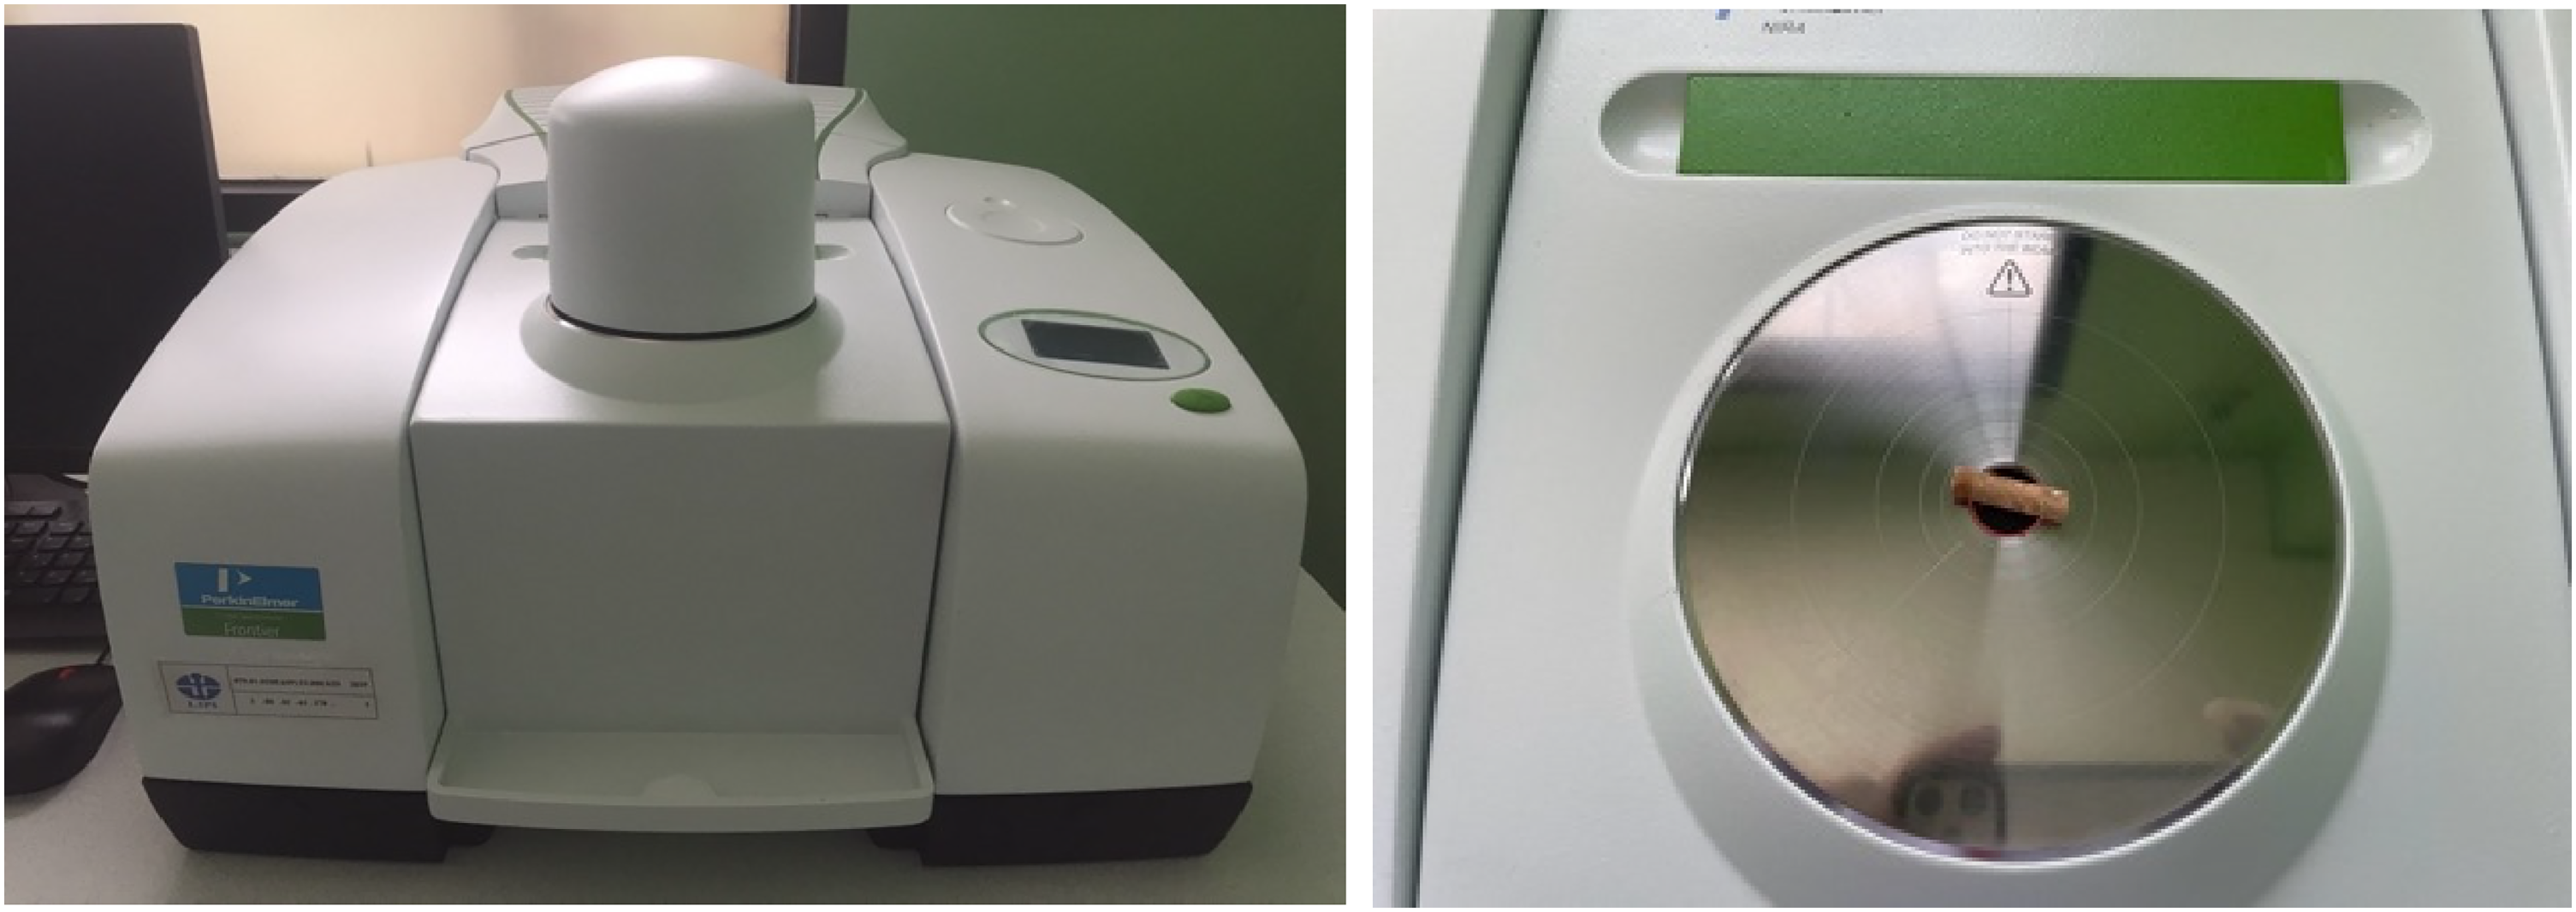
(a) Spectrum 100N Fourier transform-near-infrared (FT-NIR) spectrometer, (b) NIR light beam (with wider diameter from the core) emitting the increment core sample.
Statistical analysis
An effective wavelength range was selected from 900 to 1600 nm (to remove such noise data from the beginning and end of wavelength measurements), and pre-processing spectra treatments were applied, such as standard normal variate (SNV), multiple scatter correction (MSC), combination of MSC and SNV, and first derivative (1st der.) with 25 smoothing points (sp) Savitzky-Golay polynomial. As a multivariate data analysis or chemometrics, leave-one-out cross-validation partial least squares regression (CV-PLSR) was applied to obtain the best density prediction model constructed by increment cores and thin wood surface samples. The best density prediction model was considered by the highest value of the coefficient of determination for cross-validation (R2CV). This value of R2CV is accompanied by series values of the number of latent variables (LVs), coefficient of determination for calibration (R2C), root-mean-square error for cross-validation (RMSECV), root-mean-square error for calibration (RMSEC), and the ratio of performance to deviation (RPD). Mean-centring was applied to all spectra before CV-PLSR analysis was performed. MATLAB R2017b (MathWorks, Natick, MA, USA) was used for data analysis.
Results and discussion
Thirty Platinum teakwood trees were used as the sample research and were around 15 years old. They had a diameter range between 22.2 and 60.5 cm with an average diameter of 41.8 cm and a standard deviation (StD) of 9.48 cm. The density data from the thin wood surface and increment core samples of teakwood stands are 30 and 211, respectively. The mean density for thin wood samples from 30 data points is 0.62 g/cm3 in the 0.42 to 0.72 g/cm3 range. The mean density for increment core samples from 211 data is 0.55 g/cm3 in the 0.47 to 0.60 g/cm3 range. The density data from Platinum teakwood stands in this research are a bit higher than the mean density data from many species of eucalypts wood samples from Schimleck et al. 22 with 0.449 g/cm3 (prediction set) and 0.453 g/cm3 (calibration set), only for comparison.
Thin wood samples were obtained from mature wood (wood parts near the bark), while increment core samples were taken from radial variation from the tree stem at dbh. Thin wood samples represent mature wood, as shown by Shmulsky and Jones. 1 Almost all 30 trees for density data from increment core samples in radial variation show mature woods (near the bark) having the highest density value. StD of density data from thin wood samples (n = 30), increment core samples (n = 211), and average density on each tree (n = 30) are 0.0670, 0.0559, and 0.0350 g/cm3, respectively. These StD values were used to divide the RMSECV values to obtain the RPD values. RPD value is an attempt to introduce a simple method to quickly appraise the statistics of an NIR spectroscopy calibration. 27
The correlation between density and diameter for 30 teakwood stands is shown in Figure 3. This figure showed weak correlation values (R2) between diameter and density for thin wood surface and increment core samples with values of 0.20 and 0.24, respectively. The better R2 value for increment core samples was used to clarify that increment core sampling is a better way to sample data for density than thin wood surface sampling. However, increment core sampling obtains the core samples only around 20 cm in depth radially of the stem, including the bark.
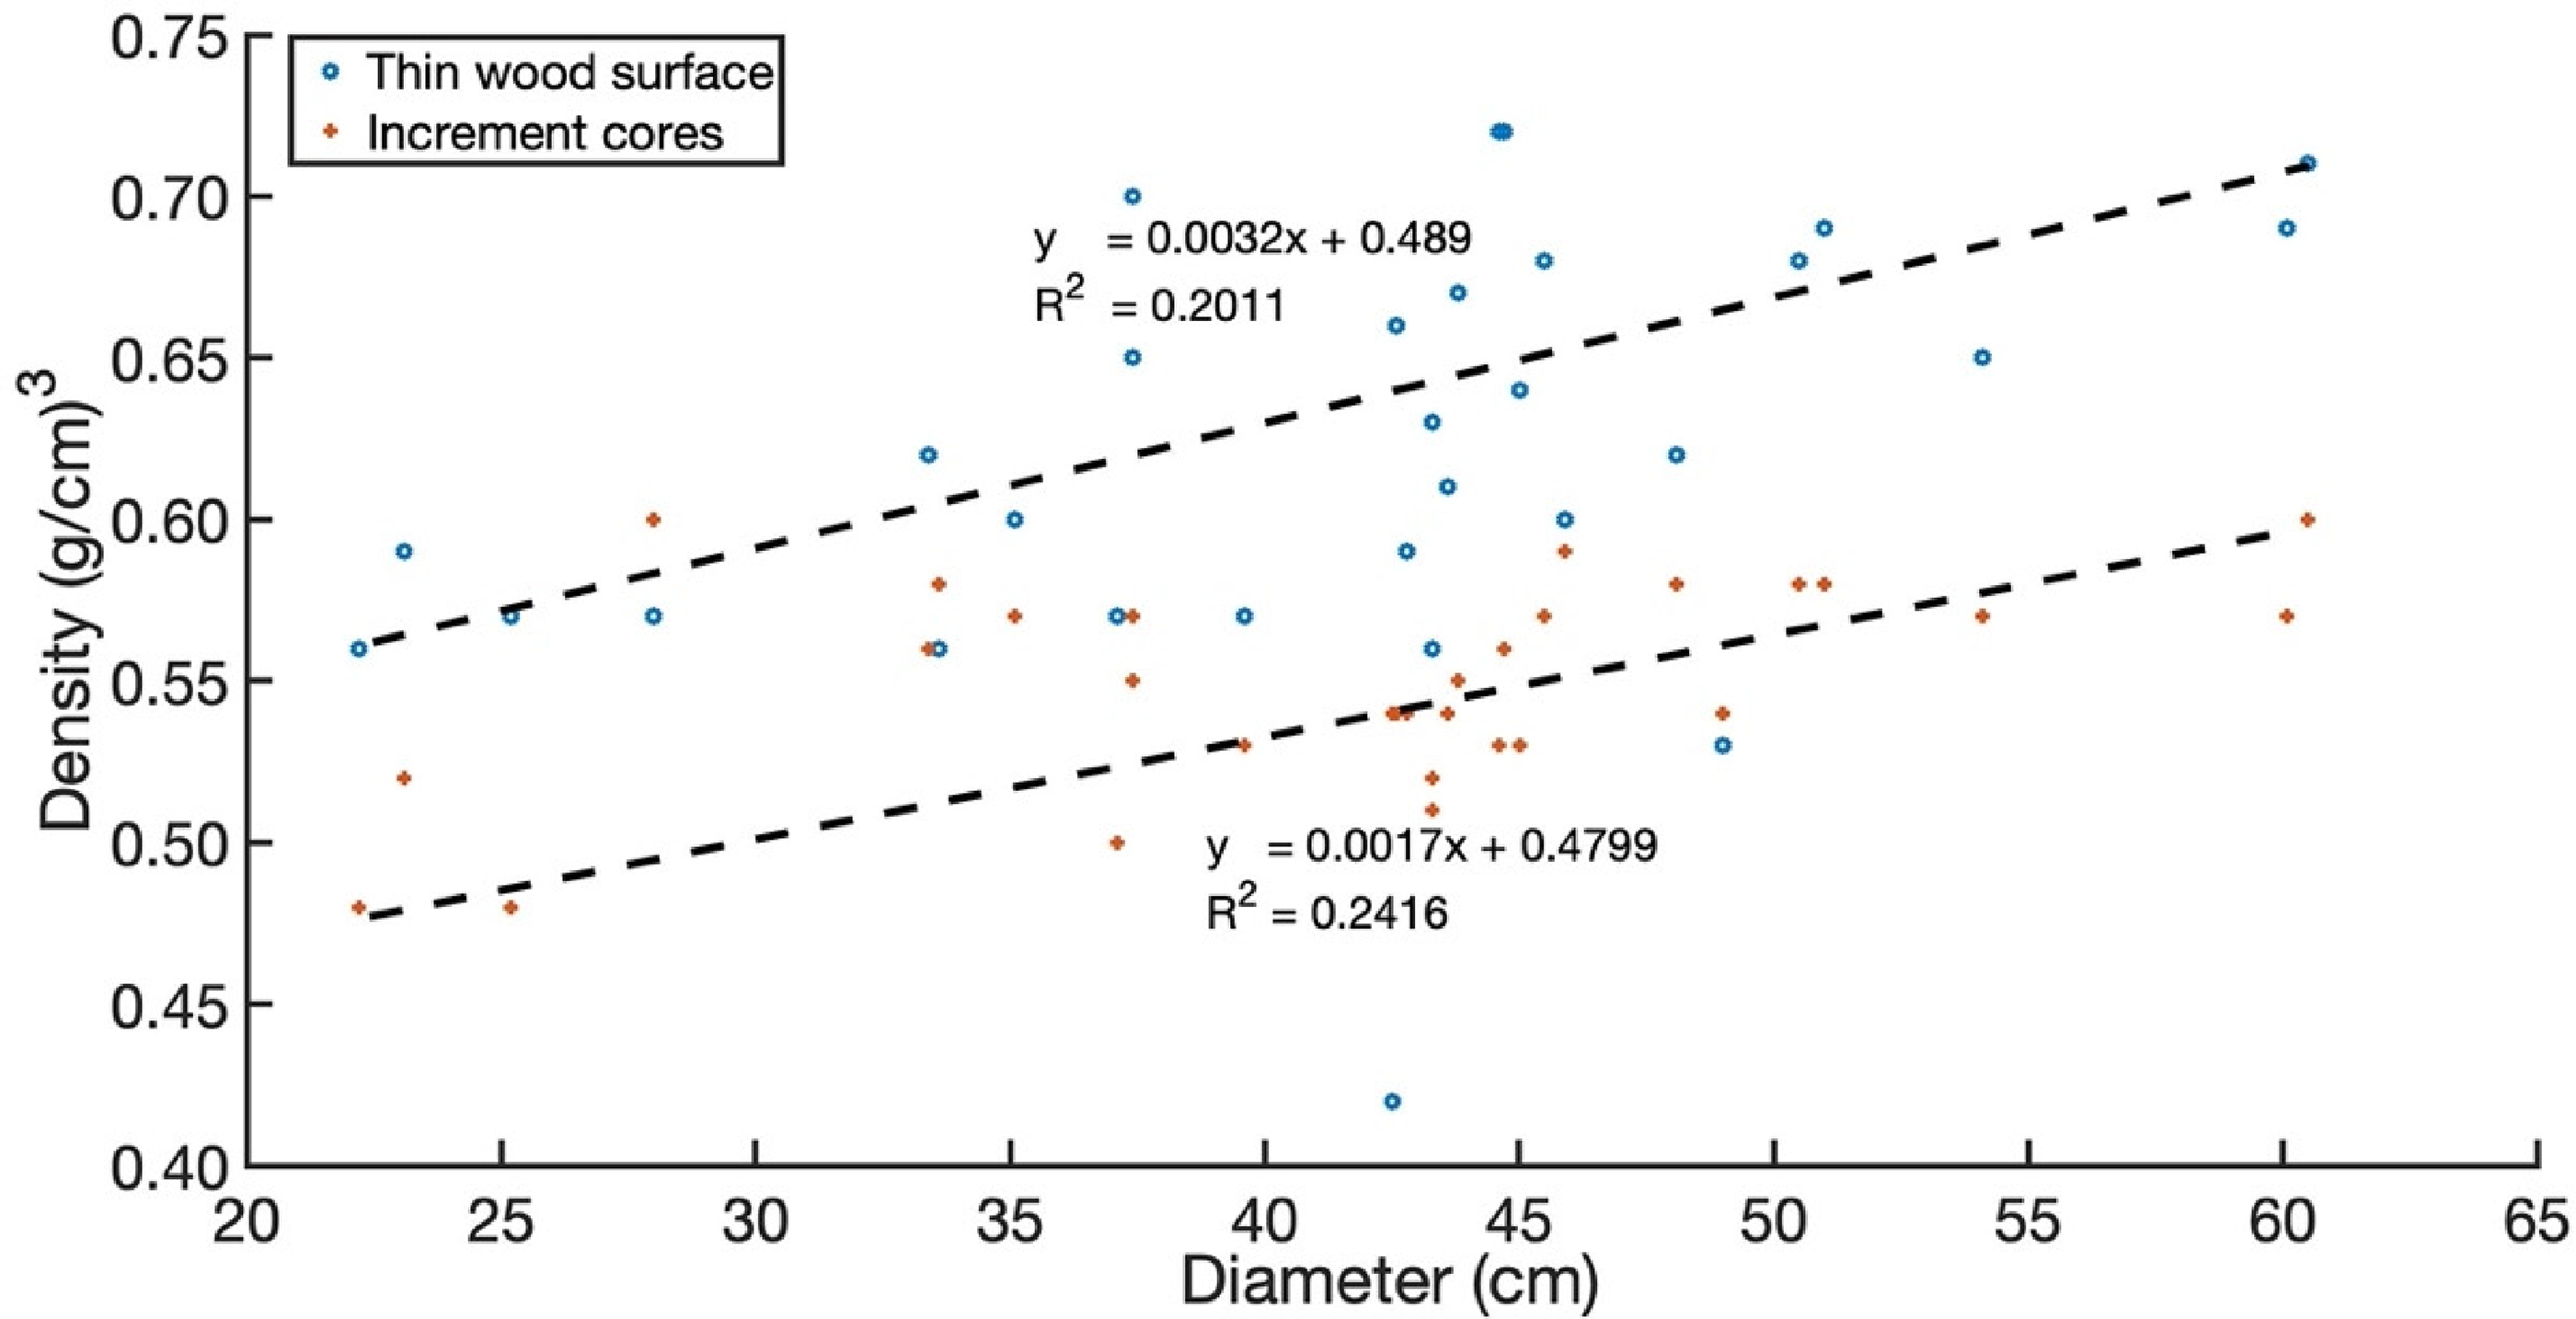
Graph of correlation between diameter and density data for 30 Platinum teakwood stands.
Spectra data obtained from thin wood samples have a lower value of absorbance (0.2 to 0.8) than spectra data obtained from increment cores samples (0.5 to 1.2) as shown in Figure 4(a) and (b). A comparison of mean spectra from both data is shown in Figure 4(c). The mean spectrum of thin wood surface samples is only half absorbance compared to the mean spectrum of the increment cores samples (0.4 to 0.8). This phenomenon is probably due to the surface measurement on each type of wood sample. On thin wood surface samples, the NIR spectra are acquired from a tangential surface, while on increment core samples, they were acquired from a mixed surface between transversal and radial.
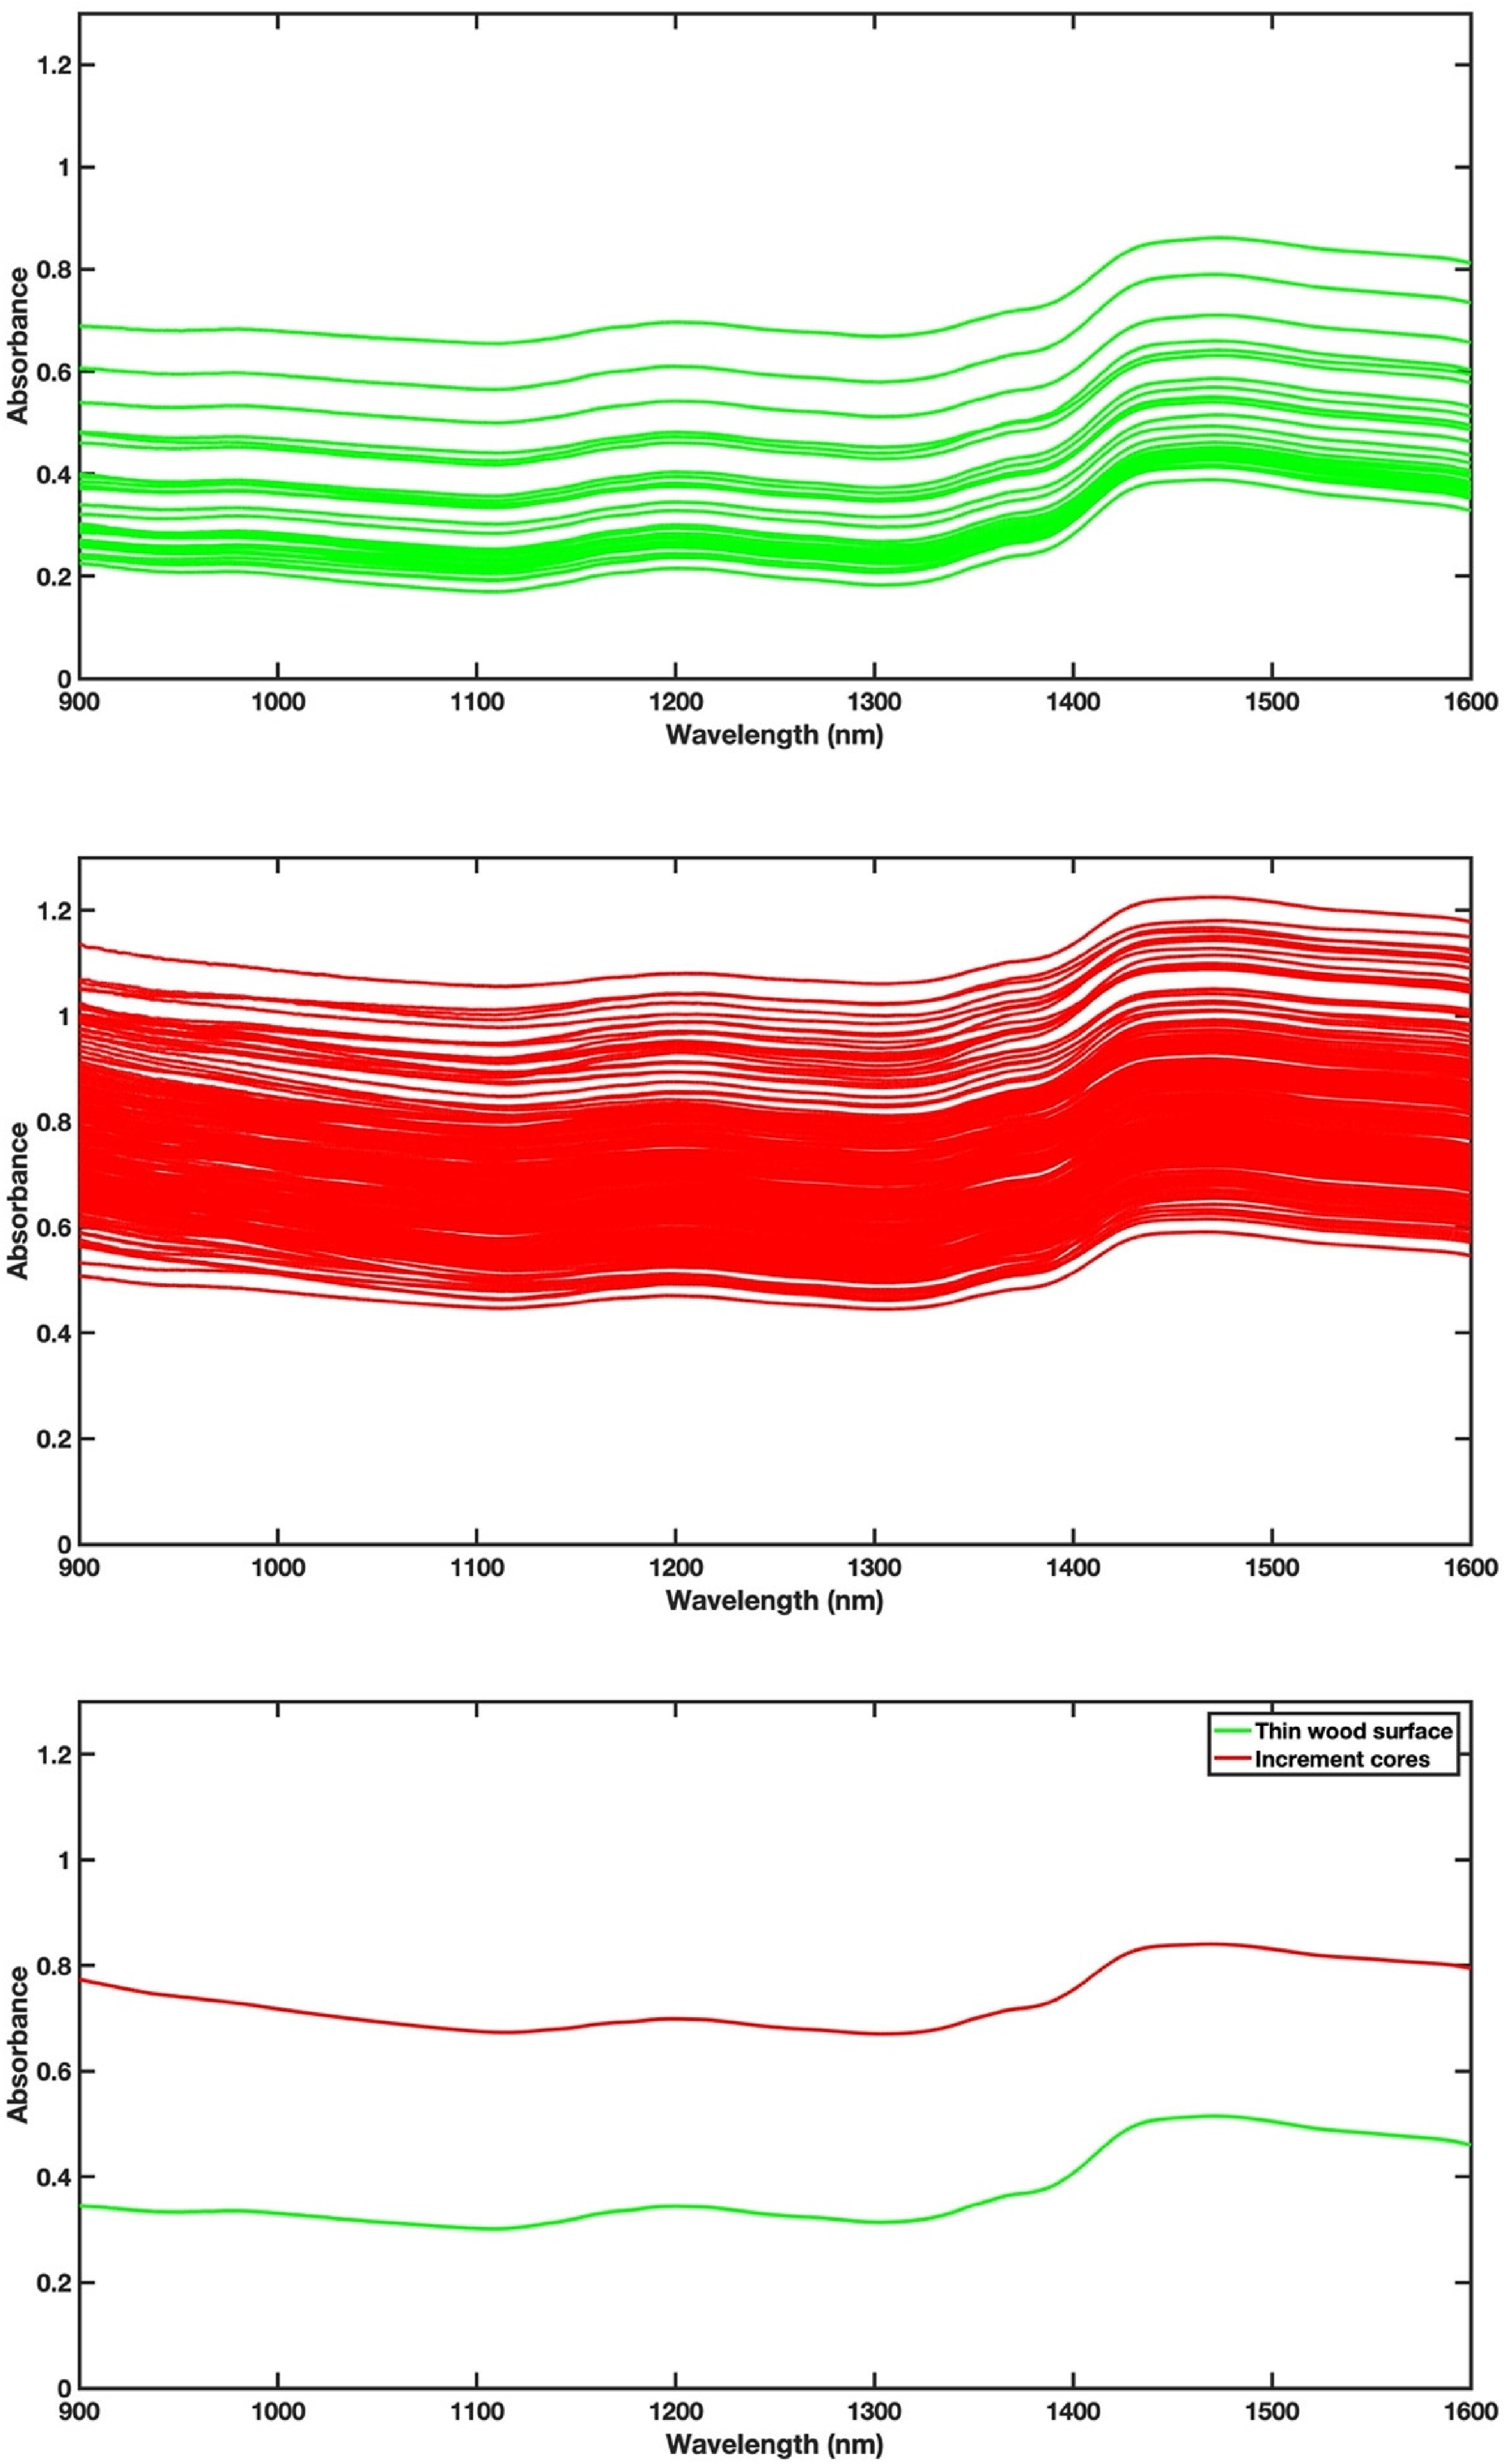
(a) Spectra data from thin wood surface samples (n = 30) in green, (b) Spectra data from increment core samples (n = 211) in red, and (c) mean spectra data from thin wood surface and increment cores samples.
The result of CV-PLSR analysis for thin wood surface, increment cores samples, and increment cores samples from average density on each tree showed that the best R2CV values obtained are from spectra pre-processed with 1st der. with 25 sp (Savitzky–Golay polynomial), as shown in Tables 1 to 3. These pre-processed spectra showed consistently high values of R2CV and a smaller number of LVs from the analysis for almost three sampling types. The R2CV values are 0.40 (thin wood surface samples), 0.34 (increment core samples), and 0.21 (increment core samples from average density on each tree).
Pre-processing spectra treatment using the CV-PLSR of thin wood surface samples.
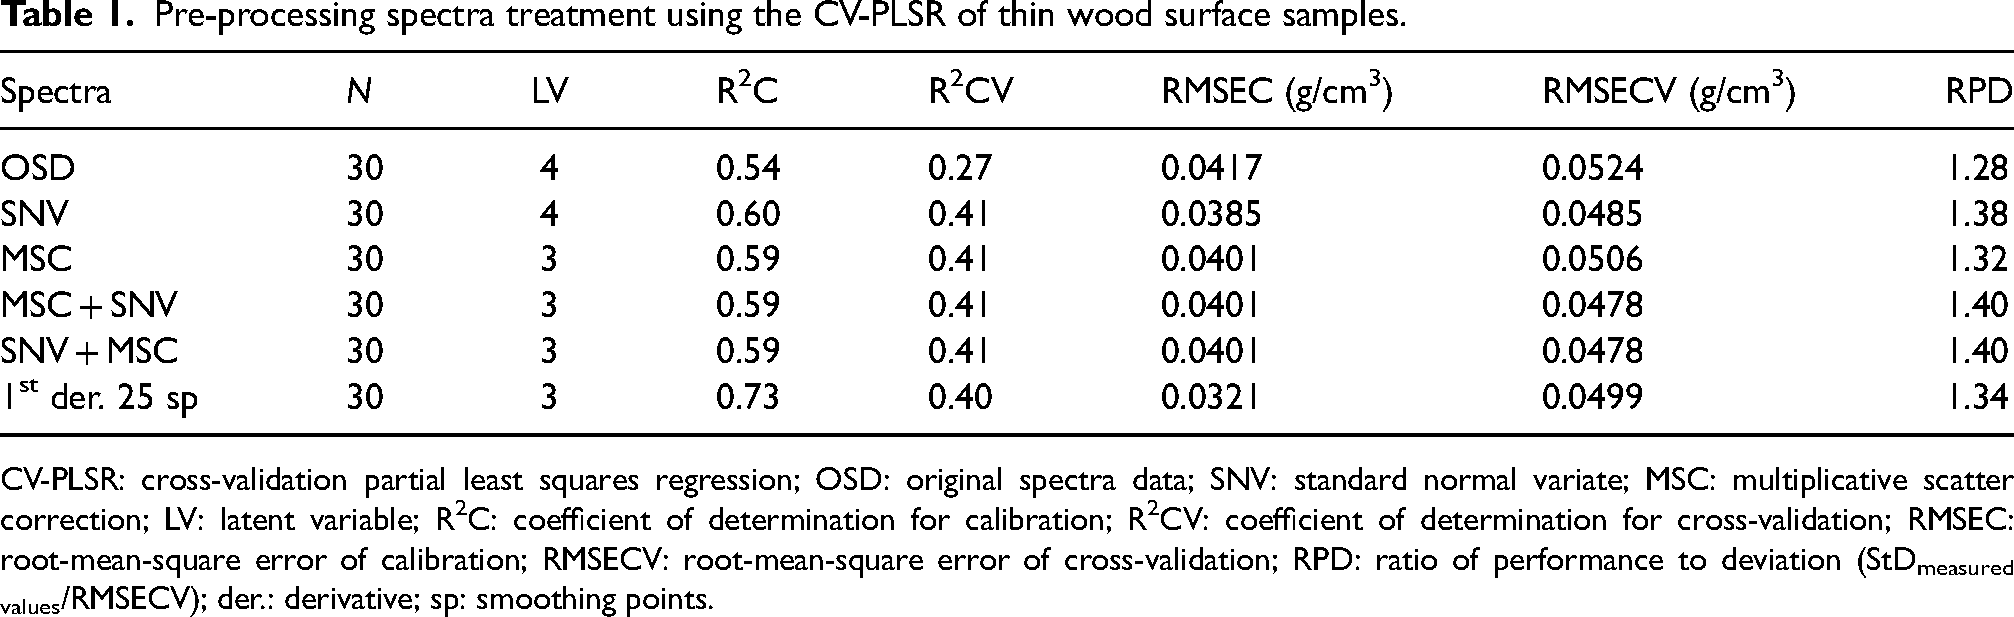
CV-PLSR: cross-validation partial least squares regression; OSD: original spectra data; SNV: standard normal variate; MSC: multiplicative scatter correction; LV: latent variable; R2C: coefficient of determination for calibration; R2CV: coefficient of determination for cross-validation; RMSEC: root-mean-square error of calibration; RMSECV: root-mean-square error of cross-validation; RPD: ratio of performance to deviation (StDmeasured values/RMSECV); der.: derivative; sp: smoothing points.
Pre-processing spectra treatment using the CV-PLSR of increment core samples.
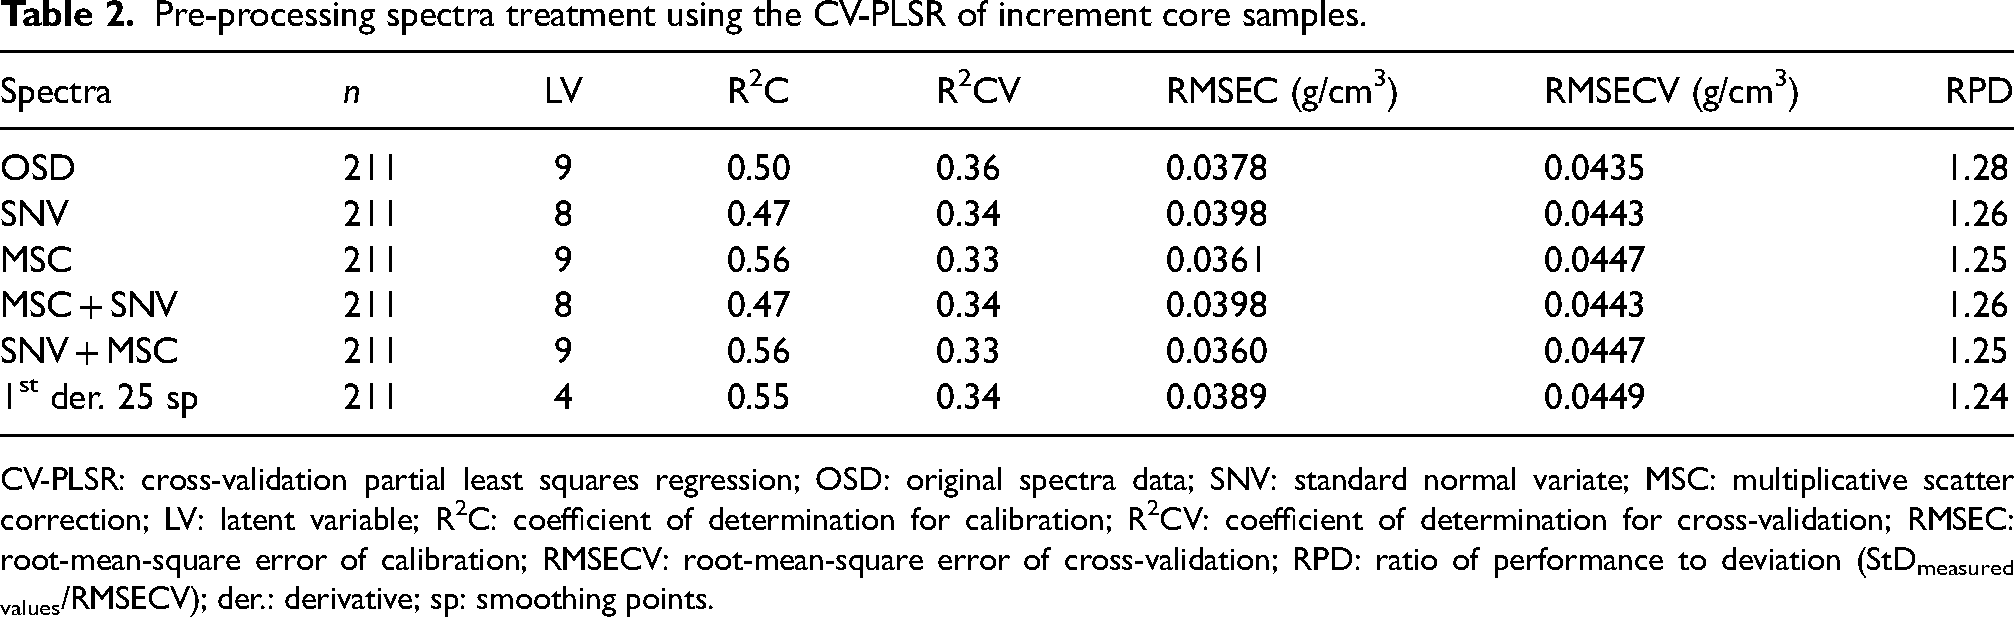
CV-PLSR: cross-validation partial least squares regression; OSD: original spectra data; SNV: standard normal variate; MSC: multiplicative scatter correction; LV: latent variable; R2C: coefficient of determination for calibration; R2CV: coefficient of determination for cross-validation; RMSEC: root-mean-square error of calibration; RMSECV: root-mean-square error of cross-validation; RPD: ratio of performance to deviation (StDmeasured values/RMSECV); der.: derivative; sp: smoothing points.
Pre-processing spectra treatment using the CV-PLSR of increment core samples from average density on each tree.
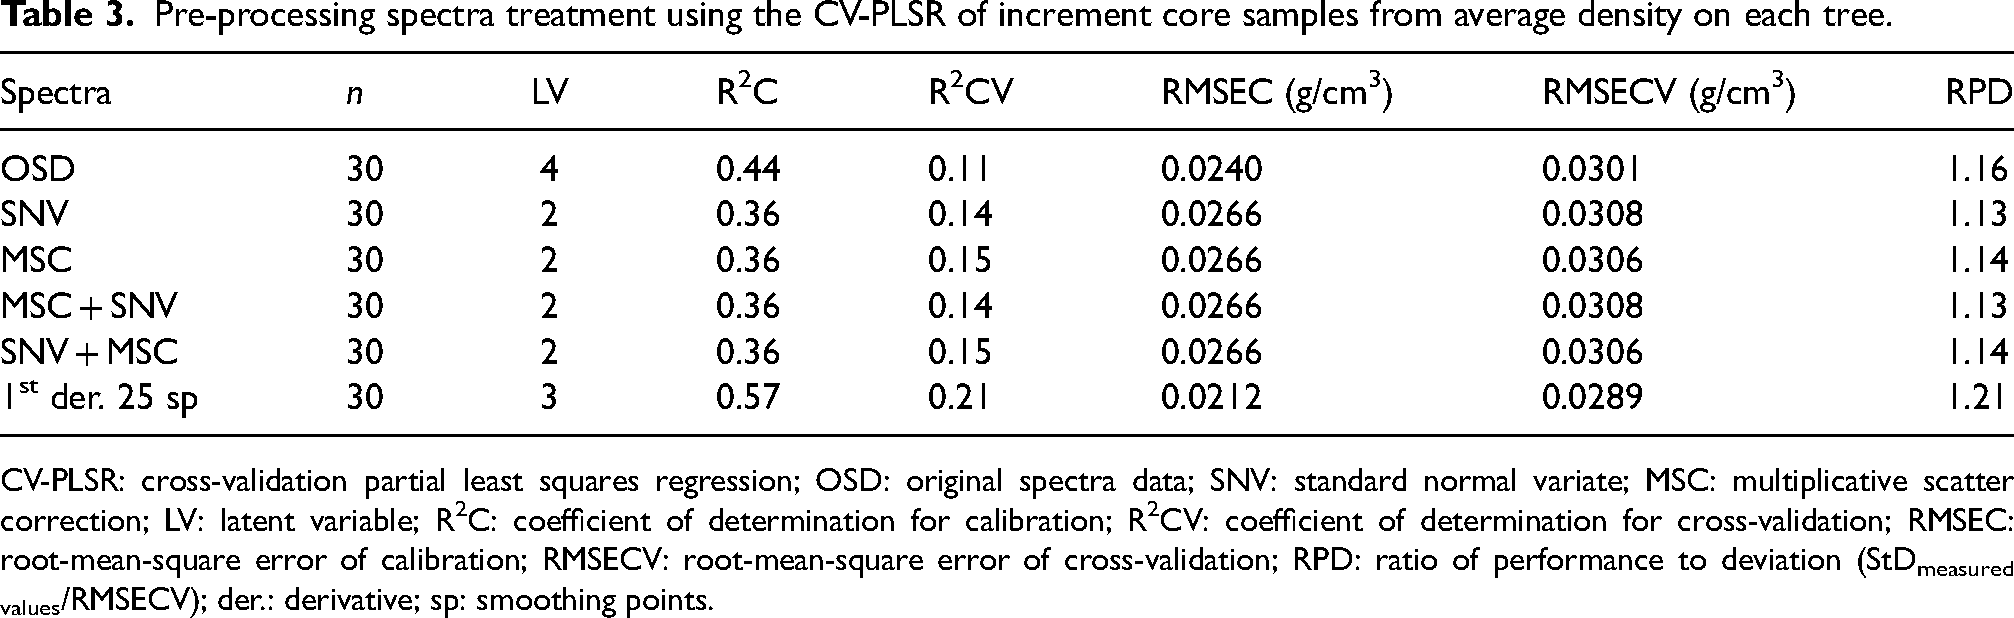
CV-PLSR: cross-validation partial least squares regression; OSD: original spectra data; SNV: standard normal variate; MSC: multiplicative scatter correction; LV: latent variable; R2C: coefficient of determination for calibration; R2CV: coefficient of determination for cross-validation; RMSEC: root-mean-square error of calibration; RMSECV: root-mean-square error of cross-validation; RPD: ratio of performance to deviation (StDmeasured values/RMSECV); der.: derivative; sp: smoothing points.
R2CV values obtained from all CV-PLSR analyses for all spectra in this research have the highest value of <0.50. This R2CV value is generally considered a weak or low effect value. This is due to many things, such as the high variation of samples (30 trees), mixed surface samples of increment cores (transversal with radial), or even the broader diameter of NIR light beam than the diameter of increment cores samples for NIR spectra measurements. This weak statistics of the R2CV value in this research is reciprocal to the result from Jones et al., 28 where density has the weakest statistics of partial least squares regression than microfibril angle and stiffness properties using increment cores tested by many instruments of NIR spectroscopy. Mixed surface samples (transversal and radial) and smaller sample sizes of increment core could be stated as the limitation of this research. Then, the number of samples for thin wood surface samples is also a limitation for constructing a prediction model. A number of samples for analysis could be added for both sample types of increment core and thin wood surface.
Schimleck et al. 22 resulted in a coefficient of determination for prediction (R2P) around 0.37 (increment cores samples from dbh of 1.30 m height) for the basic density prediction model, observed from the figure of the paper. This R2P value is <0.50 and is very close to the R2CV value from increment core samples in this research (0.33–0.36). This proved that making a density prediction model from increment core samples by NIR spectroscopy is problematic for producing high R2P/R2CV values. We hypothesise that this is caused by the smaller size of the cores emitted by the wider diameter of the NIR light beam. This is supported by higher R2CV value results from thin wood surface samples for the density prediction model (0.40 compared to 0.34). The R2CV value from increment core samples is still higher than the R2CV value from increment core samples from average density on each tree (0.34 compared to 0.21).
We also tried to predict density by differentiating wood samples according to the class diameter (CD) of the trees. Analysis of the density prediction from increment core samples for five class diameters in these sampling trees was done only by using spectra with pre-treatment of 1st der. with 25 sp (Savitzky–Golay polynomial) as chosen from analysis results before. The analysis values are chosen from the LV of 3 for all spectra from five class diameters. The result of the analysis is shown in Table 4.
Analysis on the 1st der. with 25 sp spectra pre-treatment using CV-PLSR from increment core samples for five class diameters.
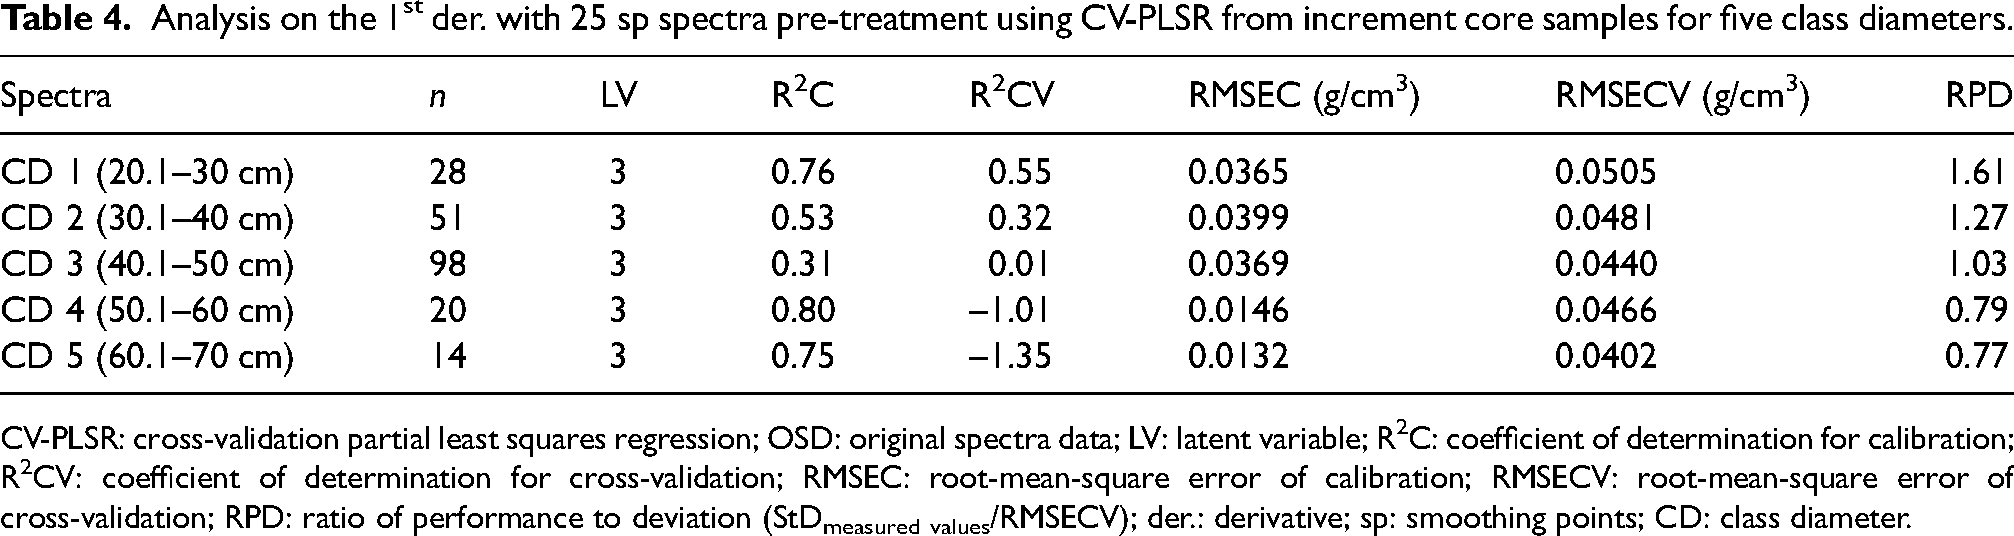
CV-PLSR: cross-validation partial least squares regression; OSD: original spectra data; LV: latent variable; R2C: coefficient of determination for calibration; R2CV: coefficient of determination for cross-validation; RMSEC: root-mean-square error of calibration; RMSECV: root-mean-square error of cross-validation; RPD: ratio of performance to deviation (StDmeasured values/RMSECV); der.: derivative; sp: smoothing points; CD: class diameter.
The analysis showed that the best R2CV value obtained is from CD 1 (0.55) spectra with a high RPD value of 1.61. This is followed by a gradual decrease in R2CV and RPD values for higher CD values. This R2CV value obtained is more significant than the R2P (0.50) from Schimleck et al.. 22 A scatter plot of the measured and predicted density values from this analysis is shown in Figure 5. A new approach sampling by classifying the CD increment core samples gave a small improvement in the density prediction accuracy by increment core sampling for the NIR spectroscopy method in wood research. It is obtained by increment core samples for CD 1 (diameter trees of 20.1–30 cm).
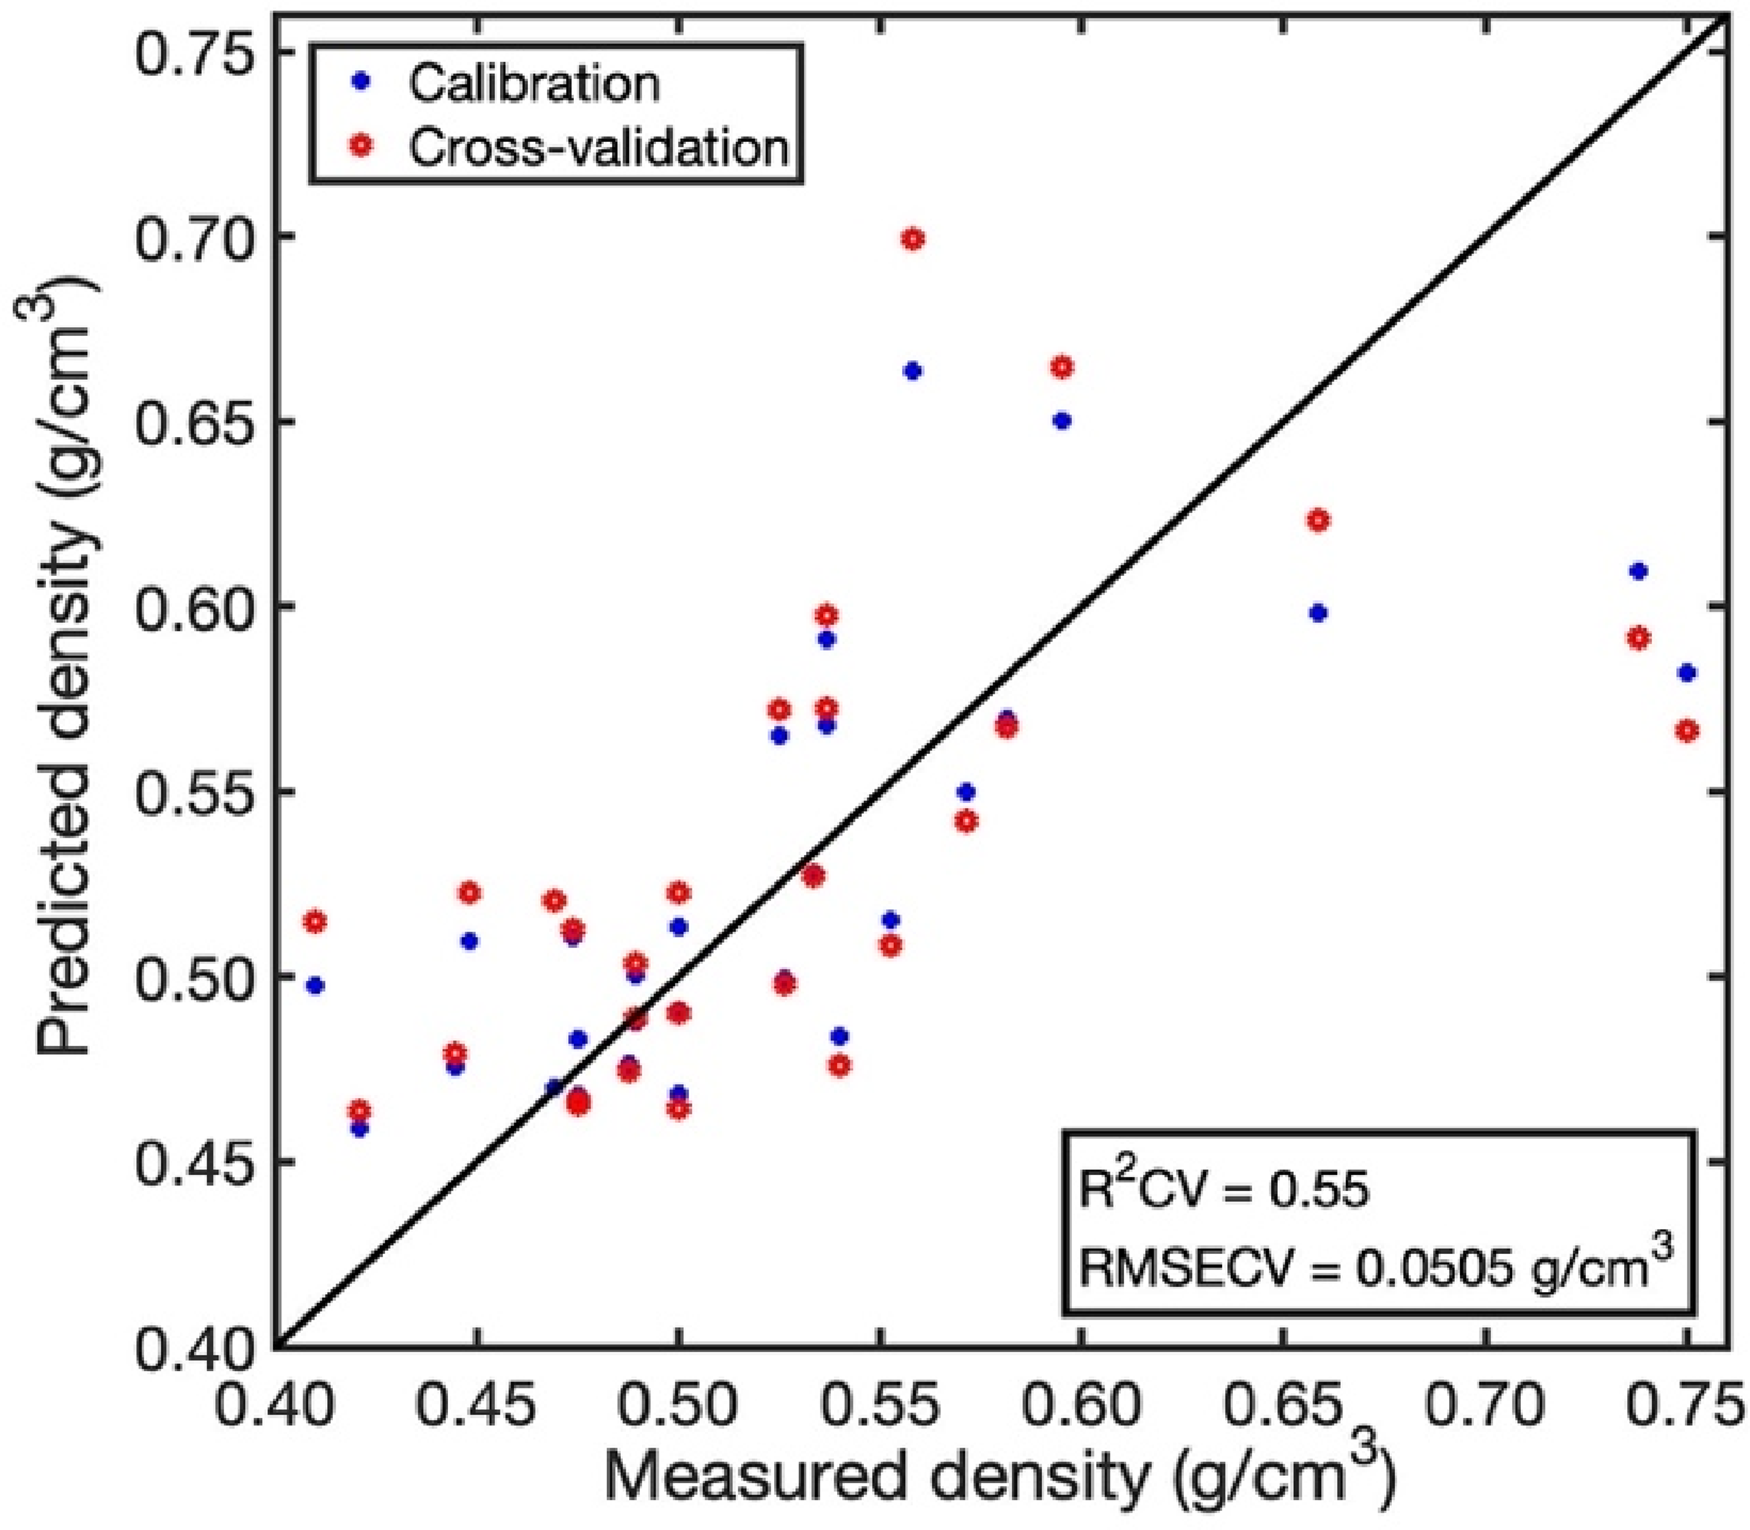
Scatter plot of the measured and predicted density values using spectra pre-treated by the first derivative with 25 smoothing points of class diameter (CD) 1.
Conclusion
Using increment cores and thin wood surface samples of Platinum teakwood stands by NIR spectroscopy in this research is the new approach for predicting density explained in detail after Schimleck et al.. 22 The density prediction model resulted in a similar result to the previous one with the best consistent R2CV from spectra pre-processed by 1st der. with 25 sp (0.40, 0.34, and 0.21 for thin wood surface samples, increment core samples, and increment core samples from average density on each tree). This new approach faced two main challenges: the mixed wood surface of NIR spectra acquisitions on increment core samples (transversal and radial surface) and wider NIR light beam diameter than the increment core samples’ diameter. Density variation in the radial direction of the wood stem is also supposed to have significant effects on the density prediction model result. The following density prediction model is better on the R2CV value when it uses CD 1 (diameter from 21 to 30 cm) increment core samples from the 1st der. with 25 sp spectra by R2CV value of 0.55 for the number of LV (3) and RPD value of 1.61. It is a bit of improved prediction accuracy for increment core samples for density prediction by the NIR spectroscopy method. According to this research, it is recommended to apply increment core sampling for density prediction using the NIR spectroscopy method in living standing trees for other species using sampling trees with dbh between 21 and 30 cm for better prediction accuracy. Thin wood surface sampling is also suggested to be done as supporting data.
Footnotes
Declaration of conflicting interests
The authors declared no potential conflicts of interest with respect to the research, authorship, and/or publication of this article.
Funding
The authors disclosed receipt of the following financial support for the research, authorship, and/or publication of this article: This research was partly supported by DIPA Prioritas Nasional Deputi Bidang Ilmu Pengetahuan Hayati Lembaga Ilmu Pengetahuan Indonesia (LIPI) Tahap Dua 2021.