
Abstract
Mural cells are essential for maintaining the proper functions of microvasculatures. However, a key challenge of microvascular tissue engineering is identifying a cellular source for mural cells. We showed that in vitro, circulating fibrocytes (CFs) can (1) shear and stabilize the microvasculatures formed by vascular endothelial cells (VECs) in a collagen gel, (2) form gap junctions with VECs and (3) induce basement membrane formation. CFs transplanted into nude mice along with VECs in either collagen gel or Matrigel exhibited activities similar to those mentioned above, that is, sheathing microvasculatures formed by VECs, inducing basement membrane formation and facilitating the connection of the engineered microvasculatures with the host circulation. Interestingly, the behaviour of CFs also differs from that of human brain vascular pericytes (HBVPs) in vitro, which often infiltrate the lumen of capillary-like structures in a mosaic pattern, actively proliferate and exhibit lower endocytosis and migration capacities. We concluded that CFs are a suitable cellular source for mural cells in the construction of tissue-engineered microvasculatures.
Introduction
Mural cells, often referred to as pericytes, are essential for maintaining the functions of microvasculatures, which include precapillary arterioles, capillaries and postcapillary venules. For example, pericytes are involved in the assembly of the basement membrane (BM) necessary for withstanding the 5–10 mm Hg pressure difference between the blood and tissue fluid. In addition, pericytes stabilize the microvasculature via crosstalk with vascular endothelial cells (VECs) via paracrine factors, such as transforming growth factor (TGF)-β, angiopoietin-1 and Wnt7a/b, which are deposited in the proteoglycan coating of collagen IV fibres of the BM lamina densa. Furthermore, pericytes regulate blood flow via relaxation and contraction of the microvasculature; changes in microvascular flow are mediated by smooth muscle actin-alpha (SMA-α) upon the sensing of systemic or local cues from VECs via gap junctions. 1 Pericyte-mediated regulation of blood flow is important for organ homeostasis, especially under stress conditions.
Despite considerable efforts,2–4 investigators have had only limited success in establishing functional yet stable microvasculature structures from mural cells.5–7 Coculture of the brain or retinal pericytes with VECs indeed leads to the development of microvasculatures with evident formation of a BM. 8 However, these pericytes have limited potential for the fabrication of tissue-engineered microvasculatures for non-native tissues because of (1) the infeasibility of using the brain and retina as donor sites of pericytes; (2) their intrinsic phenotypic differentiation (e.g. their high proliferation capacity results in vascular regression; and (3) their high instability accompanied by multipotent differentiation into fat, bone, or muscle cells.9,10). In addition, the lack of specific markers for pericytes further complicates the isolation of tissue-specific microvascular pericytes. Thus, the critical function of mural cells (pericytes) and the difficulties limiting their use for tissue engineering have prompted the search for another cell type that could be used to construct native-like microvascular networks and prevascularized structures. 11
Adipose-derived stem cells (ADSCs) and bone marrow stromal cells (BMSCs) have been the most extensively investigated alternatives to pericytes. Following coculture with VECs in a collagen gel, both ADSCs and BMSCs were found to migrate to the surface of the microvasculatures formed by VECs and to enhance tube formation.12,13 Moreover, BMSCs induce quiescence in VECs. 14 However, there is no evidence that these cells can induce BM formation from VECs,14,15 and more importantly, no study has confirmed the function of the microvasculatures constructed with these cells.
We showed that bone marrow-derived circulating fibrocytes (CFs), which are characterized by both inflammatory cells and mesenchymal cells and mesenchymal cells, might be one of the origins of pericytes. 16 We further demonstrated that CFs stabilized newly formed blood vessels in vivo and in vitro. 17 Thus, we hypothesize that CFs may serve as seed cells for pericytes in the construction of tissue-engineered capillaries. To verify this hypothesis, we cocultured VECs and CFs in three-dimensional collagen or Matrigel and used an intramuscular injection model in nude mice and a cranial defect model in nude rats to investigate whether the microvessels constructed from VECs and CFs possess the structure and function of capillaries both in vivo and in vitro.
Materials and methods
Animals
Eight- to 10-week-old nude mice were purchased from the Animal Center of Fourth Military Medical University. Seven-week-old nude rats were purchased from Beijing Charles River Experimental Animal Technology Co., Ltd. All animal-related procedures were performed in accordance with the NIH Guide for the Care and Use of Laboratory Animals and were approved by the Institutional Animal Care and Use Committee of Xi’an Jiaotong University.
Surgical procedures
The animals were anesthetized via an intraperitoneal injection (3 mg/kg body wt) of pentobarbital sodium. The surgical site was shaved and scrubbed with iodine. To establish the calvarial defect model, an incision was made in the sagittal plane across the cranium, and a full-thickness flap was reflected to expose the calvarial bone. A standardized circular transosseous defect, 8 mm in diameter, was created on the cranium with a trephine drill (Sirona, T3) and was copiously irrigated with saline. After removal of the trephined calvarial disk, various cell–collagen gel suspensions were applied to the defect sites.
The animals were divided into six groups of six animals each for treatment with various cell suspensions and allowed to heal for 4 or 8 weeks. The following groups were established: (1) blank control; (2) collagen gel and calcined bone (CB); (3) collagen gel, bone marrow stem cells (BMSCs) and CB; (4) collagen gel, BMSCs, VECs and CB; (5) collagen gel, BMSCs, VECs, CFs and CB; and (6) collagen gel, BMSCs, VECs, HBVPs and CB.
Microcomputed tomography (micro-CT)
The samples were subjected to micro-CT scanning (Pannoramic MIDI, 3D HISTECH) with the following parameters: 50 kV tube voltage, 0.5 mm aluminium filter, 500 μA source current, 875 ms exposure time, 9 μm isotopic resolution and the acquisition of three projection images per 0.3° field of view (FOV) covering the entire skull.
Three-dimensional (3D) reconstruction and analysis of CT images
For analysis of the micro-CT datasets, volumetric data were reconstructed with NRecon/InstaRecon CBR Server Premium software. Analysis and segmentation of the micro-CT images were performed with Mimics software (Mimics Medical 21.0).
Cell culture
Human CFs (fibrocytes) were isolated and purified as previously described. 16 The purity of the resulting enriched fibrocyte populations was >95%, as determined by collagen I and CD34 staining. Human umbilical vascular endothelial cells (HUVECs; Cat. No. 1000, ScienCell Research Laboratories, USA), human bone marrow-derived mesenchymal stem cells (BMSCs; Cat. No. 7500, ScienCell Research Laboratories, USA) and human brain vascular pericytes (HBVPs; Cat. No. 1200, ScienCell Research Laboratories, USA) were cultured according to the supplier’s protocol. In brief, VECs were cultured in basal endothelial cell medium (ECM) supplemented with 5% foetal bovine serum (FBS; Cat. No. 0025), 1% Endothelial Cell Growth Supplement (Cat. No. 1052) and 1% penicillin/streptomycin solution (Cat. No. 0503). BMSCs were cultured in mesenchymal stem cell medium (MSCM, Cat. #7501) supplemented with 5% foetal bovine serum (FBS; Cat. No. 0025) and 1% penicillin/streptomycin solution (Cat. No. 0503). HBVPs were cultured in pericyte medium (PM) supplemented with 2% FBS (Cat. No. 0010), 1% Pericyte Growth Supplement (Cat. No. 1252) and 1% penicillin/streptomycin solution (Cat. No. 0503). The cells were used at passage 4 or 5.
Histological staining
A rabbit anti-Laminin polyclonal antibody and a rabbit anti-Collagen IV antibody were purchased from Abcam, Inc. (Cat. no. ab11575 and ab6586, Cambridge, MA). A biotinylated goat anti-rabbit antibody was purchased from Santa Cruz Biotechnology, Inc. (Cat. No. sc-2040). Streptavidin-conjugated Alexa Fluor® 594 was purchased from Life Technologies/Invitrogen (Cat. No. S32356, Grand Island, NY, USA). Immunofluorescence (IF) staining was performed as previously described.16,18 Toluidine blue staining of the vasculature in the collagen gel was performed as previously described. 17
Cranial bone tissue was serially sectioned, histological sections were subjected to Masson’s trichrome staining, and selected samples were subjected to IF staining with anti-CD13 (ab7417) and anti-CD34 (ab81289) antibodies. Then, representative histological sections were used for analyses.
Transwell coculture of fibrocytes, HBVPs and VECs
Purified human CFs (1 × 10⁵ cells/well) or HBVPs (4 × 10⁴ cells/well) were cultured in six-well plates (Cat. No. 3516; Corning Life Science, Lowell, MA, USA). VECs (2 × 10⁴ cells/insert) were cultured in transwell inserts (0.4 μm pore size, Cat. No. 3491, Corning Life Science). CFs and VECs were cultured separately for 2 days before the coculture experiments were initiated. The cells were subsequently cultured in different media for different experiments. For the DNA microarray and proteomic analyses, the cells were cocultured in M199 + 5% FBS for 24 h and 48 h, respectively. For the proliferation assay, the cells were cocultured with M199 + 2% FBS + 40 ng/mL bFGF or 40 ng/mL VEGF. For the apoptosis assay, the cells were cocultured in M199 + 2% FBS for 24 h. Portions of the VECs and CFs were cultured separately in the inserts and culture plates, respectively, as the control groups. The cells were lysed to isolate mRNA or protein for quantitative real-time PCR (qRT-PCR), DNA microarray, immunoblotting and proteomic analyses.
DNA microarray analysis
DNA microarray analysis was performed with the Illumina HumanWG-6_V3 microarray (Illumina Inc., CA) according to the Illumina manual. In brief, CFs or VECs were either cultured alone or cocultured in transwell plates for 24 h, after which the cells were lysed with TRIzol reagent (Thermo Fisher Scientific, PA). RNA was extracted with TRIzol prior to clean-up and DNase I treatment with a QIAGEN RNeasy Kit (QIAGEN, MD) as specified in the kit. Quality control was performed with an Agilent Bioanalyzer. Biotinylated cRNAs were prepared with the Ambion MessageAmp Kit for Illumina Arrays (Thermo Fisher Scientific, PA). Labelled cRNA was hybridized to the probes on the chip, and the chip was washed according to the standard Illumina hybridization protocol. The chip was then scanned according to the Illumina protocol. The data were normalized via quantile normalization in GenomeStudio (Illumina). The nonnormalized and normalized data were deposited in the NCBI Gene Expression Omnibus (https://www.ncbi.nlm.nih.gov/geo/) under accession number GSE108626.
Collagen gel culture
A collagen gel was prepared as previously described. 17 In brief, a Collagen I solution (3.0 mg/mL Collagen I, Advanced BioMatrix, Inc., San Diego, CA, USA) was mixed with 10× M199 solution (Sigma Aldrich) and 0.2 M HEPES (pH 9.0, Sigma-Aldrich) at a ratio of 8:1:1. All the solutions were kept on ice to prevent gel formation. VECs and fibrocytes were diluted to 1 × 10⁷ cells/mL in M199 supplemented with 1% foetal calf serum (FCS), 40 ng/mL VEGF, 40 ng/mL bFGF and 100 U/mL penicillin and streptomycin. In the VEC-only group, the VEC suspension was mixed with the collagen gel solution and ECM at a ratio of 1:8:1. In the VEC + CF group, the VEC suspension, fibrocyte suspension, ECM and collagen gel solution were mixed at a ratio of 1:X:(1 − X):8. The value of X was determined by the ratio of VECs to CFs in the indicated groups. The gel was incubated for 30 min at 37°C without CO2, and M199 supplemented with 1% FCS, 40 ng/mL VEGF, 40 ng/mL bFGF, and 100 U/mL penicillin and streptomycin was carefully added on top of the gel.
To detect gap junctions, CFs and VECs were labelled with the Vybrant® CFDA SE cell tracer (Cat No. V12883, Life Technologies) and the Vybrant® DiI Cell-Labeling cell tracer, respectively, according to the manufacturer’s protocol.
The collagen preparation described above was spread in a confocal dish, and CFs and VECs (labelled red and green, respectively) were seeded on the collagen surface. The cells were then divided into the following four groups for intercellular junction staining: (1) blank control, (2) CFs alone, (3) VECs and (4) CFs + VECs. The cells in each group were stained with anti-GJA4 (Abcam, ab181701) and anti-GJC1 (sc-374354, Santa Cruz Biotechnology, Inc.) antibodies separately.
Transmission electron microscopy (TEM) and scanning electron microscopy (SEM)
Collagen gels were harvested and fixed with buffer containing 1% paraformaldehyde + 2.5% glutaraldehyde + 0.1 M cacodylate. A portion of the collagen gel was processed for TEM via a standard protocol, and another portion of the gel was processed for SEM via a standard protocol with critical point drying to preserve the structure of the gel.
Immunoblot analysis
The cell lysates were subjected to immunoblot analysis with an anti-laminin antibody, an anti-COL4 antibody and an anti-glyceraldehyde-3-phosphate dehydrogenase (GAPDH) antibody (Santa Cruz Biotechnology, Inc.) as previously described. 18
qRT-PCR
qRT-PCR was performed as previously described 18 (see details in the Supplemental Materials and Methods). The expression levels of the target genes were normalized to the expression level of GAPDH, which was measured concurrently as described by Pfaffl. 19
Sample preparation for liquid chromatography–mass spectrometry (LC-MS)
The cell pellets were subjected to lysis and protein extraction with a buffer composed of 8 M urea, 50 mM Tris (pH 8.0), 75 mM NaCl, 1 mM MgCl2 and 500 units of benzonase. Approximately 1 mg of extracted total protein was reduced with dithiothreitol (DTT) and subsequently alkylated with iodoacetamide. The protein extracts were then subjected to proteolysis with the endoproteinase Lys-C (Wako Chemicals, USA) for ~4 h at 37°C. The solution was diluted 4-fold with 25 mM Tris (pH 8.0) and 1 mM CaCl2, and the proteins were further digested with trypsin (Promega) for ~12 h at 37°C. Digestion was stopped by the addition of 0.4% trifluoroacetic acid (TFA), and the precipitate was isolated by centrifugation for removal.
LC–MS analysis
The samples were desalted on PepClean C18 spin columns (Pierce, Rockford, IL) according to the manufacturer’s directions and resuspended in aqueous 0.1% formic acid. Sample analysis was performed via reversed-phase liquid chromatography–tandem mass spectrometry (LC-MS/MS) with a Proxeon 1000 nano-LC system coupled to a Q Exactive mass spectrometer (Thermo Scientific, San Jose, CA). The Proxeon system was configured to trap peptides in a C18 column (3 cm, 100 μm i.d.) at a flow rate of 5 μL/min, with the flow diverted from the analytical column via a vent valve. Elution was performed by switching the valve to place the trap column in line with a C18 analytical column (25 cm, 75 μm i.d., 3.5 ⎧m particle size, 300 Å pore size). Analytical separation of all the tryptic peptides was achieved with a linear gradient of 2%–30% buffer B over 240 min at a flow rate of 250 nL/min; buffer A was aqueous 0.1% formic acid, and buffer B was acetonitrile in 0.1% formic acid.
LC-MS experiments were also performed in data-dependent acquisition mode with Full-MS (externally calibrated to a mass accuracy of <5 ppm and a resolution of 70,000 at m/z 200), followed by higher-energy collisional dissociation (HCD)-MS/MS analysis of the 20 most intense ions. HCD-MS/MS was performed to dissociate peptides with a normalized collision energy of 27 eV in the presence of nitrogen as a bath gas. Single-shot LC-MS runs were performed on each cell line in biological triplicate.
Peptide and protein identification
The mass spectra were processed, and peptide identification was performed via the Andromeda search engine with MaxQuant software ver. 2.2.1 20 (Max Planck Institute, Germany). All protein database searches were performed against the UniProt human proteome derived from the UniProt assembly released in December 2012. Peptides were identified via a target-decoy approach in a combined database consisting of reverse protein sequences from the UniProt human proteome and the common Repository of Adventitious Proteins (cRAP) database. The cRAP database was accessed via the Global Proteome Machine (ftp://ftp.thegpm.org/fasta/cRAP). Peptide inferences were made with a false discovery rate (FDR) of 1%, whereas peptides were assigned to proteins with a protein FDR of 5%. A precursor ion mass tolerance of 20 ppm was used for the first search, allowing m/z retention time recalibration of precursor ions, which were then subjected to a main search using a precursor ion mass tolerance of 6 ppm and a product ion mass tolerance of 0.5 Da. The search parameters included up to two missed cleavages at KR motifs in the sequence, oxidation of methionine and protein N-terminal acetylation as a dynamic modification. Carbamidomethylation of cysteine residues is considered a static modification. Protein identification was reported after filtering for reverse and contaminant entries and assignment of the leading razor peptides.
Label-free quantification (LFQ) and data analysis
LFQ was performed on the basis of the peak area. The measured area under the curve of m/z and the retention time-aligned extracted ion chromatogram of a peptide were obtained via MaxLFQ, the LFQ algorithm in MaxQuant (ver. 1.3.5). 21 All replicates for each cell line were included in the experimental design for LFQ, with peptide-level quantitation performed using unique and razor peptide features corresponding to identifications filtered with a posterior error probability (PEP) of 0.06, peptide FDR of 0.01 and protein FDR of 0.02. All downstream data processing and visualization steps were performed in Perseus (Ver. 1.5.0.9). Protein quantification and statistical analysis were performed on proteins via two-sample t tests with a threshold p value of ⩽0.05, and an S0 parameter of 0.01393938383837373537373737363535343332293231302929 was used to report statistically significant differences in protein expression between cell types. 22 The raw data were deposited in the PRoteomics IDEntifications Database (PRIDE; http://www.ebi.ac.uk/pride) under project accession no. PXD006763.
Statistical analysis
The data are presented as the means ± standard deviations (SDs). The means were compared by analysis of variance (ANOVA), followed by t tests with the Bonferroni correction for multiple comparisons.
Results
CFs maintain microvasculatures formed by VECs in a collagen gel
To evaluate the response of CFs and VECs in a 3D environment, freshly isolated CFs and VECs (HUVECs, passage 4) were cultured for 3 days in collagen gels (3 mg/mL). SEM revealed that the CFs in the CF-alone group remained isolated within the gel and presented many ruffle-like structures, in contrast to the relatively smooth surface of VECs in the VEC-alone group, which presented no obvious protrusions (Figure 1(a)). Closer examination via TEM revealed that the CFs in the CF-only group contained fat granules with a diameter of approximately 500 nm and large lysosomes (i.e. dense granules) with diameters ranging from 100 to 500 nm (Figure 1(b)). These observations indicate that CFs likely use fatty acids as the major energy source and that these CFs have a high phagocytic capacity. 15 The VECs in the VEC-only group on the collagen gel started to aggregate and formed luminal structures with a wall thickness of 0.1–2 µm (Figure 1(b)). Following coculture of VECs with CFs in a collagen gel (VEC + CF group), the CFs migrated to the external surface of the VEC microtubes (Figure 1(c)); within 3 days, the CFs sheathed the tubes and formed strong connections with the VECs, as confirmed by TEM and SEM (Figure 1(a) and (b)).

CFs migrated to the surface of VEC tubes: (a) CFs and VECs were either cultured alone or cocultured (VECs in the upper panel) in collagen gel for 3 days, after which the collagen gel was processed for SEM. (b) Culture was conducted as described in (a), but the collagen gel was processed for TEM. The upper left panel shows CFs cultured alone, the upper right panel shows VECs cultured alone and the lower panels show cocultured CFs and VECs. (c) Culture was conducted as described in (a), but VECs were infected with ad-GFP, and CFs were labelled with the Vybrant® DiI Cell-Labeling cell tracer. The collagen gel shown in the lower panel was processed for toluidine blue staining.
CFs establish gap junctions with VECs
To better visualize the spatial interactions between CFs and VECs in the collagen gel, CFs and VECs were labelled with the Vybrant® CFDA SE cell tracer (green) and Vybrant® DiI Cell-Labeling cell tracer (red), which can be transported between cells only via gap junctions. Interestingly, Vybrant® DiI in VECs translocated to adjacent CFs, as observed by confocal microscopy, but Vybrant® CFDA SE was not detectable in VECs (Figure 2(a)). This observation indicated that CFs and VECs established unidirectional gap junctions from VECs to CFs. In addition, the Vybrant® DiI transported into the CFs was distributed continuously to the protrusions of the CFs that were in contact with the VECs (Figure 2(b)), excluding the possibility that the cell tracer was phagocytosed by the CFs. The formation of gap junctions between CFs and VECs was further confirmed by TEM imaging (Figure 2(c)), which revealed the parallel alignment of the cell membranes of adjacent VECs and CFs that formed gap junctions (Figure 2(c), arrows); the width of the gaps between these cells was approximately 3 nm.

CFs and VECs formed unidirectional gap junctions from VECs to CFs. (a and b) CFs were labelled with the Vybrant® CFDA SE cell tracer, and VECs were labelled with the Vybrant® DiI Cell-Labeling cell tracer. CFs and VECs were cocultured in a collagen gel for 3 days. The collagen gel was fixed with 4% paraformaldehyde and examined via laser confocal microscopy. The right panel in (a) shows a schematic diagram of the microvasculature formed by CFs and VECs. The diagram in (a) was rendered with Volocity (Version 6.3, Perkin Elmer). (c) Culture was conducted as described in (a), but the collagen gel was processed for TEM. The dashed lines indicate the pseudopodia of the CFs, and the black arrowheads indicate gap junctions.
We then investigated the components of gap junctions formed between VECs and CFs. DNA microarray analysis and qRT-PCR analysis (Supplemental Table 1 and Supplemental Figure 1(a) and (b) revealed that following coculture, GJA4 expression in VECs was significantly increased and that GJC1 expression in CFs was slightly increased. To determine the participation of GJA4 and GJC1 in the formation of unidirectional gap junctions, VECs or CFs were incubated with anti-GJA4 or anti-GJC1 antibodies, and the VEC-to-CF transport of Vybrant® DiI was evaluated. Antibody-mediated blockade of GJA4 in VECs or GJC1 in CFs inhibited the transport of Vybrant® DiI from VECs to CFs (Supplemental Figure 1(c) and (d)). GJA4 blockade led to the transport of approximately 15% of the Vybrant® DiI dye, and GJC1 blockade led to the transport of approximately 21% of the Vybrant® DiI dye relative to the no-blockade controls. IF staining revealed that GJA4 was highly expressed in VECs but was expressed at lower levels in CFs. However, GJC1 expression was detected in both VECs and CFs (Figure 3). These results indicate that GJA4 in VECs and GJC1 in both CFs and VECs are essential components for the formation of unidirectional gap junctions between CFs and VECs.

Expression of GJA4 and GJC1 in CFs and VECs after coculture. CFs were labelled with the Vybrant® DiI cell tracer (red), and VECs were labelled with the Vybrant® CFDA SE cell tracer (green). Immunofluorescence staining was performed with antibodies against GJA4 and GJC1, and the secondary antibody used was sheep anti-rabbit Alexa FluorTM 647, whose pseudocolour was set to white. The red arrowheads indicate CFs, and the yellow arrowheads indicate VECs.
CFs induce BM formation in the microvasculatures formed by VECs
Given the importance of the BM in stabilizing the microvasculature, we next investigated whether the presence of CFs can induce BM formation between VECs and CFs. Both SEM and TEM revealed the presence of ultrafine extracellular matrix (ECM) fibres on the surface of the microvasculatures formed by VECs in coculture with CFs (Figure 4(a) and (b); in contrast, no ultrafine fibres were identified on the surface of VECs cultured without CFs. The morphology of these ultrafine fibres was consistent with that of type IV collagen, and the fibres were clearly distinguishable from type I collagen fibres. The typical diameter of these ultrafine ECM fibres was between 5 and 20 nm, whereas Col I fibres were 40–80 nm in diameter. Like type IV collagen fibres, these ultrafine fibres are spaced 20–100 nm apart and assemble into a mesh-like structure. To further determine whether these fibres were part of the BM, CFs and VECs were cocultured in collagen gel for 3 days and then fixed and processed without cell membrane permeabilization for IF staining of collagen IV and laminin. We detected both collagen IV and laminin on the surface of capillary-like structures in the VEC + CF group but not in the VEC-alone group (Figure 4(c)).

CFs induced basement membrane formation from VECs. (a) CFs and VECs were either cultured alone or cocultured in a collagen gel for 3 days, after which the collagen gel was processed for TEM. The white arrowheads indicate the basement membrane, and the yellow arrowheads indicate gap junctions. (b) Culture was conducted as described in (a), but the collagen gel was processed for SEM. The white arrowhead indicates the basement membrane. (c) Culture was conducted as described in (a), but the collagen gel was processed for immunofluorescence staining of Col IV (green) or laminin (red).
To further confirm the contribution of CFs to BM formation, we cocultured CFs and VECs in a transwell apparatus in which the CFs were seeded on the transwell membrane and the VECs were cultured in the bottom compartment. Following culture, we evaluated gene expression via DNA microarray and qRT-PCR analyses and assessed protein expression by immunoblotting. DNA microarray analysis revealed that the mRNA levels of collagen IV a1 and a2 (COL4A1, A2), laminins (LAMA4, B1 and C1) and nidogen 1 (NID1) in VECs in the VEC + CF group were significantly greater than those in the VEC-alone group. In addition, the mRNA expression levels of LAMB2 and LAMC1 in CFs in the VEC + CF group were significantly greater than those in CFs in the CF-alone group (Supplemental Table 2). These results were confirmed by qRT-PCR analysis (Supplemental Figure 2a). Significant increases in laminin protein (2.7 ± 0.31-fold) and collagen IV (1.4 ± 0.11-fold) expression were also detected in VECs in the VEC + CF group compared with VECs in the VEC-alone group. However, we did not detect any difference in laminin or collagen IV protein levels between cocultured CFs and CFs cultured alone (Supplemental Figure 2b). These data indicate that interactions between CFs and VECs increase the abundances of BM components and that VECs are the major contributors to these increases, despite the upregulation of certain laminins in CFs.
In the collagen gel, CFs exhibited regulatory effects on VECs similar to those exhibited by HBVPs
To determine whether CFs exhibit physiological activities similar to those of pericytes, we compared the ability of CFs and HBVPs to stabilize VEC microtubular structures, induce BM formation and form gap junctions with VECs. When VECs were cocultured with CFs or HBVPs directly on culture dishes, they aggregated together and formed cord-like structures (Figure 5a). However, coculture of VECs with either CFs or HBVPs in transwell plates blocked bFGF-induced VEC proliferation (Figure 5b). This finding is consistent with our previous research, which demonstrated that CFs inhibited the bFGF-induced proliferation of VECs through the paracrine secretion of thrombospondin-1 (THBS1). In this study, we observed that both CFs and HBVPs inhibited the bFGF-induced proliferation of VECs, which is very important for maintaining capillary homeostasis. In addition, CFs and HBVPs can stabilize the microvascular structure within three-dimensional collagen by inhibiting excessive microvascular proliferation when stimulated by growth factors and by preventing microvascular regression in the absence of growth factors. We then confirmed this observation via qRT-PCR analysis of proliferation-related mRNAs in VECs (Supplemental Figure 3). In cocultures with VECs in transwell plates, the number of CFs remained stable, whereas the number of HBVPs continually increased (Figure 5c). Both CFs and HBVPs significantly inhibited the 3D tubulogenesis of VECs in the collagen gel (p < 0.05, Figure 5(d)–(f)), but the density of capillary-like structures in the VEC + CF group was considerably greater than that in the VEC + HBVP group, especially after prolonged culture (e.g. 10 days) (p < 0.01, Figure 5(d)–(f)).

Both CFs and HBVPs inhibited the proliferation of VECs in 2D culture dishes and inhibited tube extension in a collagen gel. (a) VECs were labelled with the Vybrant® DiI cell tracer. HBVPs and CFs were either cultured alone or cocultured with VECs in culture dishes for 24 h and were then observed via fluorescence microscopy. (b) VECs were either cultured alone or cocultured with CFs (VECs + Fs) or HBVPs (VECs + HBVPs) in transwell plates and processed for proliferation assays with a CellTiter-Glo® Luminescent Cell Viability Assay Kit (Cat # G7570, Promega). *Indicates p < 0.05 versus VECs + CFs, and # indicates p < 0.05 versus VECs + HBVPs. (c), CFs or HBVPs were cocultured with VECs in transwell plates (VECs + CFs and VECs + HBVPs) and then processed as described in (b). *Indicates p < 0.05 versus VECs + CFs. (d and e) VECs were either cultured alone in a collagen gel or cocultured with CFs or HBVPs for 3 (d) or 10 days (e). The VECs shown in the upper panel were infected with ad-GFP, and the CFs or HBVPs were labelled with the Vybrant® DiI cell tracer; the collagen gel was processed for toluidine blue staining (middle panel) or SEM (lower panel). (f) The lumen areas in (d) and (e) were quantified. *Indicates p < 0.05 versus VECs, and # indicates p < 0.05 versus VECs + CFs.
Under serum-free culture conditions, VECs cocultured with CFs or HBVPs in transwell plates exhibited a greater tendency to aggregate and form cord-like structures (Supplemental Figure 4(a)), accompanied by reductions in apoptosis (percentage of Annexin V-positive VECs: 16.2 ± 2.5 in the VEC + CF group and 15.7 ± 3.7 in the VEC + HBVP group vs 31.2 ± 6.1 in the VEC-alone group) and necrosis (percentage of PI-positive VECs: 3.6 ± 1.1 in the VEC + CF group and 3.5 ± 2.1 in the VEC + HBVP group vs 9.1 ± 1.4 in the VEC-alone group) (Supplemental Figure 4(a)–(c). Interestingly, both CFs and HBVPs inhibited the regression of VEC tubes during prolonged culture (7 days) in collagen gel, even in the absence of growth factors (Supplemental Figure 4(d)). In contrast, VECs cultured alone dissociated from the endothelium by the seventh day of culture, despite the persistence of microchannels within the collagen gel.
Coculture of VECs with either CFs or HBVPs led to the assembly of a BM-like matrix on the surface of the VECs (Supplemental Figure 5(a)–(c)) and resulted in the formation of unidirectional gap junctions between VECs and both CFs and HBVPs (Supplemental Figure 5(d)).
CFs cocultured with VECs in the collagen gel tended to differentiate towards the pericyte lineage
CFs share many phenotypic characteristics with pericytes, fibroblasts and smooth muscle cells; thus, many researchers categorize these four cells into one cell type. In addition to their demonstrated similarity to HBVPs, CFs also exhibit properties distinct from those of HBVPs. The number of CFs remained relatively stable, but HBVPs proliferated continuously during coculture with VECs either in transwell plates (spatially separated) or in the collagen gel (in close contact). In the transwell coculture system, the number of HBVPs increased 4- to 5-fold after 3–5 days, whereas the number of CFs remained unchanged (Figure 5(c)). Proteomic analysis revealed greater expression of proliferation-related proteins (e.g. ILF3, CCT4, CCT7, NPN1 and FSCN1) in HBVPs than in CFs (Supplemental Figure 6(c)). In the collagen gel coculture system, we estimated the numbers of HBVPs and CFs by counting the fluorescently labelled cells (green fluorescence) within a unit volume (n = 5 FOV, randomly selected) via confocal microscopy. After coculture with VECs, the number of HBVPs was greater (4.7- and 15.6-fold greater after culture for 3 and 10 days, respectively) than the number of CFs (Supplemental Figure 5(e)).
CFs exhibit more characteristics of inflammatory cells than pericytes do. Our proteomics data revealed significantly greater expression of migration-related proteins in CFs than in HBVPs (Supplemental Figure 6(d)). In addition, our Gene Ontology (GO) enrichment analysis of the proteomics data revealed that the proteins upregulated in CFs compared with pericytes were related to energy metabolism/ATP synthesis, endocytosis and phagocytosis, chemotaxis and inflammation (Figure 6(a)). Compared with those in pericytes, the proteins downregulated in CFs were enriched in terms related to proliferation, including the M phase, Nop56p-associated pre-rRNA complex, protein-mRNA complex organization, mRNA processing and mitotic anaphase (Figure 6(b)). These findings are consistent with a previous report on the inflammatory characteristics of CFs and partially explain the increased migration and phagocytic capacities of CFs compared with those of pericytes (Supplemental Figure 6). TEM indeed revealed fewer and smaller lysosomes in HBVPs than in CFs, indicating the decreased phagocytic capacity of HBVPs compared with that of CFs (Figure 1(b) and Supplemental Figure 5(c)).
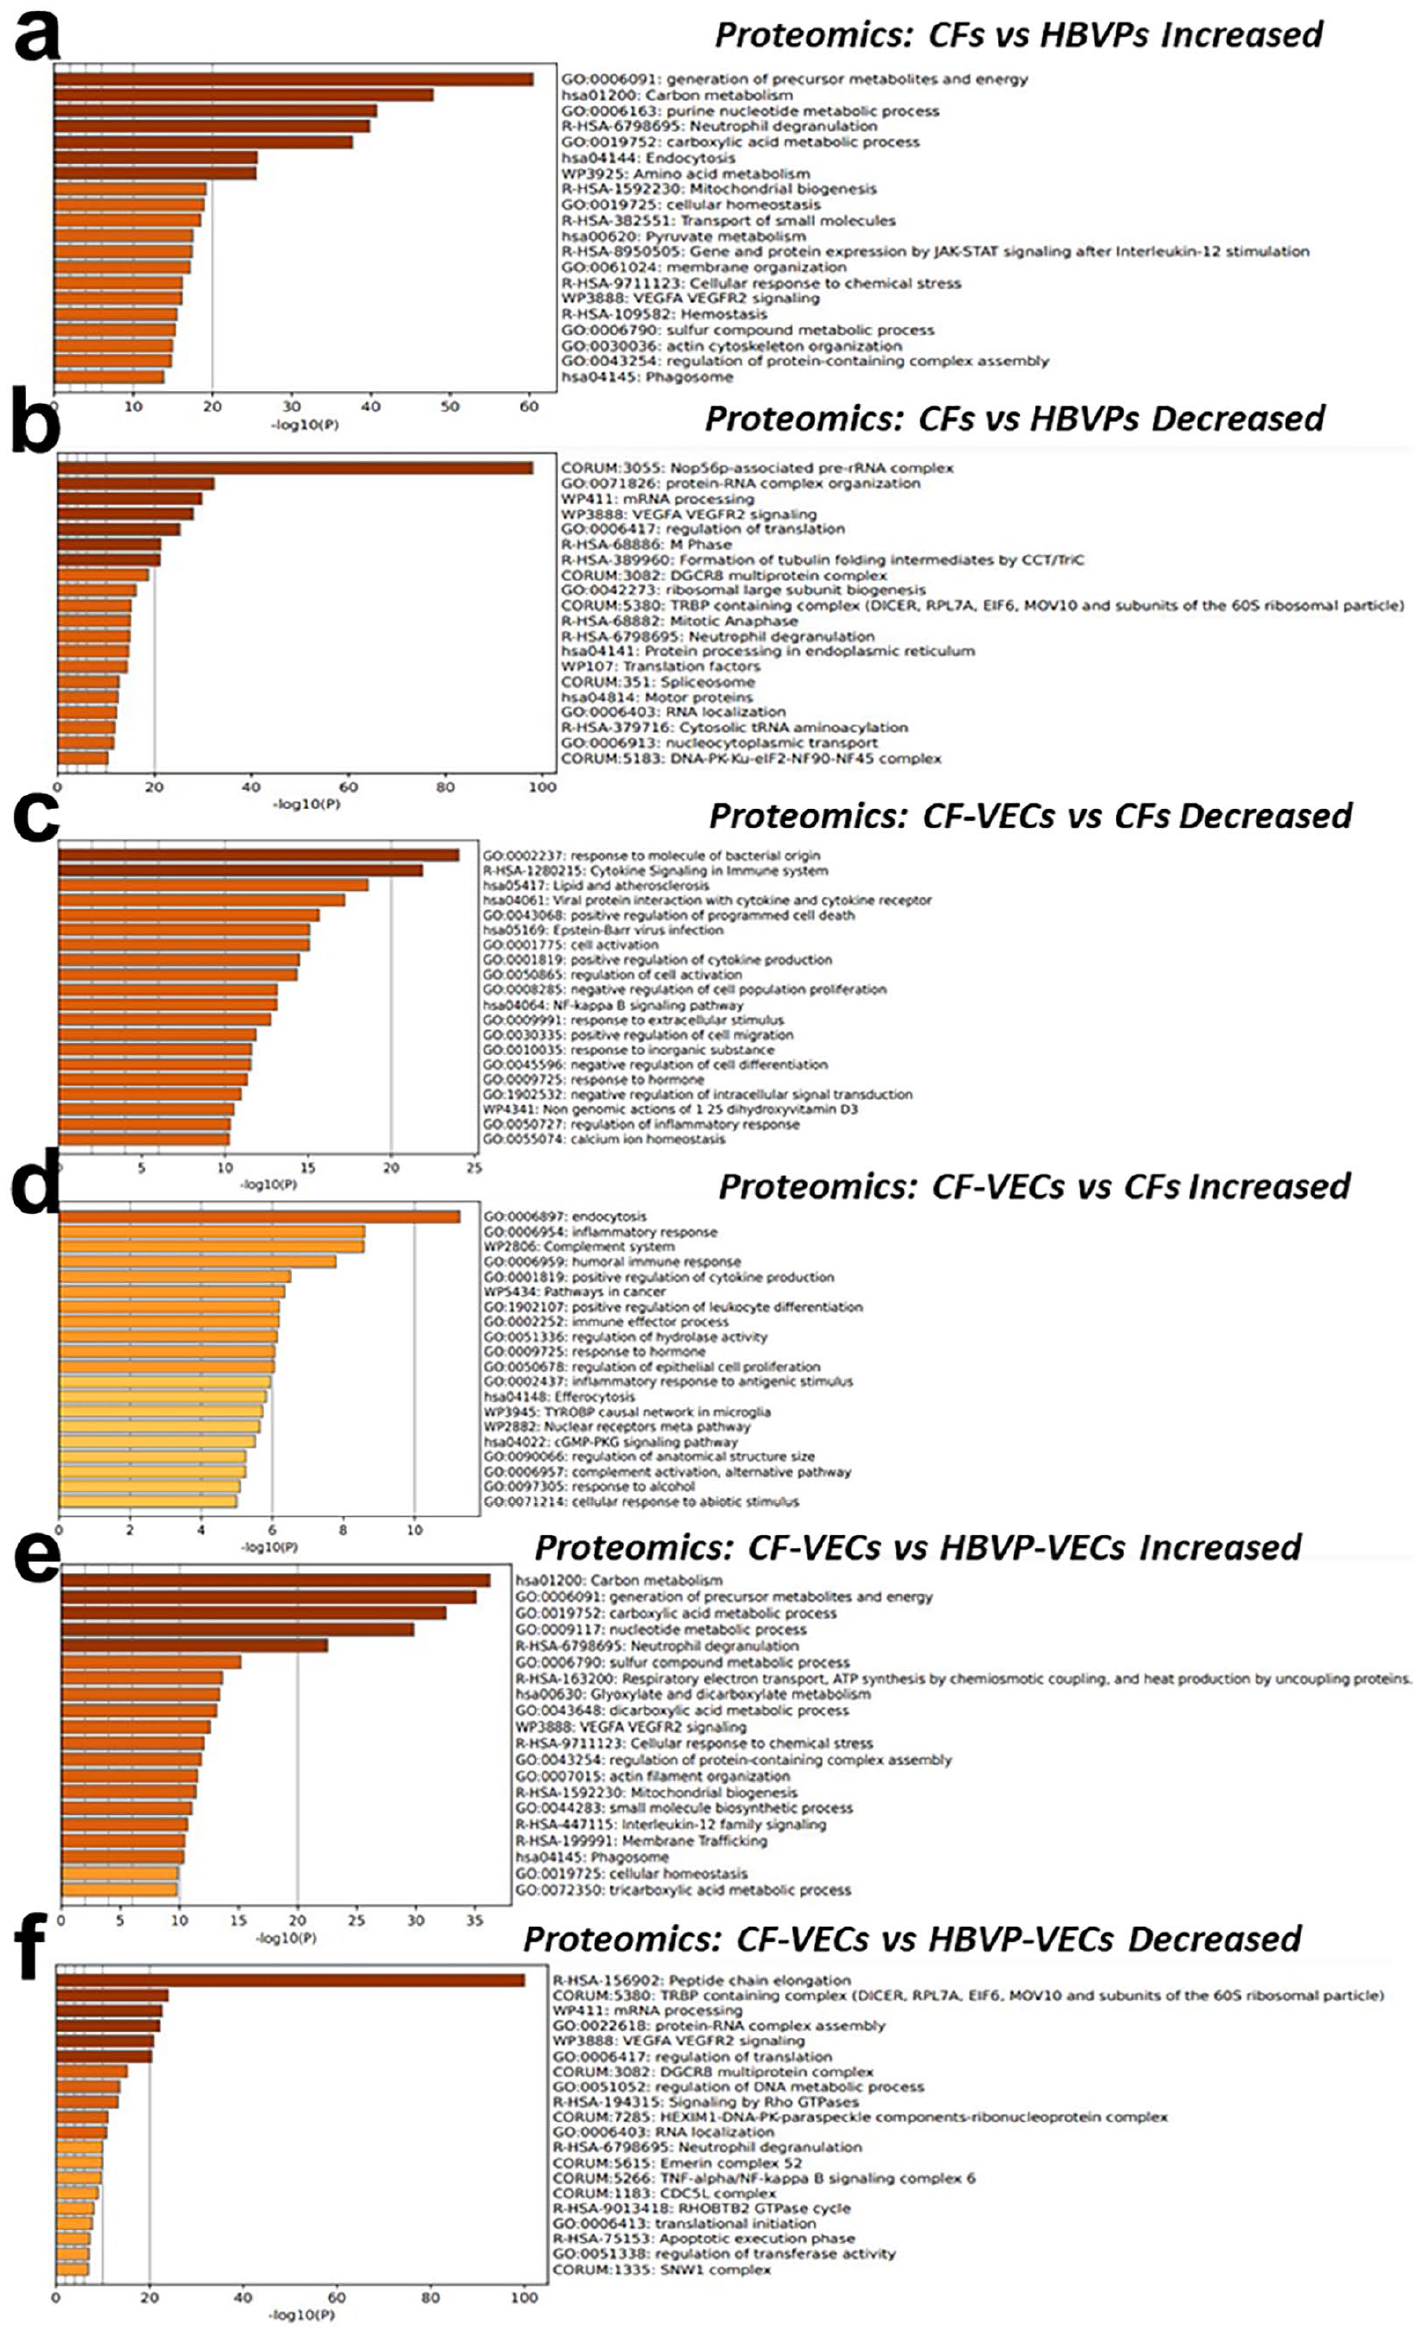
GO functional analysis of differentially expressed proteins. (a) Proteins were isolated from CFs and HBVPs and processed for proteomics analysis, and GO functional analysis was performed with the proteins upregulated in CFs via the Function Annotation tool in Metascape v3.5.20240101. (b) The same experimental procedure described in (a) was performed, and analysis was conducted with the downregulated proteins. (c) The same experimental procedure described in (a) was performed, but the proteins were isolated from CFs cocultured with VECs (CFs-VECs) and from CFs cultured alone (CFs), and the proteins downregulated in CFs-VECs were analysed. (d) The same experimental procedure described in (c) was performed, and the proteins upregulated in CFs-VECs were analysed. (e) Proteins were isolated from CFs cocultured with VECs (CFs-VECs) and HBVPs cultured with VECs (pericyte-VECs), and the proteins upregulated in CFs-VECs were analysed. (f) The same experimental procedure described in (e) was performed, and the proteins downregulated in CFs-VECs were analysed.
After coculture with VECs, CFs tended to differentiate into pericytes. Our GO enrichment analysis of the proteomics data revealed that the proteins downregulated in the CFs cocultured with VECs compared with those in the CFs cultured alone were enriched in terms related to inflammation, including response to molecules of bacterial origin, cytokines in the immune system, cell activation and the NFκB signalling pathway (Figure 6c). Compared with those in CFs cultured alone, the proteins upregulated in CFs cocultured with VECs were enriched in terms related to differentiation, endocytosis, the complement system, the cGMP-PKG pathway, etc., and included response to molecules of bacterial origin, cytokines in the immune system, cell activation and the NFκB signalling pathway (Figure 6(d)). Compared with those in pericytes cocultured with VECs, the proteins upregulated in CFs cocultured with VECs were related mainly to carbon metabolism, ATP synthesis, etc., and less strongly related to inflammation (Figure 6e). Compared with those in pericytes cocultured with VECs, the proteins whose expression was downregulated in CFs cocultured with VECs were related mainly to protein synthesis and protein-RNA complex assembly and were less strongly related to inflammation (Figure 6(f)).
CFs confer greater stability on VEC microtubular structures than do HBVPs
To evaluate the long-term effects of CFs on VEC tubular structures, we cocultured VECs with CFs and HBVPs separately in a collagen gel for up to 10 days. Interestingly, most of the microtubes formed by VECs cultured alone exhibited loss of the endothelium (Figure 5(e) vs (d)) and enlargement of the lumen (Figure 5(e)). The addition of CFs to VECs resulted in better maintenance of the number of endothelialized microtubular structures even after 10 days (Figure 5(e)). Although the inclusion of HBVPs in the coculture system initially promoted the formation of capillary-like structures, prolonged culture caused significant regression of such structures, especially after 10 days (Figure 5(e) and (f)). In contrast to CFs, which wrap the external surface of VEC microtubes, some HBVPs either infiltrate the endothelial lumen in a mosaic pattern or are located within VEC microtubes (Supplemental Figure 5(b) and (c)). More importantly, in the VEC + HBVP group, we observed a marked decrease in the number of VECs, and the HBVPs became dispersed throughout the gel; in contrast, in the VEC + CF group, the CFs remained closely associated with the VECs without a decrease in the number of VECs (Figure 5(e)).
Microvasculatures constructed from CFs and VECs integrated with the circulatory system of nude mice/rat
To facilitate the development of functional microvasculatures with improved BM formation, we mixed Matrigel (containing major BM components such as collagen IV and laminin) with VECs, VECs + CFs and VECs + HBVPs and injected the mixtures intramuscularly into nude mice (Figure 7(a)). Growth factors were excluded from the Matrigel to minimize angiogenesis. After 7 days, fluorescein-conjugated dextran was injected intravenously (i.v.) to assess the formation of microvasculatures and their connection to the host circulation. The formation of microvascular structures within Matrigel indeed occurred with the VEC + CF and VEC + HBVP combinations, and the integration of these microvasculatures with the host circulation was evidenced by the presence of red blood cells (Figure 7(c)) and fluorescein-conjugated dextran in the microvascular lumens (Figure 7(b)). In addition, we observed continuous BM formation around the microvasculature in the VEC + CF and VEC + HBVP groups (Figure 7(c)). Notably, the proliferation of HBVPs still affected the formation of microvasculatures, as evidenced by the strong correlation between the VEC:HBVP ratio and microvasculature formation within the Matrigel. With a VEC:HBVP ratio of 4:1, the newly formed microvasculatures were located mainly in the peripheral regions of the Matrigel; in contrast, a ratio of 16:1 led to increased microvasculature formation in the centre of the Matrigel (Figure 7(c)).

Tissue-engineered capillary-like structures connected to the host circulation. (a) Schematic diagram showing the experimental design for (b) and (c). The colours in the chart do not represent the colours of fluorescence staining in the experiment. VECs and CFs were cultured alone or cocultured in a collagen gel for 7 days in vitro and were then injected intramuscularly into nude mice. Samples were harvested 7 days later for follow-up testing. CFs and HBVPs were labelled with the Vybrant® DiI cell tracer. (b) Qtracker® 655 quantum dots (Cat #. Q21021MP, Thermo Fisher Scientific, US) were injected into the tail vein immediately before sample harvesting; the dots were retained as labels in the blood vessels. The samples were observed via confocal microscopy. (c) Samples were harvested and processed for TEM. M indicates Matrigel, L indicates the lumen, and the black arrowhead indicates the basement membrane. (d) Experimental design for the calvarial defect model in nude rats. The schematic shows the experimental design for (e)-(g). (e) Micro-CT scans acquired 8 weeks after calvarial defect repair. (f) Images of Masson’s trichrome-stained samples. (g) Immunofluorescence images of the samples. Both the CFs and HBVPs expressed CD34 and CD13 (orange cells in the second and third rows). The BMSCs expressed only CD13 (red cells), the VECs expressed only CD34 (green cells), and the nuclei were labelled with DAPI (blue).
We then used a nude rat cranial defect repair model, as previously described, 23 in which BMSCs were used as a source of osteoblasts to further investigate whether microvasculatures constructed by VECs and CFs could connect to the host circulation. We added CB (Switzerland, Geistlich Bio-Oss®) to Matrigel as a scaffold, used BMSCs as the cell source of osteoblasts, and used VECs and CFs or HBVPs to construct capillaries (Figure 7(d)). Micro-CT scanning was performed 8 weeks later, and the results revealed only minor changes in the bone defects in the blank control group. Compared with the control group, the CB, BMSC + CB and VEC + BMSC + CB groups presented slight but nonsignificant ossification. In contrast, the experimental groups containing CFs or HBVPs exhibited significant osteogenesis and complete bone healing (Figure 7(e)). Additionally, the experimental groups containing CFs or HBVPs presented a moderate capillary density and a lumen structure similar to that of normal capillaries (indicating the possible presence of a BM). However, the capillary lumen was enlarged (indicating the possible absence of a BM), but the capillary density was high in the groups without CFs or HBVPs (Figure 7(f) and (g)). These results revealed that the capillaries constructed from CFs and VECs were highly similar to normal capillaries in terms of both structure and function. The IF staining results revealed that the diameter of the capillaries in the CF group was approximately 10–30 μm, similar to that of normal capillaries.
IF staining revealed that the CFs were tightly wrapped around the capillaries (CD13+ and CD 34+) (Figure 7(g)). The capillary structure in the CF group was consistent with that in the HBVP group (HBVPs also express both CD13 and CD 34). For this analysis, we used an antibody specific for human (not rat) CD13. In the BMSC + VEC + CB group, no pericytes were detected around the capillaries, and the capillary diameter was approximately 60 μm, which was approximately 3 times greater than that of normal capillaries. These results suggest that CFs can construct functional capillaries that communicate with the circulatory system in vivo and that CFs might differentiate into pericytes.
Discussion
Currently, there are two strategies to vascularize tissue-engineered constructs and organs: (1) implantation of the constructs in vivo, with vascularization accomplished via host angiogenesis, and (2) culture of selected cells under controlled conditions to develop functional vascular networks in vitro before implantation.24–27 The first strategy requires the implantation of constructs with a diameter of less than 200 µm because of the 100–200 µm nutrient diffusion limit, after which the constructs grow into full-sized organs. 25 This approach is relatively impractical because the differentiation and proliferation of stem cells and mature cells depend on the coordinated spatiotemporal release of many molecules, a condition that is difficult to achieve in vivo. 24 The second strategy, in which capillaries and other blood vessels are constructed in vitro via de novo vasculogenesis, offers better control of the spatial organization of a vascular system and the seeded stem cells or mature cells for the generation of full-sized organs. However, such an endeavour presents many challenges, not the least of which is the identification of an appropriate cellular source as a substitute for mural cells. In this study, we obtained convincing evidence indicating that CFs can be used as an alternative to mural cells for the formation of tissue-engineered microvasculatures. Following coculture with VECs, CFs migrated onto the exterior surface of VEC tubes, forming unidirectional gap junctions with VECs and inducing BM formation. Earlier findings suggesting that CFs can stabilize blood vessels and express α-SMA,28,29 together with the findings of our DNA microarray and proteomics analyses, indicate that CFs may constrict and relax the microvasculature upon receiving signals from VECs via gap junctions.
Furthermore, our approach is all the more advantageous because of the high accessibility and sufficient supply of CFs. CFs can be easily extracted from blood in substantial quantities. Through optimization of the separation and culture conditions of CFs, it is possible to obtain approximately 8 × 10⁷ CF cells per 100 mL of whole blood 17 while allowing the reinfusion of plasma, red blood cells, and platelets back into patients. This process enables the rapid acquisition of a substantial quantity of CFs (e.g. 5 × 10⁹ cells) within a brief timeframe. Given that there is approximately one capillary support cell per 100–150 μm of capillary 30 , 5 × 10⁹ CFs can be utilized to construct capillaries approximately 5–7.5 × 108 mm in length. Using brain tissue, which has the highest capillary density, as a reference, the total length of capillaries in adult brain tissue is approximately 6.5 × 108 mm. Consequently, a volume of 5 × 10⁹ was sufficient to construct the capillaries necessary for brain tissue. Therefore, the isolation of CFs from human peripheral blood can adequately meet the requirements for the construction of most organs.
Unidirectional gap junctions are crucial for the stability and stress response of tissue-engineered microvasculatures after transplantation. Although many investigators have reported that gap junctions are formed between pericytes and VECs in the microvasculature, to our knowledge, we are the first group to observe unidirectional gap junctions, that is, those leading from VECs to pericytes. In addition, we observed that unidirectional gap junctions formed between VECs and CFs during coculture in vitro. Unidirectional gap junctions form between smooth muscle cells and VECs; these junctions are channels allowing interactions between these two cell types to modulate blood vessel tone and blood pressure. Unidirectional gap junctions may contribute to the stability of microvasculatures, especially during stress. During stress, the heart and small arteries coordinate to increase blood pressure following stimulation by the release of increased concentrations of epinephrine, norepinephrine or cortisol into the blood via the sympathetic nervous system. Presumably, the additional epinephrine binds the beta-adrenergic receptors on VECs in the microvasculature, which are not dominated by the sympathetic nervous system, thereby increasing the level of cytosolic cAMP/cGMP; this cAMP/cGMP then passes through unidirectional gap junctions to mural cells and causes their dilation. Dilation of mural cells may increase the velocity of blood flow to increase nutrient delivery and accelerate metabolite removal. In addition, a decrease in blood pressure in the microvasculature prevents vessel rupture. Because unidirectional gap junctions are formed between CFs and VECs and because CFs express αSMA, we hypothesize that the microvasculatures generated by CFs and VECs function well under the stress conditions encountered after transplantation.
An important consideration in tissue engineering is whether a candidate cell type can be harvested easily and in large quantities. Substantial progress has been made in simplifying the isolation and purification of CFs, 31 and yields from human peripheral blood have increased to 4 × 10⁵ CFs/mL 32 from earlier yields of 0.5–5 × 10⁴ CFs/mL.33–35 We further increased the yield to approximately 1 × 10⁶ CFs/mL. 17 In addition, the number of CFs in burn patients is increased six-fold compared with that in healthy individuals 21 ; thus, the yield of CFs could be greatly increased once we understand the mechanism underlying the burn-induced increase in CFs. Because CFs are isolated not only from the buffy coat of human whole blood but also from the remaining portion, including red blood cells, plasma and platelets, CFs can be safely transfused back into the donor. Thus, all the CFs from the donor can be harvested without harming the donor, indicating that measures are taken to prevent infection and that protamine sulphate is administered to offset the effect of the heparin used during CF isolation.
The in vivo data indicate that the thickness of the capillary BM is directly proportional to the pressure difference between the blood and the fluid; however, the mechanism underlying this relationship is unknown. The thickness of the BM is approximately 300 nm in the glomerulus, where the pressure difference is approximately 35 mmHg; approximately 200 nm in the gastrocnemius muscle, where the pressure difference is approximately 20 mmHg 36 ; and 100 nm in most organs, where the pressure difference is approximately 10 mmHg. Because we did not apply pressure to the microvasculatures formed by the CFs and VECs after 3 days of coculture in the collagen gel, the BM, unsurprisingly, was discontinuous and thin. However, a continuous BM formed in the capillaries of the nude mice in the VEC + CF group when the cells were mixed in Matrigel and injected into the muscle, where the newly formed microvasculatures may have connected to the host circulation at an early stage after transplantation. Clearly, to construct functional tissue-engineered capillaries in vitro, we must decipher the mechanisms by which pressure regulates BM formation so that we can prefabricate a continuous BM with a thickness tailored to a specific organ.
CFs share many phenotypic characteristics with pericytes, fibroblasts and smooth muscle cells. All four types of cells express the same set of cell markers, such as αSMA, desmin and CD13. In fact, no specific cell markers that distinguish pericytes from the other three cell types have been identified. When cultured in vitro, all four types of cells appeared spindle shaped under light microscopy. However, compared with pericytes, circulating fibrocytes exhibit more characteristics of inflammatory cells. The results of our proteomics and DNA microarray analyses confirmed this observation. After coculture with VECs, the expression of inflammation-related molecules in CFs decreased, suggesting that CFs are more similar to pericytes than to any of the other abovementioned cell types; that is, CFs tend to differentiate into pericytes. However, at present, there is no direct evidence that CFs can differentiate into pericytes.
Although CFs exhibit some pericyte-like functions, that is, the ability to stabilize the microvasculature, induce BM formation and form unidirectional gap junctions, CFs nevertheless exhibit a lower proliferation rate, greater migratory capacity, greater phagocytic capacity and weaker multipotent differentiation potential. When HBVPs and VECs were cultured in low-serum medium, pericytes had a greater proliferation rate in 2D culture plates and a 3D collagen gel, and fewer pericytes than CFs migrated to the microvasculature. In addition, most microvasculatures regressed after 10 days of coculture with HBVPs. All these results were consistent with the results of our DNA microarray and proteomics analyses. Importantly, our data (Supplemental Figure 5(b) and (c)) and those presented in previous publications revealed that unlike CFs, which sheathe the microvasculatures outside the lumen, some pericytes infiltrate the wall of the microvasculature in a mosaic pattern. 37 Therefore, microvasculatures constructed with pericytes are prone to thrombosis because pericytes do not exhibit anticoagulant or antithrombotic functions. We found that pericytes express many markers (Supplemental Results) associated with multipotent differentiation potential, which is consistent with the observation that pericytes are the precursors of mesenchymal stem cells (MSCs). 9
Apparently, pericytes are not an optimal cellular source for mural cells in tissue engineering. Stratman et al.8,36,38 successfully constructed microvasculatures using VECs and pericytes isolated from cattle retinas. These investigators developed customized serum-free medium in which most pericytes migrated to capillary-like structures but either did not proliferate or proliferated at a low rate.8,37,38 However, current technology does not allow the isolation and purification of pericytes from tissues other than the brain and retina. When the culture medium contains serum, which is necessary for most cells, pericytes continue to proliferate and regression of the microvasculature occurs. In addition, pericytes retain myogenic, adipogenic, osteogenic and chondrogenic differentiation potential and express MSC markers; thus, pericytes are widely accepted as the origin cells of MSCs.10,39 These properties suggest that pericytes may differentiate into unwanted cell types when used to construct tissue-engineered microvasculatures. MSCs have proliferative and multipotent differentiation potential characteristics similar to those of pericytes, and there is no evidence that MSCs can induce BM formation from VECs or the formation of gap junctions with VECs. Furthermore, the phenotype of pericytes is easily altered by culture conditions.
In summary, our study provides substantial evidence supporting the idea that CFs are a suitable cellular source for mural cells in the construction of functional tissue-engineered microvasculatures. CFs have the advantages of being able to stabilize the microvasculature, induce BM formation and form unidirectional gap junctions with VECs.
Supplemental Material
sj-rar-1-tej-10.1177_20417314251315523 – Supplemental material for Construction of functional tissue-engineered microvasculatures using circulating fibrocytes as mural cells
Supplemental material, sj-rar-1-tej-10.1177_20417314251315523 for Construction of functional tissue-engineered microvasculatures using circulating fibrocytes as mural cells by Xiaolin Wang, Hong Tan, Harsha P Gunawardena, Jin Cao, Lu Dang, Hongbing Deng, Xueyong Li, Hongjun Wang, Jinqing Li, Caibin Cui and David A Gerber in Journal of Tissue Engineering
Footnotes
Acknowledgements
We thank Neal Kramarcy and Michael Chua (Michael Hooker Microscopy Facility, the University of North Carolina at Chapel Hill) for their assistance with laser confocal microscopy. We also thank Victoria Madden and Dr. Robert Bagnell (Microscopy Services Laboratory in Pathology and Laboratory Medicine, University of North Carolina at Chapel Hill, Chapel Hill, NC) for their excellent work on TEM and SEM.
Author contributions
Jinqing Li, Xueyong Li and David A. Gerber contributed to the study conception and design. Material preparation and data collection and analysis were performed by Xiaolin Wang, Hong Tan, Jin Cao and Lu Dang. The first draft of the manuscript was written by Xiaolin Wang and Harsha P. Gunawardena, and all the authors commented on previous versions of the manuscript. All the authors read and approved the final manuscript.
Data availability statement
All the data and models generated or used during the study appear in the submitted article.
Declaration of conflicting interests
The author(s) declared no potential conflicts of interest with respect to the research, authorship and/or publication of this article.
Funding
The author(s) disclosed receipt of the following financial support for the research, authorship and/or publication of this article: This work was supported by grants from the National Natural Science Foundation of China (Grant Nos. 81272134 and 31570986) and the Shaanxi Province Key Research and Development Plan (2024SF-GJHX-45).
Ethical considerations
All animal-related procedures were performed in accordance with the NIH Guide for the Care and Use of Laboratory Animals and were approved by the Institutional Animal Care and Use Committee of Xi’an Jiaotong University.
Consent for publication
All the authors declare that this manuscript has not been published elsewhere and has not been submitted to other journals for publication. All the authors approved the publication of this manuscript.
Supplemental material
Supplemental material for this article is available online.
References
Supplementary Material
Please find the following supplemental material available below.
For Open Access articles published under a Creative Commons License, all supplemental material carries the same license as the article it is associated with.
For non-Open Access articles published, all supplemental material carries a non-exclusive license, and permission requests for re-use of supplemental material or any part of supplemental material shall be sent directly to the copyright owner as specified in the copyright notice associated with the article.