
Abstract
Magnesium-degradable implants have excellent mechanical and osteogenic properties for temporary orthopedic use but are underutilized due to insufficient methods to monitor implant osseointegration and tissue healing. This study evaluated the use of circulatory biomarkers to monitor the bilateral implantation of a Mg-alloy in rats’ femurs. A total of 16 biomarkers were measured from plasma samples collected at multiple timepoints up to 90 days post-implantation. Mg-alloy, Ti-alloy, and Sham (noncritical bone defect) groups were followed with computed tomography, histological, and SEM-EDX analysis. The Sham group showed higher DKK1, OPG, VEGF, and KIM-1 levels than implanted groups. The Mg-alloy group had delayed bone regeneration due to gas release but demonstrated active regeneration up to 180 days and superior osseointegration. Elevated IL-10 and reduced FGF23 at day 28 correlated with accelerated implant degradation. These results underline the complex interactions between biomaterials and biological systems in orthopedic applications and show the value of circulating markers to follow-up implantation.

Introduction
Magnesium degradable implants present adequate mechanical and osteogenic properties and have been extensively investigated as an alternative to the standardly used permanent metallic implants made of titanium (Ti) or cobalt-chromium (Co–Cr) alloys for orthopedic applications. While four orthopedic Mg devices have gained clinical approval and shown comparable results to conventional metallic implants, they are not yet in widespread use. 1 Challenges in ensuring the predictable and consistent performance of biodegradable implants hinder their adoption, necessitating follow-up clinical studies for assessment of degradability and safety.2,3 Traditional evaluation methods, like biomechanical testing and imaging (computed tomography (CT), X-ray), are not always adequate or sufficient for assessing Mg implant degradation and tissue regeneration.4,5 Magnesium alloys (Mg-alloys) lead to a dynamic process of implant degradation and simultaneous tissue regeneration.6,7 In vitro studies demonstrate that Mg2+ released from Mg-alloys, modulates early inflammatory responses, shifting macrophage profile from pro- to anti-inflammatory status and inducing osteoblast differentiation from bone mesenchymal stem cells (BMSC). 8 Furthermore, Mg2+ release inhibits osteoclast formation via osteoprotegerin (OPG)/receptor activator of the nuclear factor kappa-B ligand (RANK)/receptor activator of nuclear factor κ B (RANKL) pathway. 9 In vivo studies show heterogeneous bone-implant interfaces, indicating simultaneous bone regeneration and remodeling.10,11 Mg-alloys promote direct bone-implant contact, guaranteeing proper osseointegration and implant stability, contrary to the fibrotic encapsulation frequently found with other metallic implants.12,13 However, the release of H2 from Mg implants leads to the formation of voids in the peri-implant tissue, which in a very early stage of regeneration can delay cell adhesion.14,15 Nonetheless, the presence of these voids does not hinder long-term tissue regeneration and implant osseointegration.12,13
In situ evaluation of bone and inflammatory biomarkers in tissues surrounding Mg implants can provide insights into their biocompatibility.16 –18 Biomarkers of bone cell activity, such as osteopontin (OPN) and growth factors are frequently investigated through immunohistochemistry and gene expression analysis,19,20 which require animal sacrifice and limit evaluation to a single timepoint. This approach restricts longitudinal observation, confining the assessment to tissue and cellular responses at the implant site, and neglecting broader systemic effects.
Beyond imaging techniques which provide localized observation of implants and surrounding tissues without animal sacrifice, blood biomarker analysis offers non-invasive approach for understanding the systemic impact of implants on the body, complementing the information obtained from imaging techniques. Most pre-clinical studies on Mg implants focus on early response, evaluating pro-inflammatory (tumor necrosis factor alpha (TNF-α), interleukin (IL-6, IL-1β, and IL-2)) and anti-inflammatory markers (IL-10).21,22
Assessment of biomarkers is routinely performed in numerous clinical fields, including musculoskeletal diseases.8,23 Furthermore, studies performed on patients with permanent metallic implants (i.e. Ti and Co−Cr alloys) have revealed the effectiveness of biomarkers in detecting early signs of peri-implant osteolysis, a well-known and common complication associated to metallic implant usage.24,25 Given their non-invasiveness, ease of use, and accuracy, we propose testing a panel of inflammatory and bone metabolism biomarkers in plasma samples, using a multiplex immunoassay approach, which allows simultaneous detection of multiple analytes from one single small sample volume and the longitudinal monitoring of the systemic response. 26
In this study we used a rodent model with a transcortical implantation of pins on rat’s femur and assessed long term implant osseointegration and degradation. For the Mg-alloy, we chose WE43, a slow degrading alloy with Yttrium (Y), Zirconium (Zr), and rare earth elements (REE) in its chemical composition. WE43 received CE approval for clinical orthopaedical use in 2013 and despite its commercialization and proven biocompatibility, certain aspects of alloy’s degradation behavior and the impact of REE release remain unclear.27,28 Therefore, we also investigate the systemic distribution of Y and REE in the liver, kidney, and spleen. The experimental design included three groups of animals: the Sham group, animals with a non-critical bone defect, and the WE43-implanted group and the titanium (Ti)-implanted group.
A list of 16 soluble proteins including biomarkers of both inflammatory and bone metabolism was selected (see Supplemental Table B1). Additionally, we assessed the morphology of peri-implant bone tissue and the bone-implant interface elemental composition through histology and scanning electron microscopy with energy dispersive X-ray spectroscopy (SEM-EDX), respectively.
We unveiled intriguing patterns and kinetic differences in the plasma levels of biomarkers between groups implanted with WE43 and Ti implants, compared to the natural bone regeneration process observed in the Sham group. Additionally, we established correlations between biomarkers and various aspects of tissue regeneration and implant degradation in the WE43-implanted group.
Materials and methods
Implants
Cylindrical pins of 8 mm length and 1.6 mm diameter were made of WE43-based material manufactured by Syntellix AG (Hannover, Germany) and were produced using a turning method. The chemical composition of WE43 is Yttrium (Y; 3.7%–4.3%), REE (2.4%–4.4%), zirconium (Zr; 0.4%), and the residual percentage of Mg. A Ti alloy—(Ti6Al7Nb)—was manufactured by Acnis International (Chassieu, France) with equivalent geometry and was used as control. The material was annealed and centerless grounded and then deflected, finally, it was grounded and it was polished. Both implant materials were then individually packaged, and gamma sterilized at a 25 kGy dose.
Preimplantation characterization
The surface of WE43 (n = 3) and Ti (n = 2) pin was evaluated before implantation by stereomicroscopy and SEM-EDX. Detailed descriptions of this methodology are outlined in Supplemental File A.
Animals and experimental design
All animal procedures were carried out in accordance with the National Ethical Guidelines (Italian Ministry of Health; D.L.vo 26/2014) and the protocol was approved by the Instituto Superiore di Sanità on behalf of the Italian Ministry of Health and Ethics Panel (Prot. no. 299/2020-PR).
Wistar female rats (n = 60; 9–12 weeks old; 200–250 g; Envigo,Italy) were housed communally (maximum four rats/cage) on a 12–12 h dark-light cycle with unrestricted access to water and standard rodent diet. The animals were anesthetized with an intraperitoneal injection of 5 mg/kg of Xylazine (Rompum Elanco, Italy) and 10 mg/kg of Zoletil (zolazepam + tiletamine; Virbac, Switzerland). The surgical procedures were performed as described in Kraus et al. 29 The animals were implanted with cylindrical pins, on both femurs, composed of either WE43 or Ti or left without implants and a bone defect size of 1.6 mm diameter (Sham). After surgery, the animals were injected intraperitonially with 0.1 mL of Ketorolac for analgesia and put back in their cages. Antibiotics (Baytril 5 mg/100 mL) and analgesics (Tramadol 3 mg/100 mL) were administered in water and standard rodent food was presented ad libitum. The study design is depicted in Figure 1 and sample size distribution is represented in Supplemental File A—Figure A1.

Schematic representation of experimental groups (WE43, Ti, and Sham), and the corresponding analysis performed at different timepoints. The number of samples shown in the figure represents the number of implants, explants, plasma, or tissue samples analized per experimental group (WE43, Ti, and Sham) at each timepoint. Figure created with BioRender.com
Computed tomography
Detailed description of this methodology can be found in Supplemental File A.
Plasma samples collection and assessment of circulating biomarkers
A volume of 0.5 mL of blood was collected from animals’ tail vein and immediately transferred to EDTA treated tubes which were left at room temperature for 30 min. The blood samples were then centrifuged at 4°C for 10 min at 3000 rpm, aliquoted into volumes of 100 mL and stored at −80°C until analysis. A total of 16 plasma biomarkers related to inflammation and bone regeneration were assessed using custom-designed immunoassays based on Luminex xMAP Technology (MILLIPLEX, EMD Millipore Corporation, Billerica, MA). Three panels were utilized: Rat Cytokine/Chemokine Magnetic Bead Panel (G-CSF, GRO-KC/CXCL-1, TNF-⍺, IL-6, IL-1⍺, IL-10, IL-4; IFNγ, and MCP-1); Rat Bone Magnetic Bead Panel (DKK1, FGF23, and OPG); and Rat Kidney Magnetic Bead Panel (OPN, VEGF, KIM-1, and TIMP-1). A detailed description of this methodology can be found on Supplemental File A.
Histology
A detailed description of this methodology can be found on Supplemental File A.
Surface characterization of extracted implants
A detailed description of this methodology is found on Supplemental File A.
Cross-sectional characterization of bone-implant interface
The femurs collected from WE43 and Ti groups were sectioned at the epiphysis and fixed in 10% neutral buffered formalin. Afterward, the specimens were dehydrated using ethanol series, and subsequently embedded in methylmethacrylate (Technovit® 9100 neu, Kulzer, Germany). Then, the embedded specimens were sectioned parallel to the longitudinal axis of the pin using a laser microtome (TissueSurgeon, LLS ROWIAK LaserLabSolutions, Hannover, Germany). The morphology and chemical composition of the bone-implant interface and the peri-implant bone were examined by SEM-EDX (SU8000, Hitachi, Japan).
Inductively coupled plasma-mass spectrometer
Concentrations of Y and REE were measured from liver, kidneys and spleen samples collected at 14, 90, and 180 days after surgery from all groups. Lyophilized samples of 100 mg were put in a mixture of HNO3(6 mL, 69 % w/w) and water (2 mL, 30 % w/w) for 1 h and then digested in a microwave oven, slowly increasing temperature to 200°C and maintaining it for 20 min. An Agilent7700× inductively coupled plasma mass spectrometer (Agilent Technologies, Tokyo, Japan) with a MicroMist nebulizer and cooled (2°C) quartz Scott-type double-pass glass spray chamber was used for the quantification of Y and REE. A solution of 10 µg/L iridium in 2% HNO3 was used as internal standard.
Statistical analysis
Considering the variability associated with the chosen experimental design, the suitability of a generalized additive model (GAM) was explored to modulate the results of circulating biomarkers. Detailed description on GAM modulation and its performance results can be found on Supplemental File A. Pairwise comparison tests were carried out as part of GAM to find differences between the experimental groups at each time point and for each biomarker, as well as pairwise longitudinal tests, to investigate differences in biomarker concentration between time points. To reduce type I error, all tests were adjusted following the false discovery rate procedure (FDR), according to the Benjamin-Hochberg et al., 30 where only p-values adjusted to FDR < 0.05 were considered statistically significant. The open-source statistical software R (Core Team (2018), R foundation for Statistical Computing, Vienna, Austria) with mgcv package, and the bam function was used. The immunoassay results were presented as the logarithmic transformation of concentration (pg/mL) values and plotted as mean ± SEM (standard error of the mean). The results of inductively couple plasma (ICP)-mass spectroscopy (MS) analysis, Elemental composition of pins surface, resultant from Surface Characterization of extracted implants (Supplemental Figures B5 and B4), and measurements of WE43 corrosion layer thickness (Supplemental Figure B6) were represented as the mean ± SEM and pairwise comparison analysis were performed.
Results
Implants pre-implantation characterization
The pre-implantation characterization of both implants (WE43 and Ti) was performed using SEM-EDX (Supplemental Figure B1). The geometry of the pins differed slightly, with Ti pins presenting rounded edges, grooves, and rounded Nb-enriched particles whereas the characteristic of WE43 pins were uniform vertical marks from manufacturing. EDX analysis of the pins confirmed their chemical composition and the content of oxygen, suggesting the formation of a thin oxide layer in both materials, possibly the result of the contact with air and moisture during manufacturing and cleaning procedures, as well as the natural aging process during storage before in vivo implantation. 31
Post-surgical observation—Computed tomography imaging
Following surgery, animals were closely monitored. All the 60 animals presented adequate post-surgical recovery and were included in the following analysis. In addition, CT scan results were used to confirm the pin placement and fitting. Figure 2 demonstrates the placement of the pin in the mid-diaphyseal region of the femur on days 3, 14, and 45 using 3D CT renders. Three days after implantation, small bone debris were visible in the vicinity of the implants, but these disappeared by day 14. The images taken on days 3, 14, and 45 were from the same animal (Figure 2(a–c)), confirming the WE43 maintained the initial placement position throughout the experimental period. The Sham animal showed bone defect closure by day 14 and at day 45 the surgical bone defects were imperceptible (Figure 2(e) and (f)). Due to the streak artifacts caused by the presence of Ti implants, 32 3D reconstructions of the Ti implanted group were not included. Nevertheless, CT images were still used to validate the alignment of implants with the bone.
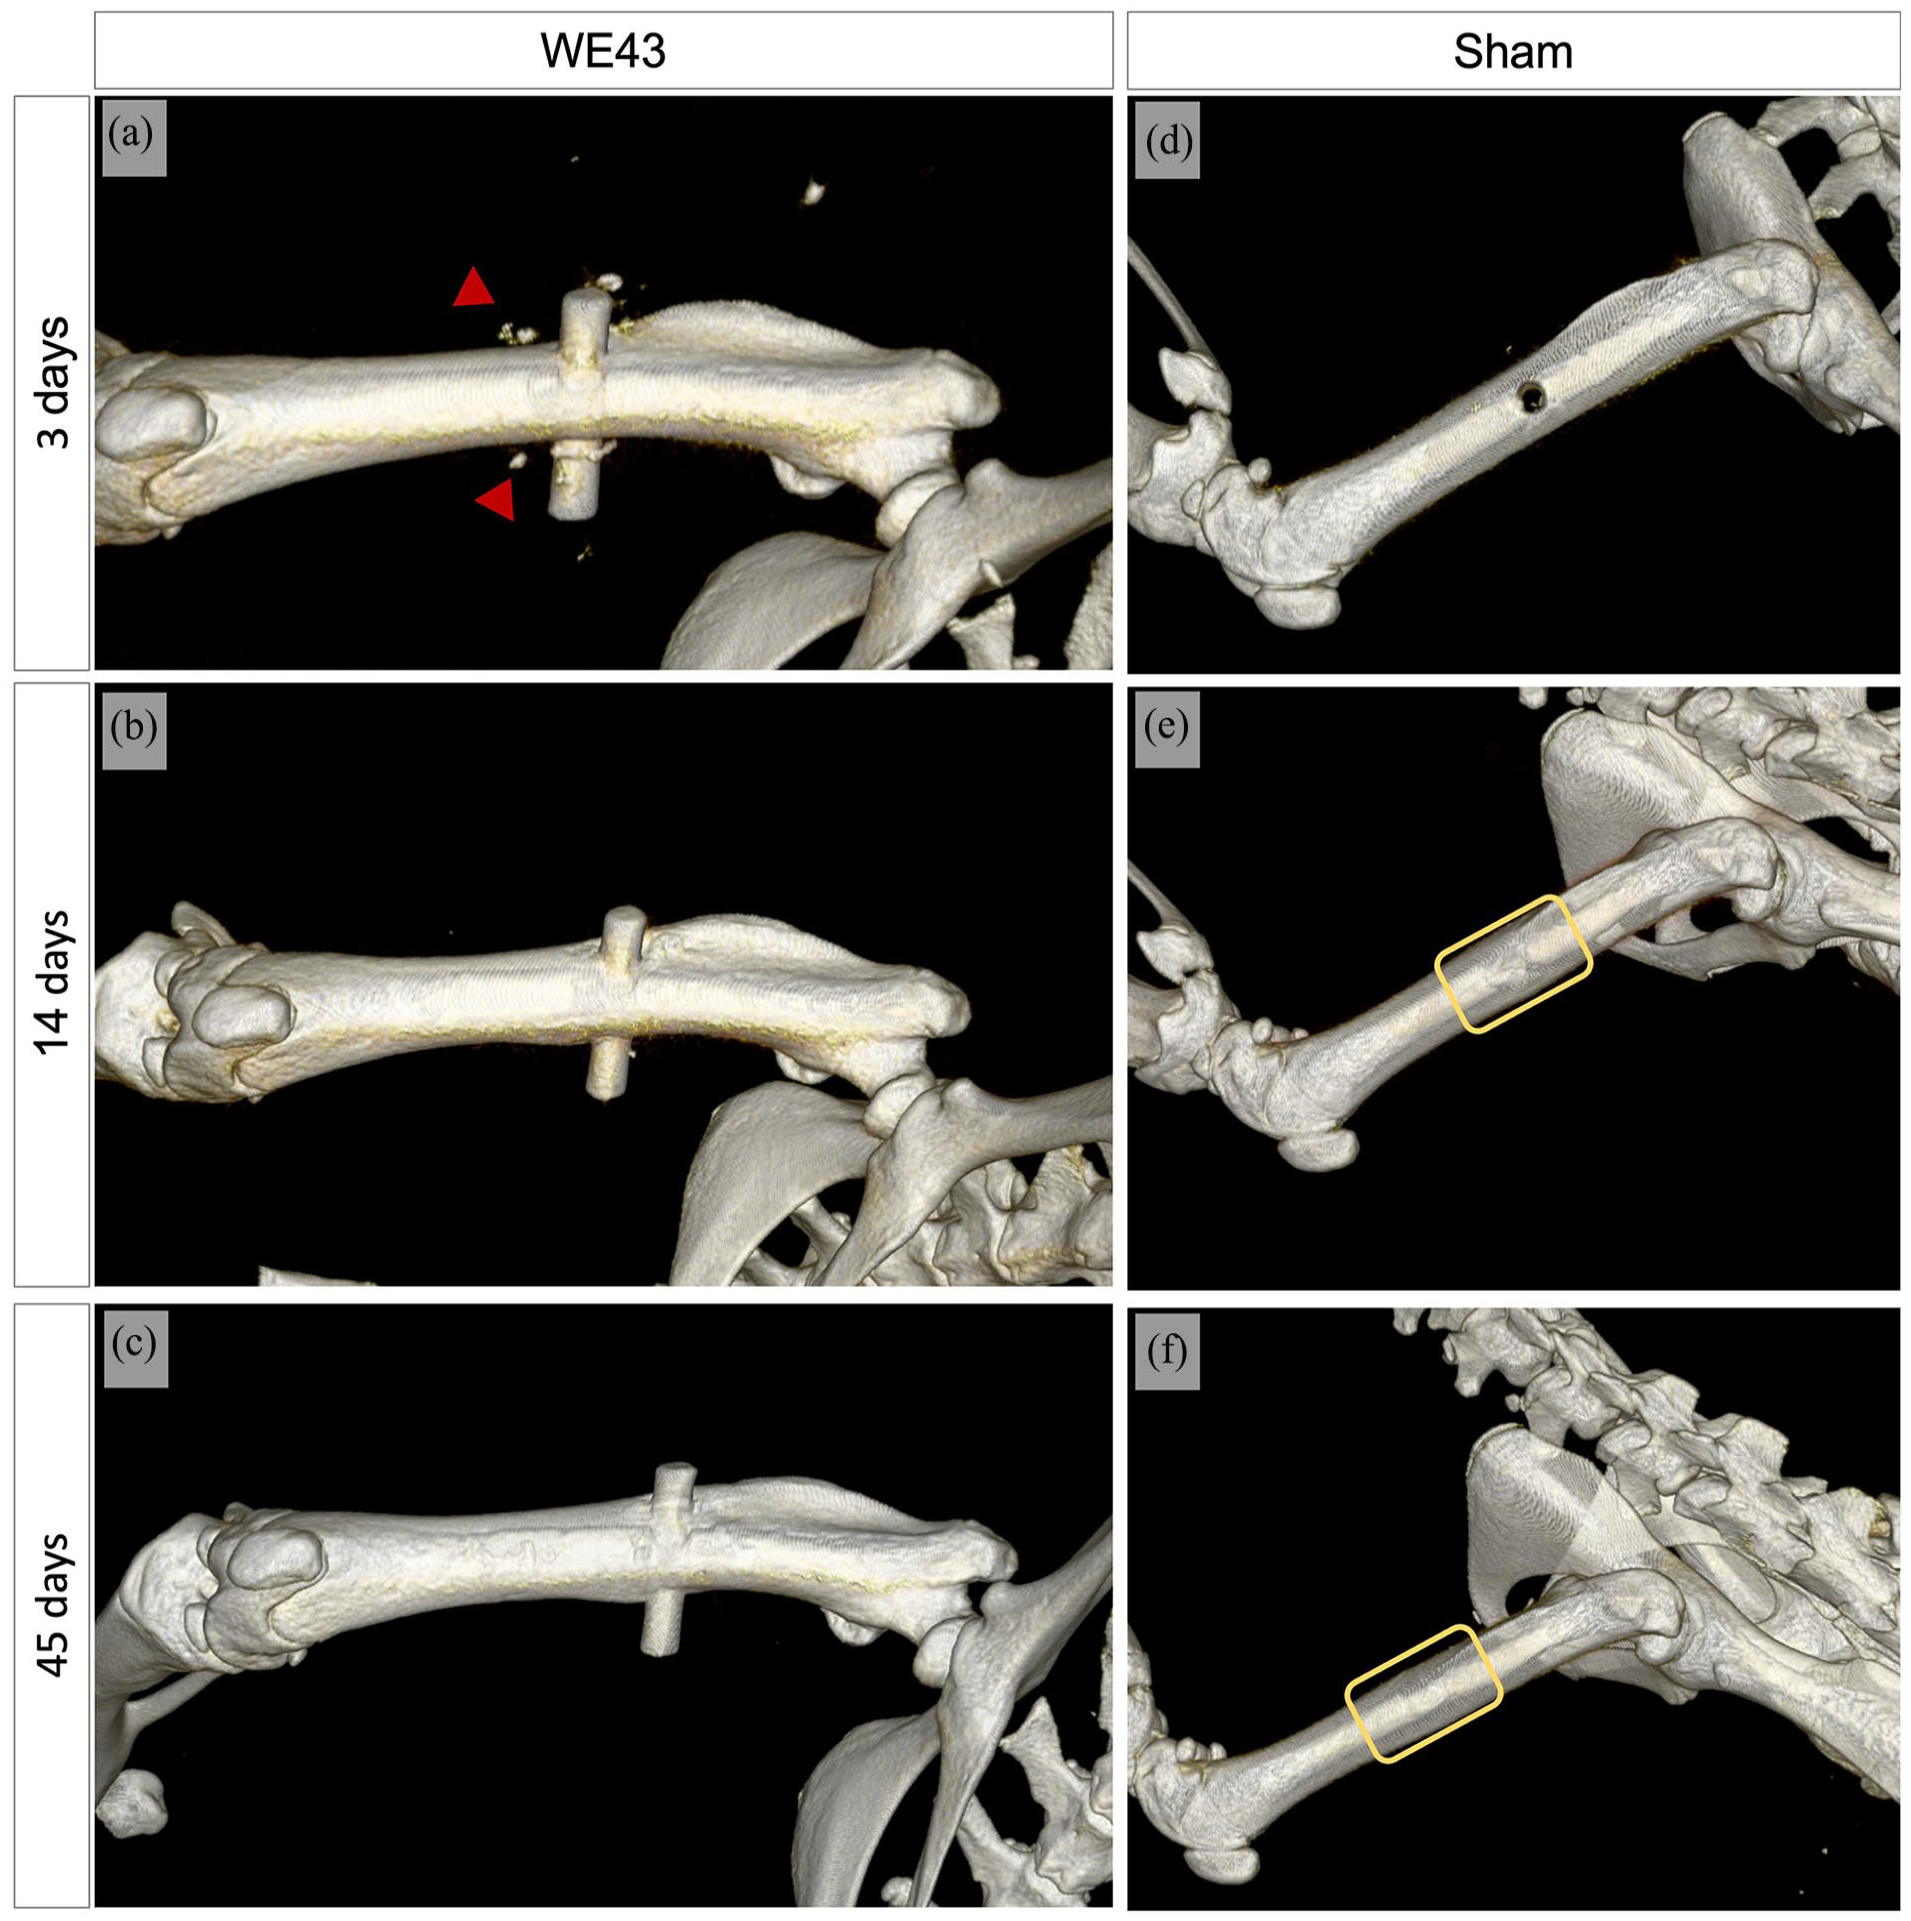
A 3D CT renders of WE43 implanted animals (a–c) and a Sham (d–f) surgically placed at 3, 14, and 45 days after surgery. Red arrows in (a) indicates bone debris caused by surgical procedure and press-fit during pins’ implantation. The yellow rectangles in (e) and (f) show the region where the bone defect was created after 14 and 45 days.
Undetectable circulating biomarkers excluded from analysis
Among the 16 biomarkers assessed, concentrations of four inflammatory cytokines/chemokines (interleukin (IL-4, IL-6), interferon γ (IFN-γ), growth-regulated oncogene (GRO)-keratinocyte chemoattractant (KC)/chemokine (C-X-C motif) ligand (GRO-KC/CXCL1)) were undetectable in over 50% of the animal/time points within each experimental group. Consequently, they were considered nonsignificant and excluded from further analysis. The rest of the biomarkers namely, TNFα, kidney injury molecule 1 (KIM-1), fibroblast growth factor 23 (FGF23), osteoprotegerin (OPG), growth colony stimulating factor (G-CSF), IL-10, vascular endothelial growth factor (VEGF), tissue inhibitor of metalloproteinases 1 (TIMP-1), OPN, monocyte chemoattractant protein-1 (MCP-1), IL-1α, and dickkopf WNT signaling pathway inhibitor (DKK1) were analyzed. The undetectable concentration values, that is, outside of equipment’s detection range, were excluded from the mean calculations at each timepoint
Differential expression of bone regeneration and angiogenic biomarkers between Sham and implanted groups
About 4 of the 12 examined biomarkers, including DKK1, OPG, VEGF, and KIM-1, exhibited a similar expression pattern, particularly within the Sham group (Figure 3(a—d)). The highest concentration values were consistently observed in the Sham group between days 7 and 45 after surgery, with distinct peaks at days 14 and 45. In contrast, the WE43 group showed the lowest concentration values, notably between days 3 and days 28 or 45.

Longitudinal profiling of circulating levels of (a) OPG, (b) DKK1, (c)VEGF, (d) KIM-1, (e) FGF23, and (f) IL-10 in the three experimental groups: WE43 (blue), Ti (red), and Sham (green) and for all timepoints (0, 1, 3, 7, 14, 28, 45, and 90 days) Data are presented as mean ± SEM. (a) p < 0.05 Sham versus Ti with; (aa) p < 0.001 Sham versus Ti with; (b) p < 0.05 Sham versus WE43; (bb) p < 0.001 Sham versus WE43; (c) p < 0.05 WE43 versus Ti; (cc) p < 0.001 WE43 versus Ti. WE43 n = 12/timepoint; Ti n = 6/timepoint; Sham n = 6/timepoint.
OPG, an inhibitor of osteoclastic activity, consistently showed higher levels (p < 0.001) in the Sham group at all experimental timepoints compared to Ti implanted group. Baseline OPG values varied greatly between the groups. The OPG levels of Sham group were significantly higher compared to WE43 group on days 3, 7, 14, and 28 (p < 0.001; Figure 3(a)).
DKK1, an inhibitor of osteoblastic activity, displayed peak concentrations between days 7 and 45 in the Sham group. These concentrations were significantly elevated compared to Ti group on days 14 (p < 0.001), 28 (p < 0.05), and 45 (p < 0.001). Compared to the WE43 implanted group, the Sham group showed significantly higher concentrations between days 3 and 45 (day 3 and 7 with p < 0.05 and days 14, 28, and 45 with p < 0.001; Figure 3(b)).
VEGF, an angiogenic markers present in numerous fracture healing stages, showed significantly higher concentration in Sham compared to WE43 group, between days 7 and 28 (p < 0.001). While not significantly different from Ti group, an elevated concentration between the same timepoints is observable (Figure 3(c)).
Finally, KIM-1 levels varied significantly between groups. Notably, the Sham group showed higher KIM-1 levels than the WE43 implanted group on days 3, 7, 14, 28 (p < 0.001), and 45 (p < 0.05; Figure 3(d)).
Interestingly, OPG, DKK1, VEGF, and KIM-1 displayed an upward trend in circulating concentration by day 90 in the WE43 group, a pattern not observed in the Ti or Sham groups.
Furthermore, the biomarkers G-CSF, TNFα, TIMP-1, MCP-1, OPN, and IL-1α, did not display statistically significant differences between the experimental groups (Supplemental Figure B2).
Differential concentrations of circulating biomarkers between implanted groups
Furthermore, statistical analysis revealed significant differences in circulating biomarker concentration between the implanted materials. In the Ti implant group, OPG and VEGF concentrations were notably higher on days 7 (p < 0.05) and 28 (p < 0.001) while KIM-1 levels were elevated on days 7 (p < 0.05) and 14 (p < 0.05) compared to WE43 implanted group (Figure 3(a, c, and d)). The circulating concentration of FGF23 was significantly lower in the WE43 group on day 28 (p < 0.05) compared to both the Sham and the Ti groups (Figure 3(e)). Regarding inflammatory markers, only IL-10 displayed statistically significant differences: its concentration was higher in the Ti group on day 3 (p < 0.05) compared to Sham, and significantly higher in the WE43 group on day 28 (p < 0.001) compared to Ti group (Figure 3(f)). Although without presenting a statistically significant difference, IL-10 levels were considerably higher on WE43 than on Sham group at day 28. Finally, at day 90, G-CSF was significantly higher in WE43 when compared to Ti (p < 0.001; Supplemental Figure B2).
Longitudinal variations within WE43 group
In the WE43 group, several biomarkers exhibited significant differences over time (Figure 4). OPG levels were elevated on days 1 and 90 post-implantation, compared to days 7 and 28 (p < 0.05). Similarly, VEGF displayed increased concentration on day 1 compared to day 7 (p < 0.05) and on day 90 compared to days 7, 14, and 28 (p < 0.05). TIMP-1 showed its peak concentration on day 1, significantly surpassing on days 3, 7, 14, 28, and 45 (p < 0.001). The baseline value (day 0) was also considerably higher than those on days 14 and 45 (p < 0.001). Additionally, G-CSF levels were significantly higher on day 3 post-surgery compared to baseline (p < 0.001). The elevated levels of OPG and VEGF at 90 days in respect to intermediate timepoints, confirmed the upward trend visible in WE43 group at later timepoints when compared to the other groups (Ti, Sham). In contrast, Sham group showed longitudinal differences only for G-CSF levels (Supplemental Figure B3), while Ti group did not show temporal differences for any marker.

Longitudinal representation of TIMP-1, OPG, VEGF, and G-CSF plasma levels for WE43 (n = 12/timepoint) implanted group. Mean ± SEM. (a) p < 0.001 Day 0 versus days 14 and 45, (b) p < 0.001 Day 1 versus day 3, 7, 14, 28 and 45; (c) p < 0.05 Day 1 versus days 7, 28; (d) p < 0.05 Day 90 versus days 7, 28; (e) p < 0.05 Day 1 versus day 7; (f) p < 0.05 Day 90 versus day 7, 14, 28; (g) p < 0.001 Day 0 versus day 3.
Peri-implant bone morphology and implant osseointegration of WE43 and Ti
Qualitative histological analysis, displayed in Figure 5, was conducted on WE43 samples at 14, 90, and 180 days after implantation and on Ti samples at 14 and 90 days. For WE43, the peripheral bone around the implant exhibited progressive regeneration from day 14 to day 180. At day 14, newly formed periosteal bone was observed near the pin’s surface. Notably, the pin’s degradation was more evident in the intramedullary region, where degradation products were visible (Figure 5(c)). Large void areas noted on day 14, attributed to gas release, remained visible by days 90 and 180 (Figure 5(d) and (e)). However, direct contact between the bone and the degradation layer/pin was seen on later timepoints and the darker pink bone areas, indicated ongoing new bone formation (Figure 5(e)). The Ti implant on day 14 displayed periosteal bone formation and tissue rearrangement in the intramedullary region. However, a layer of fibrotic tissue was visible near the implant on day 14 and 90 (Figure 5(f)) suggesting poor bone-Ti implant surface contact (Figure 5(g)). Both types of implants exhibited periosteal bone growth 14 days after implantation. Nevertheless, Ti implants showed a more advanced stage of tissue rearrangement in the intramedullary region compared to the WE43 group. On day 90, Ti implants displayed complete bone regeneration despite fibrotic encapsulation, while WE43 implants were still undergoing pin degradation and continuous regeneration.

(a and b) Representative histological images of H&E-stained Sham samples for days 14 and 90; (c–e) representative images of Levai-Lacsko-stained bone sections of WE43 at 14, 90, and 180 days; (f and g) representative images Levai-Lacsko-stained bone sections of Titanium at 14 and 90 days after implantation.
In the Sham group, on day 14, a substantial amount of newly formed immature woven bone was observed filling the defect in the intramedullary region, which later progressed to fill the defect in the cortical areas (Figure 5(a)). By day 90 the cortical bone remodeling was still incomplete, with some areas showing disorganized new bone formation (Figure 5(b)).
Post-implantation characterization of WE43 and Ti implants
Surface evaluation of the explanted WE43 implants showed that the implants kept their integrity up to 90 days and presented a progressive but non-uniform degradation pattern. The intramedullary regions showed higher degradation: pin’s surface became more cracked and rougher compared to the pin regions in contact with the cortical bone and soft tissue. EDX analysis revealed the corrosion products formed on the surface of the WE43 pins were mainly composed of carbon (C), nitrogen (N), oxygen (O), Mg, phosphorus (P), and calcium (Ca), with traces of the alloying elements Y, Zr, and REE. Mg concentration in the corrosion layer decreased with the implantation time, but C, N, and P concentration was consistent at all time points. O and Ca gradually increased up to day 90. The N content detected, while not a degradation product of WE43, was probably a result of cells e organic material adhesion to the implant’s surface 33 (Supplemental Figure B4). With respect to Ti pins, EDX mapping showed C, N, O, and Ti were the most abundant elements on Ti pin surfaces after implantation, along with traces of P, Ca, and the alloying elements aluminum (Al) and niobium (Nb). After 3 and 90 days, higher concentrations of C were depicted on Ti pins, with evidence of more biological tissues attached to the implant surface compared to 7 and 14 days when a higher concentration of O was observed (Supplemental Figure B5).
Characterization of the bone-implant interface
SEM-EDX analysis revealed that at the bone-implant interface, WE43 pin degraded over time (Figure 6) with direct bone-implant contact observed since day 3. The main body of the implant was still present after 180 days of implantation. Regions of the pins were in contact with cortical bone, intramedullary cavity or soft tissues, resulting in the formation of corrosion layers of varying thicknesses (from 1 to 155 µm) and composition. Thicker corrosion layers were formed within the intramedullary cavity (18–155 µm), and at the interface between the soft tissue and the cortical bone (30–89 µm), while thinner corrosion layers were formed in the cortical bone compartment (2–18 µm; Supplemental Figure B6-A). Additionally, corrosion showed a higher degradation rate at 3 and 7 days (1–1.5 mm/year) when compared to later timepoints (Supplemental Figure B6-B) At days 14 and 28, the corrosion layer on intramedullary regions was thicker than on the pin surface in contact with cortical bone or other soft tissues. In the intramedullary cavity, corrosion layers formed without bone contact for up to 14 days, then exhibited bone formation from day 28 to 180. These layers were composed of O, Mg, P, Ca, and trace alloying elements. Although thicker corrosion layers formed at 90 and 180 days, O remained unchanged, while P and Ca enrichment continued in both bone compartments. Interestingly, higher REE concentration was noted in the corrosion layer within the intramedullary region at day 7.

SEM-EDX characterization of the bone-implant interface of WE43 pins at (a) 3, (b) 7, (c) 14, (d) 28, (e) 90, and (f) 180 days after in vivo implantation (n = 3/time point), and corresponding EDX line scans. The solid and dotted purple and sky-blue squares denoted selected regions of interest where EDX line scans were performed in the corrosion layers (CL, denoted by orange dotted lines) formed in the cortical bone and intramedullary cavity compartments, respectively. The line scans were performed from bone (a) to the residual implant side (b), as denoted by the red arrows, and plotted as element weight percentage (wt.%) as a function of normalized distance from the bone to the residual implant.
Ti group’s bone-implant interface was also characterized (Supplemental Figure B.7) and pin integrity over time was confirmed. However, some gaps between bone and implant were noted by day 28. EDX elemental maps showed predominant O, P, and Ca in the bone and Ti, Al, and Nb in implant alloying elements. EDX elemental maps revealed O, P, and Ca as predominant elements in the bone with traces of the alloying elements (Al and Nb) as implant alloying elements. Interestingly on day 90, Nb has been incorporated into bone near the implant.
Yttrium and REE trace accumulation in the liver, kidney, and spleen
The investigation of trace accumulation of Y and REE through ICP-MS analysis of spleen, liver, and kidney samples at 14, 90, and 180 days after implantation are shown in Figure 7. No significant differences were found between timepoints. However, Y and REE presented higher mean concentration in the spleen. In the liver, REE presented higher concentration on all timepoints when compared to Y. The kidney seems to have the lowest affinity for both elements (Y and REE). Y and REE analysis were also performed on Sham and Ti implanted animals displaying a residual concentration of elements (Supplemental Figure B8).

Yttrium and REE concentration values (ng/g) in the (a) spleen; (b) liver, and (c) kidney at 14, 90, and 180 days after surgery. Number of samples: day 14 n = 7; day 90 n = 4; and day 180 n = 4; mean ± SEM.
Discussion
The application of Mg alloys as orthopedic implants faces challenges that limit their widespread use. Information on the long-term behavior of Mg alloys is crucial for assessing their safety, efficacy, and performance in clinical applications. We investigated the expression pattern of selected biomarkers in a non-critical defect model, Sham group, which presented the highest concentrations of DKK1, OPG, VEGF, and KIM-1, particularly on day 14 and day 45 post-surgery compared to the implanted groups (WE43 and Ti). This result was expected since the larger bone defect would have triggered a significant response from the body, measured by higher circulating concentration of biomarkers associated with bone regrowth. Although information on the expression of OPG, DKK1, and VEGF is limited, their expression has been associated with bone healing events. OPG regulates osteoclastic activity by downregulating the OPG/RANK/RANKL system. 9 It is constitutively expressed in unfractured bones and significantly increased throughout the repair process. 34 DKK1, a decoy in the Wnt signaling pathway and a mediator of osteoblastic activity downregulation, has demonstrated increased expression 14 days post-femoral fracture in skeletally mature rats, coinciding with the phase of soft callus formation. 35 VEGF is recognized for its involvement in numerous steps of the fracture healing cascade, ranging from the initial stage of hematoma at the site of bone fracture to the promotion of bone turnover during the final remodeling phase.36,37 According to clinical studies, both plasma and local concentrations of VEGF are correlated with greater in situ angiogenesis. 38 Furthermore, a study conducted on dogs demonstrated higher plasma levels of VEGF in the group with a bone defect with respect to the group with implanted biomaterials. 39 More interestingly, a recent study by Begum et al. 12 utilizing a rodent model equivalent to the one used in the present study, has demonstrated that day 14 post injury represented a critical timepoint of early-bone regeneration. Furthermore, their research revealed woven bone formation in the cortical bone region at day 42, suggesting that bone regeneration processes were still ongoing at this later stage.8,13 Hence, the elevated circulating levels of OPG, DKK1, and VEGF observed on day 45 could be associated to a more advanced stage of the regeneration process. In our study, CT results confirmed the closure of the bone gap by day 14 in the Sham group. Correspondingly, histological findings at this time-point revealed the presence of woven bone formation.
Our study revealed elevated levels of KIM-1 on days 14 and 45 in animals with bone defects (Sham). Although KIM-1 is primarily known as a kidney toxicity biomarker, 40 this finding is particularly noteworthy given the intricate bone-kidney axis which is closely interconnected through shared regulatory pathways. 41 Discovering that the circulating expression of KIM-1 was associated to bone healing, rather than primarily related to the toxicity of implants offers a new perspective, and warrants further investigation.
Regarding the implanted animals, where the bone defect requiring repair was smaller compared to the Sham group, the circulating concentration of biomarkers was anticipated to be lower. However, significant differences remained between WE43 and Ti implants. The histological results of day 14 revealed that Ti-implanted animals underwent an earlier rearrangement of the soft tissue compared to WE43. Both types of implants exhibited new periosteal bone formation in proximity to the implant and extending toward the bone edges. However, within the intramedullary region, the Ti samples showed more pronounced tissue rearrangement and a large bone-implant contact surface. Instead, WE43 group showed large voids due to the release of H2 gas that prevented tissue adhesion to the pin’s surface. These voids were still visible in WE43 group on days 90 and 180. Other studies performed on rats showed similar slow degrading Mg-alloys to release gas up to 1 year after implantation in the femur diaphysis.13,15 The gradual degradation of WE43 and gas void formation that delay bone regeneration, could explain the lower circulating concentration of bone biomarkers such as OPG, VEGF, and KIM-1 on days 7 and 28 in the WE43 group compared to Ti group.
Corroborating the delayed bone regeneration hypothesis in the WE43 group, our findings showed a significant elevation in G-CSF levels at day 90 post-implantation compared to Ti group, aligning with prior research that highlighted G-CSF’s pivotal role in bone regeneration in rats with bone defects.42,43 Longitudinal biomarker analysis in the WE43 group revealed a substantial rise in OPG and VEGF levels at day 90, exceeding earlier measurements at days 7 and 28, indicating continuous bone regeneration. Histological results further supported this, showing persistent bone regeneration at the bone-implant interface in the WE43 group up to day 180, confirming an active bone regeneration stage on animals implanted with WE43 at a later time-point compared to Ti and Sham groups.
A notable finding in the Ti group was the presence of a fibrotic lining at the interface between the implant and bone on days 14 and 90. This fibrotic encapsulation of Ti implants, indicative of a foreign body reaction to metallic alloys, has been well-documented in the literature and associated with suboptimal implant osseointegration. 44 On the other hand, the WE43 group exhibited direct bone-implant contact without fibrotic tissue development, confirming previous results found in the literature 28 and suggesting a more favorable osseointegration.
Relevant findings in the WE43 group seemed to converge at 28 days after implantation, especially in relation to the biomarkers FGF23 and IL-10. FGF23 is crucial in the regulation of mineral ions and previous pre-clinical research suggested that its expression is associated with mineralized tissue-forming cells like osteoblasts, mainly during the stage of new bone and soft callus formation.45,46 We found the lowest circulating concentration of FGF23 on day 28 in WE43 group. Coincidently, SEM-EDX analysis on day 28 revealed a thicker degradation layer in the intramedullary region of the pin, accompanied by the presence of new compact bone in direct contact with the implant. Furthermore, EDX elemental mapping of the intramedullary region demonstrated that the degradation layer contained a higher phosphorus content compared to other timepoints. Accordantly, the WE43 group presented a significantly higher concentration of IL-10 at day 28 when compared to the Ti and Sham groups, maintaining this elevated cytokine level from days 28 to 90. IL-10, a potent anti-inflammatory cytokine, is known for its inhibitory effect on osteoclastogenesis and its role in promoting osteogenesis.47,48 In vitro studies have shown that Mg2+ increases IL-10 expression21,49 and an in vivo study further supported the osteogenic property of IL-10 by correlating elevated IL-10 levels to successful osseointegration and bone formation after Mg-alloy implantation. 21 As previously mentioned, WE43 pins presented a ticker corrosion layer in the intramedullary region at day 28, suggesting an accelerated degradation of the implant at this specific timepoint, possibly leading to higher release of Mg2+. This phenomenon could plausibly explain the observed increase in plasma concentration of IL-10 at the same time-point.
Finally, our results confirmed the trace accumulation of Y and REE in organs farther from the implantation site, with the spleen and liver showing the highest affinity for accumulation of Y and REE. REE are commonly incorporated into Mg-alloys to enhance corrosion resistance and mechanical properties and although it has been reported that REE can be excreted by the organism, their long-term biological impact is poorly understood. 50 Although existent research has predominantly focused on the distribution of Mg and alloying elements near the implant, with some studies reporting an increased Mg concentration in peri-implant tissues,13,51 there has been few investigations into the systemic accumulation of REE in organs distant from the implant site. 52 Therefore, although we are far from being able to apply biodegradable WE43 implants in significant human long bones, such as the femur, the prospect of employing multiple smaller WE43 implants for fracture repair emphasizes the urgency of comprehensively examining the long-term systemic consequences of REE.
The outcomes of the present study are pioneer and show an innovative approach. Nonetheless, future studies should consider the assessment of circulating biomarkers in healthy rats of both genders to investigate baseline levels and their possible correlation with gender and natural aging of the animal. Additionally, considering the novelty of our results, it would be beneficial to assess the sensitivity and specificity of the presented panel of biomarkers through gold-standard techniques such as analyzing gene expression from tissue collected at implant vicinity or conducting immunohistology.
Conclusions
We highlight the effectiveness of circulating biomarkers as a detection tool for monitoring physiological changes after implantation of Mg-alloy in rat’s femurs. A specific pattern of expression of bone biomarkers, including OPG, VEGF, DKK1, and KIM-1, appeared to be correlated to phases of active bone regeneration, as demonstrated by the higher levels of these biomarkers in the Sham group. Furthermore, differential biomarkers levels, specifically OPG and VEGF, were observed between WE43 and Ti groups. The WE43 group displayed an ongoing bone regeneration, where the gradual degradation of the alloy and hydrogen gas release seemed to prolong the bone regeneration timeline compared to Ti group. Interesting findings specific to WE43 group were the reduced FGF23 and elevated IL-10 plasma levels on day 28. Finally, we demonstrated the accumulation of Y and REE in organs distant from implantation site after 90 days of WE43 implantation. These results emphasize the necessity for comprehensive research on the long-term systemic impact of REE released from Mg-alloys. Finally, we drew attention to the potential utilization of biomarkers such as FGF23 and KIM-1, which, despite their established application in other clinical domains, remain relatively unexplored in the realm of bone regeneration or orthopedic implantation. Our results bring new hypotheses for further exploration in specific circulating biomarkers to monitor implants osseointegration and the effects of Mg-alloys degradation products.
Supplemental Material
sj-docx-1-tej-10.1177_20417314241290595 – Supplemental material for Monitoring osseointegration and degradation of Mg-alloy implants through plasma biomarkers of inflammation and bone regeneration
Supplemental material, sj-docx-1-tej-10.1177_20417314241290595 for Monitoring osseointegration and degradation of Mg-alloy implants through plasma biomarkers of inflammation and bone regeneration by Eduarda Mota-Silva, Diana C. Martinez, Giuseppina Basta, Serena Babboni, Serena del Turco, Davide Fragnito, Stefano Salvadori, Claudia Kusmic, Leon Riehakainen, Daniele Panetta, Beatrice Campanella, Massimo Onor, Tomasz Plocinski, Wojciech Swieszkowski and Luca Menichetti in Journal of Tissue Engineering
Supplemental Material
sj-docx-2-tej-10.1177_20417314241290595 – Supplemental material for Monitoring osseointegration and degradation of Mg-alloy implants through plasma biomarkers of inflammation and bone regeneration
Supplemental material, sj-docx-2-tej-10.1177_20417314241290595 for Monitoring osseointegration and degradation of Mg-alloy implants through plasma biomarkers of inflammation and bone regeneration by Eduarda Mota-Silva, Diana C. Martinez, Giuseppina Basta, Serena Babboni, Serena del Turco, Davide Fragnito, Stefano Salvadori, Claudia Kusmic, Leon Riehakainen, Daniele Panetta, Beatrice Campanella, Massimo Onor, Tomasz Plocinski, Wojciech Swieszkowski and Luca Menichetti in Journal of Tissue Engineering
Footnotes
Acknowledgements
We gratefully acknowledge the Euro-BioImaging research infrastructure (![]() ), hosted by the National Research Council in Pisa, for providing open access to advanced imaging technologies in the fields of biological and biomedical imaging, which significantly contributed to the success of this study. We would like to extend our special thanks to Ms. Elisabetta Spagnolo from the Institute of Clinical Physiology of the National Research Council for her invaluable assistance in managing and supporting the administrative aspects of this research. Additionally, we sincerely appreciate the support of Dr. Lorena Tedeschi from the same institute for her expertise and dedicated efforts in preserving the implant and explant samples.
), hosted by the National Research Council in Pisa, for providing open access to advanced imaging technologies in the fields of biological and biomedical imaging, which significantly contributed to the success of this study. We would like to extend our special thanks to Ms. Elisabetta Spagnolo from the Institute of Clinical Physiology of the National Research Council for her invaluable assistance in managing and supporting the administrative aspects of this research. Additionally, we sincerely appreciate the support of Dr. Lorena Tedeschi from the same institute for her expertise and dedicated efforts in preserving the implant and explant samples.
Declaration of conflicting interests
The author(s) declared no potential conflicts of interest with respect to the research, authorship, and/or publication of this article.
Funding
The author(s) disclosed receipt of the following financial support for the research, authorship, and/or publication of this article: This research was carried out in CNR-IFC in close collaboration with Faculty of Materials Science and Engineering Warsaw University of Technology in Poland, within the project “Promoting safety by a novel combination of imaging technologies for biodegradable magnesium implants, MgSafe” funded by the European Union’s Horizon 2020 Marie Skłodowska-Curie Action (MSCA; grant number No. 811226).
Supplemental material
Supplemental material for this article is available online.
References
Supplementary Material
Please find the following supplemental material available below.
For Open Access articles published under a Creative Commons License, all supplemental material carries the same license as the article it is associated with.
For non-Open Access articles published, all supplemental material carries a non-exclusive license, and permission requests for re-use of supplemental material or any part of supplemental material shall be sent directly to the copyright owner as specified in the copyright notice associated with the article.