
Abstract
The incidence of ulcerative colitis (UC) is rapidly rising worldwide. Oral drug delivery system is a promising approach for treating UC, but it often fails to accumulate to the inflammatory lesions, thus, it is impressive to develop a colon-targeted oral delivery system for preventing systemic toxicity and maintaining UC therapeutics. Here, a negative-charged PLGA nanoparticle system was designed to encapsulate celastrol (Cel), and then chitosan and mannose were coated on the surface of the nanoparticles (MC@Cel-NPs) to endow these nanoparticles with the mucosal adsorption and macrophage targeting abilities. MC@Cel-NPs demonstrate excellent resist decomposition ability against the strong acidic gastrointestinal environment, and accumulates in the specific inflammatory sites through the affinity of electrostatic reaction. After releasing the payload, MC@Cel-NPs could remarkably alleviate the colon inflammation, which was evidenced by the decrease in pro-inflammatory cytokines TNF-α, IL-1β, and IL-6 in both blood and colon sections, and scavenging reactive oxygen species (ROS) in colon cells, including macrophage, neutrophil, T cell, and B cell. This nanoparticle system provided a new approach for treating UC through a Chinese herbal ingredient-related oral delivery manner.
Introduction
Inflammatory bowel disease (IBD), commonly including Crohn’s disease (CD) and ulcerative colitis (UC), is a chronic inflammatory disease that occurs in the gastrointestinal tract. It is clinically characterized by severe diarrhea, abdominal pain, and bloody stools. This disease has a relapsing and long-lasting course, significantly affecting the quality of life of patients. 1 Currently, there is no definitive cure for UC, and it is recognized by the World Health Organization as one of the most challenging diseases to treat. Studies have shown that patients with UC have a significantly higher risk of developing colorectal cancer compared to the general population. 2 Therefore, the development of safe and effective novel drugs and treatment strategies is of great significance in alleviating and controlling the progression of UC. Although the pathogenesis of UC is still not well understood, 3 anti-inflammatory drugs such as salicylates 4 and glucocorticoids, 5 along with adjunctive therapies like immunomodulators and other related biologics, have shown some efficacy. 6 However, the use of these drugs is limited due to their varying degrees of side effects and other issues. Therefore, it is imperative to explore alternative medicines with minimal side effects and natural properties, as well as develop new locally targeted treatment techniques and approaches. 7
Abnormal cytokine responses play a critical role in the pathogenesis and perpetuation of IBD, because cytokines are directly responsible for causing mucosal injury, thereby leading to subsequent tissue damage. 8 UC is characterized by Th2-mediated immune response, and proinflammatory cytokines, such as IL-1β, IL-6, and TNF-α, are crucial in the pathogenesis of UC. Therefore, targeting cytokine could be as a promising strategy in IBD treatment. Moreover, recent study 9 has shown that oxidative stress plays an essential role in the pathogenesis and progression of IBD. Oxidative stress, mainly reactive oxygen species (ROS) can cause damage to the mucosal layer in the gastrointestinal tract (GIT), leading to bacterial invasion, which then stimulates the immune response and initiates IBD. Based on the data collected from experimental and clinical studies, it is supposed that the free radicals and free radical-stimulated pathways could be pharmacological targets for treating IBD.
Celastrol, a pentacyclic triterpenoid compound extracted from the root of Tripterygium wilfordii, has attracted widespread attention due to its potential medicinal values. Clinical studies 10 have shown that Celastrol possesses strong anti-inflammatory and immunosuppressive activities, as well as antioxidant and anti-rheumatic properties. Celastrol can also regulate the polarization of peritoneal macrophages towards the M2 phenotype through Sirt1 and HO-1. 11 By promoting microglia/macrophage M2 polarization and reducing the expression of NF-κB, Celastrol significantly alleviates damage caused by transient global cerebral ischemia and permanent brain ischemia. 12 It is reported that higher doses of Celastrol (2 mg/kg/day) given continuously for more than 10 days significantly alleviate symptoms of UC in experimental colitis models. 13 Celastrol upregulates anti-inflammatory mediators at the RNA and protein levels and improves the balance between Treg/Th1 and Treg/Th17 to maintain colonic immune homeostasis. 14 Our in vitro results also show the strong ROS scavenging ability of Celastrol in inflammatory macrophages. Based on these evidences, we speculate that Celastrol has great potential and values in the alleviation and treatment of UC. Nevertheless, the substantial adverse effects, including severe hepatotoxicity, nephrotoxicity, and reproductive toxicity, 15 significantly curtail the potential clinical utility of Celastrol.
Due to good patient compliance and low adverse reactions, oral administration is one of the most commonly used method for drug delivery. After administration, drugs intended for local treatment or systemic distribution can be absorbed in the gastrointestinal tract. However, poor solubility, stability, and bioavailability make it challenging to achieve therapeutic levels through this approach. There has been extensive exploration of oral delivery, among which nano-delivery systems have attracted great attention. Drug-loaded nanocarriers (NCs) include nanoparticles (NPs; polymeric NPs, lipid NPs, and inorganic NPs), micelles, nanoemulsions, liposomes, etc., which are increasingly drawing the attention of researchers.16,17 The negatively charged nanoparticle drug delivery system 18 supposes to be adhered and enriched into inflamed tissues through electrostatic interactions. It has been reported that anionic liposomes exhibited stronger adhesive capacity, with adhesion levels twice as high as those of cationic liposomes and neutral liposomes. 19 Also, mannose ligand modification also endows the nanoparticles with intestinal epithelial barrier targeting capabilities. 20
To address these issues, we synthesized chitosan and mannose modified Cel-loaded PLGA nanoparticles (MC@Cel-NPs), and speculated that the NPs might shield Cel from the harsh acidic conditions of the gastrointestinal tract. Additionally, the massive negative charges on the surface allowed them to adhere to inflamed colonic mucosa. Furthermore, they exhibited responsiveness to internal or external inflammatory cues, ensuring the precise delivery of Cel to the inflamed colon lesions (Figure 1). The bioactivity study revealed that MC@Cel-NPs effectively inhibited the deterioration of dextran sulfate sodium salt (DSS)-induced UC in mice, and significantly inhibited the production of ROS in the colons. Also, the pro-inflammatory cytokines IL-6, TNF-α, and IL-1β in the colons and in blood were both remarkably reduced.

Schematic illustration of the preparation of Cel-loaded PLGA nanoparticles modified with chitosan and mannose (MC@Cel-NPs) and their treatment for ulcerative colitis (UC). (a) preparation of Cel-encapsualted PLGA NPs by emulsification-evaporation method, and conjugation of chitosan and mannose to the surface of NPs. (b) The pH range of gastrointestinal (GI) tract and morphological sketch of MC@Cel-NPs in different pH conditions. (c) Schematic illustration of orally-administrated MC@Cel-NPs for the targeting UC treatment through inhibition of ROS-production and suppress the cytokine storm in the inflammed colons. We draw this picture using “BioRender”, and the we got their publishing permission, the agreement Number is “NF270IS75U”.
Materials and methods
Materials
Celastrol (Cel, 98%) was purchased from Anhui Zesheng Technology Co., Ltd (Anqing, China). PLGA (lactide: glycolide 50:50, molecular weight 38,000 g/mol) and 2′,7′-dichlorofuorescein diacetate (DCFH-DA) kits were bought from Sigma (USA). Dichloromethane was bought from Aladdin Bio-Chem Technology Co., LTD (Shanghai, China). Chitosan (deacetylated chitin), degree of deacetylation molecular weight 20–60 kDa, was bought from MKBio. Co, Shanghai, China. D-Mannose (purity >98%, molecular wight 180.16, CAS: 3458-28-4) was bought from BioDuly Co, Nanjing, China. CCK-8 kit was obtained from Beyotime Biotech Inc. (Nanjing, China). RPMI-1640 medium, DMEM medium, fetal bovine serum (FBS), trypsin, and penicillin-streptomy were purchased from Gibco BRL (USA). Rabbit anti-Myeloperoxidase monoclonal antibody (abs159595) was obtained from Absin (Shanghai, China). IL-1β (ab315084), IL-6 (ab290735) monoclonal antibodies were purchased from Abcam (UK). NLPR3 mAb (#15101) was purchased from cell signaling technology (USA). Mito- and lyso- tracker were bought from Invitrogen (USA). Collagenase (Type IV, LS004189) was bought from Worthington Biochemical Corp. (USA). PerCP/Cyanine5.5 anti-mouse Ly-6G antibody (127616), Biotin anti-mouse F4/80 antibody (123106), and PE anti-mouse CD206 (MMR) antibody (141706) were bought from Biolegend (USA). CD11c BUV395 HL3 antibody was bought from BD Bisciences (USA). Streptavidin (APC), eBioscience™ Fixable Viability Dye eFluor™ 780 (65-0865-18) and CD11b monoclonal antibody (M1/70), eFluor™ 450 (48-0112-82) were obtained from Thermo Fisher Scientific Co. (USA). All chemicals were of analytical grade. Primary antibodies against Nrf2 were purchased from Cell Signaling Technology (Boston, MA, USA). Phalloidin was purchased from Cytoskeleton, Inc. (Denver, CO, USA). Fluorescence-conjugated secondary antibodies (Alexa Fluor® 488) were purchased from Abcam (Cambridge, UK).
Cells
RAW264.7 cells and Caco-2 cells were bought from Fuheng Biology (Shanghai, China). The cells were cultured in DMEM (Gibco, USA) with 10% fetal bovine serum (Gibco) containing 100 µg/mL streptomycin and 100 IU/mL penicillin at 5% CO2 and 37°C.
Preparation of Celastrol-loaded nanoparticles (MC@Cel-NPs)
The MC@Cel-NPs were synthesized using emulsification and evaporation method as previously described 21 with some modifications. Briefly, 50 mg Cel and 200 mg PLGA were dissolved in 5 mL of dichloromethane as the oil phase, and this phase was homogenized for 90 s on ice. Then, 15 mL of water phase (1% of PVA solution, including 0.3% of chitosan/mannose and 0.5% glacial acetic acid) was added into the oil phase and followed by homogenized for 3 min on ice to form the Cel-loaded PLGA emulsification. Then, the emulsion was transferred into an air fume to stir for 6 h for evaporation and NPs hardening. Finally, the nanoparticles were harvested by centrifuging at 12,000 rpm for 20 min and washed three times using ultrapure water. The harvested nanoparticles were stored at 4°C or lyophilized for long term preservation.
Characterization of nanoparticles
The size distribution and zeta potential of the nanoparticles were determined using a Nano Particle Analyzer SZ-100 (Horiba Scientific, USA). Morphology of NPs were scanned by scanning electron microscopy (Philips Co, Holland). The encapsulation of Cel was detected using an ultraviolet and visible spectrophotometer (UV-2700, Shimadzu Corporation, Japan). The loading rate and concentrations of MC@Cel-NPs were measured by microplate reader (Infinite 200 pro, Swiss) at 425 nm, and calculated the concentration of Cel based on the standard curve (Supplemental Figure S1). The crystal structure was meticulously examined by the Differential Scanning Calorimetry (DSC) spectra thermal analyzer (TA Q10, USA) and tyndall effect.
In vitro cytotoxicity of Cel and MC@Cel-NPs
RAW264.7 cells and Caco-2 cells were seeded at 5000 cells per well in 96-well plate with 100 µL complete DMEM and cultured for 24 h. After removing the old medium, the cells were treated with 100 µL medium containing different concentrations of Cel or MC@Cel-NPs for another 24 h. Then, the cell viability was assayed by the CCK-8.
In vitro anti-inflammation of Cel and MC@Cel-NPs
For the examination of inflammatory factors, RAW264.7 were seeded in 12-well culture plates (8 × 10⁵ cells/well) and activated with LPS (1.0 mg/mL) for 2 h. Next, the cells were treated with Cel or MC@Cel-NPs at 200 ng/mL for 6 h. The medium suspensions were collected to measure the pro-inflamation cytokines (IL-6 and TNF-a) using specific ELISA kits. And, cells of each group were collected by trypsinization and lyzed in RIPA. The intracellular levels of TNF-a, IL-6, and IL-1β were measured using Qt-PCR.
Cellular uptake and intracellular location of NPs
The cells were cultured with C6-labeled NPs for 4 h, and washed twice with PBS to remove unbound nanoparticles. The cells were imaged using a Live Cell Imaging System (EVOSFL Auto, Invitrogen, USA). For LPS induction and mannose blocking, LPS (1 µg/mL) or mannose (50 µM) were added into the cell medium at 1 h previous NPs addition. For further intracellular location determination, the cells were cultured with NPs for 1 h, then, the lyso- or mito- tracker were added to culture for another 2 h, and rinsed twice with PBS, stained with DAPI (locate the nucleus) and sealed the cells with glycerol before imaged under a laser confocal microscope.
For immunocytochemistry analysis, RAW264.7 cells were seeded on coverslips overnight. After the treatment, the cells were stimulated with LPS. The cells were incubated for 24 h, followed by 4% PFA fixation for 20 min. The cells were permeabilized and stained with the indicated primary antibodies (anti-Nrf2) at 4°C overnight. The cells were incubated with fluorescence-conjugated secondary antibodies (Alexa Fluor® 488) for 2 h, followed by incubation with phalloidin and DAPI for 15 min. Finally, cytoskeleton and protein expression were visualized by a confocal fluorescence microscopy system.
Intracellular ROS production
The intracellular ROS generation was detected using DCFH-DA kits. First, RAW264.7 cells or Caco-2 cells with a density of 5 × 10⁵ cell/mL were cultured in 6-well plates for 12 h. Then, new completed medium containing different concentrations of compounds were added into plates and further incubated for 2 h. Next, 1 μg/mL LPS was used to stimulate all groups for 6 h except the negative group. The cells were harvested and washed twice with PBS, and then cultured with 10 µM DCFH-DA in medium for 30 min at 37°C in dark. After rinsing with PBS to wash the extra DCFH-DA, the intracellular ROS was assayed by flow cytometry according to the manufacture’s protocol.
Investigation of MC@Cel-NPs on macrophage polarization
To investigate whether Cel or MC@Cel-NPs could reverse the M1 polarization of macrophages, RAW 264.7 cells were seeded in 12-well plates at 2 × 10⁵ cells/well and incubated overnight. Then, cells were stimulated with LPS (100 ng/mL) for 12 h. After that, the LPS culture medium was replaced by the fresh medium containing Cel or MC@Cel-NPs at 200 ng/mL and incubated for 24 h. Cells were washed with ice-cold PBS and collected, followed by incubation with BUV396 anti-mouse CD11c, PerCP-Cyanine5.5 anti-mouse CD206, PE anti-mouse F4/80 and APC anti-mouse CD11b antibody label M1 and M2 phenotypes of macrophages, respectively, and analyzed by flow cytometry (LSRFortessa, BD, USA). The data was processed with the Flowjo 10.6 software.
Moreover, the reversal degree of the M1 polarization of LPS-induced macrophages by MC@Cel-NPs was also verified by analyzing the mRNA expressions of IL10 and iNOS.
Animal study
Male C57/6J mice (8–10 weeks) were purchased from SPF biotechnology co., LTD (Beijing, China). All the experiments were performed in accordance with relevant guidelines and regulations of Animal Ethics Committee of Guangdong province, China. The animal care and study protocols were approved by the Institutional Animal Care and Use Committee of Guangdong Medical University.
Hemolysis assay
To determine the in vivo biosafety of the compounds, hemolysis of red blood cells treated with the designated compounds were performed according to the previous studies. 22 Erythrocytes were originated from normal healthy C57BL/6J mice through washing the anticoagulant whole blood with PBS at 3000 rpm for 10 min. Then, a 5% red blood cell suspension (v/v, in PBS) was blended with different formulations of Cel. The erythrocyte sample lyzed in water was used as positive control, and erythrocytes diluted in PBS was used as negative control group. After incubating with 100 µg/mL of compounds at 37°C for 4 h, all the samples were centrifuged at 3000 rpm, 4°C, for 10 min to collect the supernatant and measure its absorbance value at 550 nm using microplate reader (TECAN, Switzerland).
In vivo biosafety assay
To determine the biosafety of Cel-loaded NPs in vivo, different formulations of Cel (Free Cel and MC@Cel-NPs) were I.G. administrated to Dextran Sulfate Sodium Salt (DSS) induced colitis mice (dosage: 200 µg/kg body weight, five mice/group) for one week, once per day. Five healthy normal mice were used as the “basal” group. The pathological sections of main organs were stained with hematoxylin and eosin (H&E) to evaluate the toxic effects of Cel or MC@Cel-NPs. The levels of alanine transaminase (ALT) and aspartate transaminase (AST) of liver homogenate in each group were also determined using the assay kits (C010-2-1, Nanjing Jiancheng Bioengineering Institute, China).
DSS-induced UC mouse model
The 2.5% (w/v) of DSS solution was freshly prepared every other day to induce ulcerative colitis model. To study the therapeutic efficacy of MC@Cel-NPs, 20 mice were divided into four groups with five mice in each group: (1) Basal: normal healthy control (i.e. no treatment), (2) only DSS treatment, (3) DSS+ Cel (200 µg/kg), and (4) DSS+ MC@Cel-NPs (200 µg/kg of Cel equivalent). DSS solutions were replaced with fresh water after 7 days of induction. The mice were sacrificed after 2 days and specific tissues were collected.
In vivo biodistribution of NPs
To determine the biodistribution of NPs in cells or organs, NPs containing a fluorescent dye indocyanine green (ICG) or Coumarin 6 (C6) were prepared using the above procedure, except that 250 μg fluorescent dye was added into the oil phase. The incorporated dye acts as a fluorescent marker for NPs and offers a sensitive method to determine qualitatively and quantitatively organs distribution or intracellular uptake using IVIS imaging system or flow cytometry.
To determine the inflammatory colon-targeted properties of NPs, DSS-induced UC mice were received a single dose intragavage (I.G.) of ICG-labeled NPs. The healthy mice without any treatment were used as “Basal” group. The mice were anesthetized using isoflurane at the designated time points and imaged using in vivo imaging systems (IVIS; Kodak Multi Mode) at 740/820 nm (for ICG). At the end point, mice were sacrificed to obtain and photographed the intestine, colon, and all the major organs (heart, liver, spleen, lung, and kidney). The mean fluorescence intensity (MFI) was analyzed by the Living Imaging software.
In vivo cellular uptake of NPs
The colitis mice were I.G. administrated with C6-labeled Cel or MC@Cel-NPs. After 8 h, the mice were euthanized, and the colon tissues were dissected to prepare frozen sections and cell suspension. Colon tissues were rinsed thoroughly with PBS and embedded in Optimal Cutting Temperature compound (Sukura, Japan). Sections (5–10 μm) were stained with DAPI to locate the nuclei. Images were acquired using a Leica SP8 confocal microscope. The cell suspension was co-cultured with Fixable Viability Dye (eFluor™ 780, eBioscience), CD11b (eFluor™ 450, eBioscience), F4/80 (PE, Biolegend), Ly-6G (Percp/cyanine 5.5, Biolegend) in FACS buffer (PBS with 2% FBS) for 30 min at 4°C. Macrophages were identified as F4/80+CD11b+ and neutrophils were identified as Ly6G+CD11b+ sorted cells. Flow cytometry data were acquired on BD LSRFortessa X-20 and analyzed using FlowJo software (Tree Star).
Disease activity index (DAI) scores
DAI was determined by body weight loss, stool consistency, and stool bleeding recorded every day. The scores were evaluated according to the previous study. 23 Briefly, body weight loss (less than 1%: 0; 1%–10%: 1; 10%–15%: 2; 15%–20%: 3; and more than 20%: 4). Stool scoring (normal: 0–1; loose: 2–3; and diarrhea: 4). Fecal blood (normal: 0–1; occult blood: 2–3; and gross bleeding: 4).
Histology
The colon, spleen, liver, lung, kidney, and heart were collected from mice with different treatments were fixed by 5 min instillation of 10% formalin through trachea catheterization at a trans-pulmonary pressure of 15 cm H2O, and then fixed in 10% formalin at room temperature for 48 h. After that, lungs were embedded in paraffin, cut into 5 µm sections, and stained with hematoxylin and eosin (H&E), MPO, IL-1β, IL-6, and NLRP3 antibodies, separately.
Pro-inflammation assay
Inflammatory cytokines in plasma, including IL-6 and TNF-α, were assessed by ELISA kits (Jiangsu Meimian Industrial Co., Ltd).
Determination of inflammatory cell infiltration and ROS level in colon tissues
Colon mononuclear cells were prepared as previously described. 24 The colons were extracted from the mice and put into the precooled RPMI1640 medium with 10% fetal bovine serum (FBS). Then, the tissues were grinded and passed the cell suspension through a 40 µm of sterile nylon filter. The cells were collected and 1 × 10⁶ cells were used for antibody staining. For surface staining, cells were stained with antibodies in PBS containing 1% FCS (Hyclone) on ice for 30 min. The samples were acquired on LSRFortessaTM X-20 (BD, USA) and analyzed with FlowJo software (Treestar, USA).
For DHE staining, 1 μmol/L Dihydroethidium (DHE) solution was dropped on the colon tissue sections, and incubated at 37°C in the dark for 20 min. Next, the samples were washed with PBS for 3 × 5 min. Before mounting, samples were incubated with 4′,6-diamidino-2-phenylindole (DAPI) for 5 min at room temperature and washed three times with PBS for 5 min, and then assayed by a confocal microscope.
qRT-PCR
The mRNA levels of IL-6, TNFα, IL-1β, and iNOs were evaluated by qRT-PCR. RAW 264.7 cells stimulated with lipopolysaccharide (LPS, 100 ng/mL) were seeded in 6-well plates at the density of 1 × 10⁵ cells/well and incubated overnight. The culture medium was replaced by the fresh medium containing Cel or MC@Cel-NPs at 200 ng/mL, and incubated for 24 h. Then, the total RNA was isolated from cells by the TRIzol reagent (Invitrogen, Carlsbad, California, USA), followed by measuring its concentration using a NanoDrop spectrometer (ND-2000, Thermo Scientific, USA). The qRT-PCR was performed on a CFX96 real-time PCR detection system (Bio-Rad, Hercules, California, USA) by using TB Green Premix Ex Tag II (TaKaRa Bio Inc., Japan) with 25 μL reaction mixtures. The relative mRNA expression levels of NF-κB and I-κBα were calculated by specific primers normalized to GAPDH according to the 2−ΔΔCt method (enlisted in Table S8)
Statistical analysis
Results were expressed as mean ± SD. Statistical significance was determined by one-way ANOVA with a Games-Howell post hoc analysis for multiple-group comparisons. Two-group comparisons were analyzed by the two-tailed unpaired Student t -test.
Results
Characterization of Cel loaded PLGA-PEG NPs
During the synthesis process, mannose and chitosan were added to the aqueous phase (schematic of synthesis shown in Figure 1(a)). Dynamic light scattering (DLS) assay shows that the sizes of Cel-NPs are around 380 nm (Figure 2(a)), and the PDI (polydispersity index) <0.5, indicating the relative stability of the nanoparticles. And, the zeta potential is around −55 mV (Figure 2(b)), and the negative charges on the surface of the nanoparticles impart their characteristic of targeting the cationic surfaces of inflamed colons. 25 The SEM (scanning electric microscope) image showed the nanoparticles exhibited a regular spherical shape (Figure 2(c)). Physico-chemical properties of the MC@Cel-NPs was investigated by fourier transformer infrared spectrum (FT-IR), which indicated that characteristic spectral peak did not have major shifts or loss of functional group peaks, suggesting during the nanoencapsulation process, there was no chemical interaction between drug and polymer, as the characteristic peaks of polymer and drug were retained in the FT-IR spectra of MC@Cel-NPs (Figure 2(e)). The UV-vis spectrum of the NPs was measured to determine the loading of Cel in NPs (Figure 2(d)). The absorption spectrum of Cel exhibited the characteristic absorption peaks at 425 nm. The absorption spectrum of the Cel-NPs was closely consistent with that of free Cel, indicating a successful encapsulation of Cel into the NPs. The loading capacity and encapsulation efficiency of Cel were ~88% and 67% in Cel-NPs, which was calculated based on the standard curve of Cel (Supplemental Figure S1) at their UV absorption peak of 425 nm, determined by UV-vis spectrophotometer.
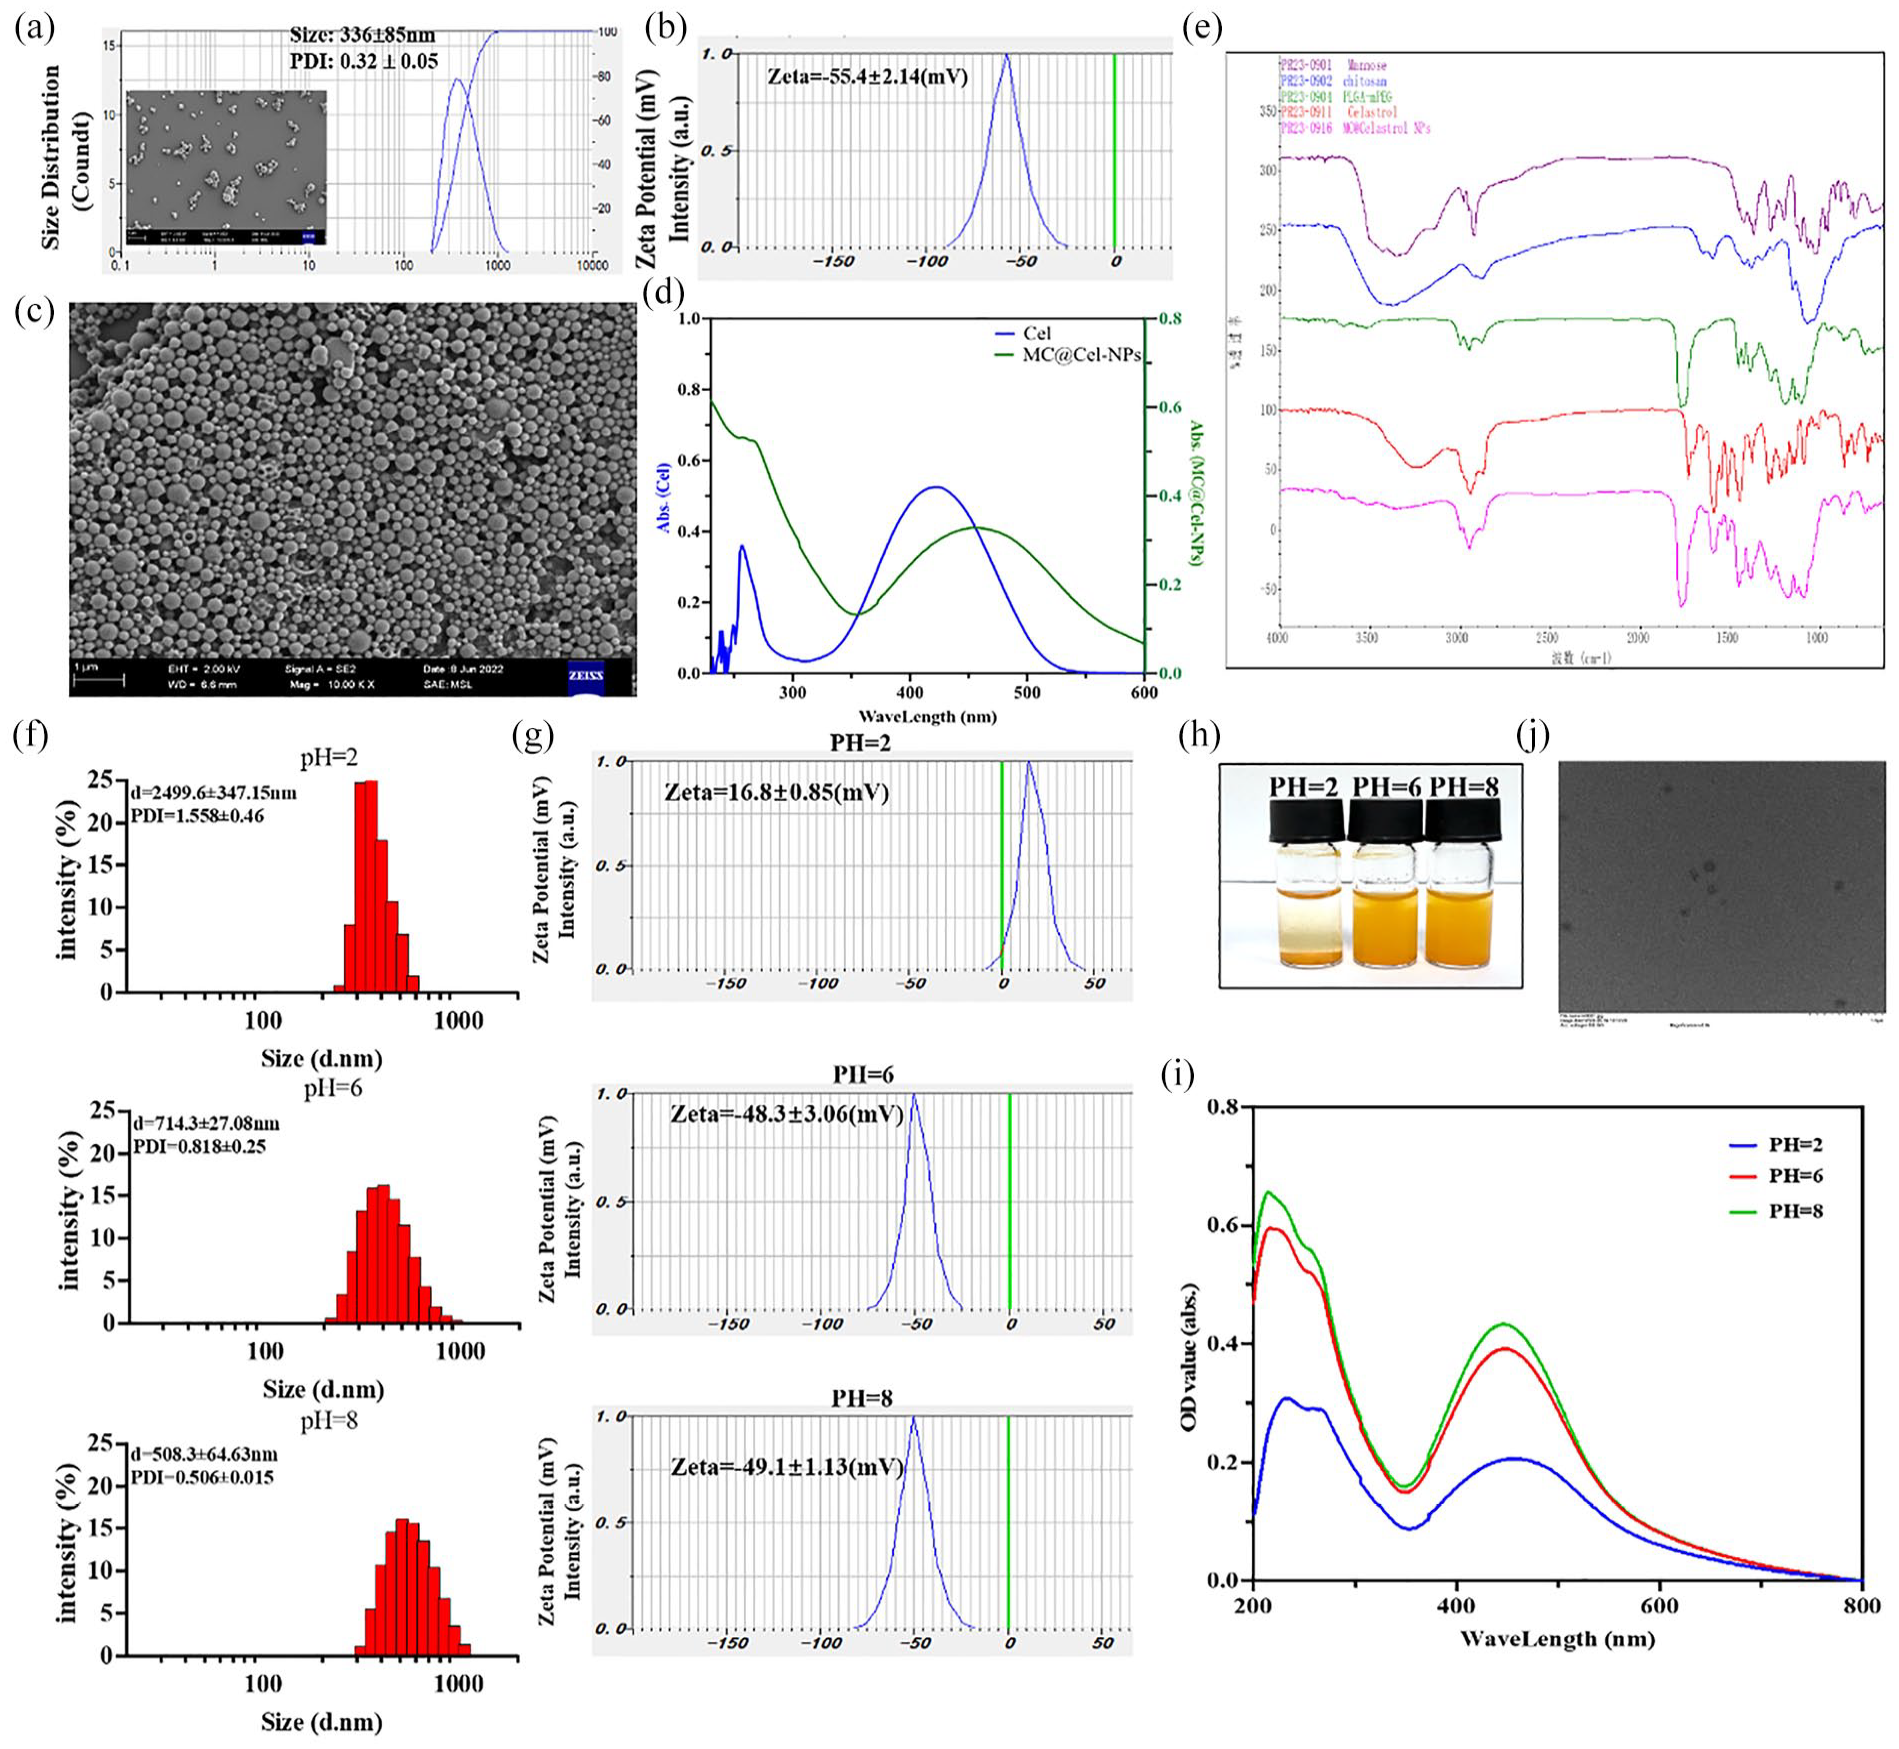
Characterizations of MC@Cel-NPs. (a) Size distribution and zeta potential of the as-synthesized MC@Cel-NPs (The SEM image of single NPs was inserted, scale bar: 1 µm). (b) Zeta potential of the as-synthesized MC@Cel-NPs. (c) Representative morphology image of MC@Cel-NPs determined by scanning electron microscope (1 bar = 1 µm). (D) UV-vis spectra of free Cel and MC@Cel-NPs. (e) FT-IR spectra of chitosan, mannose, PLGA-PEG, Cel, and MC@Cel-NPs. (f) The size distribution and PDI of MC@Cel-NPs solutions at pH = 2, 6, and 8. (g) The zeta potentials of MC@Cel-NPs at different pH conditions. Data were presented as mean ± SD (n = 3). (h) The color comparison of Cel in DMSO or/and MC@Cel-NPs in solution at different pH. (i) The UV–vis spectra of MC@Cel-NPs under different pH conditions. (j) The TEM image of MC@Cel-NPs.
Besides, to determine the best modification conditions, the Cel-loaded PLGA NPs are modified single chitosan, single mannose or the mixture of chitosan and mannose, respectively (shown in supplemental Figure S1). All modified Cel-NPs exhibited typical nano-colloidal characteristics (Supplemental Figure S1A). The NP size plays a key role in their long circulation, biodistribution, and clearance. Comparing with the big microparticles, the small size of NPs allows a higher intracellular uptake. Except for the chitosan-modified NPs distributed from 800 nm to 1 µm, all the other modified Cel-NPs were of ~300 nm. The zeta potential, which depends on the surface charge, is important for the stability of nanoparticles in suspension and is also the major factor of nanoparticles onto the biological microenvironments. 26 The lower absolute value of zeta potential means the relatively lower stability of the NPs. Thus, we speculated that except for no modified Cel-NPs and CS@Cel-NPs, all the other modified NPs were with good stability and dispersion. Moreover, the drug loading is very important for the nanoparticle delivery system. The loading rate of Cel into the NPs was calculated according to the standard curve of Cel (Supplemental Figure S1G) at 425 nm. The UV-visible absorption spectrum (Supplemental Figure S1H) demonstrated that except chitosan modified NPs, the high concentration of chitosan and mannose modified NPs showed a lower Cel loading rate compared with the higher loading rate of mannose@Cel-NPs and MC@Cel-NPs (3 mg/mL). Taken together, the optimal modification condition was determined to be at a lower concentration of 3 mg/mL for mannose and chitosan modified Cel-NPs. Subsequently, MC@Cel-NPs of this modification (3 mg/mL) were employed in subsequent experimental protocols. In addition, the Tyndall effect (Supplemental Figure S1J) and DSC spectra (Supplemental Figure S1J) indicate that Cel in NPs formulation was not crystal but nano colloids.
In vitro release kinetics of Cel from MC@Cel-NPs ((Supplemental Figure S1K) demonstrated that at first 2 h in gastric acid, there was almost no Cel released, and from 2 to 8 h, there was only ~20% Cel was released from NPs, and most of Cel was released from 8 to 24 h at colon environment.
Moreover, the morphological and physicochemical characteristics of MC@Cel-NPs at different pH levels were studied (Figure 2(e–h)). MC@Cel-NPs at different pH levels were tested via dynamic light scattering (DLS). The size distribution and polydispersity index (PDI) of MC@Cel-NPs were smaller at pH = 8 (diameter: ~600 nm; PDI: ~0.56) compared to those at pH = 2 (diameter: ~2.5 µm; PDI: ~ 1.5) and pH = 6 (diameter: ~1.8 µm; PDI: ~ 0.9). Under different pH levels, the gap or adhesion among NPs may change. In alkaline environments, MC@Cel-NPs tend to aggregate and collide with each other, producing larger loose aggregates. Moreover, the zeta potential measurement results showed that MC@Cel-NPs were positively charged in pH = 2 solution. While, with the increase in pH levels of the environment, the negative charge became stronger (Figure 2(g)). In addition, with the upregulation of pH levels, the aqueous solution of MC@Cel-NPs gradually changed from yellow to orange-red, which indicated that more Cel were exposed in the aqueous solution with the increase in pH value (Figure 2(h)). And, transmission electron microscope (TEM) image (Figure 2(j)) also showed MC@Cel-NPs had uniform spherical shapes and the size of single nanoparticle was about 200 nm at pH = 8. The findings were corroborated through UV–vis spectra, revealing a notable increase in absorbance at around 425 nm for MC@Cel-NPs at pH = 6 or 8 compared to the solution at pH = 2 (Figure 2(i)).
The storage stability and in vitro release studies of MC@Cel-NPs
For the oral delivery of MC@Cel-NPs being suitable for IBD therapy, it is critical to keep contact nanostructure or nano-assembly in the stomach and small intestine, especially in the strong acid condition of stomach, which is still a great challenge for most nano-delivery systems. To investigate the stability of MC@Cel-NPs in the digestive tract, we evaluated the characteristics of the NPs in different PH conditions for 8 days (Figure 3). The pH = 2, pH = 6, and pH = 8 solution was simulated the environments of stomach, intestine and colon, respectively. In the pH = 2 solution, the size of MC@Cel-NPs kept aggregated for more than 2 µm, and the size distribution decreased, but still larger than 1 µm after 8 days, and the picture of NPs solution showed the precipitate of NPs after 2 days. And, the zeta potential of NPs was positive, indicating they were hardly retained by stomach. Besides, the UV-vis spectra showed the Cel almost did not released from the NPs during the first 8 days. This implied that this oral NPs system was stable and could successfully endure the strong acid condition of stomach. Interestingly, in pH = 6 and pH = 8 solution, the NPs dispersed evenly, displayed massive negative charges on the surface (Figure 3(e)), and the UV-vis also demonstrated the released Cel from MC@Cel-NPs. In the first 24 h, the leakage amount and leakage rate of Cel from MC@Cel-NPs in the solutions of PH = 2, PH = 6, and PH = 8 were determined as~10%, ~66%, and 97%, respectively.

The storage stability and in vitro release studies of MC@Cel-NPs. (a) The pH range of gastrointestinal tract and morphological sketch of MC@Cel-NPs under different pH conditions. (b) Changes of particle size of MC@Cel-NPs in solutions of different pH. (c) The appearance color changes of MC@Cel-NPs at three different pH conditions during the storage. (d) Changes of zeta potential of MC@Cel-NPs under different pH conditions. (e) Changes of absorbance of MC@Cel-NPs under different pH condition. All values were expressed as mean ± SD (n = 3).
In vitro biosafety and anti-inflammation effects of Cel and MC@Cel-NPs
To confirm of the biosafety of Cel and MC@Cel-NPs in vitro, the RAW264.7 cells and Caco-2 cells were employed to evaluate the cytotoxicity of Cel and MC@Cel-NPs. The cells were cultured with different concentrations of Cel and Cel-NPs for 24 h. The results in Figure 4(a) showed that both free Cel and MC@Cel-NPs will not inhibit the growth of both kinds of cells at low concentrations (<100 ng/mL). Interestingly, free Cel induced toxic effects on both kinds of cells when the concentrations increased to 200 ng/mL, while MC@Cel-NPs demonstrated minor toxic effects on the cells. The half maximal inhibitory concentration (IC50) of free Cel and MC@Cel-NPs was determined to be 235 and 632 ng/ml after 24 h of treatment in both cell lines. It implies that NPs formulation can decrease the cytotoxicity and improve the biosafety of Cel.

In vitro biosafety of Cel and MC@Cel-NPs. (a) Cell viability of RAW264.7 and Caco-2 cells treated with different concentrations of Cel or MC@Cel-NPs for 24 h. (b, c) The images and quantification analysis of hemolysis assay of free Cel and MC@Cel-NPs. (d) The morphology of erythrocytes co-cultured with Cel or MC@Cel-NPs for 60 min at 37℃ imaged under a live cell imaging system. (e) Typical photos of main organs originated from healthy mice with I.G. for 7 days (once a day) at 200 µg/kg body weight (1 bar, 200 µm). (f–g) The levels of alanine transaminase (ALT) and aspartate transaminase (AST) of livers in each group were tested to evaluate the toxicity of different formulations of Cel.
We evaluated the anti-inflammatory effects of different formulations of Cel in LPS-induced RAW264.7 cells using ELISA and PCR-tests. The LPS activation allowed a threefold increase in IL-6, TNF-α, and IL-1β expression (Figure 3(b and c)). It implied that Cel could be as a anti-inflammation candidate for IBD.
In vivo biosafety of Cel and MC@Cel-NPs
The hemolytic property of drugs is a critical indicator to assess whether a drug can cause hemolysis, or destruction of red blood cells when introduced into the body. 27 Here, the hemolysis of Cel and MC@Cel-NPs were evaluated using healthy mouse erythrocytes. The erythrocytes dispersed in water were used as the positive hemolysis control group, and the erythrocytes dispersed in PBS buffer were used as the normal control group. The free Cel and MC@Cel-NPs were induced into erythrocytes at the same concentration of 200 ng/mL (calculated based on the Cel loading into NPs). Figure 4(d–f) demonstrated free Cel presented severe damage to erythrocytes and hemolytic activity, and as expected, MC@Cel-NPs indicated almost no damage and healthy erythrocytes with intact double concave disc shapes. It suggested that the NPs formulation significantly decreased the hemolysis and improved the biosafety of Cel.
To fully determine the biosafety of Cel in vivo, the different administration methods: intra-gavage (I.G.) and intra-peritoneal injection (I.P.) were introduced to assay the toxic effects on main organs. With I.G. administration method for 7 days (once a day) at 200 µg/kg, there represented moior toxic effects on main organs (heart, liver, spleen, lung, and kidney) of healthy mice (shown in Figure 4(g)). Even the liver function tests including alanine transaminase (ALT) and aspartate transaminase (AST) are not changed significantly (Figure 4(h and i)). Notably, healthy mice with the administration method-intra-peritoneal injection (I.P.) for 7 days (once a day) at 200 µg/kg body weight, it demonstrated massive toxic effects on all the organs even two mice in Cel-treated group died (Supplemental Figure S2). The data demonstrated that in free Cel-treated group, the body weight and the functions of spleen and livers were seriously damaged in healthy mice (Supplemental Figure S2A–C), and the intestinal systems were damaged and shortened (Supplemental Figure S2D–E) as well. Impressively, all these signs of toxicity do not appear in MC@Cel-NPs treated healthy mice. This demonstrated that the NPs formulation significantly improved the in vivo biosafety of Cel.
In vitro cellular uptake and mitochondria-targeting analysis
To determine the in vitro targeting of MC@Cel-NPs, RAW264.7 cells, and Caco-2 cells were employed as cell models. After 2 h of co-culture, the NPs could successfully enter both the two kinds of cells, which was confirmed by the fluorescent imaging and the intensity in cells assayed by flow cytometry (Supplemental Figure S3). Interestingly, the cellular uptake of MC@Cel-NPs was much higher in RAW264.7 cells (Supplemental Figure S3A and B) than in CaCo-2 cells (Supplemental Figure S3C), which might be induced by the mannose-receptor on RAW264.7 cells. Due to mannose molecules were modified on the surface of the MC@Cel-NPs, we speculated that mannose receptor-mediated endocytosis was the main uptake pathway of MC@Cel-NPs into cells. To further confirm the hypothesis, mannose was introduced to block the mannose-receptor on RAW264.7 cells. As shown in Figure S3B, in LPS-induced RAW264.7 cells, without mannose block, the MFI of C6/Cel-NPs in cells was higher than that of free C6/Cel, but there was no significance between the two groups (P<0.0001). While, with 50 mM of mannose for blocking the mannose-receptor on cells, the MFI of C6/Cel-NPs in cells was much lower than that of free C6/Cel, indicating that C6/Cel-NPs entered into macrophages might through mannose-receptor mediated endocytosis.
To further determine the subcellular location of MC@Cel-NPs, the lysosomes and mitochondria were stained with lyso-tracker and mito-tracker, respectively, and the confocal images showed that the NPs fluorescence was partly colocalized with lyso-tracker and mito-tracker, indicating that NPs were internalized and entered into the lysosomes and mitochondria. In Figure 5(a and b), the orange fluorescence of the overlay of red fluorescence and green fluorescence represented the effective aggregation of NPs in mitochondria of both RAW264.7 cells and Caco-2 cells.
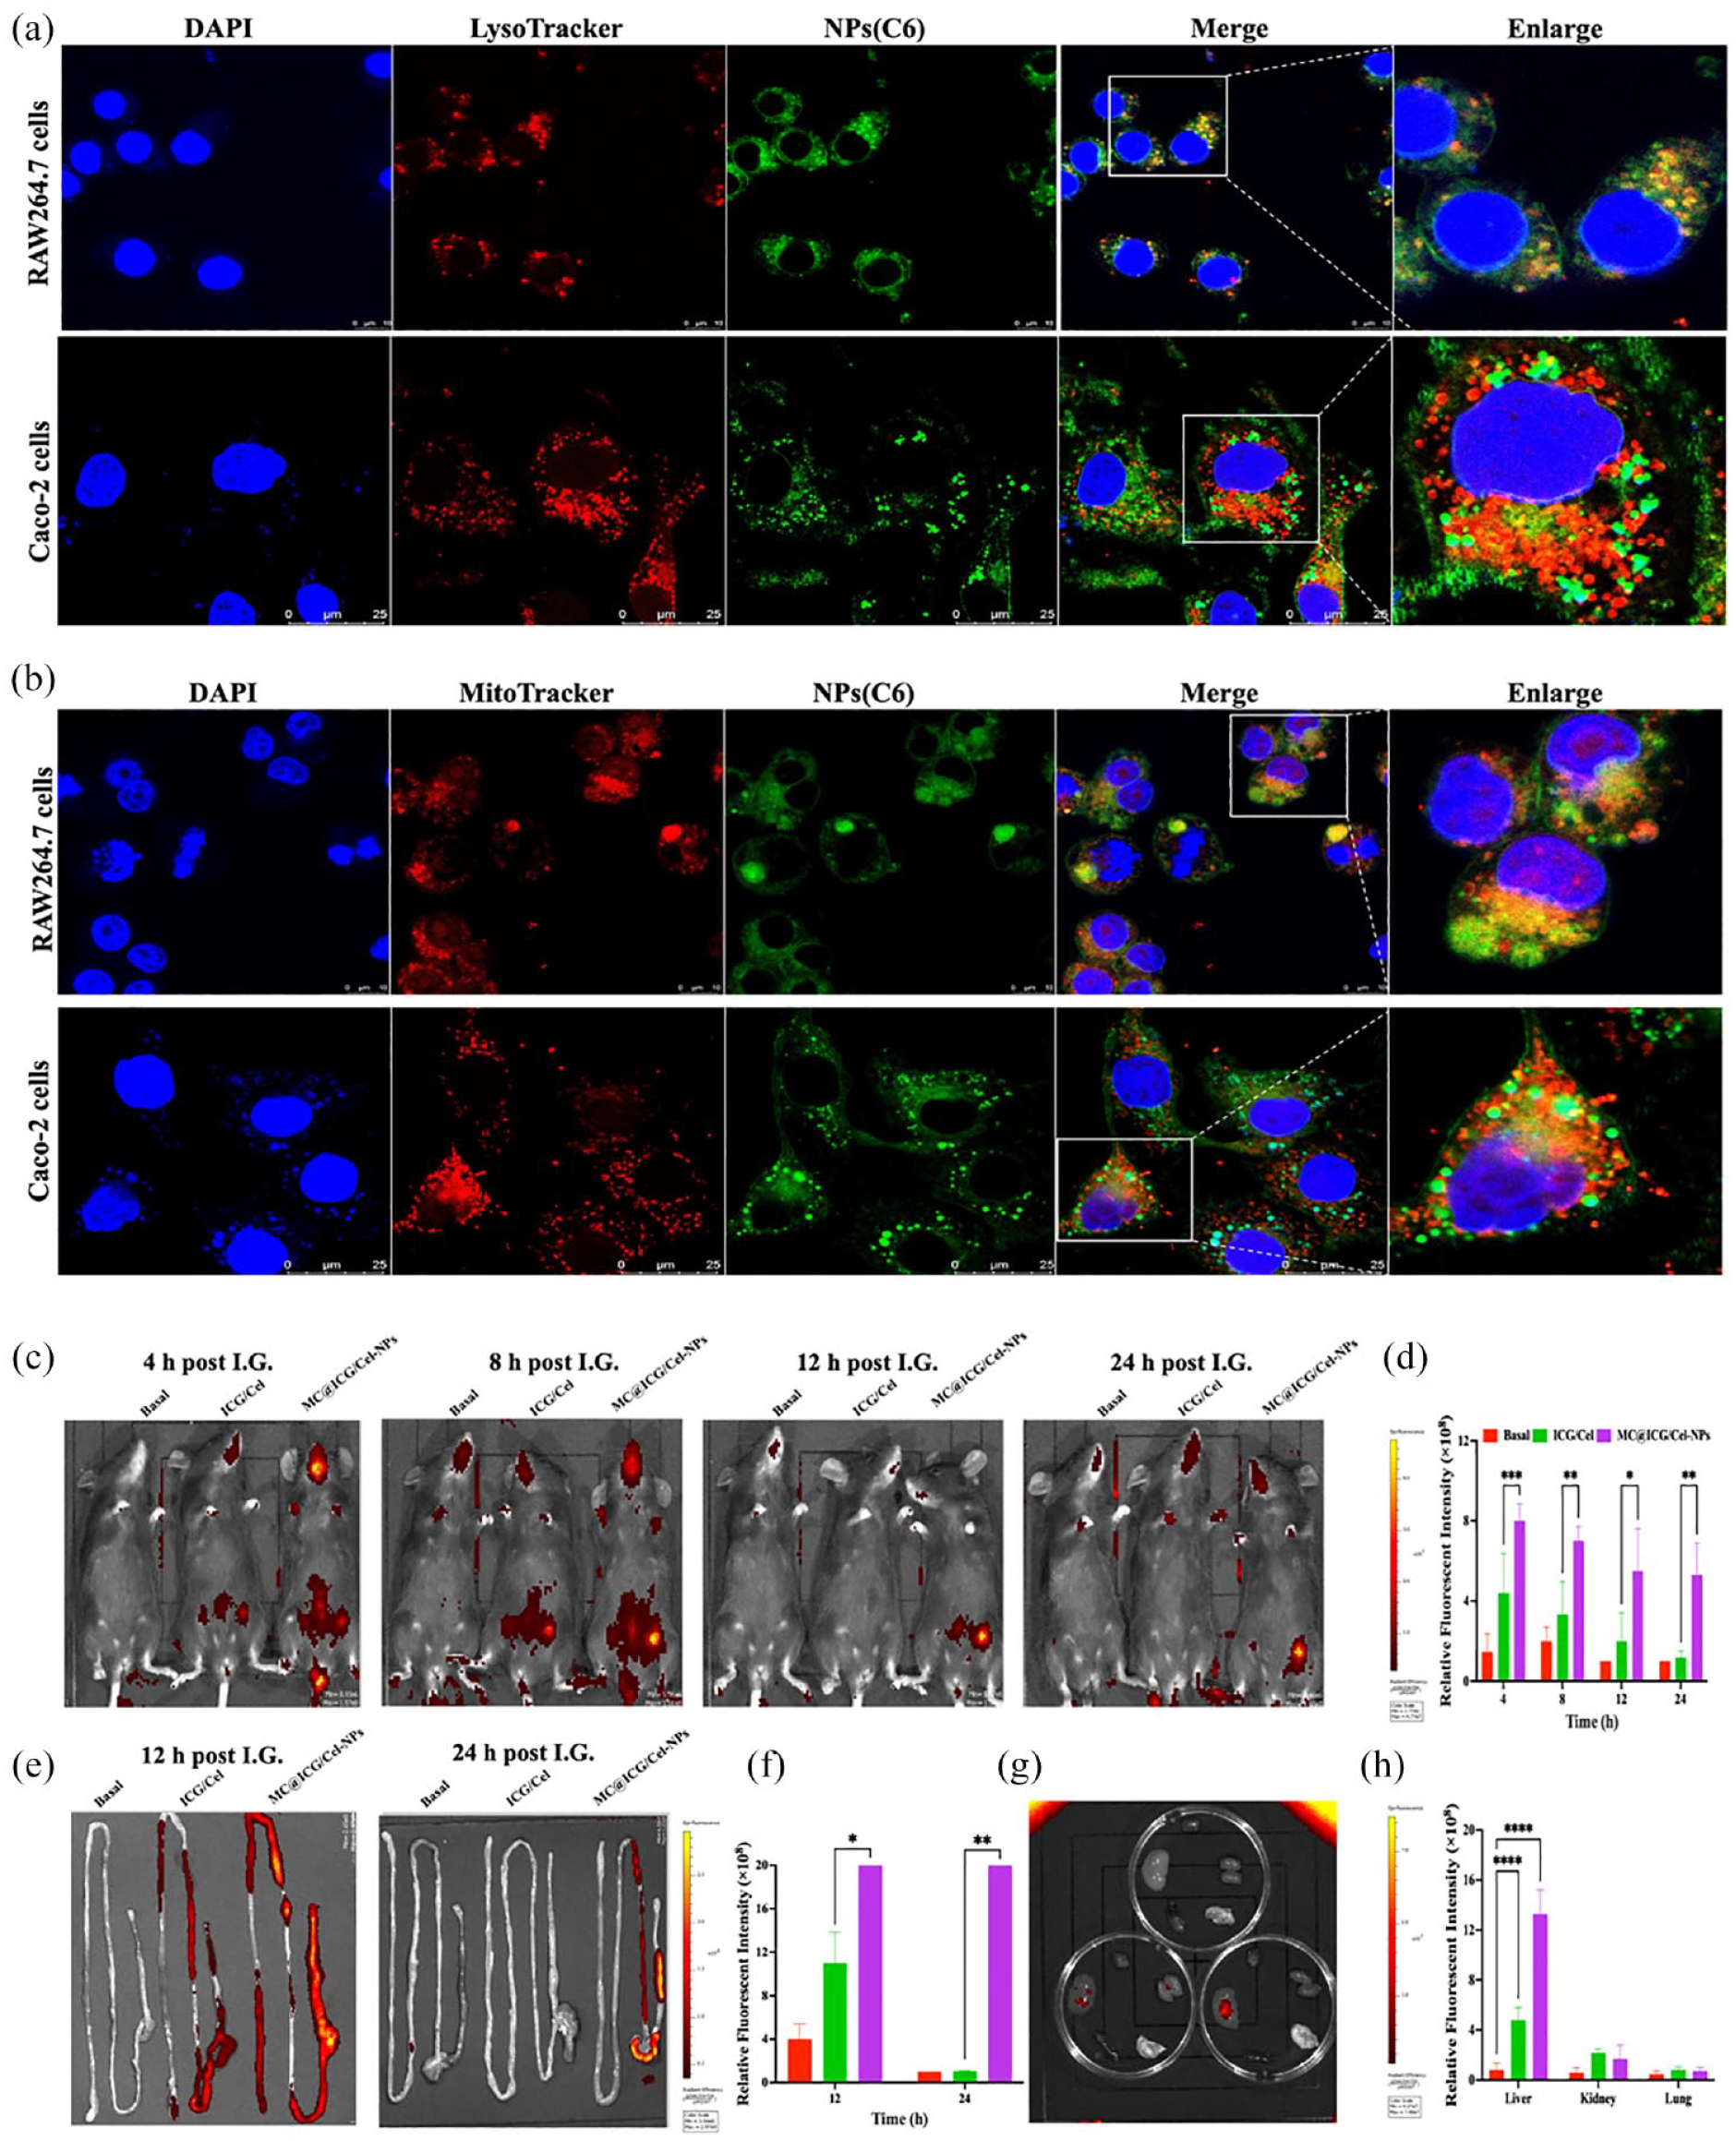
In vitro and in vivo targeting of MC@Cel-NPs. Due to the weak fluorescence of Cel, Cumarin 6 (C6) or indocyanine green (ICG) was co-loaded into the NPs as fluorescent markers. (a) Lysosomes or mitochondria co-localization of Free-C6/Cel and MC@C6/Cel-NPs in RAW264.7 cells. (b) Lysosomes or mitochondria co-localization of Free-C6/Cel and MC@C6/Cel-NPs in Caco-2 cells. Scale bars: 25 μm. (c–h) In vivo imaging of colitis mice with intra-gavage (I.G.) administration of Free-C6/Cel or MC@C6/Cel-NPs at different time points: (d) showed the statistical assay of in vivo MFI (mean fluorescence intensity) of (c); (e) The fluorescent images of mouse GI tracts at 12 h or 24 h after I.G. administration; (f) The MFI of colons in each group after 12 or 24 h of I.G.; (g) MFI of main organs after I.G. for 24 h; (h) The quantitative statistical histogram of MFI of different organs after I.G. for 24 h. Data are expressed as mean ± SD (n = 4).
MC@Cel-NPs targeted to the inflamed colon
Indocyanine green (ICG) was encapsulated in the NPs (MC@ICG/Cel-NPs) as the fluorescence marker. The free formulation of ICG/Cel and the MC@ICG/Cel were orally administered to the healthy mice (Supplemental Figure S4) and UC mice (Figure 5(c—h)), separately. The in vivo imaging system (IVIS) demonstrated that in the UC mice, the mean fluorescence intensity (MFI) in the MC@Cel-NPs group was much higher than that in the free ICG/Cel group at 8, 12, and 24 h after oral administration. Particularly, the imaging of gastrointestinal (GI) tract demonstrated that MC@ICG/Cel-NPs mainly accumulated into the inflammatory colons at 12 and 24 h, and, MC@ICG/Cel-NPs also exhibited a longer period of retention and release in colons (Figure 5(e and f)). At 24 h oral administration, only a little of MC@ICG/Cel-NPs was observed in liver but not in other organs (Figure 5(g and h)), suggesting that MC@Cel-NPs might not accumulate in the main organs in UC mice.
In vivo cellular uptake and mucoadhesion study of MC@Cel-NPs
To further determine the inflammation targeting of MC@Cel-NPs, the healthy mice were also IVIS imaged after oral administrated with free C6/Cel and MC@C6/Cel-NPs, separately. Supplemental Figure S4 showed that there were no significant differences in the MFI between the C6/Cel and MC@C6/Cel-NPs groups. Especially, the images of GI tract showed both C6/Cel and MC@ICG/Cel-NPs would not accumulate and retard into the healthy colons at 8 h administration. Additionally, there was no effective accumulation of free C6/Cel in the UC model, because of their lack of inflammation targeting and mucosal adsorption. While, in DSS+ MC@C6/Cel-NPs group, but not normal MC@C6/Cel-NPs group, after oral administration, MC@C6/Cel-NPs was specifically distributed in the inflamed colons (Supplemental Figures S4 and 6(a and b)).
The accumulation and cellular uptake of nanomedicine in the tissue lesions are prerequisites for their therapeutic efficacy. The DSS-induced mice were orally administrated with free C6-Cel or MC@C6-Cel-NPs for 8 h, the mice were anesthetized using CO2. The colons were isolated for intracellular of NPs assay. The immunohistochemistry section indicated that comparing with free C6-Cel, much more of MC@C6-Cel-NPs (green color) were observed in the colon cells (blue color of DAPI for locating of cell nucleus). Further, flow cytometry results (Figure 6(c and d)) also indicated that the oral MC@C6/Cel-NPs could successfully enter and accumulate into the macrophages and neutrophils of colon, there was a statistically significant difference in MFI between the free C6-Cel group and MC@C6/Cel-NPs group.

In vivo mucoadhesion studies and cell uptake of MC@Cel-NPs in colitis colons. Due to the weak fluorescence of Cel, Cumarin 6 (C6) was co-loaded into the NPs as fluorescent markers. The colitis mice were I.G. administrated with free C6/Cel or MC@C6/Cel NPs for 8 h, and then euthanasia and isolated the main organs for IVIS imaging. (a-b) The fluorescent pictures (a) and quantitative MFI (b) of C6 (green color) in colon sections at 8 h of oral administration with free C6/Cel or MC@C6/Cel NPs (blue color of DAPI to locate nucleus). (c) The MFI in neutrophils or macrophages of colitis colons after I.G. of free C6/Cel or MC@C6/Cel NPs for 8 h determined by flow cytometry. (d) The semi-quantitative analysis of the cell uptake of C6. Data are expressed as mean ± SD (n = 4).
Therapeutic efficacy of MC@Cel-NPs against DSS-induced colitis
We subsequently evaluated the in vivo therapeutic efficacy of Cel-NPs in a mouse model of DSS-induced UC. Mice were orally administered with 2.5% DSS for 7 days to induce colitis, and MC@Cel-NPs were daily administered by I.G. (Figure 7(a)). Other treatments, including saline, free Cel, were used as control groups. As shown in Figure 7(b), the PBS-treated control group failed to prevent body weight loss, whereas DSS-colitis mice with MC@Cel-NPs treatment could significantly recover their bodyweight. Inflammation severity, including weight loss, stool consistency, and bloody stool, was further assessed by the disease activity index (DAI) score. The results indicated that the DAI score of MC@Cel-NPs treatment was significantly lower than that in PBS-treated colitis mice (Figure 7(c)). Furthermore, the gross colon appearance and colon length measurement showed that colon length was significantly shortened in colitis mice, while MC@Cel-NPs significantly protected mice against DSS-induced shortening of colon length (Figure 7(e)). DSS also stimulated spleen enlargement and MC@Cel-NPs treatment could alleviate this phenomenon (Figure 7(f and g)). Besides, from day 4 to day 7, bloody stools emerged in the DSS+ and DSS+ Cel groups and bloody diarrhea was more severe in these groups (Figure 7(h)). Only the mice in the MC@Cel-NPs treatment group had less stool blood. H&E staining images (Figure 7(i)) of colon tissues demonstrated obvious colonic damage and inflammatory infiltration in colitis mice. The mucin content on the inflamed colonic mucosa was very low, which was associated with mass depletion of goblet cells. Notably, the colonic tissue morphology in MC@Cel-NPs treated group was almost similar to that of healthy mice. The histological scores (Figure 7(j)) also showed that the oral MC@Cel-NPs treatment was beneficial for restoring the integrity of the colonic epithelium and alleviating the inflammatory cells infiltration at the mucosa, suggesting normal recovery of the colon tissue (Figure 7(i)). To further understand the therapeutic mechanism of MC@Cel-NPs against colitis, the levels of several pro-inflammatory cytokines in plasma and colon tissues were quantified by using enzyme-linked immunosorbent assay (ELISA). As shown in Figure 7(d), among all groups, MC@Cel-NPs treatment significantly reduced the levels of pro-inflammatory cytokine IL-6 and TNF-α in plasma, indicating that the MC@Cel-NPs could effectively inhibit the inflammation responses in colitis mice. This experimental protocol was repeated for three times, one of the repeated data were shown in Supplemental Figure S6.

Therapeutics of Cel or MC@Cel-NPs on UC. (a) Time axis of DSS-induced UC and the timing of treatment: Mice were adaptively fed for one week, then I.G. with Cel or MC@Cel-NPs at 200 µg/kg/d while drinking the 3 % DSS freely for 7 days, free water was changed from the eighth day, after 48 h of free water, the mice was euthanized and collected samples. (b and c) Variation of body weight and DAI scores in different treated groups during experimental process. (d) The expression of cytokines (IL-6 and TNF-α) in plasma determined by ELISA Kit. (e) Typical photographs of colons and the variation of colon length from different treated groups. (f–g) Photographs of Spleen (f) and statistics of spleen index (weight ratio of spleen and the whole body) in colitis mice. (h) Representative photographs of rectal areas of a healthy mouse and UC mice treated with PBS, Cel or MC@Cel-NPs, respectively (on day 8). (i) Representative H&E images and histological scores (j) of colons from each group. Scale bar: 200 μm. Mean ± SEM.
MC@Cel-NPs alleviated pro-inflammatory cytokines of inflamed colon
According to the immunohistochemistry staining, the pro-inflammatory cytokines were overexpressed in the mucosal and submucosa epithelium of colitis colons. Notably, MC@Cel-NPs treatment could effectively suppressed the local inflammatory levels of IL-6 (Figure 8(a and b)) and IL-1β (Figure 8(c and d)). NLRP3 inflammasome acts as a potent regulator of mucosal immune responses and intestinal homeostasis, thus, targeting the activation of NLRP3 inflammasome and its downstream signaling will provide novel efficacy therapeutic strategies. As expected, MC@Cel-NPs treatment significantly inhibited the activation of NLPR3, indicating that MC@Cel-NPs effectively attenuated colonic inflammation (Figure 8(e and f)).

Immunohistochemical staining of pro-inflammatory cytokines in colon sections. IL-1β (a), IL-6 (c) and NLRP3 (e), and their semiquantitative analysis of IL-1β (b), IL-6 (d), and NLRP3 (f) positive area/tissue area in the colon section of colitis mice. Scale bar: 50 μm. Mean ± SEM.
Anti-oxidative ability and macrophage polarization of MC@Cel-NPs
The overproduction of ROS plays vital roles in UC. Our DHE staining results also showed massive ROS presented in the colon tissue of UC mice (Supplemental Figure S5). Figure 9(a–d) and Supplemental Figure S3 showed the MC@Cel-NPs could be effectively uptake by RAW264.7 and Caco-2 cells in vitro. DCFH-DA was used as a fluorescence probe to assess the intracellular expression levels of ROS. Figure 9(a and c) indicated that both free Cel and MC@Cel-NPs decreased LPS-induced ROS generation in both RAW264.7 and Caco-2 cells, and MC@Cel-NPs had the most significant inhibitory effect on ROS production compared with the Vehicle- and Cel-treated group. Correspondingly, the semi-quantitative results of MFI of intracellular ROS measured by flow cytometry also demonstrated that MC@Cel-NPs exhibited the most powerful activity to downregulate the ROS expression induced by LPS (Figure 9(b and d)). The data suggested that MC@Cel-NPs had prominent ROS scavenging, which supported its therapeutic application in UC models.

ROS scavenging ability of MC@Cel-NPs in vitro and in vivo. (a and b) Representative images of intracellular ROS in LPS-stimulated Raw264.7 cells detected by a live cell imaging system (a) and a flow cytometry (b). (c and d) Representative images of intracellular ROS in LPS-stimulated CaCO-2 cells determined using a live cell imaging system (c) and a flow cytometry (d). scale bar: 400 μm. (e) The representative image and the scheme illustrate the selection of neutrophil- or macrophage-positive cells from isolated single cells in colon tissues. (f) The quantitative analysis of ROS level in neutrophils and macrophages in colon tissues originated different treated colitis mice determined by flow cytometry. (g) The representative image and the scheme illustrate the selection of T cell-, B cell- or DC-positive cells from isolated single cells of colon tissues. (h) The quantitative analysis of ROS level in T cells, B cells, and dendritic cells (DC) in colon tissues originated different treated colitis mice determined by flow cytometry. Data are expressed as mean ± SD (n = 4).
Besides, we also detected the in vivo ROS-scavenging ability of MC@Cel-NPs in colon tissues. The representative images of colon sections determined by confocal microscopy indicated that DSS-induced massive ROS production, and Cel-treatment, especially MC@Cel-NPs treatment greatly reduced the ROS level in colon tissues (Supplemental Figure S5A). The DHE fluorescence represented as red color in the healthy group was weaker than that of the DSS+ group. Meanwhile, the quantified DHE fluorescence data also revealed that the DHE intensity of the MC@Cel-NPs treated group was significantly lower than that of the DSS+ group, while free Cel-treated group showed no significant difference when compared to the DSS+ group (Supplemental Figure S5B). The results demonstrated the substantial ROS-scavenging capability of MC@Cel-NPs, but the same dose of free Cel could not successfully inhibit ROS production in DSS+ mice. Due to Nrf2 regulates ROS production by mitochondria, 28 we then investigate whether the anti-oxidant effects of the NPs are resulted from the activation of Nrf2 signaling. As our expectation, we found that MC@Cel-NPs obviously increased Nrf2 accumulation and nuclear localization in the cells compared to the free Cel (Supplemental Figure S5C). This implied that MC@Cel-NPs achieve ROS scavenging after targeting mitochondria through activation of Nrf2 signal.
Further, flow cytometry was also employed to determine the intracellular ROS level in immune cells originating from DSS+ colons (shown in Figure 9(e–h)). In DSS+ colons, the ROS levels were significantly higher in all kinds of immune cells, including neutrophils, macrophages, T cells, B cells, and Dendritic Cells (DC), notably, the ROS level in all kinds of cells were significantly decreased with oral treatment of MC@Cel-NPs. Our thorough in vitro and in vivo studies collectively underscore the remarkable efficacy of free Celecoxib (Cel), especially the MC@Cel-NPs formulation, in neutralizing ROS within immune cells and colonic tissues compromised by colitis.
Given that the M1/M2 polarization of intestinal macrophages exerts an essential function in the pathogenesis of UC, 29 we then determined the capacity of Cel in reversing M1 polarization in LPS-induced RAW264.7 cells. The flow cytometry result and RNA levels of cytokines showed that both Cel and MC@Cel-NPs could significantly reverse M1 polarization and induce M2 polarization (Supplemental Figure S6).
Discussion
Improving the oral bioavailability of poorly soluble drugs and enhancing their absorption through the intestinal mucosa remain ongoing challenges in oral drug formulations. The main barriers to the oral absorption of hydrophobic drugs are their low aqueous solubility and the hindrance posed by the cell membranes of the gastrointestinal epithelial cells. Nanoparticles with a diameter of less than 500 nm can mimic chylomicrons and facilitate the absorption of nanoparticles by the gastrointestinal epithelial cells. Celastrol (Cel) is greatly limited in clinical application because of its poor water solubility and high dose-related toxicity. In this work, to address the excellent anti-inflammatory merits of Cel, Cel-loaded pH-sensitive NPs were synthesized using the emulsification-evaporation method as described in our previous study. 22 The active ingredient Cel in dimethylsulfoxide solution was added into the oil phase during the synthesis process of PLGA-PEG NPs (Cel-NPs).
Drug encapsulation using a nanocarrier can significantly enhance the drug solubility. However, these nanoparticles have poor mucosal adhesion, leading to low oral bioavailability. It is necessary to design pH-sensitive nanocarriers, where drugs are protected in the acidic gastric environment (pH = 1.0–3.0) and released in the alkaline intestinal environment (pH 7.4–8.0) to promote intestinal absorption. However, there remains a challenge of drugs released in the intestine to cross the intestinal mucosa and enter into the systemic circulation. To address all these problems, natural biologically active ingredients—chitosan and mannose were introduced to modify the Cel-loaded PLGA NPs. Chitosan, a natural cationic polysaccharide, has good mucosal adhesion and facilitates enhanced absorption to the mucosa. The modification of mannose can render the NPs targeting the macrophages in colon through a mannose receptor-mediated pathway. The results in Figures 1–3 revealed that Cel-NPs undergo systematic self-assembly facilitated by chitosan (CS) and mannose mediation. MC@Cel-NPs exhibited stability in the acidic condition and displayed an inclination to expand and release the drug in alkaline environments, thereby enhancing their suitability for oral administration.
The biosafety of drugs and NPs is important for their following clinical transfer and application. The in vitro data (Figure 4(a–d)) showed that NPs formulation can decrease the cytotoxicity, decrease the hemolysis and improve the biosafety of Cel. Also, previous studies 30 have reported that Cel has not only hepatotoxicity and kidney toxicity, but also cholesterol toxicity, cardiotoxicity, ototoxicity, and reproductive toxicity, particularly in overdose use. To fully determine the biosafety of Cel in vivo, the different administration methods were introduced to assay the toxic effects on main organs. The data in Figure 4 and Supplemental Figure S2 demonstrated that in free Cel-treated group, the body weight, functions of spleen and livers, and the intestinal systems were all seriously damaged in healthy mice. Impressively, all these signs of toxicity did not appear in MC@Cel-NPs treated healthy mice. This demonstrated that the NPs formulation significantly improved the in vivo biosafety of Cel.
The number of macrophages increased significantly in the colon of UC, suggesting that macrophages were involved in the occurrence and development of UC, 31 thus, it is very important to target deliver drugs to the macrophages, and intestinal mucosal epithelial cells as well. Mitochondria are the energy production factory of cells and play important roles in all signaling processes, such as the generation of ROS, adjusting cellular redox potential and apoptosis. The ROS level in the cell and mitochondria is significantly elevated in patients with UC. 9 Thus, the accumulation of NPs in mitochondria could effectively reduce the ROS level in cells, which would be beneficial to reduce inflammation. The in vitro cellular uptake results indicated that the MC@NPs system could successfully deliver drugs in the macrophages and epithelia cells, and even further located in the mitochondria of cells, which guaranteed the treatment effects on UC. 32
The in vivo biodistribution and specific accumulation in the inflammation lesions are important characteristics of targeted NPs delivery systems. To examine whether the nanoparticle system could reach the desired macrophages and inflamed colons when given orally, we assayed the bio-distribution of NPs. The in vivo imaging data indicated that the MFI of MC@ICG/Cel-NPs in healthy colons was significantly lower than that of the colitis colons. After the formation of colitis, the positively charged ulcer surface, alkaline environment, and ROS-enriched UC pathological condition created a massive positive-charged environment of colon. 33 Thus, our negative-charged NPs could accumulate and adsorbed to the inflamed colons through electrostatic reaction.
The mucoadhesion results (Figure 6(a)) confirm that the negatively charged MC@Cel-NPs could enhance the adhesion to inflamed mucosa with positive charges after oral administration, thereby improving the targeting of nanoparticles to the site of colon inflammation and further increasing local drug concentration in inflamed tissues, which is consistent with the previous studies. 34
Further, macrophage is a kind of innate immune cell, playing critical roles in inflammatory response. In the UC model, enhanced macrophage infiltration produces a large number of inflammatory cytokines, even promoting tumorigenesis of UC. 35 Besides, excessive recruitment and accumulation of activated neutrophils in the intestine under pathological conditions such as inflammatory bowel disease is associated with mucosal injury and debilitating disease symptoms. 36 Therefore, the excessive infiltration of macrophages and neutrophils might be therapeutic targets to treat UC. The in vivo cellular uptake results determined by flow cytometry (Figure 6(b)) demonstrate that the oral MC@C6/Cel-NPs could effectively cross the mucosal barrier of the gastrointestinal tract, specifically target to the immune cells in inflamed colons and then release the payload in the inflammation lesions. This further confirmed the oral system for the therapeutic effectiveness of Cel.
It’s well known that the dysregulation of cytokine secretion at colonic lesions plays a vital role in the pathogenesis of intestinal mucosal damage. 37 IL-6 and IL-1β are considered as classical pro-inflammatory cytokines. Besides, NLRP3 inflammasome is associated with a variety of inflammatory and autoimmune conditions, including IBD and UC. 38 The in vivo therapeutic efficacy results (Figures 7 and 8) demonstrated oral administrated MC@Cel-NPs exhibited noteworthy outcomes, including extended colon length, reduced spleen weight, recovered the body weight decrease, DAI, suppressed cytokine secretion, and deactivated NLRP3. These findings strongly signify the substantial therapeutic impact of MC@Cel-NPs on colitis mice. Furthermore, these therapeutic benefits underscore the crucial role of Cel locally targeted release in the restoration of the colonic barrier.
It is well known that oxidative stress is a key feature of IBD. ROS up-regulation has been observed in colon tissues of patients and murine colitis models. 39 Continuous exposure of ROS overproduction to the inflamed intestinal mucosa will damage gastrointestinal function, such as nutritional malabsorption, increased mucosa permeability, and disturbed gut motility. 39 Therefore, inhibition of oxidative stress is an important effector mechanism to halt the pathogenesis of IBD, and can be a critical therapeutic target in clinics.
In the early stage, the inflammatory cytokines would activate immune cells and enhance ROS production in the occurrence of IBD. Subsequently, excessive ROS production would further activate the immune response through nuclear factor κB signal pathway, resulting in the increased secretion of pro-inflammatory cytokines. 40 Terminally, high ROS exposure induced oxidative damage and apoptosis of epithelial cells, consequently leading to intestinal mucosa injury. 41 Therefore, scavenging ROS in the gut or colon is necessary to halt UC progression. 42 Our in vitro and in vivo data demonstrated ROS-scavenging capability of oral MC@Cel-NPs, but the same dose of free Cel could not successfully inhibit ROS production in DSS+ mice.
Further, the immune cells are the component of the intestinal microenvironment, they exert specific functions in intestinal tissue during IBD. They can secrete inflammatory cytokines and other cell factors. The global immune cell landscape of UC tissue included increased neutrophils, T CD4+ memory-activated cells, active dendritic cells (DC), and macrophages, as well as reduced trends in T CD8+, Tregs, B memory, resting DC, and M2 macrophages. 43 The flow cytometry results (Figure 9) demonstrated that the ROS levels were significantly higher in all kinds of immune cells, including neutrophils, macrophages, T cells, B cells, and DC, notably, the ROS level in all kinds of cells were significantly decreased with the treatment of Cel. And, the ROS scavenging of Cel might result from the activation of Nrf2 signal (Supplemental Figure S5C) and M2 polarization (Supplemental Figure S6). The findings strongly suggest the potential candidacy of MC@Cel-NPs for the clinical treatment of UC.
Conclusion
In this work, we developed an oral delivery pH-sensitive nanotherapeutic system to load celastrol, namely MC@Cel-NPs, for the treatment of UC. The incorporation of a chitosan/mannose coating conferred gastrointestinal stability, and the negatively charged surface facilitated targeted accumulation onto inflamed colon lesions. Subsequently, the released payload (Cel) demonstrated effective alleviation of the pro-inflammatory state and proficient scavenging of excessive ROS within immune cells and inflamed colonic tissues. Notably, our oral nanoparticle delivery system exhibited heightened therapeutic efficacy while minimizing systemic toxicity, a critical concern in nanomedicine (Supplemental Figure S2). All these evidences suggested that this oral nanoparticle-based platform significantly enhances the biosafety of potent yet toxic compounds, exemplified by Cel.
In summary, natural active ingredients, even toxic compounds, can be prepared as a nanomedicine through a simple emulsification method. The preparation process is feasible and replicable and has strong maneuverability. This work provides a new approach for treating UC through a Chinese herbal ingredient-related oral delivery manner and offers a theoretical basis for the local and precise intervention for specific UC treatment.
Supplemental Material
sj-docx-1-tej-10.1177_20417314241265892 – Supplemental material for Oral delivery of pH-sensitive nanoparticles loaded Celastrol targeting the inflammatory colons to treat ulcerative colitis
Supplemental material, sj-docx-1-tej-10.1177_20417314241265892 for Oral delivery of pH-sensitive nanoparticles loaded Celastrol targeting the inflammatory colons to treat ulcerative colitis by Yue Zhao, Yinlian Yao, Shilong Fan, Xin Shen, Xingxing Chai, Zimin Li, Jiachun Zeng, Jiang Pi, Zhikun Zhou, Gonghua Huang and Hua Jin in Journal of Tissue Engineering
Footnotes
Acknowledgements
The authors thank Dr. Tingting Zheng, Jianhong Wen, and Renxing Luo for their suggestions and contributions in the project design and pre-tests.
Availability of data and materials
The datasets used and/or analyzed during the current study are available from the corresponding author on reasonable request.
Declaration of conflicting interests
The author(s) declared no potential conflicts of interest with respect to the research, authorship, and/or publication of this article.
Funding
The author(s) disclosed receipt of the following financial support for the research, authorship, and/or publication of this article: This work was supported by the Guangdong Basic and Applied Basic Research Foundation (2021B1515130004), the Natural Science Foundation of Guangdong Province (2021A1515011595, 2022A1515140154), the Science Foundation of Dongguan Science and Technology Bureau (20211800905092), the Scientific research project of general universities in Guangdong province (2021KTSCX033), Guangdong Medical University post doctor Fund (1026/4SG23180G), and Guangdong Province college student program (ZYDN001 and S202310571073X).
Ethics approval and consent to participate
Experimental procedures using mice in this study were reviewed and approved by the ethical review board of Guangdong Medical University, and all the experiments were performed in accordance with relevant guidelines and regulations of Animal Ethics Committee of Guangdong Province, China. Animals and protocol were approved by the Ethics Committee of Guangdong Medical University (GDY2002004).
Supplemental material
Supplemental material for this article is available online.
References
Supplementary Material
Please find the following supplemental material available below.
For Open Access articles published under a Creative Commons License, all supplemental material carries the same license as the article it is associated with.
For non-Open Access articles published, all supplemental material carries a non-exclusive license, and permission requests for re-use of supplemental material or any part of supplemental material shall be sent directly to the copyright owner as specified in the copyright notice associated with the article.