
Abstract
Osteogenesis is caused by multiple factors, and the inflammatory response, osteogenic differentiation of bone marrow mesenchymal stem cells (BMSCs), regeneration of blood vessels, and other factors must be considered in bone tissue engineering. To effectively repair bone defect, it is important to decrease excessive inflammation, enhance the differentiation of mesenchymal stem cells into osteoblasts, and stimulate angiogenesis. Herein, nano-attapulgite (ATP), polyvinyl alcohol (PVA), and gelatin (GEL) scaffolds were produced using 3D printing technology and pioglitazone (PIO)-containing polylactic acid–glycolic acid (PLGA) nanospheres were added. In both in vitro and in vivo studies, material scaffolds with PIO-loaded polylactic acid–glycolic acid nanospheres could reduce the inflammatory response by encouraging macrophage polarization from M1 to M2 and promoting the osteogenic differentiation of BMSCs by activating the BMP2/Smad/RUNX2 signal pathway to repair bone defects. The vascularization of human umbilical vein endothelial cells (HUVECs) through the PI3K/AKT/HIF1-/VEGF pathway was also encouraged. In vivo research using PIO-containing PLGA nanospheres revealed massive collagen deposition in skin models. These findings indicate a potentially effective scaffold for bone healing, when PLGA nanospheres—which contain the drug PIO—are combined with ATP/PVA/GEL scaffolds.

Introduction
Orthopedic surgery still faces significant challenges in treating bone defects, including the transplantation of autologous bone, allograft bone, and bone repair materials. Numerous issues can arise with autologous and/or allogeneic bone transplants, including chronic illness at the donor site, a finite supply, additional traumatic stress, and possible disease transfer. Consequently, patients with bone defects urgently require bone replacements and biomaterial scaffolds (such as bioceramics, bioactive glass, metal implants, and bioderived implants).1 –3
Fracture healing is multifactorial and involves several cellular and molecular actions that work in concert with the microenvironment, external elements, and cellular structure of the fracture site. At the fracture site, the presence of inflammatory, vascular, and osteochondrogenic progenitor cells; osteoclasts; and inflammatory cytokines and angiogenic and osteogenic factors secreted by cells can affect fracture healing.4,5 These biological actions include cell migration to the fracture site and proliferation and differentiation into osteoblastic phenotypes, osteoid deposition, and angiogenesis. Furthermore, angiogenesis at the fracture site is a crucial stage of fracture healing because new blood vessels need to transfer the nutrients, oxygen, hormones, and cytokines required by cells.4,6 –8 Therefore, for fracture healing, a single factor acting on fracture healing is often unable to achieve significant osteogenic effect, and a combination of anti-inflammatory, osteogenic, and vascularization implants is more ideal to promote fracture osteogenic healing.
Three-dimensional printed (3DP) biomaterial scaffolds are powerful bone replacements and have an unmatched capacity of 3DP that can regulate the physical characteristics and internal microstructure of scaffolds, more accurately mimic the intricate original tissues, and aid in the formation and integration of new tissues.9 –11 3DP enables materials and bioactive compounds to be rationally chosen for individualized creation of material scaffolds to meet the needs of patients with bone defects for multifactor combinations to promote fracture healing.
A nanoscale clay material with biological activity is nano-Attapulgite (ATP). ATP exhibits strong adsorption properties and can form micropores and specific nanostructures. The generated biomaterial scaffold has a greater compression modulus because of the interaction between ATP nanoparticles, which simultaneously creates a network structure with high viscosity. 3 According to our earlier research, ATP effectively promotes osteogenic differentiation.3,12 –14
Gelatin is a partial derivative of collagen, which is an essential component of bone, can easily biodegrade, and has strong biocompatibility. Furthermore, gelatin carries over collagen superior characteristics that encourage cell adhesion and chondrogenic development.15,16 However, the use of gelatin in bone tissue engineering is limited by a lack of mechanical strength. 17
Polyvinyl alcohol (PVA) is a synthetic polymer with low cost and strong chemical stability, biodegradability, and adhesiveness.18,19 PVA bioscaffolds have demonstrated favorable swelling and biocompatibility characteristics.20 –22 PVA scaffolds can also encourage chondrocyte migration 23 and can replace albumin to increase hematopoietic stem cells in vitro. 24
Pioglitazone (PIO) is an agonist of peroxisome proliferator-activated receptor-γ (PPAR-γ) and is widely used as a hypoglycemic drug for treating diabetes. PIO, a PPAR-agonist, can improve macrophage polarization toward M2-type macrophages, decreasing the inflammatory response brought on by M1-type macrophages. 25 PIO has been shown in numerous studies to have negative impacts on bone. Oral PIO administration may cause bone loss and a rise in fat levels, which can lower bone density and raise the risk of fracture when taken to treat diabetes.26 –29 However, low-dose PIO does not result in bone resorption or a reduction in bone density. 30 PIO can increase skin wound healing, prevent vascular lesions, lower the risk of cardiovascular disease, and improve vascular endothelial dysfunction.31 –34 PIO has positive effects on inflammation and blood vessels, but its use has not been explored in bone tissue engineering. Furthermore, osteogenesis is not inhibited by low-dosage PIO. However, PIO promotes the transformation of M1 macrophages into M2 macrophages, thus rendering the application of PIO in bone tissue engineering possible.
Exogenous biomaterial scaffolds will cause chemotactic aggregation of inflammatory cells and increased local inflammation when they are implanted into the host because they stimulate the development of an inflammatory response.35,36 Herein, GEL and PVA were chosen as the primary materials of the scaffold, and ATP was added to enhance the physical characteristics of the scaffold and capacity for bone growth. As the drug delivery vehicle for PIO in this work, poly(lactic–glycolic acid) (PLGA) nanospheres were made by the double emulsion evaporation method. PIO was then enclosed in PLGA nanospheres. A 3DP technology was used to build the ATP/PVA/GEL (APG) scaffold loaded with PLGA nanospheres. In addition to inducing osteogenic differentiation and reducing local inflammation, the scaffold could activate angiogenesis to effectively encourage bone coupling at the location of the bone defect.
Methods
Preparation of PLGA nanospheres
Double emulsion evaporation was used to create PLGA nanospheres (PNs) that were PIO-loaded. 37 Briefly, 100 mg PLGA was dissolved in 5 mL of dichloromethane solution and 1 mg PIO was dissolved in 1 mL of dimethyl sulfoxide solution, and the two solutions were then well mixed. To create a primary emulsion, 25 mL of 1% PVA solution was added and emulsified in a cell ultrasonicator for 10 min. The final primary emulsion was combined with 100 mL of 0.6% PVA aqueous solution, 1% Span-80, and 1% Tween-80 and stirred for 30 min. The resulting secondary emulsion was added to 200 mL of saline. The mixture was stirred overnight at room temperature. The resulting PN suspension was centrifuged at 4000 rpm/min for 10 min, the supernatant was collected, centrifuged at 10,000 rpm/min for 30 min, rinsed with normal saline for three to five times, and vacuum freeze-dried to obtain PN powder.
A 3D printing of the biomaterial scaffold
PVA (0.6 g) was added to 5 mL ultrapure water, stirred for 1 h, and 0.5 g ATP and 0.7 g gelatin were added and mixed in a water bath at 45°C for 2 h. About 70 mg of the abovementioned PNs were added, and the mixture was stirred for 2 h. Scaffolds were printed and crosslinked in a 3D Discovery bioprinter as previously described (Regen Hu Ltd, Switzerland); 14 saline was used to rinse the cross-linker away. Scaffolds were freeze-dried at −40°C for 24 h and then sterilized with ethylene oxide. In this study, the ATP/PVA/Gelatin scaffold (without PNs) was named APG, ATP/PVA/Gelatin scaffold (PNs without PIO) was named APGG, and ATP/PVA/Gelatin scaffold (PNs with PIO) was named APGGP.
Scaffold characterization
Scaffold microstructure
The microstructure of the PNs was examined using scanning electron microscopy (SEM) (J Hitachi S3400 N, Japan), and the scaffold morphology and cell adhesion of each group were also assessed. The particle size distribution of PNs was examined using a Malvern Zetasizer Nano ZS90 analyzer (England).
Rheological properties of bioink
The rheological properties of the bioink were detected using a rheometer (HAAKE MARS60). The viscosity of the bioink varies with the shear rate in the region of 0–1000 s−1 at 37°C. The storage modulus (G′) and loss modulus (G″) of the material were changed in the range of 10°C to 50°C, and the heating rate was 1°C/min in the oscillation mode. These constants were employed along with a constant frequency of 1 rad/s and a constant strain of 1%.
Physical properties of the scaffold
To assess the hydrophilicity of the scaffold, the water contact angle (WCA) was measured using a video contact angle meter (HARKE-SPCA, China). Electronic universal testing equipment (CMT6103, USA) was performed to evaluate the compression properties. A force of 0.1 N and a compression speed of 0.1 mm/s were used to evaluate the mechanical properties of the scaffolds.
Swelling rate of the scaffold
The freeze-dried scaffold weight, Wx was recorded. Then, the scaffolds were placed in phosphate-buffered saline (PBS; pH = 7.4, 0.01 M), and kept at 37°C for 1 day. Wy was weighed after the excess water on the scaffold surface was removed. The following formula was used to obtain the swelling rate.

In vitro scaffold degradability
APGG scaffolds were placed in 50 mL centrifuge tubes with 30 mL of PBS (pH = 7.4, 0.01 M), and the mixture was incubated at 37 °C with shaking. The materials were collected at 0, 3, 7, 14, 21, and 28 days, and then lyophilized at a low temperature. The formula below was used to calculate the rate of stent degradation.

where the initial and degraded dry weights of the scaffolds are MxMy, respectively.
In vitro drug release assays
Two scaffolds each were put into a 50-mL centrifuge tube after six scaffolds each from the APGGP and APG + PIO scaffold groups were taken and PBS was added (30 mL, pH = 7.4, 0.01 M), and shaken at 37°C; each time 2 mL of supernatant was aspirated, the mix was supplemented with 2 mL of PBS. A UV spectrophotometer (UV-1900i, Japan) was used to measure the drug absorbance and concentration at various time intervals (0, 1, 2, 4, 8, and 12 h and 1, 2, 3, 5, 7, 9, 12, and 16 days). The following equation was used to calculate the cumulative release rate of PIO.38,39

Where the PIO concentration (Cn) is the value recorded for each time point. V1 denotes the entire amount of PBS (30 mL), and V2 is the volume of supernatant (2 mL) that was drawn at each interval. W is the scaffold initial PIO content.
In vitro cell culture
Mouse macrophage cell line RAW 264.7 (Cell Research, Shanghai, China), mouse BMSCs (CRL-12424, ATCC, USA), and HUVECs (Shanghai Zhong Qiao Xin Zhou Biotechnology Co., Ltd) were cultured in Dulbecco’s Modified Eagle Media (DMEM basal medium, Gibco, USA). Media were supplemented with penicillin/streptomycin (P/S) (1%, Life Technologies Corporation, USA) and 10% fetal bovine serum (FBS, Biological Industries, Israel). Cells were incubated at 37°C and 5% CO2 atmosphere.
In accordance with the guidelines of the International Organization for Standardization (ISO 10993-12), sterile scaffolds were submerged in serum-free DMEM at a ratio of 0.1 g/mL to obtain the scaffold extract (SE). The supernatant was collected, aseptically filtered, and kept at 4°C after being incubated at 37°C for 24 h. About 10% PBS and 1% P/S were then added.
In vitro cytotoxicity test
RAW 264.7 cells were treated with the live/dead staining kit (L-7011; Invitrogen, USA), incubated for 30 min, and then photographed using a fluorescence microscope (IX7122FL/P, Olympus, Japan). Cells were cocultured with SE for 1 day.
HUVECs were cocultured with SE for 24 h, fixed with 4% paraformaldehyde for 30 min, and stained using a phalloidin staining kit (Share-Bio, China). Cells were then visualized using a fluorescence microscope.
Immunomodulatory effects in vitro
In vitro cell viability assay
Cell viability was assessed using a Cell Counting Kit-8 (CCK-8, Dojindo Kagaku, Japan). After being incubated in different groups of SEs, RAW 264.7 cells were first seeded in 96-well plates at 5000 cells per well. On day 1, 3, and 5, the medium was changed to culture medium with 10% (v/v) CCK-8 solution for 1 h. The supernatant was collected, and the absorbance at a wavelength of 450 nm was measured.
In vitro evaluation of immune-related genes
To produce M1 macrophages, RAW 264.7 cells were seeded onto six-well plates. When the cell density reached 70%–90%, the original media was changed to one containing 200 ng/mL lipopolysaccharide (LPS), and the culture was continued for an additional 8 h. Then, a portion of the cell samples were extracted and Quantitative Real-time Polymerase Chain Reaction (qPCR) analysis was performed according to the manufacturer’s protocol to determine M1-related genes, including those encoding IL-1, IL-6, and NOS2, to confirm the M1 phenotype. mRNA was collected using the NucleoZol kit (Machery-Nagel, Germany). Reverse transcription PCR was performed using the Hiscript II Q RT SuperMix reagent kit (Vazyme, China). SYBR Green PCR Master Mix (Vazyme, China) was employed using qPCR. The 2−ΔΔCt method was used to measure the expression of the target gene. the qPCR reactions were conducted in triplicate for both the target and the housekeeping gene GAPDH. Using a cell scraper, the remaining cells were removed before the scaffold and 2 × 10⁵ cells per well were seeded in 6-well plates. At 1 and 3 days, cell samples from each group were collected for qPCR analysis. The primer sequences are shown in Supplemental Table S1.
Enzyme-linked immunosorbent assay
Cells were cocultured with scaffolds for 3 days, and the supernatants were collected, and cytokines IL-6 and IL-10 were detected using enzyme-linked immunosorbent assay (ELISA) kits (Multi Science, China) in accordance with the manufacturer’s instructions.
Flow cytometry
Cells were scraped off and resuspended by washing with cell staining buffer (BioLegend USA) after being cultured with scaffolds for 1 day. Cells were then treated in the dark with PE-conjugated NOS2 antibody (0.125 g/mL, BioLegend, USA) and APC-conjugated CD206 antibody (0.5 g/mL, BioLegend). The suspensions were examined in a flow cytometer (BD Fascanto II, USA), and data were processed using FlowJo software (TreeStar, Ashland, OR, USA) after being washed with flow cytometry staining solution.
Immunofluorescence staining
Cells were fixed with methanol at −20°C for 10 min after 24 h of culture. Cells were then washed twice with PBS (pH = 7.4, 0.01 M) and blocked with 5% FBS for 1 h at room temperature and then treated with specific primary antibodies (CD86/CD206, 1:200/1:500, Abcam, Britain) overnight at 4 °C. After washing with PBS twice, cells were incubated with fluorescent dye-conjugated secondary antibodies (Abclonal, China) for 1 h in the dark. Fluorescence microscopy was performed to observe the cells after the slides had been washed twice with PBS and sealed with DAPI-containing anti-fluorescence attenuator (Invitrogen, USA). Quantitative fluorescence analysis was performed with Image J.
The osteogenic effect of scaffold and macrophage coculture supernatant on BMSC
Evaluation of genes involved in osteogenesis in vitro
Supernatant was collected from the scaffolds after 3 days of coculturing with RAW264.7 cells and was mixed 1:1 with BMSC complete medium (DMEM culture + 10% FBS + 1% penicillin/streptomycin) to create conditioned medium (CM). CM and BMSCs were cocultured, and CM was changed every 2 days. The above qPCR method was used to take cells after 3 and 7 days for qPCR analysis. Primer sequences are displayed in Supplemental Table S2.
Alkaline phosphatase and alizarin Red S staining
Following 2 days of CM incubation, the culture was continued in osteogenic media (complete medium supplemented with 5-mM L-glycerophosphorus, 100 nM dexamethasone, and 50 mg/mL ascorbic acid; Sigma-Aldrich). On day 7 and 21, Alizarin Red S (ARS) staining and alkaline phosphatase (ALP) staining were performed according to the manufacturer’s instructions. Every 2 days, the osteogenic media was replaced.
Evaluation of osteogenesis-related proteins in vitro
Proteins from each group were collected and tested using western blotting in accordance with our research team’s previous technique after 7 days of BMSC and scaffold coculture. 40 The proteins were isolated by SDS-PAGE gel (Vazyme, China) electrophoresis, then transferred to polyvinylidene fluoride (PVDF) membrane (Solarbio, China), and soaked in 5% skim milk for 2 h. The membrane was immersed in the primary antibody solution of the corresponding protein at 4°C overnight. The membrane was washed with TBST (1000 mL TBS +1 mL Tween 20) solution, soaked with the corresponding secondary antibody solution for 1 h, and washed with TBST solution. Protein bands were displayed using an improved chemical luminescence agent from NCM Biotech in China. All proteins involved in osteogenesis that were used in western blot assays were obtained from Proteintech (China).
According to the immunofluorescence staining method above, BMSCs were co-cultured with CM for 24 h, and the expression level of OPN in these cells was examined under a fluorescence microscope using a primary antibody (1:50, Proteintech, China). Quantitative analysis of fluorescence was performed using Image J.
Angiogenic effects of scaffolds in vitro
Transwell assay
HUVECs (2 × 10⁵ cells/cm2) were seeded inside the transwell chamber, 200 µL of DMEM media was added simultaneously, and then 500 µL of SE was put outside the chamber for incubation. The transwell chamber was then placed in a 24-well plate. Cells in the chamber layer were wiped with a cotton swab after 24 h, fixed for 30 min with 4% paraformaldehyde, and then stained with crystal violet. Cell migration was observed using a microscope. The ratio of positive cells was computed using Image J.
EdU cell proliferation assay
HUVECs proliferation was measured using a fluorescence microscope and cellular immunofluorescence labeling using an EdU cell imaging kit (Ribobio, China) in accordance with the manufacturer’s instructions after cells had been cocultured with SE for 24 h.
In vitro angiogenesis assay
Matrigel (200 µL; ABW, China) was added to each well of a 24-well plate, which was then incubated at room temperature for 30 min. Then, HUVECs (2 × 10⁴ cells) and 500 µL SE were seeded into each well and were incubated for 24 h. Calverdin fluorescent dye was used to label the cells. The formation of tubular structures was observed using a fluorescence microscope. The nodes and branches were assessed using Image-Pro Plus 6.0.
Evaluation of genes involved in angiogenesis in vitro
HUVECs and scaffolds were cocultured, and after 3 and 7 days, cells were removed for qPCR analysis. The CM was replaced every 2 days. Supplemental Table S3 lists the essential primer sequences.
Evaluation of proteins associated with angiogenesis in vitro
Western blotting was used as previously described after HUVEC coculture with scaffolds for 7 days, and the protein levels were examined using an improved chemical luminescent agent (NCM Biotech, China). All the proteins linked to vascularization used in western blotting studies were from Proteintech (China).
After growing for 24 h, immunofluorescence staining with a particular primary antibody (VEGF, 1:50, Proteintech, China) was used to evaluate the expression of VEGF protein in HUVEC under a fluorescent microscope. Using Image J, quantitative fluorescence analysis was performed.
VEGF secretion factor assay
HUVECs were cocultured with scaffolds for 3 days before the supernatants were collected. The level of VEGF in the supernatant was assessed using an ELISA kit (Multi Science, China) in accordance with the manufacturer’s instructions.
In vivo animal experiments
Thirty 3-month-old Sprague–Dawley rats (200–220 g) were randomly divided into three groups. Rats were anesthetized with phenobarbital (0.3 mg/kg) as an intravenous anesthetic before surgery. An 8 mm diameter skull defect was made with an electric trephine. At 1, 4, and 8 weeks after the operation, the animals were euthanized with excessive phenobarbital (0.6 mg/kg). Meanwhile, to assess the vascularization ability of scaffold in vivo, different grafts were implanted into the subcutaneous of rat backs. At 7 days, subcutaneous tissues were removed, and fixed with 4% paraformaldehyde solution. The Animal Ethics Committee of the Second People’s Hospital of Changzhou accepted this experiment and it complied with the recommendations of the IACUC.
Micro-CT
A micro-CT scanner (SkyScan 1176 in vivo micro-CT, Bruker, Belgium) was employed to create 3D images of cranial bone samples at 8 weeks after the operation. The measures of bone repair, such as bone mineral density (BMD), bone volume/total volume (BV/TV), bone volume (BV), and trabecular number (Tb. N), were further examined.
Evaluation of histology and immunohistochemistry
Samples were decalcified with 10% ethylenediamine tetraacetic acid disodium salt for 8 W at 37°C. Subsequently, the specimens were 5-µm sectioned and fixed in paraffin. Masson staining and hematoxylin and eosin (H&E) staining were performed in accordance with kit instructions before examination with a microscope. Sections were treated with the primary antibodies CD86 (1:50, Proteintech, China) and CD206 (1:50, Proteintech, China) overnight at 4°C for immunohistochemistry fluorescence staining, and then with FITC- or CY3-conjugated secondary antibodies for an additional hour at 37°C in the dark. Sections were sealed with anti-fluorescence attenuator containing DAPI and examined under a fluorescence microscope after being washed twice with PBS. Immunohistochemistry staining was performed using antibodies to BMP2, p-Smad1/5/8, RunX2, VEGF, and HIF1 antibodies (Proteintech, China), and the sections were observed under a light microscope.3,14 Fluorescence quantitative assessment was performed to analyze the results using Image-Pro Plus.
Statistical analysis
All data are presented as average ± standard deviation. Origin 8.0 software (Origin Lab Inc., USA) and GraphPad Prism 8.0 software (GraphPad software Inc, USA) were used for statistical analysis. One-way analysis of variance was employed to evaluate group differences. p = 0.05 was used to denote statistical significance.
Results
Morphology of the material scaffold
The general morphology of PNs was assessed with SEM (Figure 1(a)). The particle size of PNs was concentrated in the range of 300–600 nm, which belonged to nanoscale nanospheres (Figure 1(b)). Figure 1(c) shows the macroimage of the scaffold prepared by using 3DP technology. The scaffold morphologies at low and high magnification are shown in Figure 1(d). The aperture of the stent was approximately 500 µm at low magnification. PNs covering the material scaffold can be seen under 3000 times magnification. The cell pseudopodia appeared fully extended fully when viewed under SEM, indicating that the scaffold was favorable for cell attachment and showed low cytotoxicity (Figure 1(e)).

Scaffold characterization: (a) SEM image of PNs, (b) particle size distribution of PNs, (c) gross morphology of cell and animal scaffolds, (d) SEM images of each scaffold. The PNs on the material’s surface are shown by the red arrow. (e) SEM images showing macrophages adhere to the scaffolds in each group.
Scaffold characterization
When evaluating the rheological characteristics of the material, we detected that the storage modulus (G′) was always greater than the loss modulus (G″) between 10°C and 50°C and that a crossover point was absent, showing that the material can maintain a stable liquid form at this temperature, which helps ensure the material can be extruded. The G″ represents the mechanical qualities of a material, implying more strength and elasticity (Figure 2(a)). The viscosity of the substance reduces with increasing shear rate, demonstrating the shear thinning property as shear failure occurs in the crosslinking of the material (Figure 2(b)).41,42

Physical and chemical characterization and cell activity of scaffolds in each group. (a) Changes in G′ and G′ of bioinks in each group between 10°C and 50°C. (b) Changes in apparent viscosity of each group of bioinks at shear rates ranging from 0 to 1000. (c) Curves showing compressive strain for each scaffold, and (d) water absorption expansion rate over 24 h of the dry scaffold; **p < 0.01 and ***p < 0.005 compared with the APG group. (e) Water contact angle images and data of each scaffold. (f) The rate of APGG group scaffold degradation at 37°C. (g) UV absorption wavelength of PIO. (h) PIO-sustained release curves of APGGP and APG + PIO scaffolds at 37°C. (i) Macrophage live/dead staining images for each group under SE. (j) Phalloidin staining images of HUVECs under SE of each group. The selected and expanded region is the white box. Data are presented as mean ± standard deviation (n = 3).
The compressive strength of each group of scaffolds is shown in Figure 2(c) under dry conditions, demonstrating that the inclusion of PNs had no impact on the mechanical characteristics of the material. The water absorption expansion rate and WCA of the scaffold were assessed. The water absorption expansion rate of scaffold decreased with the addition of PNs, but the WCA did not change. This demonstrates that the scaffold has some water retention and hydrophilicity properties (Figure 2(d) and (e)). Examination of the scaffold in the APGGP group showed that this could gradually degrade over time (Figure 2(f)). We then determined if PIO was loaded in PNs and the impact of PLGA nanospheres on sustained drug release. Figure 2(g) shows that PIO has a clear absorbance at 238 nm; a standard curve for PIO had an R2 value of 0.999. These outcomes demonstrated that the PLGA inclusion in nanospheres significantly decreased the premature explosive discharge. On day 5, sustained release in the group without PNs stabilized at a total release rate of 41% ± 2.5%. The early sustained release duration was prolonged to day 9 by the inclusion of PNs, and the total release rate was 32.5% ± 1.5% (Figure 2(h)).
Cell toxicity assays
A few dead cells were observed in each group when the cytotoxicity of the scaffolds was measured using the live/dead staining kit, suggesting minimal variation of cytotoxicity between the scaffolds (Figure 2(i)). Using the phalloidin staining, the impact of scaffolds on the cytoskeleton was investigated. We found that all HUVECs in each group had a full cytoskeleton and exhibited green microfilaments and blue nuclei on fluorescent staining. These findings indicated that the scaffold of each group had a low level of cytotoxicity (Figure 2(j)).
Immunomodulatory effects of in vitro scaffolds
The viability of all groups was lower than that of the negative control group on the first day, as demonstrated via the CCK8 assay. The survival rate of the APGG group on the third day was 84% compared with that of the negative control group, which was significantly lower than that of the other groups, and its impact on cell proliferation was within acceptable limits.38,43 The scaffolds from each group may be used for cytological studies as of day 5 because of the lack of a significant difference between the groups (Figure 3(a)). LPS was used to promote the proinflammatory M1 phenotype in RAW264.7 macrophages before coculture with scaffolds. The induction effect of LPS on stimulated cells and negative control was assessed via to qPCR analysis. Expression of M1-related genes (IL-1, IL-6, and NOS2) was considerably increased in cells following M1 induction. Thus, LPS successfully induced macrophages into M1 (Figure 3(b)). qPCR was performed 1 and 3 days after scaffold coculture. Expression of M1-related genes (iNOS, IL-6, IL-1, and TNF-α) was significantly downregulated in the APGG and APGGP groups compared with that in the APG group. On day 3, TNF-α gene expression in the APGGP group was significantly lower than that in the APGG group; the expression of M1-related genes was downregulated to a greater degree on day 3 than that on day 1 (Figure 3(c)). Conversely, the expression levels of M2-related genes, such as CD206, Arg-1, and IL-10, were markedly upregulated in the APGGP group compared with that in the APG and APGG groups. On day 1, CD163 expression in the APGGP group was significantly increased compared with that in the APG group, and on day 3, expression in the APGGP group was significantly upregulated compared with the APG and APGG groups. Expression of all tested genes was significantly elevated in M2-related genes on day 3 compared with that on day 1 in the APGGP group (Figure 3(d)).

Regulation of RAW264.7 cells treated with LPS by scaffolds. (a) CCK8 assay results after coculturing SE and RAW264.7 cells with scaffolds in each group day 1, 3, and 5. (b) qPCR examination of LPS-treated RAW264.7 cells and the negative control group. (c and d) qPCR analysis of RAW264.7 cells treated with LPS in each group on day 1 and 3 of coculture. (e) Flow cytometry examination of RAW264 cells from each scaffold exposed to SE and LPS for 1 day. (f) ELISA detection of IL-6 and IL-10 levels of RAW264.7 cells treated with LPS in each group after 3 days of coculture. Data are shown as mean ± standard deviation (n = 3). *p < 0.05, **p < 0.01, ***p < 0.005, and ****p < 0.001 compared with the APG group. #p < 0.05, ##p < 0.01, ###p < 0.005, and ####p < 0.001 compared with the APGG group.
The APGGP group showed a decrease in the abundance of NOS2-positive macrophages and an increase in that of CD206-positive macrophages (Figure 3(e)). Additionally, the level of IL-6 in the APGGP group was much lower than that of the APG and APGG groups. However, the level of IL-10 was significantly higher in the APGGP group (Figure 3(f)).
The fluorescence intensity of CD86 in the APGGP group was reduced compared with that in the APG and APGG groups. In addition, the fluorescence intensity of CD206 in the APGGP group was higher than that of the other groups (Figure 4(a)). CD86 fluorescence intensity in the APGGP group was much lower than that in the APG group, whereas CD206 fluorescence intensity was higher than that in other groups (Figure 4(b)). Accordingly, the APGGP scaffolds could aid in the transition of M1 macrophages from proinflammatory to M2 macrophages.

Immunofluorescence detection of RAW264.7 cells treated with SE and LPS from different scaffolds. (a) Immunofluorescence images of cultured macrophages in each group. (b) Quantitative analysis of the fluorescence intensity of CD86 and CD206. Data are shown as mean ± standard deviation (n = 3). **p < 0.01 and ***p < 0.001 compared to the APG group. ####p < 0.001 compared with the APGG group.
Osteogenic effect of CM on BMSCs
The expression levels of the osteogenesis-related genes, such as Runx2, OSX, ALP, COL-1, OPN, and OCN, were considerably increased in the APGGP group compared with that in the APG and APGG groups after 3 and 7 days of CM coculture with BMSCs, according to qPCR. The expression levels of the Runx2, OSX, and COL-1 genes were lower on day 3 than that on day 7; however, those of ALP, OPN, and OCN decreased by day 7 (Figure 5(a)). Osteoblast differentiation in the APGGP group was markedly improved after 7 days of ALP staining (Figure 5(b)). In comparison with that in the APG and APGG groups, the amount of calcium nodule deposition in the APGGP group was significantly increased by day 21 (Figure 5(c)).

Effects of CM on BMSC in each group. (a) qPCR examination of osteogenic genes associated with BMSCs in the CM of each group on day 3 and 7. (b) Images of ALP staining after 7 days of culture. (c) Images of ARS staining after 24 days of culture. (d) In each group, the BMSC osteoblast-related protein was examined by western blotting after 7 days of CM coculture. (e) Quantitative examination of the western blot gray values. (f) OPN protein immunofluorescence of BMSC staining images. (g) Quantitative analysis of OPN fluorescence intensity. (h) qPCR analysis of genes associated with the BMSC osteoblast pathway following 7 days of CM stimulation in each group. (i) BMSC osteoblast pathway protein western blot assay. (j) Quantitative analysis of western blot of the BMSC osteoblast pathway protein. Data are shown as mean ± standard deviation (n = 3). *p < 0.05, **p < 0.01, ***p < 0.005, and ****p < 0.001 compared with the APG group. #p < 0.05, ##p < 0.01, ###p < 0.005, and ####p < 0.001 compared with the APGG group.
Western blotting was performed to assess the expression of osteogenesis-related proteins supported by scaffolds in BMSCs. The results revealed that the levels of Runx2, OSX, COL-1, ALP, OPN, and OCN protein expression in the APGGP group were significantly greater than that in the other two groups (Figure 5(d) and (e)). Figure 5(f) shows that OPN protein expression in the APGGP group was markedly higher than that in the other groups. OPN protein immunofluorescence labeling in BMSCs revealed that much higher fluorescence levels in the APGGP group than the APG and APGG groups (Figure 5(g)). Therefore, the inclusion of PNs containing PIO considerably improved the capacity of the scaffold to encourage the osteogenic differentiation of BMSCs.
CM promotes osteogenic differentiation through BMP2/Smad/RUNX2 pathway
We employed qPCR to detect the expression of relevant genes in various osteogenic differentiation pathways to examine the potential mechanism whereby CM promotes osteogenic differentiation of BMSCs in vitro. The findings demonstrated that the expression levels of TGF-β, BMP2, Smad1, Smad4, Smad5, and RUNX-2 in the APGGP group were much higher than that in the APG and APGG groups (Figure 5(h)), indicating that CM may be active in TGF-β/Smad/BMP2 and BMP2/Smad/RUNX2 signal pathways during BMSC osteogenic differentiation in vitro. Western blotting verified that the expression of proteins, including BMP2, p-Smad1/5/8, Smad4, and RUNX2, in the APGGP group was significantly increased in comparison with that in the other groups (Figure 5(i) and (j)). Therefore, these findings indicated that APGGP group scaffolds increased macrophage polarization in vitro, activated the BMP2/Smad/RUNX-2 signaling pathway, and ultimately boosted BMSC osteogenic differentiation.
Proangiogenic effects of stents in vitro
The migratory ability of endothelial cells is intimately tied to angiogenesis. To determine if the experimental group may influence the migration of HUVEC cells, a transwell assay was performed. Endothelial cell migration in the scaffold group was much higher than that in the negative control group, according to crystal violet staining, and the APGGP group outperformed the other groups by a wide margin (Figure 6(a)). The quantitative analysis revealed that the endothelial cell count was significantly higher in the APGGP group than that in the control groups (Figure 6(d)). After HUVECs were stained with EdU, adding PMs containing PIO considerably increased the amount of pink fluorescence in HUVECs compared with that in the other groups (Figure 6(b)).

Effects of each group on the biological activity of HUVECs. (a) Transwell result images. (b) HUVEC images stained with EdU. (c) Images from each group’s in vitro tube formation experiment with HUVEC. (d) Quantitative analysis of transwell results. (e) Quantitative evaluation of the findings of EdU staining. (f) Quantitative analysis of the outcomes of the HUVECs tube formation experiment. (g) Quantitative analysis of the number of branches results. Data are shown as mean ± standard deviation (n = 3). *p < 0.05, **p < 0.01, ***p < 0.005, and ****p < 0.001 compared with the NC group. ####p < 0.001 compared with the APG group. $$$$p < 0.001 compared with the APGG group.
The quantitative analysis revealed that cell proliferation in the APGGP group was much higher than that in the other groups (Figure 6(e)). HUVECs and SE were cocultured for the angiogenesis test. The scaffold group had more tubes than in the negative control group, and the number of intact tubules in the APGGP group was significantly more than that in the other groups (Figure 6(c)). The APGGP group had more nodes and branches overall than were present in the other groups (Figure 6(f) and (g)).
To assess the vascularization of HUVECs in relation to scaffold effects, cells were cocultured with scaffolds for 3 and 7 days before qPCR examination of the expression of genes involved in vascularization. The expression levels of genes such as CD31, VEGF, HIF1-α, FGF, PDGF, and NOS3 were significantly upregulated in the APGGP group compared with that of the APG and APGGP groups (Figure 7(a)).
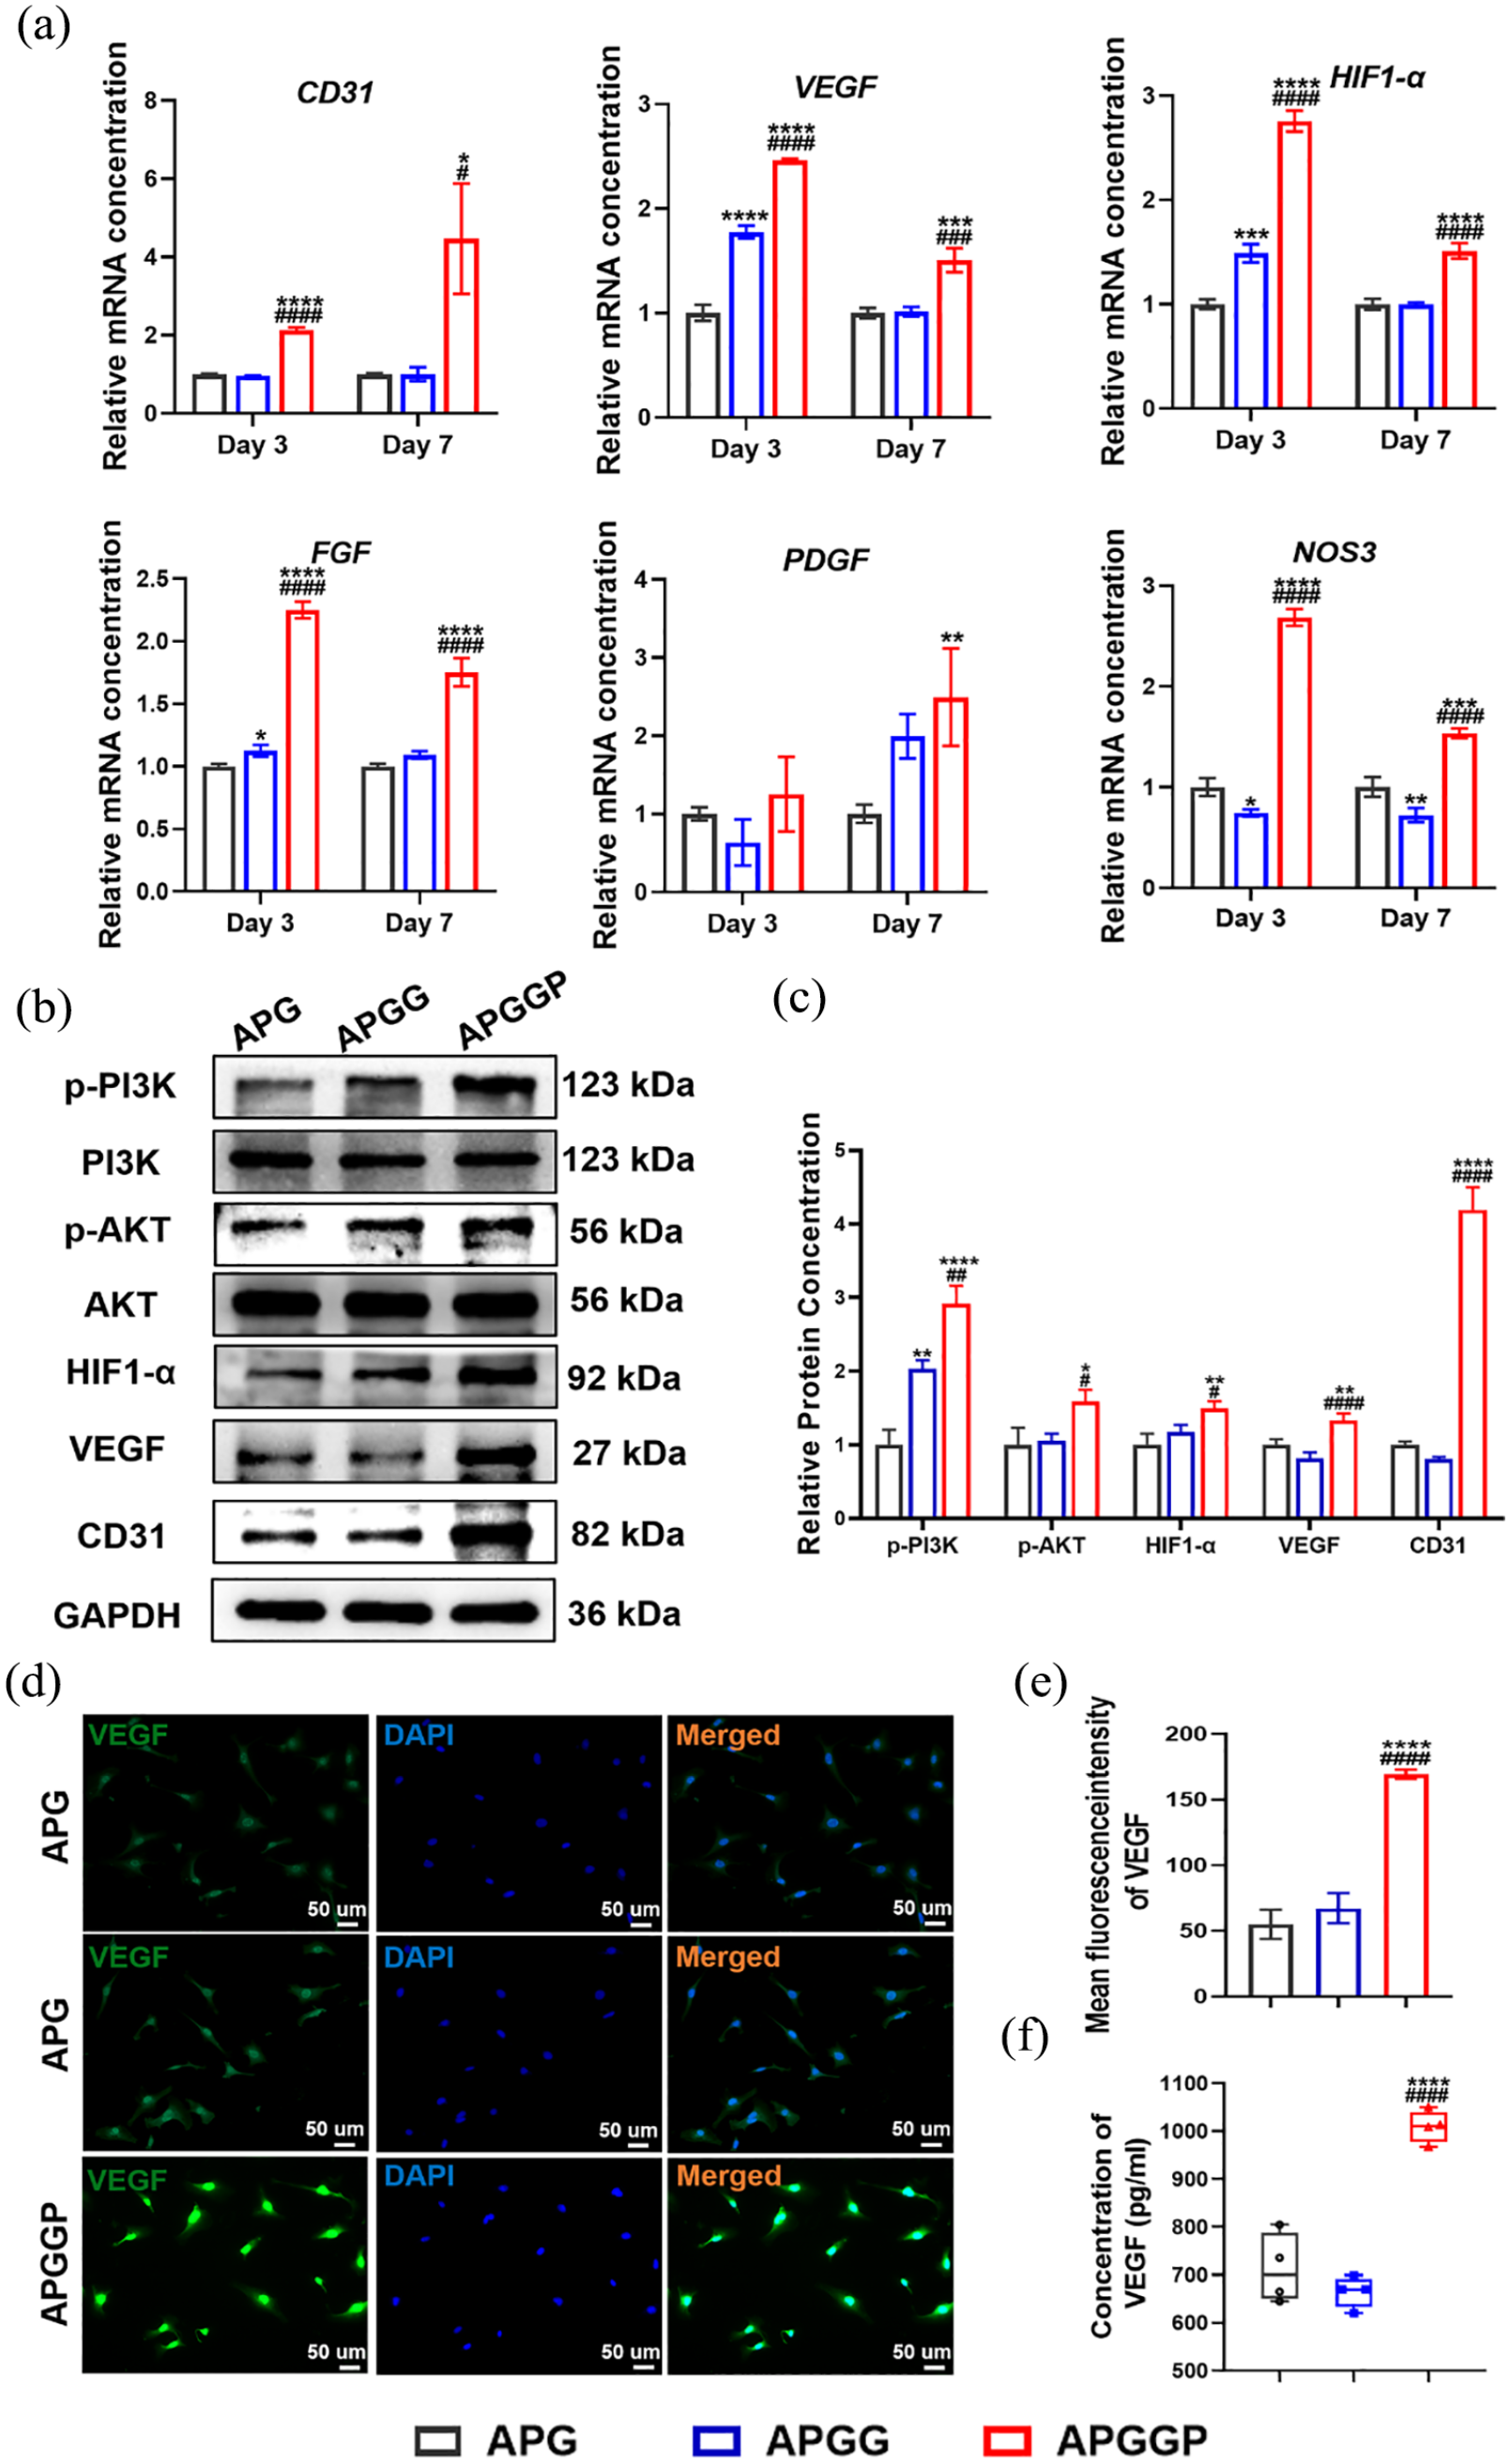
Effects of each group on HUVEC vascularization. (a) qPCR analysis of genes associated with HUVEC vascularization on day 3 and 7. (b) Western blot assay of vascularization pathway-associated protein after scaffold and HUVEC culture for 7 days. (c) Quantitative evaluation of western blot for vascularization. (d) images of the VEGF protein stained with immunofluorescence after 1 day of incubation in HUVECs. (e) Quantitative evaluation of the intensity of VEGF immunofluorescence. (f) VEGF secretion from HUVECs following 3 days of incubation was detected by ELISA. Data are shown as mean ± standard deviation (n = 3). *p< 0.05, **p < 0.01, ***p < 0.005, and ****P < 0.001 compared with the APG group. ####p < 0.001 compared with the APGG group.
Scaffolds promote vascularization by activating the PI3K/AKT/HIF1-α/VEGF pathway
We found that the HIF1-α, VEGF, and cytokine expression levels in the APGGP group were considerably greater than those in the APG and APGG groups based on the findings of qPCR studies. The PI3K/AKT/HIF1-α/VEGF pathway encourages HUVEC vascularization, proliferation, and migration. 44 Western blotting was used to detect related pathway proteins, and the protein expression of p-PI3K, p-AKT, HIF1-α, VEGF, and CD31 in the APGGP group was significantly increased compared with that in the APG and APGG groups (Figure 7(b) and (c)).
Detection of VEGF protein in HUVECs by immunofluorescence showed that that the APGGP group had higher fluorescence intensity than that in the other groups (Figure 7(d) and (e)). The ELISA results demonstrated that the level of VEGF in the APGGP group was significantly higher than that in the APG and APGG groups (Figure 7(f)), indicating that the PI3K/AKT/HIF1-α/VEGF pathway may be activated by scaffolds in the APGGP group to improve HUVEC vascularization.
Analysis of early inflammation in vivo
A portion of the skull tissues were obtained for H&E and immunofluorescence staining on day 7 after the scaffolds were implanted into skull defects in each group. Many cells, including numerous inflammatory cells, had gathered near the scaffolds in all groups (Figure 8(a)). Immunofluorescence examination of the skull tissue at day 7 revealed that in contrast to the APG and APGG groups, the APGGP group reduced M1 macrophage infiltration while M2 macrophage numbers increased (Figure 8(b) and (c)). These findings suggest that early in vivo polarization of M1 to M2 can be effectively promoted by APGGP scaffolds. Consequently, the early inflammatory reaction was successfully reduced.

Early (7 days) inflammatory modulation of scaffolds in vivo. (a) Images of the stent and adjacent new tissue stained with HE. (b) Tissue slice immunofluorescence images of the early inflammatory markers CD86 (M1 marker) and CD206 (M2 marker). (c) Quantitative analysis of the M1 (CD86) to M2 (CD206) ratio in stained tissue sections. Data are shown as mean ± standard deviation (n = 3). ****p < 0.001 compared with the APG group. ###p < 0.005 compared with the APGG group.
Osteogenesis in vivo
We used micro-CT to reconstruct the skull defect tissue after 8 weeks and could observe see a small amount of new bone growing from the defect edge in the negative control group. The number of new bones in the scaffold group was significantly higher than that in the negative control group, and many of the new bones grew along the material at the defect, showing that the scaffold in this study was favorable for the migration, adhesion, and proliferation of mesenchymal stem cells. In addition, many new bones were observed in the APGGP group than in the other groups. All the scaffolded groups had growth of new bones in the cross section of the skull, although the APGGP group has more new bones than the other groups (Figure 9(a)). The APGGP group had considerably higher BMD, BV/TV, Tb. N, and BV than that was present in the other groups (Figure 9B, C).

(a) Micro-CT 3D imaging and sagittal imaging 8 weeks after the stent was implanted. (b) Bone volume to total volume ratio (BV/TV). (c) Bone mass (BMD). (d) and (e) Tissue section results from H&E and Masson staining 4 weeks after stent insertion. The selected expanded region is shown by the black and red boxes. Where M, OB and NB refer to material scaffold, original bone and new bone respectively. Data are shown as mean ± standard deviation (n = 3). *p < 0.05 and ***p < 0.005 compared with the NC group. #p < 0.05 and ##p < 0.01 compared with the APG group. $$p < 0.01 compared with the APGG group.
H&E staining revealed a significant number of new bone tissues in the APGGP group closely resembled both sides of bone tissues in terms of color. In the other groups, only minor quantities of new bone tissue were found (Figure 9(d)). Further analysis using Masson staining revealed that the APGGP group had much more collagen deposition than was present in the other two groups. This showed that scaffolds in the APGGP group strongly promoted the formation of collagen and bone (Figure 9(e)).
We found that the BMP2/SMAD/RUNX2 pathway promoted bone formation through in vitro cell research. To confirm this, various associated proteins were immunohistochemically stained. Compared with that in the APG and APGG groups, the abundance of BMP2, p-Smad1/5/8, and RUNX2-positive cells were significantly increased in the stained sections at 4 and 8 weeks in the APGGP group (Figure 10(a) and (b)). In line with the findings of the earlier experiments, the scaffolds in the APGGP group greatly aided bone formation in vivo via the BMP2/SMAD pathway by promoting the conversion of M1 macrophages into M2 macrophages.

(a) Images of osteogenic pathways stained with immunohistochemistry following the implantation for 4 and 8 weeks. (b) Quantitative immunohistochemistry staining analysis. Data are shown as mean ± standard deviation (n = 3). **p < 0.01, ***p < 0.005, and ****p < 0.001 compared with the APG group. #p < 0.05, ##p < 0.01, and ###p < 0.005 compared with the APGG group.
Promoting vascularization in vivo
The scaffolds were then implanted beneath the skin surface and were removed at a specific period for analysis. Small blood vessels could be seen by H&E staining in the tissue sections of each group. The APGGP group had a greater number of larger blood vessels than was present in the other groups (Figure 11(a)). The immunohistochemical labeling of the vascularization proteins HIF1-α and VEGF in the PI3K/AKT/HIF1-α/VEGF pathway was performed. The results revealed that the number of HIF1-α- and VEGF-positive cells in the APGGP group was significantly higher than that in the other groups (Figure 11(b) and (c)). The protein expression levels of HIF1-α and VEGF in the APGGP group were significantly higher than those in the other groups, according to the quantitative analysis (Figure 1(e) and (f)). Immunofluorescence staining CD31 protein in the slices was performed to learn more about the blood vessels. The CD31-positive cells were found in greater abundance in the sections of the APGGP group compared with that in the APG and APGG groups (Figure 11(d) and (g)). With the inclusion of PNs loaded with PIO, scaffold can considerably enhance the development of neovascularization. These findings supported the findings of the in vitro analysis and showed that the PI3K/AKT/HIF1-α/VEGF pathway may be used by the APGGP group scaffolds to promote angiogenesis. In addition, masson staining was performed on the skin model sections, and the results showed that the APGGP group had more collagen deposition than the APG and APGG groups (Figure S4).

Results of vascularization-related staining 15 days after scaffold implantation. (a) Skin tissue slice picture after H&E staining. The larger region is shown by the red box. (b) Skin tissue slice immunofluorescence staining for CD31. (c and d) Immunohistochemical image of vascularization pathway proteins in the skin tissue slice. (e and f) HIF1-α and VEGF immunohistochemical quantitative analysis. (g) Analysis of CD31 quantitative immunofluorescence. Data are shown as mean ± standard deviation (n = 3). **p < 0.01 and ****p < 0.001 compared to the APG group. ##p < 0.01 and ####p < 0.001 compared to the APGG group.
Discussion
The regulators of tissue remodeling and macrophages are a crucial part of the inflammatory process and have both a positive and negative function in tissue remodeling.45 –47 The host will produce an inflammatory reaction because of the implantation of biomaterials, which raises the failure rate of material implantation. The interaction between macrophages and biomaterials has drawn increasing amount of attention recently. By controlling how macrophages transition from M1 to M2, bone formation can be effectively increased.48 –50 In this study, ATP/PVA/GEL composite scaffolds containing PIO-loaded PNs were created using 3DP. ATP can be improved by establishing hydrogen bonds with material properties in crosslinking and boosting osteogenesis differentiation. 14 PVA and GEL are routinely used in the creation of material scaffolds, which are frequently utilized in tissue engineering and drug delivery systems.51,52 In this study, we created a nanoparticle loaded with PIO to be employed in bone tissue engineering. PIO-containing PNs were utilized to encourage M1 to M2 polarization, lessen the early inflammatory response brought on by material implantation and bone defects, and increase the growth of new blood vessels in bone defects, so as to improve the osteogenic microenvironment. At the same time, macrophage polarization, angiogenesis, and ATP can effectively promote early and late osteogenic differentiation. It can effectively promote the regeneration of bone tissue in the bone defect for a long time.
Although our goal was for this treatment to be anti-inflammatory, we do not simply want to reduce inflammation. Instead, a portion of the proinflammatory M1 is polarized into the anti-inflammatory repair M2 during the host inflammatory response, reducing the M1/M2 ratio and producing an anti-inflammatory effect. In vivo macrophage over-expression of M2 results in fibrous encapsulation and prevents bone formation. 38 Therefore, a degree of inflammation is necessary, and the physical and chemical characteristics of the biomaterials themselves are crucial for the inflammatory response brought on by implantation in the host.53 –55 Therefore, this must be considered when creating biomaterials. Using SEM, the material surface was observed to be rough, which can encourage cell attachment, multiplication, and osteogenic differentiation.54,56 Furthermore, the pore diameter of the scaffold was approximately 500 µm, which is favorable for bone formation. 57 The WCA and water swelling ratio demonstrated the strong hydrophilicity of the material, which promoted cell adhesion.58,59 Despite the presence of hydrophobic PMs, the hydrophilicity of the material was not significantly diminished. Macrophages can proliferate more effectively on a softer hydrogel matrix. 60 The inclusion of PNs can dramatically lengthen the period between the early burst release and the overall release time of PIO in the sustained drug release experiment. PLGA material can easily degrade, and with the degradation of PNs, the accumulation of more macrophages can be encouraged, and more PIO can be released, which further promotes macrophages to switch from M1 to M2.61,62 Macrophages are attracted by the production of cytokines by early M1 cells. It is widely recognized that a certain amount of early inflammation can efficiently enhance angiogenesis, which can subsequently further promote the production of new bone. 63 Overall, the designed scaffold can encourage macrophage adhesion, proliferation, and recruitment.
APGGP scaffolds increased the expression of M2-related indicators (CD206, Arg-1, CD163, and IL-10) in the in vitro immune cell tests while inhibiting the expression of M1-related markers (IL-1, IL-6, NOS2, and TNF-α). In the in vivo experiment, early inflammatory cell infiltrations were present on the rat skull tissue surfaces and in and around the scaffolds. The ratio of M1/M2 macrophages was much lower in the APGGP group than that in the other groups, indicating the scaffold in that group could effectively promote M1 to M2 macrophage conversion and lessen the inflammatory response to the material.
This study primarily focused on the modulation of bone immune characteristics under the interaction of macrophages and BMSCs in the context of osteogenesis. Inflammatory substances released by M1 or M1 can encourage BMSCs to differentiate into osteoblasts.64,65 Similar to this, extensive research on macrophage polarization has revealed that M2 macrophages have a better capacity to support BMSC osteogenic development.66 –68
To promote the polarization of macrophages from M1 to M2, thereby improving the ability of the material to promote osteogenic differentiation of BMSCs, we designed a biomaterial scaffold that takes advantage of the host inflammatory response at the time of implantation to achieve these needs. In an in vitro experiment, we used the scaffold to coculture macrophages, and after the culture, collected the supernatant to create CM. To indirectly achieve the coculture of macrophages and BMSCs in vitro, CM was used to cultivate BMSCs. The outcomes demonstrated that the scaffold could boost the expression of BMSC osteogenic genes and proteins in vitro by the addition of PIO-containing PNs. The same is valid for both ARS and ALP staining.
A large number of studies have found that M2 macrophages promote the osteogenic differentiation of BMSCs through various pathways50,69,70 and play an important role in the formation and development of bone tissue.71 –73 Therefore, we investigated the potential mechanisms in more detail. The findings demonstrated that CM can boost BMSC osteogenic development by triggering the BMP2/Smad/RUNX2 pathway. We detected that CM may be achieved by stimulating the TGF-β/Smad pathway. The osteogenic differentiation capacity of BMSCs was supported by the APGGP group in the in vivo experiment. According to the micro-CT findings, along the scaffold structure, new bone developed at the defect in the skull. This suggested that the scaffold we created can encourage BMSC migration, adhesion, and proliferation. Our assumption that the addition of PIO-loaded PNs could efficiently lower inflammation while enhancing bone growth was further supported by this data.
According to the in vitro findings, the APGGP group had higher levels of BMP-2, p-Smad1/5/8, and RUNX-2 expression than that in the other groups. This suggested that the BMP2/Smad/RUNX2 pathway was activated by APGGP scaffolds to promote osteogenic differentiation. Osteogenesis is a multimechanism process that requires complexity. Through both in vivo and in vitro tests, we demonstrated that the APGGP scaffolds may reduce inflammation in its early stages while simultaneously activating the BMP2/Smad/RUNX2 pathway to encourage BMSC differentiation into osteoblasts and the growth of new bone.
Multifactor integration leads to bone formation, and both macrophages and angiogenesis can encourage the production of new bone. A dense vascular network that can carry the cytokines and minerals is needed for bone development in the bone defect, creating a favorable environment for bone growth.74,75 To advance osteogenic development, vascular endothelial cells can release BMP-2 cytokines through paracrine mechanisms. 75 In this study, we investigated the vascularization potential of the scaffold. The scaffolds of the APGGP group could considerably boost the migration and proliferation of HUVECs, according to in vitro cell tests. Additionally, the expression of HUVEC vascular-related genes and proteins noticeably increased with the addition of PIO-containing PNs. The APGGP scaffold contributed to the development of neovascularization, as shown by the increased expression of CD31 protein in vivo tests.
Through the PI3K/AKT pathway, paeoniflorin can increase HUVEC migration, proliferation, adhesion, and tube formation. 76 Through the PI3K/AKT/HIF1-α/VEGF pathway, the total flavonoids of Rhizoma drynariae can boost HUVEC migration, proliferation, and vascularization to accelerate bone formation. 44 In this study, we found that HUVECs in the APGGP group had significantly higher expression of PI3K/AKT/HIF1-α/VEGF signal pathway-related proteins, which allowed us to investigate the potential mechanism triggered by the scaffolds with HUVECs. We showed that the APGGP group had much higher neovascularization than that in the other groups in the rat epidermis model. Immunohistochemical staining confirmed the in vitro results by demonstrating the higher expression of VEGF and HIF1-α proteins. This revealed that PI3K/AKT/HIF1-α/VEGF signal pathway was a mechanism via which scaffolds in the APGGP group enhanced vascularization. On day 15, skin tissue sections stained with H&E and Masson showed a large amount of collagen deposition in the APGGP group, demonstrating a good preparation for subsequent bone regeneration. This shows that the scaffolds in the APGGP group induce angiogenesis to aid in the production of new bone and that vascularization and osteogenic differentiation are closely related processes.
Macrophages are a hot research topic in immunology, but the immune reaction between material scaffolds and the body is complicated, and neutrophils, lymphocytes, and other inflammatory cells may also be involved. In this paper, bone healing was studied in the aspects of macrophage immunity and inflammation combined with tissue engineering. In the future, the materials may be evaluated from the perspective of neutrophils and lymphocytes, and there may be new understandings and insights.
Conclusion
In this study, PIO was added to ATP/PVA/GEL biomaterial scaffolds for bone defect repair after being first implanted into PNs. Macrophage migration, adhesion, and proliferation may be boosted by the scaffold. PIO release was significantly delayed when PNs with PIO were added to the scaffold, enabling early recruitment of more M1-type macrophages. In vitro tests demonstrated that scaffolds can successfully stimulate the polarization of macrophages and provide anti-inflammatory effects by incorporating PNs with PIO. Expression of osteogenic genes and proteins was increased due to the activation of the BMP2/Smad/RUNX2 and TGF-β/Smad pathways. Through the PI3K/AKT/HIF1-α/VEGF pathway, the APGGP group could enhance the biological capacity of HUVECs and the expression of vascular-related genes and proteins. The in vivo outcomes matched those of the in vitro analysis. Collagen deposition was observed in the epidermal model at 15 days. It is possible that PIO and ATP cooperate to promote this result. Future research may focus on several related areas. APGGP scaffolds can reduce inflammation, encourage osteogenic differentiation, and enhance vascularization. Vascularization can further aid in the development of new bones. Therefore, ATP/PVA/GEL is a promising biomaterial scaffold for treating bone defects brought on by fractures.
Supplemental Material
sj-docx-1-tej-10.1177_20417314241231452 – Supplemental material for Regulation of the immune microenvironment by pioglitazone-loaded polylactic glycolic acid nanosphere composite scaffolds to promote vascularization and bone regeneration
Supplemental material, sj-docx-1-tej-10.1177_20417314241231452 for Regulation of the immune microenvironment by pioglitazone-loaded polylactic glycolic acid nanosphere composite scaffolds to promote vascularization and bone regeneration by Shijie Fan, Yadong Tan, Xiuchen Yuan, Chun Liu, Xiaoyu Wu, Ting Dai, Su Ni, Jiafeng Wang, Yiping Weng and Hongbin Zhao in Journal of Tissue Engineering
Footnotes
Declaration of conflicting interests
The author(s) declared no potential conflicts of interest with respect to the research, authorship, and/or publication of this article.
Funding
The author(s) disclosed receipt of the following financial support for the research, authorship, and/or publication of this article: Changzhou Clinical Medicine Center of Nanjing Medical University Program (CMCC202216), Technology of Jiangsu Province (BE2018644), and Changzhou Sci&Tech Program (CE20215020) all provided funding for this study.
Supplemental material
Supplemental material for this article is available online.
References
Supplementary Material
Please find the following supplemental material available below.
For Open Access articles published under a Creative Commons License, all supplemental material carries the same license as the article it is associated with.
For non-Open Access articles published, all supplemental material carries a non-exclusive license, and permission requests for re-use of supplemental material or any part of supplemental material shall be sent directly to the copyright owner as specified in the copyright notice associated with the article.