
Abstract
Cartilage tissue engineering aims to generate functional replacements to treat cartilage defects from damage and osteoarthritis. Human bone marrow-derived mesenchymal stem cells (hBM-MSC) are a promising cell source for making cartilage, but current differentiation protocols require the supplementation of growth factors like TGF-β1 or −β3. This can lead to undesirable hypertrophic differentiation of hBM-MSC that progress to bone. We have found previously that exposing engineered human meniscus tissues to physiologically relevant conditions of the knee (mechanical loading and hypoxia; hence, mechano-hypoxia conditioning) increased the gene expression of hyaline cartilage markers, SOX9 and COL2A1, inhibited hypertrophic marker COL10A1, and promoted bulk mechanical property development. Adding further to this protocol, we hypothesize that combined mechano-hypoxia conditioning with TGF-β3 growth factor withdrawal will promote stable, non-hypertrophic chondrogenesis of hBM-MSC embedded in an HA-hydrogel. We found that the combined treatment upregulated many cartilage matrix- and development-related markers while suppressing many hypertrophic- and bone development-related markers. Tissue level assessments with biochemical assays, immunofluorescence, and histochemical staining confirmed the gene expression data. Further, mechanical property development in the dynamic compression treatment shows promise toward generating functional engineered cartilage through more optimized and longer culture conditions. In summary, this study introduced a novel protocol to differentiate hBM-MSC into stable, cartilage-forming cells.
Keywords
Graphical abstract

Introduction
Knee osteoarthritis (KOA) is the most common osteoarthritis afflicting >10% of the population and is one of the leading causes of physical disability. 1 Damaged articular cartilage (AC) of the knee is a risk factor for developing KOA. 2 AC is avascular and has a limited capacity for self-repair. Cell-based therapies using cell culture-expanded autologous AC forming cells (i.e. articular chondrocytes) from non-weight bearing (NWB) AC have shown promising clinical results post-implantation at focal defects.3 –5 However, the extracellular matrix (ECM) produced by the implanted chondrocytes is inferior and does not recapitulate the mechanically competent ECM of native AC due to chondrocyte de-differentiation during cell expansion.6,7
Mesenchymal stem cells (MSC) possess self-renewal and multilineage properties, including the ability to form chondrocytes and synthesize AC ECM after chondrogenesis.8 –10 In addition, MSC are accessible at several less invasive anatomical sites compared to NWB AC, including bone marrow and adipose tissues. As such, MSC have attracted clinical interest for AC repair. However, the current protocols for the chondrogenic differentiation of MSC involve the addition of transforming growth factors (i.e. TGF-β1 or -β3) 11 and produce unstable hypertrophic chondrocytes that progress to bone in vivo through endochondral ossification.12,13 Although these growth factors have been shown in a plethora of studies to be necessary for the initial induction of chondrogenesis for various cell types,14–21 their presence may not be necessary throughout the entire culture duration. Bahcecioglu et al. have demonstrated that initial supplementation of TGF-β1 following by its withdrawal led to increased production of collagen by porcine fibrochondrocytes in a 3D-printed PCL/hydrogel construct under dynamic loading. 16 Hennig et al. have also shown that increased concentrations of TGF-β3 did not improve chondrogenesis of adipose-derived mesenchymal stem cells. 22 Thus, growth factor withdrawal after initial supplementation may promote stable differentiation of MSC into chondrocytes while minimizing growth factor-induced chondrocyte hypertrophy.
It has long been known that the ECM of AC is central to its biomechanical function in the joint and the phenotype of the articular chondrocytes within. 23 Hyaluronan (HA) is a major component of AC’s ECM.23,24 The cell surface antigen, CD44, is the main receptor of HA, and the interaction between HA and CD44 on articular chondrocytes is crucial for the homeostasis of AC. 23 It has been shown that HA-enriched microenvironment augmented the chondrogenesis of adipose-derived MSC through HA-CD44 interaction in the presence of TGF-β1.25,26 The HA-CD44 interaction also mitigated the gene expression of type X collagen (COL10A1) – a marker of hypertrophic chondrocytes. Furthermore, our team has shown that hypoxic culture conditions (a physiologically relevant condition of the knee) of 3% O2 enhanced the in vitro chondrogenesis of adipose and bone marrow-derived MSC (i.e. BM-MSC) in the presence of TGF-β327,28 and reduced the expression of COL10A1 in BM-MSC. 28 Our preliminary data also showed that human BM-MSC (hBM-MSC) expressed CD44 regardless of whether the culture was at 3% or 21% O2. 28
Mechanical stimulation plays a critical role in maintaining healthy cartilage. 29 Dynamic compression (DC) is one of the most widely used loading modalities in cartilage engineering due to its physiological relevance.14,16,30–34 Recent data from our lab suggests that exposing human meniscal chondrocytes embedded in a collagen scaffold to mechanical loading using DC and hypoxia (hence, mechano-hypoxia conditioning) induced a strong pro-chondrogenic phenotype. 32 The treatment strategy increased the mRNA expression of SOX9, an essential transcription factor for chondrogenesis, 35 and hyaline cartilage marker COL2A1, as well as inhibited hypertrophic marker COL10A1, and promoted bulk mechanical property development. 32 Similarly, DC of mouse embryonic limb bud MSC within a collagen hydrogel promoted chondrogenesis through the induction of SOX9 as well as the mRNA expression of other chondrogenic genes, including COL2A1 and ACAN. 36 Another modality of loading is cyclic hydrostatic pressure (CHP), which mimics physiological loading patterns.37,38 A plethora of studies have shown that CHP applied to engineered tissues has induced pro-chondrogenic effects in various cell types, including human MSC.39–46
Taking these altogether, we hypothesize that the combination of mechanical loading with hypoxia culture and TGF-β3 growth factor withdrawal will promote stable, non-hypertrophic chondrogenesis of hBM-MSC embedded in an HA-hydrogel. To this end, we first assessed static hypoxia culture with growth factor withdrawal against static normoxia (20% O2) culture at the global transcriptome and tissue matrix level. We then assessed two modalities of mechanical loading (dynamic compression, DC and cyclic hydrostatic pressure, CHP) with growth factor withdrawal against static culture, all under hypoxia.
Results
RNA-sequencing dataset overview
Transcriptome analysis included the global gene expression profiles of n = 3 donors (M23, M42, M58), each exposed to the experimental conditions from Experiments I and II. Hypoxia (HYP) static culture samples were used for the independent analysis of both experiments. After preprocessing as described in the methods, 13,898 genes were preserved for downstream analysis. Table 1 shows the comparison breakdown and the number of genes that meet the conditions of each filter and Supplemental Table S1 summarizes quality control metrics. The authenticity of the RNA-sequencing data was also validated against select RT-qPCR genes (Supplemental Figure S1), and the degree of correlation was determined with an R2 value of 0.817, showing a strong correlation between the two transcription measurement methods.
Comparison breakdown for ANOVA of RNA sequencing data and the number of genes that meet each filter. Sequencing was performed on n = 3 donors (M23, M42, and M58). Filters are applied additively from left to right.

HYP: hypoxia (3% O2); NRX: normoxia (20% O2); –T3: TGF-β3 withdrawal; +T3: TGF-β3 continual; DC: dynamic compression; CHP: cyclic hydrostatic pressure; Static: static controls not loaded; q-values: adjusted p-values for the false discovery rate (FDR); |FC|: absolute fold change.
Experiment I: Hypoxia and TGF-β3 withdrawal under static culture promoted a non-hypertrophic phenotype of hBM-MSC
We first assessed static hypoxia (HYP, 3% O2) culture with growth factor withdrawal against static normoxia (NRX, 20% O2) culture at the global transcriptome and tissue matrix level. Unbiased principal component analysis (PCA) of the RNA-sequencing data indicated a clear separation for the oxygen tension and TGF-β3 variables across PC1 and PC2, respectively, while the donor variable did not show good separation (Figure 1(a)). The first three PCs together explained 71.3% of the variance in Experiment I. Further, the heatmap of significant differentially expressed genes (DEGs) for the [HYP –T3] vs [NRX +T3] comparison similarly shows a strong separation in the clustering of samples for the oxygen tension and TGF-β3 variables (Figure 1(b)). However, one sample (donor M58, HYP+T3) seemed to separate/cluster differently compared to the other samples in the group. Nonetheless, both experimental variables modulated a large number of DEGs, as indicated in Table 1. Moreover, the Venn diagram (Figure 1(c)) showed that hypoxia and TGF-β3 withdrawal each modulated a unique panel of genes based on the small proportion that overlaps. The combined treatment of HYP –T3 modulated another unique set of DEGs while retaining the majority of DEGs from the individual treatments. This is supported by the volcano plots (Figure 1(d)–(f)), which show different labeled genes that are most up and downregulated in each comparison. Further, the top highest up and downregulated genes (Supplemental Figure S2) unique to each treatment (i.e. from the 16, 17, and 123 genes of the Venn diagram) show that the combined treatment appears to be the additive effect from the individual hypoxia and TGF-β3 withdrawal effects. The top non-redundant Gene Ontology (GO) terms enriched by significant DEGs suggest that TGF-β3 withdrawal modulated genes that function in “ossification” and “inflammatory response” among others. The combined treatment of HYP –T3 also promoted functions related to ECM development and organization (Figure 1(g)–(i)).

Experiment I: RNA-sequencing results suggest that hypoxia (3% O2) and TGF-β3 withdrawal under static culture promoted a non-hypertrophic phenotype of hBM-MSC. (a) Unbiased principal component analysis (PCA) plotting PC1-PC2 and PC1-PC3 for oxygen tension, TGF-β3, and donor variables. (b) Heatmap of significant differentially expressed genes (DEGs) for the [HYP –T3] vs [NRX +T3] comparison with total counts >150, q < 0.05, and |FC| > 2 (1472 genes total). Genes (rows) and samples (columns) are clustered using the Euclidean method. (c) Venn diagram showing the overlap of significant DEGs between different comparisons. The top 15 highest up and downregulated genes in the [HYP –T3] vs [NRX +T3] comparison (123 genes) are shown in Supplemental Figure S2. (d–f) Volcano plots showing significant DEGs in each respective comparison with total counts >150, q < 0.05 (horizontal line crossing y-axis), and |FC| > 5 (vertical lines crossing x-axis). Some highest up and downregulated genes are labeled. (g–i) Top non-redundant Gene Ontology (GO) terms enriched by significant DEGs in each respective comparison. (j) Select panel of cartilage-related markers. Genes are chosen from previous knowledge and relevant GO terms (i.e. extracellular matrix). DEGs were determined using ANOVA for oxygen tension, TGF-β3, and donor (random) variables. All cells with values on the color spectrum are statistically significant (q < 0.05) and gray cells without values are non-significant.
The combined treatments of hypoxia and TGF-β3 withdrawal under static culture induced a strong anti-hypertrophic phenotype of hBM-MSC, as evident in the panel of select genes (Figure 1(j)) related to cartilage development. Namely, hypertrophy markers COL10A1 (downregulated 6.5-fold) and MMP13 (not significant) were suppressed or not regulated in the combined treatment. TGF-β3 withdrawal also upregulated FRZB, an antagonist of Wnt signaling 47 and an inhibitor for hypertrophy, by 17-fold as well as upregulating MGP, an inhibitor to bone formation, 48 by 9.8-fold. Other factors that function toward osteoblast differentiation,49,50 such as DMP1 (downregulated 18-fold), FN1 (downregulated 11-fold), and GPM6B (not significant), were suppressed or not regulated in the combined treatment. Further, THBS2, a ligand for the CD36 receptor, 51 which is implicated in the development of osteoarthritis,52,53 was downregulated 5.3-fold. The ratio of TNFRSF11B (or OPG) to TNFSF11 (or RANKL), an inhibitor and promoter of osteoclast activation, 54 respectively, was also highly positive in the combined treatment suggesting a strong response away from osteoclast differentiation. Interestingly, the TGF-β3 gene (TGFB3) was not significantly regulated, but the receptor gene TGFBR3 was upregulated 12-fold in the combined treatment. Further, TGFB1 and TGFBR1 were both downregulated (2.35- and 1.51-fold, respectively), while TFGB2 and TGFBR2 were both upregulated (5.16- and 1.62-fold, respectively) (data not shown). Finally, various markers related to ECM reorganization, such as EPYC, MMP15, ADAMTS2, MXRA5, SPARCL1, and TNFAIP6, were modulated to varying degrees.
The suppression of hypertrophy from combined hypoxia and TGF-β3 withdrawal is confirmed by the RT-qPCR results, where a clear suppression of COL10A1 is seen (Figure 2(d)). Further, hypoxia and TGF-β3 withdrawal appear to upregulate chondrogenic markers ACAN, COL2A1 (Figure 2(a) and (c)), and COL2A1 to COL1A2 ratio (Supplemental Figure S3 A, B). These findings are confirmed by the histological (Figure 2(h)) and biochemical analyses (Supplemental Figures S4 and S5 A, B), where staining for type II collagen and type X collagen appears to be upregulated and downregulated, respectively, while the measured GAG/DNA ratio is higher in the TGF-β3 withdrawal groups. However, donor-to-donor variability is high, and staining quantification results did not show any statistical significance between groups (Figure 2(i)–(k)). However, it appears that combined HYP –T3 showed increased collagen type II and reduced collagen type X for every donor (Supplemental Figure S5 C, D). Safranin-O staining (Figure 2(h)) for sulfated glycosaminoglycans (sGAG) also showed highly positive staining at baseline and post-experiment for all samples. It should be noted that the lightly stained safranin-O sections are likely due to the differential dehydration of the hydrogel tissues in the preprocessing procedure prior to staining and not from experimental variables. Finally, the combined treatments did not promote the development of mechanical properties, as both peak and equilibrium moduli are not significantly different across the groups (Supplemental Figure S4).

Experiment I: tissue level and RT-qPCR confirms that hypoxia (3% O2) and TGF-β3 withdrawal under static culture promoted a non-hypertrophic phenotype of hBM-MSC. (a–g) Regulation of selected gene markers as measured by RT-qPCR. Fold changes are reported as expression values normalized to the [NRX +T3] group. (h) Histological and immunofluorescence staining analysis. Differences in Safranin-O staining for M23 and M42 hypoxia samples may be a result of the differential dehydration of the hydrogels in tissue preprocessing prior to paraffin-embedding. Scale bar represents 300 µm. Corner images showing complete sections are not to scale. (i–k) Quantification of immunofluorescence images for Collagen Type I, Type II and Type X respectively. Fold changes are reported as quantified values normalized to the [NRX +T3] group and quantification was conducted with a Python script. Statistics was performed using a one-way ANOVA (with the Geisser-Greenhouse correction and Tukey’s multiple comparison test). Significance levels are represented as *p < 0.05, **p < 0.01, and ***p < 0.001. Groups are plotted as box and whisker plots showing min to max of all points and “+” represent the mean value.
Experiment II: Mechanical stimulation and TGF-β3 withdrawal under hypoxia promoted a strong chondrogenic and non-hypertrophic phenotype of hBM-MSC
After confirming that combined hypoxia and TGF-β3 withdrawal induced a strong anti-hypertrophic phenotype of hBM-MSC, we assessed two modalities of mechanical loading (dynamic compression, DC and cyclic hydrostatic pressure, CHP) with TGF-β3 withdrawal against static culture, all under hypoxia. Unbiased principal component analysis (PCA) of the RNA-sequencing data indicated a clear separation for the mechanical loading and TGF-β3 variables across PC1 and PC2, respectively, while the donor variable did not show good separation (Figure 3(a)). DC and CHP were clustered together but highly separated from the static controls suggesting that the two modalities of loading induced similar effects. The first three PCs together explained 60.8% of the variance in Experiment II. Further, the heatmap of significant differentially expressed genes (DEGs) for the [DC –T3] vs [Static +T3] and [CHP –T3] vs [Static +T3] comparisons similarly show a strong separation in the clustering of samples for the mechanical loading and TGF-β3 variables (Figure 3(b)). Here, DC and CHP also clustered together but away from the static controls. However, one sample (donor M58, Static+T3) seemed to separate/cluster differently compared to the other samples in the group. Nonetheless, both experimental variables modulated a large number of DEGs, as indicated in Table 1. The Venn diagram (Figure 3(c)) also showed that DC with TGF-β3 withdrawal and CHP with TGF-β3 withdrawal modulated a similar panel of genes based on the large proportion that overlaps. This is supported by the volcano plots (Figure 3(f) and (g)), which show similar labeled genes that are most up and downregulated in each treatment. Further, the top highest up and downregulated genes (Supplemental Figure S6) unique to each treatment (i.e. from the 36 and 34 genes of the Venn diagram) showed that the majority of genes were regulated in the same direction and by similar magnitudes by DC and CHP treatments. Further, the top non-redundant Gene Ontology (GO) terms enriched by significant DEGs suggest that both loading modalities with TGF-β3 withdrawal modulated genes that function related to cartilage development and ECM organization (Figure 3(d) and (e)).

Experiment II: RNA-sequencing results suggest that mechanical stimulation and TGF-β3 withdrawal under hypoxic (3% O2) culture promoted a strong chondrogenic and non-hypertrophic phenotype of hBM-MSC. (a) Unbiased principal component analysis (PCA) plotting PC1-PC2 and PC1-PC3 for mechanical loading, TGF-β3, and donor variables. (b) Heatmap of significant differentially expressed genes (DEGs) for the [DC –T3] vs [Static +T3] and [CHP –T3] vs [Static +T3] comparison with total counts >150, q < 0.05, and |FC| >2 (1071 genes total). Genes (rows) and samples (columns) are clustered using the Euclidean method. (c) Venn diagram showing the overlap of significant DEGs between different comparisons. The unique genes in the [DC –T3] vs [Static +T3] comparison (36 genes) and the [CHP –T3] vs [Static +T3] comparison (34 genes) are shown in Supplemental Figure S6. (d and e) Top non-redundant Gene Ontology (GO) terms enriched by significant DEGs in each respective comparison. (f and g) Volcano plots showing significant DEGs in each respective comparison with total counts >150, q < 0.05 (horizontal line crossing y-axis), and |FC| >5 (vertical lines crossing x-axis). Some highest up and downregulated genes are labeled. (h) Select panel of cartilage-related markers. Genes are chosen from previous knowledge and relevant GO terms (i.e. extracellular matrix). DEGs were determined using ANOVA for mechanical stimulation, TGF-β3, and donor (random) variables. All cells with values on the color spectrum are statistically significant (q < 0.05) and gray cells without values are non-significant.
The combined treatments of mechanical loading (both DC and CHP) with TGF-β3 withdrawal induced a strong chondrogenic and non-hypertrophic phenotype of hBM-MSC as evident in the panel of select genes (Figure 3(h)) related to cartilage development. Namely, chondrogenic markers ACAN, CNMD, COL2A1, COL9A1/2/3, COL11A1/2, COL14A1, HAPLN1, MATN3, MATN4, and SOX9 were all highly upregulated by mechanical loading with TGF-β3 withdrawal. Further, chondrocyte regulators ASPN, CHADL, SNORC, 55 and TNC, 56 which are involved in chondrocyte development and maturation, were also highly upregulated. Hypertrophic marker COL10A1 was not significantly modulated, and NOG, an inhibitor to chondrocyte differentiation,57,58 was downregulated 7.5-fold from both mechanical loading combined treatments. Moreover, FRZB, an antagonist of Wnt signaling 47 and an inhibitor for hypertrophy, was highly upregulated (23-fold in DC –T3 and 49-fold in CHP –T3), while LGR6, a marker activated by Wnt signaling, 59 was highly downregulated (64-fold in DC –T3 and 104-fold in CHP –T3). SMOC1, an osteoblast regulator, 60 and RARB, a factor required for skeletal growth, 61 were also both highly downregulated. Additionally, MGP, an inhibitor for bone formation, 48 was upregulated (4.6-fold in DC –T3 and 7.5-fold in CHP –T3), while GDF10, a factor that plays an inhibitory role in osteoblast differentiation, 62 was the most upregulated gene (724-fold in DC –T3 and 446-fold in CHP –T3) from both mechanical loading combined treatments. Finally, various markers related to ECM reorganization, such as EPYC, LAMA4, MMP1, MMP7, NID2, and POSTN, were modulated to varying degrees.
The induction of a chondrogenic and non-hypertrophic phenotype from combined mechanical loading and TGF-β3 withdrawal is confirmed by the RT-qPCR results (Figure 4(a)–(h)). Expression levels of ACAN, COL2A1, SOX9, and COL2A1 to COL1A2 ratio (Supplemental Figure S3 C, D) were all higher, while COL10A1 levels were lower in the TGF-β3 withdrawal groups. These findings are confirmed by the histological (Figure 4(i)) and biochemical analyses (Figure 4(a)–(d)), where staining for type II collagen and type X collagen appears to be upregulated and downregulated, respectively, while the measured GAG/DNA ratio is higher in the TGF-β3 withdrawal groups. Once again, donor-to-donor variability is high, and staining quantification results did not show any statistical significance between groups (Figure 4(j)–(l)). However, it appears that combined DC –T3 or CHP –T3 showed increased collagen type II and reduced collagen type X for most of the donors (Supplemental Figure S5 G, H). Safranin-O staining (Figure 4(i)) for sGAG also showed highly positive staining at baseline and post-experiment for all samples. It should be noted that the lightly stained safranin-O sections are likely due to the differential dehydration of the hydrogel tissues in the preprocessing procedure prior to staining and not from experimental variables. Finally, DC treatments produced tissues with significantly higher peak (Figure 5(e), Supplemental Figure S5 I) and equilibrium moduli (Figure 5(f)), while CHP resulted in marginally higher values. However, the magnitude of these values is still lacking when compared to native articular cartilage mechanical properties.

Experiment II: tissue level and RT-qPCR confirms that mechanical stimulation and TGF-β3 withdrawal under hypoxic (3% O2) culture promoted a strong chondrogenic and non-hypertrophic phenotype of hBM-MSC. (a–h) Regulation of selected gene markers as measured by RT-qPCR. Fold changes are reported as expression values normalized to the [Static +T3] group. (i) Histological and immunofluorescence staining analysis. Differences in Safranin-O staining for M23, M42, and M58 samples may be a result of the differential dehydration of the hydrogels in tissue preprocessing prior to paraffin-embedding. Images for the 3-week baseline, Static –T3, and Static +T3 groups for donors M23, M42, and M58 are identical to the 3-week baseline, HYP –T3, and HYP +T3 group images used in Figure 4(h) as those same samples were used for analysis in both experiments. Scale bar represents 300 µm. Corner images showing complete sections are not to scale. (j–l) Quantification of immunofluorescence images for Collagen Type I, Type II and Type X respectively. Fold changes are reported as quantified values normalized to the [Static +T3] group and quantification was conducted with a Python script. Statistics was performed using a one-way ANOVA (with the Geisser-Greenhouse correction and Tukey’s multiple comparison test). Significance levels are represented as *p < 0.05, **p < 0.01, ***p < 0.001, and ****p < 0.0001. Groups are plotted as box and whisker plots showing min to max of all points and “
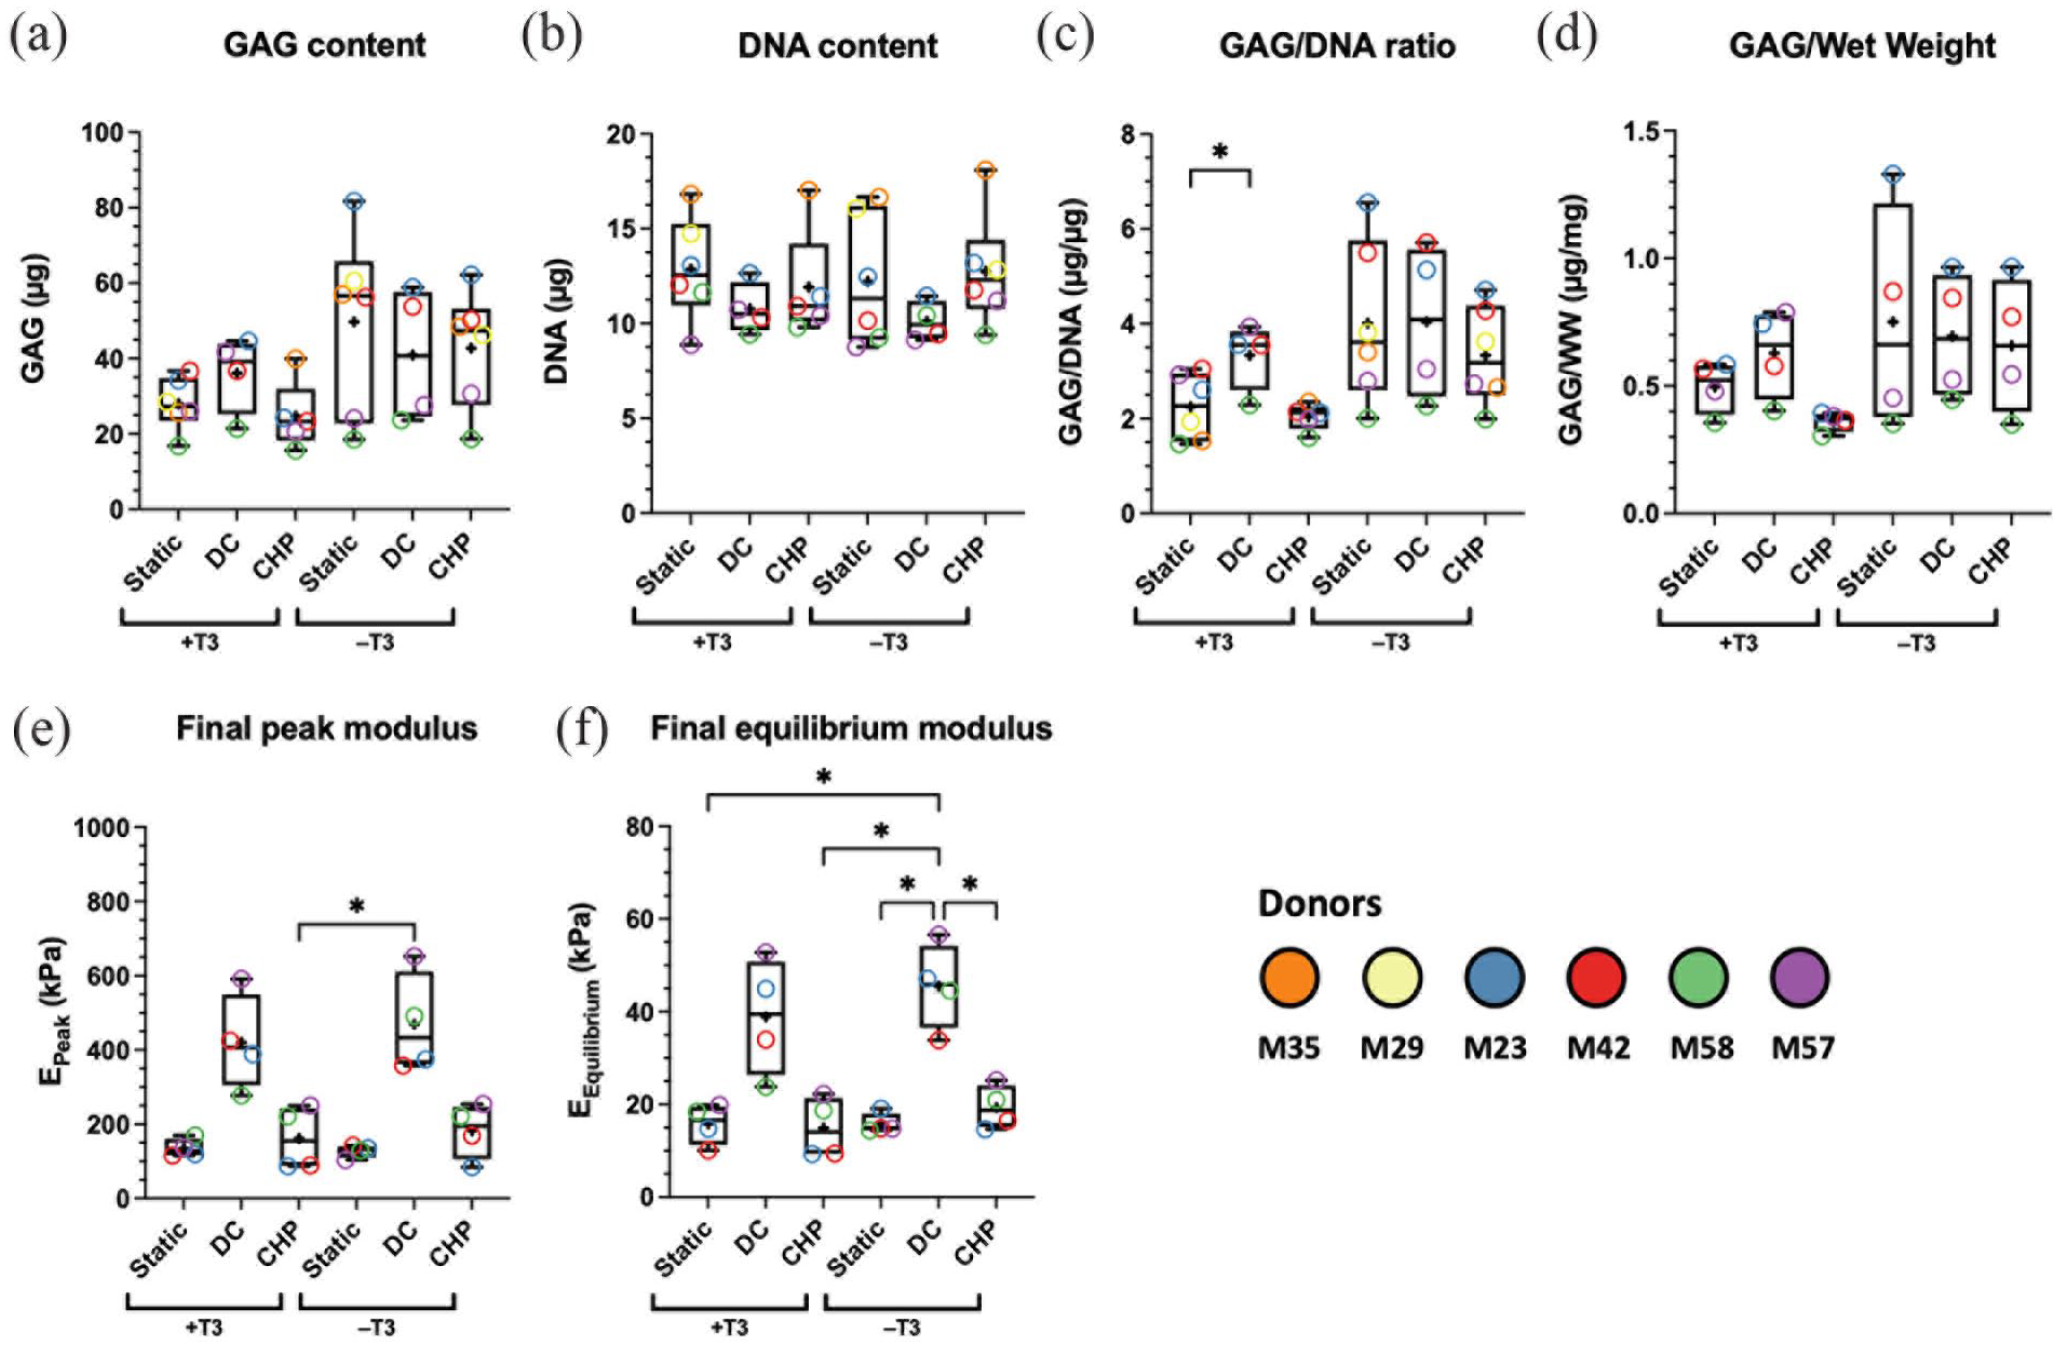
Experiment II: samples showed increased mechanical properties after dynamic compression (DC) loading. (a) Measured glycosaminoglycan (GAG) content. (b) Measured DNA content. (c) Measured GAG to DNA ratio. (d) Measured GAG to wet weight ratio. (e) Measured final peak modulus. (f) Measured final equilibrium modulus. Statistics was performed using a one-way ANOVA (with the Geisser-Greenhouse correction and Tukey’s multiple comparison test). Significance levels are represented as *p < 0.05 and **p < 0.01. Groups are plotted as box and whisker plots showing min to max of all points, and “
Combined mechanical loading (DC or CHP) with TGF-β3 withdrawal regulated genes that were present in key KEGG pathways. In particular, TGF-Beta Signaling Pathway (Figure 6(b) and (c)), Focal Adhesion (Figure 6(d) and (e)), and PI3K-AKT Signaling Pathway (Figure 6(f) and (g)) were among the most enriched pathways (Figure 6(a)). In the TGF-Beta Signaling Pathway, many Smad factors were regulated along with the cell-receptor inhibitor BAMBI. In Focal Adhesion, many ECM factors and growth factor genes were regulated as well as factors contributing to ECM organization. In the PI3K-AKT Signaling Pathway, many cell surface receptors such as GPCRs, ITGAs, CytokineR, TLRs, and RTKs were significantly regulated.

Experiment II: RNA-sequencing results show key pathways that are modulated by mechanical stimulation and TGF-β3 withdrawal under hypoxic (3% O2) culture. (a) Top KEGG pathways enriched by differentially expressed genes (DEGs) for the [DC –T3] vs [Static +T3] and [CHP –T3] vs [Static +T3] comparison. (b) Significant DEGs modulated in the TGF-Beta Signaling Pathway. (c) Simplified schematic of key genes/factors that are modulated in the TGF-Beta Signaling Pathway. (d) Significant DEGs modulated in the Focal Adhesion pathway. (e) Simplified schematic of key genes/factors that are modulated in the Focal Adhesion pathway. (f) Significant DEGs modulated in the PI3K-AKT Signaling Pathway. (g) Simplified schematic of key genes/factors that are modulated in the PI3K-AKT Signaling Pathway. DEGs were determined using ANOVA for mechanical stimulation, TGF-β3, and donor (random) variables. All cells with values on the color spectrum are statistically significant (q < 0.05) and gray cells without values are non-significant. Green icons in simplified pathway schematics are statistically significant and gray icons are not significant. Solid arrows represent direct relationship and dashed arrows indicate there are additional factors not shown.
Discussion
This study introduced a novel protocol to differentiate human bone marrow-derived mesenchymal stem cells (hBM-MSC) into stable, cartilage-forming cells. We hypothesized that the combination of mechanical loading from dynamic compression (DC) and cyclic hydrostatic pressure (CHP) with hypoxia culture and TGF-β3 growth factor withdrawal would promote non-hypertrophic chondrogenesis of hBM-MSC embedded in an HA-hydrogel. As an attractive cell source for regenerative medicine, hBM-MSC are characterized by their accessibility, expansion capacity, and high pluripotency. Considerable efforts have been directed at inducing the stable chondrogenic differentiation of hBM-MSC. Given the complex nature of cartilage tissue formation, this process requires stimulation from both biochemical and biomechanical cues. In addition, the spatial and temporal profiles of applied cues also play a critical role in the outcome of engineered tissues. Global transcriptome and tissue level assessments from this study showed that the withdrawal of TGF-β3 after initial supplementation, in combination with mechanical loading and hypoxia, induced a cartilage-like phenotype in hBM-MSC seeded tissue constructs while suppressing hypertrophic differentiation.
Transforming growth factor-beta (TGF-β) is a polypeptide growth factor superfamily composed of three isoforms (TGF-β1, −β2, and −β3). 63 TGF-β is essential in nearly every aspect of cartilage formation and development, and it is the most used growth factor in chondrogenic medium.64–67 Among the three isoforms, TGF-β3 is well demonstrated as a necessary mediator for the chondrogenic differentiation of MSC and promotes the deposition of cartilage-like ECM components such as GAG and collagens.14,68,69 Even though the molecular mechanism of TGF-β3 in chondrogenesis is not fully understood, it is proposed that the chondrogenesis driving effect of TGF-β3 is due to the involvement of master chondrogenic transcription factor SOX9. 70 Upon the activation of the TGF-β receptor, intracellular molecules from the Smad family (Smad 2, Smad 3, and Smad 4) are phosphorylated and migrate to the nucleus as a heteromeric complex. The expression of target genes is then regulated by the complex through the Smad-binding elements. 70 The involvement of Smad molecules in the TGF-β3 signaling pathway is confirmed in this study as several Smad molecules were significantly regulated by the combined treatment of mechanical loading with TGF-β3 withdrawal (Figure 6(b)). Moreover, the expression level of SOX9 also showed a significant difference between the withdrawal and continuous TGF-β3 supplemented groups (Figures 3(h) and 4(g)).
It has been demonstrated that without the supplementation of TGF-β3, the chondrogenesis of MSC seeding on a type I collagen could not be initiated, and cartilaginous ECM components failed to accumulate. 14 However, chondrogenesis induced in MSC by TGF-β3 is also accompanied by an early onset of hypertrophic differentiation, which is undesired for cartilage tissue engineering.13,71 Several factors may explain why TGF-β3 withdrawal in this study induced the stable, non-hypertrophic chondrogenesis of hBM-MSC. Firstly, the development of cartilage tissue in vivo has been shown to be based on the time-dependent formation of several different components. The formation of collagen fibers is observed first during pre-and neonatal developmental stages, while GAG deposition occurs at a later phase.72,73 This sequential formation of cartilage components has been validated in an in vitro MSC pellet model using TGF-β, 74 where the rapid accumulation of GAG occurs after the production of other chondrogenic markers. 74 TGF-β is proposed to regulate the synthesis of GAG 74 and proliferation of MSC in a concentration-dependent manner, 75 and the early or excessive deposition of GAG is believed to have an inhibitive effect on the formation of collagen fibers. 76 Thus, the optimal level of TGF-β for chondrogenesis is proposed to be a relatively low level to allow the development of collagen fibers and follow the temporal profile of normal cartilage development. 75 In our study, TGF-β3 withdrawal may have kept the growth factor concentration at an optimally low level after initial matrix deposition during pre-culture to allow for the formation of cartilage components in sequential order. However, time-course measurements of these markers at the transcriptome and protein level are needed to confirm this. Another possible mechanism is the positive-feedback activation of the endogenously produced latent TGF-β with TGF-β3 acting as an initiator. 77 This allows for the accumulation of growth factors over time, and the deposition of GAG can gradually take a dominant role over collagen formation. On the other hand, with the continuous supplementation of TGF-β3, the gradual increase of growth factors over time is replaced by a constant high level, which may lead to an early deposition of GAG that prevents the formation of standard collagen fibers. In addition to biochemical cues, biomechanical cues are also critical for optimizing cartilage tissue engineering. Although the activation mechanism of latent TGF-β is still not clear, it is proposed that through the upregulation of proteolytic moieties such as plasmin and stromelysin-1 production, mechanical stimulation might further stimulate the activation of latent TGF-β. 78
There were several limitations in this study. Firstly, other morphological features that may be characteristic of hypertrophic chondrocytes, such as increased cell size or changes in cell shape, were not considered. However, we feel that our whole-tissue assessment is sufficient, particularly from the presence/absence of collagen type X, which is a more definitive approach for assessing hypertrophic chondrocytes. Further, trends from the immunofluorescence data were not supported statistically by the semi-quantification of the staining, and we attribute this mainly to the limitation of the staining quantification methodology. The staining quantification was only meant as supplemental to the histological data, and the results from the staining quantification depended on the particular tissue sections used. We also observed differential dehydration of the hydrogel constructs in tissue preprocessing prior to paraffin embedding such that some constructs contracted more than others. However, the GAG content and GAG/DNA ratio for these donors (M23 and M42) do not show significant decreases as compared to the other donors within the same treatment group. Finally, due to the high donor-to-donor variability within our donor cohort, many assessments failed to yield statistically significant results despite every or almost every donor showing a similar trend in the combined treatment groups as compared to controls. As we used a paired one-way ANOVA for the majority of our assessments, the high donor-to-donor variability will substantially reduce the statistical power. Overall, definitive conclusions were not based on the histological data alone, but rather, they are based on an overall assessment of all the data, including gene expression, histological, and biochemical analyses.
In summary, our data suggest that our proposed protocol using hypoxia, mechanical loading, and TGF-β3 withdrawal allows for the stable differentiation of hBM-MSC to chondrocytes through the upregulation of many cartilage-related markers while suppressing hypertrophic markers. Future experiments will include in vivo implantation of engineered cartilage using this protocol to evaluate in vivo phenotype stability.
Experimental section/methods
The experimental overview is described in Supplemental Figure S7. Most culture methods and assays were performed identically to previously published studies.28,32,33,79–81
Ethics statement and tissue procurement
Experimental methods and tissue procurement were conducted with approval from the University of Alberta’s Health Research Ethics Board-Biomedical Panel (Study ID: Pro00018778). Human bone marrow-derived mesenchymal stem cells (hBM-MSC) were isolated from bone marrow aspirates obtained from non-osteoarthritic male patients (n = 6 donors, 23–58 years old) undergoing routine orthopedic procedures. Donor details are summarized in Supplemental Table S2.
Cell and tissue pre-culture in hyaluronan-based hydrogel
Cell isolation and expansion were performed as described in previously published studies.28,79 Briefly, hBM-MSC were expanded in alpha minimum essential medium (α-MEM) supplemented with 10% v/v heat-inactivated fetal bovine serum (FBS), 100 mM 4-(2-hydroxyethyl)-1-piperazineethanesulfonic acid (HEPES), 1 mM sodium pyruvate (Sigma-Aldrich Co., MO, USA), 100 U/mL penicillin, 100 μg/mL streptomycin, 0.29 mg/mL glutamine (PSG; Life Technologies, ON, Canada), and 5 ng/mL of fibroblast growth factor (FGF-2; Neuromics, MN, USA, #PR80001) under hypoxic (HYP) humidified conditions (3% O2, 5% CO2). They were stored in liquid nitrogen after passage 1 and then further expanded to passage 2 under HYP.
HyStem®-C (Advanced BioMatrix, CA, USA, #GS1005) is a cell-compatible, hyaluronan-based hydrogel crosslinked using thiol-reactive poly(ethylene glycol) diacrylate (PEGDA) and thiol-modified denatured porcine collagen. Hydrogels were prepared according to the manufacturer’s protocols, and no measurable glycosaminoglycan (GAG) or DNA contents were seen in the hydrogels (data not shown). Expanded hBM-MSC were mixed into the hydrogel and cast into standard 96-well flat-bottom low attachement plates at a density of 5 × 10⁶ cells/cm3 to form cylindrical tissue constructs (diameter = 6 mm, height = 2.5 mm). Cell-seeded hydrogels were pre-cultured in an X3 incubator system (Biospherix, USA) for 3 weeks under HYP for baseline matrix formation using a defined serum-free chondrogenic growth medium (HG-DMEM supplemented with HEPES, PSG, ITS +1 premix (Corning, Discovery Labware, Inc, MA, USA), 125 μg/mL human serum albumin, 100 nM dexamethasone, 365 μg/mL ascorbic acid 2-phosphate, 40 μg/mL L-proline) and supplemented with 10 ng/mL of TGF-β3 growth factor (Proteintech Group, USA, #HZ-1090). A trial group (1 technical replicate) had TGF-β3 removal during this 3-week pre-culture. However, preliminary live/dead assay results suggest that cells require the growth factor during pre-culture to preserve viability (Supplemental Figure S8). Thus, all tissues had TGF-β3 supplemented during pre-culture.
Live/dead assay
After 3 weeks of pre-culture, the cell viability of hBM-MSC with and without the supplement of TGF-β3 in Hystem-C hydrogel was assessed by Syto 13/Propidium iodide (PI) staining. Syto 13 (S7575, Thermo Fisher Scientific, Canada) stains the live-cell in green fluorescent, and PI (P3566, Thermo Fisher Scientific, Canada) stains the dead-cell in red fluorescent. Each construct was incubated in 1 mL PBS solution with 6.25 µM Syto 13 and 15 µM PI at room temperature for 30 min. The cell viability was visualized using Nikon confocal laser scanning microscope (Leica TCS SP5). Fluorescence was quantified using a Python script.
Experiment I variables: Oxygen tension and TGF-β3 withdrawal
Baseline tissues (from n = 3 donors) were randomly assigned to the TGF-β3 withdrawal (–T3), or the TGF-β3 continued (+T3) group, where the growth factor was either removed or supplemented in the chondrogenic growth medium, respectively. Tissues in each group were further randomly assigned to the hypoxia (HYP, 3% O2) or normoxia (NRX, 20% O2) group resulting in four experimental groups: HYP –T3, HYP +T3, NRX –T3, NRX +T3. Tissues under each experimental group condition were cultured statically in non-attachment Petri-dishes with approximately 7.5 mL of medium per tissue construct (to equate the required volume of media for Experiment II bioreactors), and media was changed once per week. Tissues were cultured for 3 weeks before harvest, and gene expression samples (2–3 technical replicates) were stored in TRIzol reagent (ThermoFisher Scientific, USA, reference #15596018) at −80°C for later analysis.
Experiment II variables: Mechanical stimulation and TGF-β3 withdrawal
Experiment II was conducted under only HYP and simultaneously with Experiment I. Baseline tissues (from n = 4–6 donors) were randomly assigned into the TGF-β3 withdrawal (–T3) or the TGF-β3 continued (+T3) group where the growth factor was either removed or supplemented in the chondrogenic growth medium, respectively. Tissues in each group were further randomly assigned into two modalities of mechanical loading (dynamic compression, DC and cyclic hydrostatic pressure, CHP) or static controls, all under HYP, resulting in six experimental groups: DC –T3, DC +T3, CHP –T3, CHP +T3, Static –T3, and Static +T3. Static control samples under HYP from the M23, M42, and M58 donors were used for both Experiments I and II analysis. Tissues in all groups were cultured with approximately 7.5 mL of medium per tissue construct (to equate the required volume of media for DC bioreactors), and media was changed once per week. Tissues were cultured for 3 weeks before harvest, and gene expression samples (2–3 technical replicates) from the mechanical loading groups were stored in TRIzol reagent 6 h after the last loading incident (to account for the time required to dismantle DC bioreactors) and kept at −80°C for later analysis.
Tissues in the DC experimental groups were cultured in commercial bioreactor chambers using a Biodynamic 5210 system (TA Instruments, USA) that permitted automated loading events. DC loading was applied four times a day from 20% to 30% strain at 1 Hz frequency for 10 min per loading incident followed by around 6 h of rest at 0% strain. Tissues in the CHP experimental groups were cultured in commercial bioreactors using a MechanoCulture TR (CellScale, ON, Canada). CHP loading was applied for 2 h, once per day, at 0.9 MPa hydrostatic pressure at 1 Hz frequency. When not loaded, tissues were cultured under static conditions (just like the static control groups) in non-attachment Petri-dishes with previously mentioned media volumes. Detailed loading protocols for DC and CHP are provided in Supplemental Figure S9.
Mechanical property assessment
A dynamic compression (DC) test identical to a single DC loading event was used to assess the mechanical properties of tissues (2–3 technical replicates) with the Biodynamic 5210 system (TA Instruments, USA). The cross-sectional area of the cylindrical tissues was first determined from gross morphology photos. For the test, tissues were placed between two platens and the initial height was determined by bringing the platens in contact with the tissue. The platens then ramped to 20% strain before a sine wave cyclic dynamic loading from 20% to 30% strain at 1 Hz frequency for 10 min. All tested tissues were able to reach equilibrium stress from cyclic loading within the given test period. Force was recorded as a function of time, and stress was calculated by normalizing the force to construct’s cross-sectional area. Peak and equilibrium stress were calculated as the maximum recorded stress and the averaged stress from the relaxation curve, respectively, divided by the cross-sectional area. Peak and equilibrium moduli were then calculated as the respective stresses divided by the 10% dynamic strain increment. Detailed testing protocol is provided in Supplemental Figure S9. All tissues after mechanical testing were frozen at −80°C and used for subsequent biochemical assays, and the potential loss of GAG from compression should be systematically normalized across the study.
Histology, immunofluorescence, and biochemical analysis
The wet weight of tissues (4–5 technical replicates) intended for histology, biochemical, or mechanical property analyses was recorded after tissue harvest. Briefly, histology tissues (2 technical replicates, only one is presented) were fixed in 1 mL of 10% v/v buffered formalin (Fisher Scientific, MA, USA) overnight at 4°C, paraffin-embedded, and sectioned at 8 µm thickness. Sections from approximately the middle region of the tissue were stained with Safranin-O, Fast Green FGF, and Hematoxylin (Sigma-Aldrich, USA, #MHS32-1L) or else labeled with primary antibodies against human types I, II, and X collagens (1:200 dilution of rabbit anti-human type I collagen, Cedarlane, Canada, #CL50111AP-1; 1:200 dilution of mouse anti-human type II collagen, Developmental Studies Hybridoma Bank, USA, #II-II6B3; 1:100 dilution of rabbit anti-human type X collagen, Abcam, UK, #ab58632) for immunofluorescent visualization by secondary antibodies (1:200 dilution of goat anti-rabbit, Abcam, UK, #ab150080; 1:200 dilution of goat anti-mouse, Abcam, UK, #ab150117) and DAPI (Cedarlane, Canada). Quantification of immunofluorescent images was conducted with a Python script.
For glycosaminoglycan (GAG) and DNA qualification, tissues that underwent mechanical property assessment (2–3 technical replicates) were digested first with hyaluronidase (Sigma-Aldrich, USA, #H6254) overnight at 37°C and then further digested with proteinase K (Sigma-Aldrich, USA, #P2308) at 56°C. GAG content was measured with the dimethyl methylene blue (DMMB, Sigma-Aldrich, USA, #341088) assay with a chondroitin sulfate standard (Sigma-Aldrich, USA, #C8529) and DNA content by the CyQUANT Cell Proliferation Assay (ThermoFisher Scientific, USA, #C7026).
RNA extraction, RT-qPCR, and next-generation RNA sequencing
Tissues for gene expression (2–3 technical replicates) were frozen at −80°C in TRIzol reagent (Life Technologies, USA) immediately upon harvest. RNA was isolated and extracted from ground tissue samples using the PuroSPIN Total DNA Purification Kit (Luna Nanotech, Canada) according to the manufacturer’s protocols. RNA was reversely transcribed into cDNA with GoScript reverse transcriptase (Fisher Scientific, USA), and genes of interest were amplified by real-time quantitative polymerase chain reaction (RT-qPCR) using gene-specific primers listed in Supplemental Table S3. Gene expression was normalized to chosen housekeeping genes (B-actin, RPL13A, and YWHAZ) based on the coefficient of variation (CV) and M-value as measures of reference gene stability, 82 and the data was presented using the 2−ΔΔCT method.83,84
Next-generation RNA-sequencing (n = 3 donors: M23, M42, M58) was performed on the Illumina NextSeq 500 platform with paired-end 42 bp × 42 bp reads, and FastQ files were obtained for further bioinformatics analysis. Supplemental Table S1 summarizes quality control metrics for the RNA-sequencing data. Briefly, the RNA Integrity Number (RIN) of all sequenced samples was acceptable, the average pre- and post-alignment read quality had Phred scores above 30, indicating high-quality reads, and the alignment algorithm resulted in an average of at least 98% alignment. The authenticity of the RNA-sequencing data was also validated against select RT-qPCR genes (Supplemental Figure S1), and the degree of correlation was determined with an R2 value of 0.817, showing a strong correlation between the two transcription measurement methods.
Bioinformatics and statistical analysis
Next-generation sequencing data (n = 3 donors: M23, M42, M58) were analyzed with the Partek® Flow® software (Version 10.0.21.0302, Copyright© 2021, Partek Inc, MO, USA). Briefly, raw input reads were first trimmed and then aligned to the reference human genome hg38 using the STAR 2.7.3a aligner. Aligned data were quantified to a transcript model (hg38-RefSeq Transcripts 99–2021–08–02) using the Partek E/M algorithm, and quantified reads were normalized in sequential order using the Add: 1.0, TMM, and Log 2.0 methods. Statistical analysis was performed separately for Experiments I and II using analysis of variance (ANOVA) for oxygen tension, TGF-β3 presence, and mechanical stimulation with donors assigned as a random variable. Significant differentially expressed genes (DEGs) were determined by a combination of minimum total gene counts, adjusted p-values for false discovery rate (FDR) (q-values), and minimum absolute fold change (FC). Gene ontology enrichment, pathway enrichment, and visualization with Venn diagrams, heatmaps, PCA plots, and volcano plots were all conducted in Partek.
Statistical analyses were performed in Prism 9 (GraphPad) and the Partek® Flow® software. The statistical test used and p- or q-values are indicated in the respective figure legends. For most analyses, a one-way ANOVA with the Geisser-Greenhouse correction was used to compare each group with every other group, and a Tukey’s multiple comparison test was used to find the adjusted p-value between each comparison. Statistical significance was determined with a threshold of 0.05.
Supplemental Material
sj-docx-1-tej-10.1177_20417314231172574 – Supplemental material for Non-hypertrophic chondrogenesis of mesenchymal stem cells through mechano-hypoxia programing
Supplemental material, sj-docx-1-tej-10.1177_20417314231172574 for Non-hypertrophic chondrogenesis of mesenchymal stem cells through mechano-hypoxia programing by David Xinzheyang Li, Zhiyao Ma, Alexander RA Szojka, Xiaoyi Lan, Melanie Kunze, Aillette Mulet-Sierra, Lindsey Westover and Adetola B Adesida in Journal of Tissue Engineering
Footnotes
Acknowledgements
We thank Tara Stach and the team at the Biomedical Research Centre from the University of British Columbia for their help with RNA sequencing.
Author contributions
All listed authors meet the Journal of Tissue Engineering criteria for authorship. DL, ZM, AS, and AA designed the study. DL, ZM, AS, XL, and AMS performed tissue culture. DL, ZM, and MK performed RT-qPCR expression analysis. DL, ZM, and AA were responsible for RNA-seq data analysis with Partek Flow software. DL, ZM, and LW were responsible for mechanical testing and analysis. DL and ZM performed the statistical analysis and prepared tables and figures. DL, ZM, and AA wrote the manuscript with input from all co-authors. LW and AA were responsible for acquiring financial support and supervision of the study.
Declaration of Conflicting Interests
The author(s) declared no potential conflicts of interest with respect to the research, authorship, and/or publication of this article.
Funding
The author(s) disclosed receipt of the following financial support for the research, authorship, and/or publication of this article: DL: Natural Sciences and Engineering Research Council (NSERC Undergraduate Student Research Awards). ZM: Natural Sciences and Engineering Research Council (NSERC RQPIN-2018-06290 Adesida). AS: Alexander Graham Bell Scholarship Program (NSERC); Dean’s Doctoral Award (Faculty of Medicine and Dentistry, University of Alberta); Queen Elizabeth II Scholarship program (Alberta government). XL: Natural Sciences and Engineering Research Council (NSERC). MK: Alberta Cancer Foundation-Mickleborough Interfacial Biosciences Research Program (ACF-MIBRP 27128 Adesida). AMS: Canadian Institutes of Health Research (CIHR MOP 125921 Adesida). LW: University of Alberta Pilot Seed Grant Program (UOFAB PSGP); University of Alberta Women and Children’s Health Research Institute Innovation Grant (UOFAB WCHRIIG 3126). AA: Natural Sciences and Engineering Research Council (NSERC RGPIN-2018-06290 MOP 125921 Adesida); NSERC RTI-2019-00310 Adesida; the Canada Foundation for Innovation (CFI 33786); University Hospital of Alberta Foundation (UHF; RES0028185 Adesida); the Edmonton Orthopaedic Research Committee the Cliff Lede Family Charitable Foundation (RES00045921 Adesida); University of Alberta Pilot Seed Grant Program (UOFAB PSGP); University of Alberta Women and Children’s Health Research Institute Innovation Grant (UOFAB WCHRIIG 3126); the Alberta Cancer Foundation-Mickleborough Interfacial Biosciences Research Program (ACF-MIBRP 27128 Adesida); University of Alberta Mid-Career Precision Health Innovator Award.
Data availability
The datasets presented in this study can be found in online repositories. The names of the repository/repositories and accession number(s) can be found below: GEO and GSE214720.
Ethical approval
Experimental methods and tissue procurement were conducted with approval from the University of Alberta’s Health Research Ethics Board-Biomedical Panel (Study ID: Pro00018778).
Supplemental material
Supplemental material for this article is available online.
References
Supplementary Material
Please find the following supplemental material available below.
For Open Access articles published under a Creative Commons License, all supplemental material carries the same license as the article it is associated with.
For non-Open Access articles published, all supplemental material carries a non-exclusive license, and permission requests for re-use of supplemental material or any part of supplemental material shall be sent directly to the copyright owner as specified in the copyright notice associated with the article.