
Abstract
The removal of skin cancer lesions on the nose often results in the loss of nasal cartilage. The cartilage loss is either surgically replaced with autologous cartilage or synthetic grafts. However, these replacement options come with donor-site morbidity and resorption issues. 3-dimensional (3D) bioprinting technology offers the opportunity to engineer anatomical-shaped autologous nasal cartilage grafts. The 3D bioprinted cartilage grafts need to embody a mechanically competent extracellular matrix (ECM) to allow for surgical suturing and resistance to contraction during scar tissue formation. We investigated the effect of culture period on ECM formation and mechanical properties of 3D bioprinted constructs of human nasal chondrocytes (hNC)-laden type I collagen hydrogel in vitro and in vivo. Tissue-engineered nasal cartilage constructs developed from hNC culture in clinically approved collagen type I and type III semi-permeable membrane scaffold served as control. The resulting 3D bioprinted engineered nasal cartilage constructs were comparable or better than the controls both in vitro and in vivo. This study demonstrates that 3D bioprinted constructs of engineered nasal cartilage are feasible options in nasal cartilage reconstructive surgeries.
Introduction
Non-melanoma skin cancers (NMSCs), including basal cell carcinoma (BCC) and squamous cell carcinoma (SCC), are the most frequent malignant skin cancers in the Caucasian population.1,2 Since 1960, it has been reported that there has been a 3% to 8% yearly increase in the incidence of NMSCs worldwide. 1 In the USA, it’s estimated that the incidence of NMSCs is more than 1,000,000 cases per year. 1 Among the NMSCs cases, roughly 36% include the nasal alar lobule, which accounts for the highest regional frequency. 3 Therefore, it is not uncommon for the fibromuscular tissue around the alar lobule and nasal septal cartilage to be removed during tumor resection to establish clear margins. 3 After the tumor resection, nasal reconstructive surgery is usually necessary for restoring structural support and facial esthetic.3–6 In particular, the critical structural support restoration step during nasal reconstruction is currently achieved by inserting an allogeneic, synthetic, or autologous cartilage graft. 3 Despite being clinically used, these materials have shown drawbacks that are yet to be resolved.
Allogeneic grafts are decellularized specimens that have been harvested from live or cadaveric donors. These grafts appear attractive since they are biocompatible and theoretically non-immunogenic. 7 However, the main drawback of allogeneic grafts is their high resorption rates. It was found that allogeneic costal cartilage grafts experienced a resorption rate of 31% 8 compared to 3% in the autologous tissue. 9 Synthetic grafts have also been explored due to their low immunogenicity and lack of donor-site morbidity. Materials that commonly have been used include silicon, porous high-density polyethylene (MedPor), or expanded polytetrafluoroethylene (Gore-tex). 10 The drawbacks of synthetic materials, however, include infection, resorption, dislocation, and extrusion. For instance, the infection rate that has been associated with silicone, MedPor, and Gore-tex grafts are 3.9%, 20%, 5.3% respectively. 10 Autologous grafts are currently the golden standard used in nasal reconstructive surgery due to the absence of immunogenicity. 3 However, due to a lack of septal cartilage, sourcing cartilage from other body parts such as the ear and ribs, is common. Extracting cartilage from other areas presents the issue of donor-site morbidity. Also, some extracted tissues are considered to have inferior handling qualities and present the issue of warping (such as with costal cartilage). 11
More recently, cell-based engineered cartilage grafts have shown the potential to overcome these drawbacks associated with the use of conventional cartilage grafts.3,12 Previous studies have shown that dedifferentiated hNCs are a promising cell source with a redifferentiation capacity to generate hyaline-like cartilages.3,13–17 A large number of autologous hNCs can be generated from a small cartilage biopsy taken from the nasal septum by expanding the cells in the presence of specific growth factors and autologous serum.3,12 Together with appropriate biomaterials, biochemical factors, and mechanical stimuli, it is possible to achieve cellular differentiation and thus, cartilage graft generation that can be subsequently implanted without an immune reaction.3,12 The first human trial implementations of engineered cartilage from hNCs using the clinically approved collagen scaffold, Chondro-Gide, have already been successfully demonstrated. 3 However, despite these early successes, there are still some prominent drawbacks associated with the use of engineered constructs, such as the limited shapes of commercially available scaffolds and the inhomogeneous distribution of hNCs during manual dispersion of hNCs.
Three-dimensional (3D) bioprinting approaches allow a rapid additive fabrication of patient specific, anatomically, or surgical ready shaped engineered functional tissue by cooperate tissue engineering technique.18,19 Through computer aided design (CAD) tools, the 3D bioprinting process enables the precise dispensation of the hydrogels and living cells (known as bioink) from a movable printing head into a biomimetic scaffold with homogeneous cell distribution.20,21 Bioink can be considered one of the most important aspects of the bioprinting process since an ideal bioink should satisfy both cell compatibility for tissue regeneration and printability to support the printing process. In 3D bioprinting of nasal cartilage, bioinks that are successfully used in 3D bioprinting application include natural polymers such as collagen, 22 gelatin, 23 alginate, 24 cellulose,25–28 agarose. 29
To this date, the results from recent research did not provide enough in vivo evidence that customized 3D bioprinted engineered nasal cartilage could achieve similar clinical promises to that of the commercial Chondro-Gide scaffold.16,26,27 In the work of Yi et al., 16 a 3D-printed PCL scaffold using human adipose stem cell-laden cartilage-derived hydrogels, was implanted subcutaneously in a nude mice model. Unfortunately, the in vivo stability of the constructs, including calcification, vascularization, and bone formation, were not studied. Gatenholm’s group utilized cellulose-based hydrogels with hNCs to bioprint neocartilages which were implanted in a mice model.26,27,30 Yet, the quantitative biochemical and biomechanical data, and in vivo stability were not reported in this study.
In our previous study, we successfully generated engineered nasal septal cartilage using type I collagen hydrogel via the freeform reversible embedding of suspended hydrogels (FRESH) bioprinting method, where the in vitro biochemical results highly resembled that of native tissue. 22 To further support its potential for clinical application and formation of patient-specific surgical—ready shapes, the mechanical characterization, and in vivo stability of the engineered nasal cartilage substitutes is needed. Herein, we first demonstrated the ability to 3D bioprint patient-specific lower lateral cartilage from Computed tomography (CT) scans. We then investigated the effects of chondrogenic culture on the biochemical and mechanical properties of bioprinted constructs of hNCs in vitro and in vivo in nude mice. Engineered nasal cartilage from hNCs seeded on clinically approved type I and II collagen membrane scaffolds (Chondro-Gide) served as a control.
Materials and methods
Ethics
Human nasal septal cartilage specimens were collected from surgical discards of patients undergoing nasal reconstructive surgeries with the approval of the University of Alberta’s health research ethics board—biomedical panel (Study ID: Pro00018778). The animal research work was conducted and approved in accordance with the protocol approved by the University of Alberta Animal Care User Committee (Study ID: AUP00001363).
Human nasal chondrocyte isolation
Human nasal septal cartilage specimens were collected from six male donors undergoing septoplasty or rhinoplasty. Donors ranged from 21 to 48 years old with a mean ± standard deviation (SD) of 32.83 ± 10.49 years (refer to Table 1 for donor information). The isolation and expansion of hNCs were performed as previously described. 31 In brief, nasal cartilage specimens were digested with 0.15% (w/v) collagenase II solution (300 units/mg) for 22 h at 37°C in an incubating shaker. hNCs were then harvested and plated at a density of 104 cells/cm2 and cultured in a standard medium: Dulbecco’s Modified Eagle Medium (DMEM) supplemented with 10% (v/v) FBS, 1 ng/ml of transforming growth factor beta 1 (TGF-β1), and 5 ng/ml of fibroblast growth factor 2 (FGF-2) in a normoxic humidified incubator (21% O2, 5% CO2). The media was changed twice per week. The gross morphology of the nasal chondrocytes during the monolayer expansion are shown in Supplemental Figure S1. Passage 2 (P2) cells were used for bioprinting. The population doubling (PD) of hNCs for each donor were calculated by the equation: PD = log2 (populationfinal/populationinitial) for each passage. The cumulative PD (CPD) is the sum of PD at passage 1 and passage 2. The CPD reflects the total number of times primary hNCs from the donors have doubled. The CPD and CPD/day for each donor is provided in Supplemental Table S1.
Donors information.

Nasal chondrocyte-laden bioink preparation
hNCs were trypsinized and resuspended in a defined serum-free chondrogenic media (SFM) composed of DMEM, 100 U/ml penicillin and streptomycin with 2 mM L-glutamine (Life Technologies, all), 100 mM HEPES, insulin-transferrin-selenium (ITS) + 1, 0.1 µM dexamethasone, 0.1 mM ascorbic acid 2-phosphate, and 0.1 mM L-proline at a concentration of 0.875 × 10⁷ cells/ml. The cell suspension was diluted in a 1:10 ratio with type I collagen gel (3.5 wt%, Lifeink 200, Advanced Biomatrix, LOT: 5202-1KIT, USA) to create a final concentration of 8.75 × 10⁶ cells/ml. The resulting cell-laden bioink is a neutralized type I collagen solution that is thermoresponsive and can polymerize at 37°C.
3D bioprinting of type I collagen hydrogels and cell seeding of Chondro-Gide scaffolds
The bioink is then used to fabricate patient-specific lower lateral nasal cartilage shapes, using a micro-extrusion base bioprinter INKREDIBLE+ (CELLINK, Sweden). The sterile gelatin support bath (LifeSupport, Advanced Biomatrix, USA) was prepared according to the manufacturer’s instructions. The filaments and the microstructures of the printed constructs were pre-defined in a 3D bioprinting software (Slic3r, USA). A CT-scanned patient-specific right lower lateral nasal cartilage with 90% infill rate, was first bioprinted inside support bath using type I collagen bioink, to show the printability of autologous cartilage. In order to compare the mechanical and in vivo behaviors of the bioprinted constructs with the cell-seeded clinically approved Chondro-Gide scaffolds, the collagen bioink was the bioprinted into a strip shape with a dimension of 25 mm length × 6 mm width × 2 mm height (same dimensions as Chondro-Gide). These 3D bioprinted cell-laden strip shaped constructs were then cultured in serum-free chondrogenic medium (4 ml per construct and changed twice per week) in normoxia for 3, 6, 9 weeks.
Clinically approved type I/III collagen membrane scaffolds (Chondro-Gide, Geistlich Pharma, Wolhusen, Switzerland) served as the control group. Chondro-Gide scaffolds (25 mm (length) × 6 mm (width) × 2 mm (thickness)) were cut with scalpels from the same lot to control the lot-to-lot variability. 2.625 million hNCs were seeded onto the porous side of the scaffolds (same cell number as bioprinted scaffold) and then cultured in 4 ml of defined serum-free chondrogenic medium with TGF-β3. The schematic experimental setup is shown in Figure 1.

Schematic diagram of experimental design.
Culture condition
In vitro culture condition
Both 3D bioprinted type I collagen hydrogel constructs and Chondro-Gide scaffolds (control group) were cultured in normoxic humidified incubators. Media changes were performed twice a week. To provide sufficient time for the constructs and scaffolds to develop mechanical strength before in vivo culture, three culture periods were first evaluated, including 3, 6, 9 weeks. Only the constructs and scaffolds cultured from one of the selected periods, which showed best mechanical strength and chondrogenic phenotype, were then subjected to further in vivo study.
In vivo culture condition
To study the in vivo behavior of engineered nasal cartilage, the in vitro cultured bioprinted type I collagen hydrogel constructs and Chondro-Gide scaffolds were divided into two experimental groups (n = 3, three donors). Experimental group I involved five additional weeks of in vivo culture after being implanted subcutaneously in nude mice, whereas experimental group II involved five additional weeks of in vitro culture in chondrogenic media to serve as a comparison group.
For experimental group I, the in vitro cultured constructs and scaffold was first cut into smaller sizes to reduce the size of the implants. Then in vitro cultured constructs and scaffolds were implanted into the back of athymic CD-1 nude mice (n = 7, seven mice, 6-week-old, Charles River, Wilmington, USA) as previously described. 13 Each mouse received a pair of in vitro cultured bioprinted construct and Chondro-Gide scaffold, and the engineered cartilage from same experimental group were implanted in different mice. Six nude mice were implanted with the engineered nasal cartilages, with a total of six bioprinted constructs and six Chondro-Gide scaffolds. One additional mouse served as a control and received empty scaffolds (cultured bioprinted construct and Chondro-Gide scaffold without cells). Two small caudal subcutaneous incisions (4–5 mm) were dissected on the skin of each mouse. The constructs and scaffolds were then implanted in the subcutaneous pockets. Incisions were closed with suture and cyanoacrylate tissue adhesive. No post-surgical complications were observed. Five weeks following the implantation, the mice were euthanized by CO2 inhalation, and the constructs and scaffolds were macroscopically dissected from the murine subcutaneous tissues. Gross morphology pictures were taken before and after implantation.
Live/dead assay
Cell viability analysis was conducted using a live/dead viability kit (ThermoFisher, USA). The in vitro cultured constructs and scaffolds from three donors (at day 0, 3 weeks, 6–9 weeks of culture) were incubated in 1 ml of 4 µM calcein AM and 1 ml of 2 µM ethidium homodimer-1 solution at room temperature in the dark for 30 min. They were then examined under a Nikon con-focal laser scanning microscope (Leica TCS SP5, German). The cell viability was quantified using Fuji Image J software.
Evaluation of cartilage formation
Sulfated glycosaminoglycans per DNA quantification
To measure the glycosaminoglycan (GAG) matrix content and the DNA content of the in vitro cultured engineered cartilages, the bioprinted constructs and Chondro-Gide scaffolds were weighed, cut into smaller pieces, and rinsed twice with Phosphate Buffered Saline (PBS), and then frozen at −80 °C. They were then thawed and digested in Proteinase K solution (1 mg/ml) at 56°C overnight for 16 h.
The GAG matrix content of the engineered cartilages was measured by a 1,9-dimethylmethylene blue (DMMB, Sigma Aldrich, Canada) assay with chondroitin sulfate (Sigma Aldrich, Canada) used as the internal standard. 32 The GAG contents were evaluated on the V-max kinetic microplate reader (Molecular Devices, USA) at a wavelength of 530 nm.
The DNA contents were measured using the CyQUANT Cell Proliferation Assay Kit (Thermo Fisher). Calf thymus DNA (Sigma) was used as the standard. Fluorescence emission was measured at 580 nm (excitation 450 nm). The DNA contents were measured on a CytoFluor II fluorescence multi-well plate reader (PerSeptive Biosystems).
The quantity of GAG was then normalized to the total DNA content and wet weight of each engineered cartilage for the six donors.
Histology and immunofluorescence
For both in vitro and in vivo engineered cartilages, the samples were fixed in 10% (v/v) neutral buffered formalin at 4°C overnight, dehydrated through a series of alcohol washes, and then embedded in paraffin wax. The embedded samples were sectioned into 5 µm thick slices and deparaffinized by xylene substitute. The sliced sections were rehydrated through a graded series of ethanol (100%–96%, 70% and 50% (v/v)), and rinsed in distilled water. Then, the prepared samples were evaluated for histology staining including Safranin-O/Fast Green, Masson Trichrome, and Alizarin Red, as well as immunofluorescence stains including type I and II collagen, type × collagen, CD31, Bone Sialoprotein (BSP), and F4/80 (BM8). Imaging was carried out using Nikon Eclipse Ti-S microscope coupled to a DS-U3/Fi2 Color CCD camera using 100x objective lenses.
For Safranin-O/Fast Green assessment, the prepared samples were stained with Meyer’s Hematoxylin, Green FCF, and Safranin-O. For Masson Trichrome assessment (NovaUltra™ Masson Trichrome Stain Kit, USA), the samples were stained with Weigert’s Iron Hematoxylin, Biebrich Scarlet-Acid Fuchsin, phosphomolybdic-phosphotungstic acid, aniline blue, and acetic acid solutions. For Alizarin red assessment, the samples were immersed in 2% (w/v), pH 4.1–4.3 Alizarin red (Sigma-Aldrich, Canada) solution for 2.5 min. After each of the histology staining, the stained slides were rinsed with distilled water and then dehydrated again with ethanol (95% (v/v) and 100%). The slides were mounted with mounting media (Richard-Allan Scientific, Thermo Scientific) to prepare for imaging.
Type I and II collagen protein expressions were examined by immunofluorescence. After antigen retrieval, slides were incubated with rabbit anti-collagen I (CL50111AP-1, Cedarlane, Canada) and mouse anti-type II collagen, both primary antibodies are diluted in 1:200 ratio (II-II6B3, Developmental Studies Hydroma Band, USA) overnight to allow for type I and II collagen bindings, respectively. Secondary antibodies (goat anti-rabbit IgG Alexa Fluor 594, ab150080; goat anti-mouse IgG Alexa Fluor 488, ab150117; Abcam, USA) were incubated with the slides for 45 min, both secondary antibodies are diluted in 1:200 ratio. Sectioned slides were additionally stained with 4′,6-diamidino-2p-phenylindole (DAPI, ThermoFisher, USA) for 20 min at room temperature to observe the nuclei of hNCs within each sample. Sections were mounted with 1:1 Glycerol:PBS to prepare for imaging. The same DAPI staining and mounting methods applies to all immunofluorescence staining preparations.
The protein expression of type × collagen was also examined by immunofluorescence. Slides were incubated overnight with rabbit anti-type × collagen antibodies in 1:100 dilution ratio (rabbit polyclonal to type × collagen, ab58632, Abcam, USA) to bind type × collagen and subsequently labeled by secondary antibody (goat anti-rabbit IgG Alexa Fluor 594, ab150080, Abcam, USA).
Immunofluorescence imaging was also used to assess the vascular invasion protein, CD31. For CD31, the primary antibody used was anti-mouse CD31 (CD31/PECAM Biotinylated Antibody, BAF3628, R&D systems, USA) in 1:100 dilution ratio, then Alexa Fluor 488 conjugated streptavidin in 1:100 dilution ratio (S32354, Life Technology, USA) was used to label the biotinylated primary antibody.
Immunofluorescence was further used to examine the bone associated protein, bone sialoprotein (BSP). The primary antibody was anti-bone sialoprotein, diluted in 1:100 ratio (ab195426, Abcam, USA), and was labeled by secondary antibody, goat anti-rabbit IgG Alexa Fluor 594 (ab150080, Abcam, USA) in 1:200 dilution ratio.
The F4/80 (BM8) molecule, solely expressed on the surface of macrophages, was examined by immunofluorescence. Following antigen retrieval described by Lee et al,. 33 slides were incubated with Biotinylated F4/80 (BM8) primary antibody (13-4801-82, ThermoFisher Scientific, Canada) in 1:100 dilution ratio. Slides were then incubated with streptavidin in 1:100 dilution ratio (S32354, Life Technology, USA), Alexa Fluor 488 conjugate in 1:200 dilution ratio (S32354, Life Technology, USA) prior to imaging.
Real-time RT-qPCR
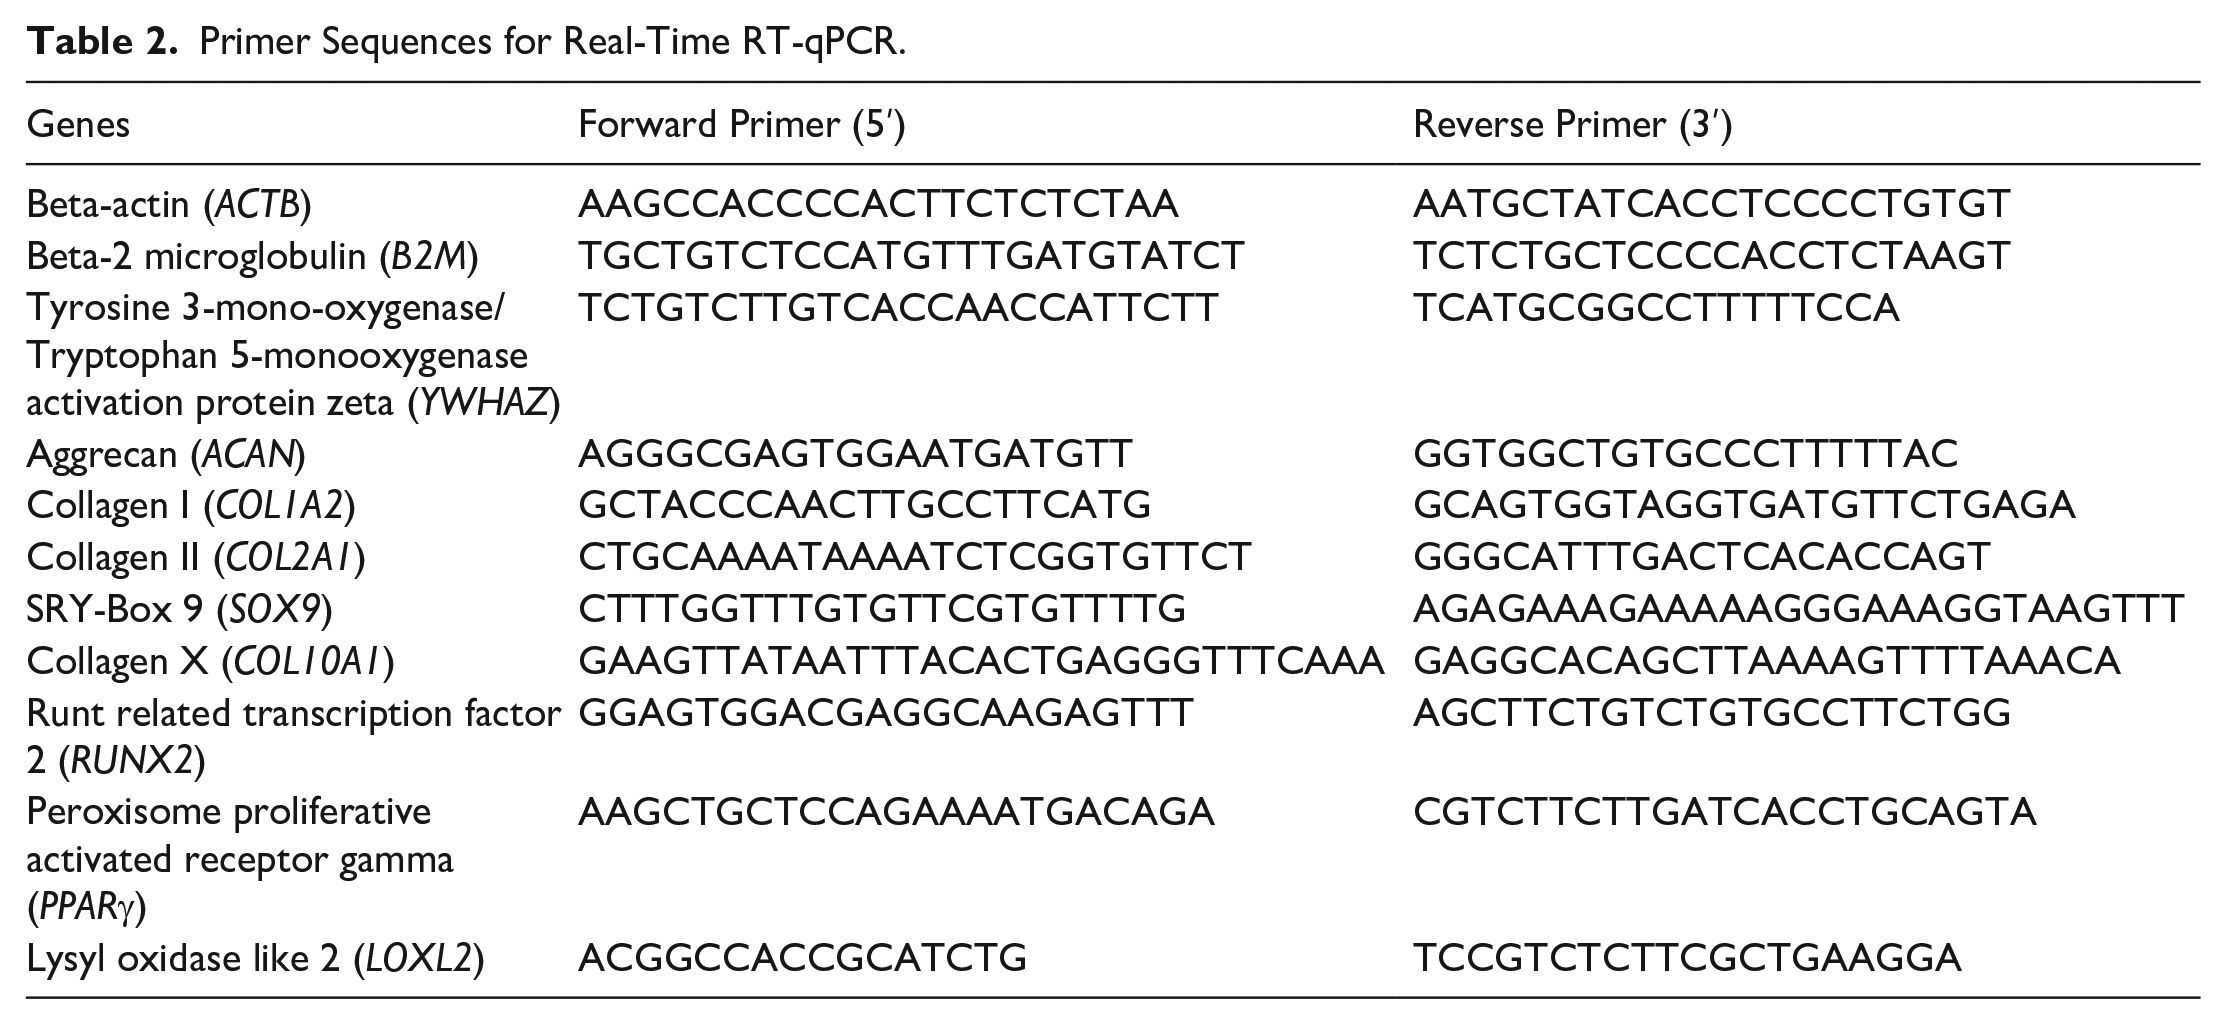
RT-qPCR was used to measure relative gene expression of chondrogenic (e.g. ACAN, COL2A1, SOX9), fibrogenic (e.g. COL1A2), hypertrophic (e.g. COL10A1, RUNX2), and angiogenic markers (e.g. PPARγ), of hNCs after 3, 6, 9 weeks of culture. Expression of the collagen cross linking enzyme (LOX) was also analyzed by RT-qPCR at each of the culture times. Total RNA was extracted with Trizol reagent (Life Technologies) according to the manufacture instructions. RNA was immediately transferred to Trizol upon harvesting to prevent changes in gene expression. The purity and concentration of isolated RNA were examined with Nanodrop One C. One hundred nanogram total RNA was reverse transcribed to cDNA by GoScript reverse transcriptase (Promega Corporation, WI, USA.) with 1 µg of oligo (Dt) primers (Promega Corporation, WI, USA). RT-qPCR was performed as we have previously described
34
(primers sequences are presented in Table 2). The mRNA expression levels for each primer set were normalized to the housekeeping genes, β-actin (ACTB), Beta-2 microglobulin (B2M), and Tyrosine 3-Monooxygenase/Tryptophan 5-Monooxygenase Activation Protein Zeta (YWHAZ), using the
Primer Sequences for Real-Time RT-qPCR.
Mechanical properties of cell seeded Chondro-Gide scaffolds and bioprinted constructs
After 3, 6, 9 weeks of chondrogenic culture, simple interrupted suture tests were performed for both type of engineered cartilages at each time point. Briefly, to test the durability of the cartilages, a single 5-0 PROLENE suture was introduced through each engineered cartilage and a knot was tied. Subsequent knots were then made if the cartilages were strong enough.
Three-point bending results were measured by Dynamic Mechanical Analysis Q800 (TA instrument, USA). Small 5 mm three-point bending clamps were used for the test. Engineered cartilage tissues were placed on top of the 5 mm stationary clamp, and a movable clamp moving 0.1 N/s was used to measure the force responses.
Microstructure of cell seeded Chondro-Gide scaffolds and bioprinted constructs
The ultrastructure of the 3D bioprinted constructs and Chondro-Gide scaffolds at each in vitro culture period (3, 6, 9 weeks) were investigated by scanning electron microscopy (SEM, Hitachi, JA, Model S-4800). All reagents and accessories used were from Electron Microscope Science, PA, USA. Each construct and scaffold were fixed with 2% (v/v) glutaraldehyde and 2.5% (v/v) paraformaldehyde in sodium cacodylate trihydrate buffer at 4°C overnight. Constructs and scaffolds were then cut in half using scalpels and washed with Milli-Q water twice for 2 min each the next day. The constructs and scaffolds were then post fixed in 2% (w/v) osmium tetroxide (OsO4) and 2% (w/v) tannic acid. Post fixing and dehydration steps were as we have previously described. 31 The images of the engineered cartilages were captured using SEM (Zeiss Sigma 300 VP-FESEM).
Semi-quantitative Analysis
Safranin-O staining of in vitro engineering cartilages is evaluated using the Bern score semi-quantitative method, which accounts for uniformity and darkness of the staining, the distance between cell and matrix, as well as cell morphology. In this study, the Bern scores are evaluated by four blinded observers. 35 The immunofluorescence staining of Type I and II collagens is semi-quantified using python. The immunofluorescence intensities are normalized by cell number (DAPI).
Data analysis and statistical methods
For biochemistry, gene expression, and mechanical test analysis, a repeated measures two-way analysis of variance (RM-ANOVA) test was used to assess for interaction between culture time and scaffold type. Culture time and scaffold type were treated as within-subject factors, the donors were treated as repeated measurements. If the interaction was non-significant, the main effects of culture time and scaffold type were reported. If the interaction was significant, the p-value was reported. Bonferroni post hoc tests were performed for the pairwise comparisons to compare within culture time and scaffold type. Cell viability was analyzed by pairwise comparisons between day 1 and 3, 3, 6, 6, 9 weeks. Data are presented as mean ± SD. All analyses were performed using GraphPad Prism 8. A p-value of p < 0.05 was considered statistically significant. A p-value between 0.05 and 0.1 was considered borderline significant.
Results
3D bioprinting of engineered cartilage with autologous shapes
A patient-specific right lower lateral nasal cartilage was bioprinted using the FRESH method to demonstrate the ability of fabricating autologous shaped cartilages. Figure 2(a) shows the STL image generated from CT, and the internal structure of the bioprinted cartilage in Figure 2(b). Figure 2(c) and (d) show the 3D bioprinted nasal cartilage before and after the gelatin support bath melted, respectively. As temperature increased to 37°C, the construct printed in the FRESH support bath started to dissolve and caused the bioprinted collagen bioink to self-assemble and form a hydrogel to maintain its structural integrity.

Gross morphology of the FRESH printed structure. (a) 3D model of a right lower lateral nasal cartilage from CT imaging and (b) the preview of the sliced nasal cartilage using Slic3r software. (c) 3D bioprinted lower lateral nasal cartilage in gelatin support bath before and (d) after 30 min incubation in 37°C. Following the 30-min incubation, the support bath was aspirated, and PBS was added.
Live/dead analysis of bioprinted constructs
A Live/Dead fluorescent assay was used to assess the cell viability of the constructs following 3D bioprinting. The cell viability of constructs cultivated for 1 day, 3, 6, 9 weeks were 85.5 ± 3.9, 93.9 ± 2.3, 93.8 ± 3.1, 87.9 ± 4.9, respectively (Figure 3). Paired t-tests for the interested groups were conducted between day 1 and 3, 3, 6, 6, 9 weeks. There was no significant difference in cell viability between 3 and 6 weeks of culture (p = 0.9765). Between 1 day and 3 weeks (p = 0.0133), and 6–9 weeks (p = 0.0370), a significant increase and decrease in cell viability was observed, respectively.
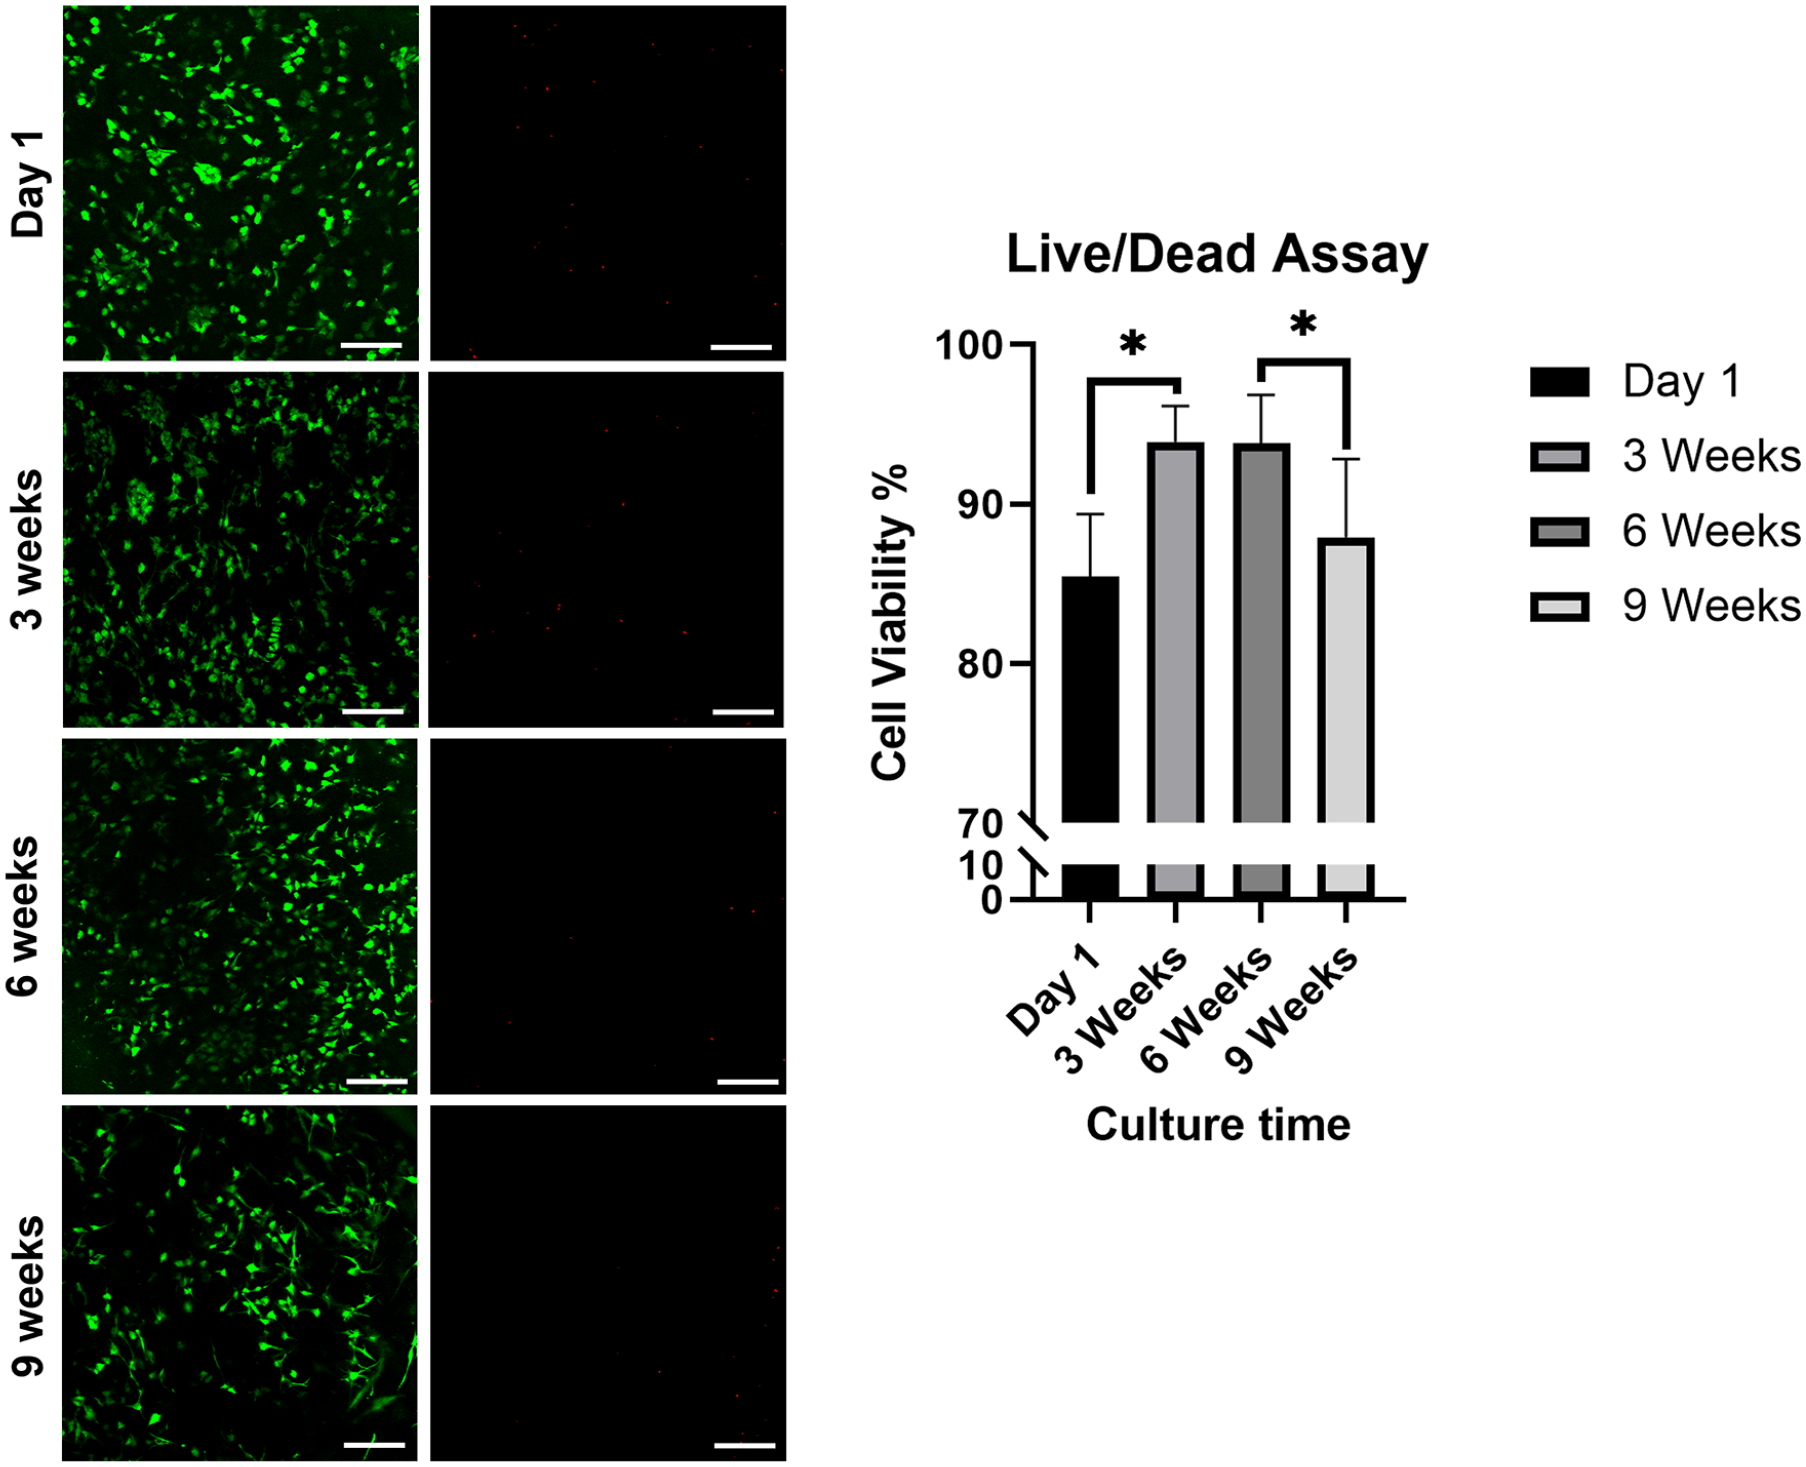
(a) Live/dead assay (b) cell viability over culture time. Paired t-tests were done to compare cell viability between day 1 versus 3, 3 versus 6 weeks, and 6 versus 9 weeks. *Represents 0.01 < p < 0.05. Scale bar: 100 µm.
Histological analysis of in vitro engineered cartilages
After 3, 6, 9 weeks of chondrogenic culture, bioprinted, Chondro-Gide, and non-cellular cartilages, were processed, embedded in paraffin, cut, and then stained with Safranin-O/Fast Green staining and Masson Trichrome staining. Safranin-O was used to stain sulfated proteoglycans while Fast Green served as a counter stain for protein. 36 Weigert’s Hematoxylin, Aniline blue, and Biebrich scarlet-acid fuschin of the Masson Trichrome stain, were used to stain for nuclei, collagen, and cytoplasm/keratin, respectively. 37 Empty scaffolds did not show evidence of matrix synthesis, denoted by the absence of positive Safranin-O staining for proteoglycans. Only background staining for Fast Green was present in empty scaffolds. Chondro-Gide scaffolds were shown to have two different layers following Safranin-O/Fast Green staining, corresponding to the compact and porous layers. The porous layer was the cell seeding side. At 3 weeks of culture, both bioprinted constructs and Chondro-Gide scaffolds showed proteoglycan rich matrix deposition denoted by positive Safranin-O staining (Figure 4(a)). As culture time increased from 3 to 9 weeks, the intensity of Safranin-O staining increased in both engineered cartilages (Figure 4(a), Safranin-O for all donors after 3, 6, 9 weeks culture are shown in Supplemental Figures S2–S4, respectively).

Histological and biochemical analysis of in vitro constructs across culture time. (a) Safranin-O/Fast green Staining, (b) Masson’s Trichrome staining, (c) GAG/DNA of in vitro constructs and (d) Bern Score of Safranin-O staining. Black arrows indicate tissue areas that have (a) positive Safranin-O staining for aggrecan or (b) positive aniline blue for collagen (b). Data were analyzed by two-way ANOVA and corrected with the Bonferroni post hoc test. GAG: glycosaminoglycan; NS: non-significant; WW: wet weight. Scale bar: 100 µm. Star (*) represent the significant difference with regarding of culture time after Bonferroni post hoc correction: * represents 0.01 < p < 0.05, ** represents 0.001 < p<0.01. Pound (#) represent the significant difference with regarding of scaffold type after Bonferroni post hoc correction: # represents 0.01 < p < 0.05.
For the Masson Trichrome staining, the empty bioprinted constructs showed only faint blue staining for collagen. Chondro-Gide empty scaffolds, however, showed both Aniline blue and Scarlet red staining corresponding to collagen and cytoplasm/keratin, respectively. The layers staining red and blue were the compact and cell seeding layers, respectively. Collagen deposition was consistent with Safranin-O staining and appeared at 3 weeks in both engineered cartilages (Figure 4(b)). The enhanced red staining and size of the Chondro-Gide scaffolds at 3 weeks, compared to the empty scaffold, was likely due to swelling of the scaffolds due to proteoglycan deposition. Bioprinted constructs overall, showed a more homogeneous distribution of ECM throughout the structure than Chondro-Gide. Since cells were only seeded on the porous surface of each Chondro-Gide scaffold, matrix deposition was limited to the porous surface. To characterize the collagen distribution, immunofluorescence for type I and II collagen was performed. Type I and II collagens were observed in both bioprinted constructs and Chondro-Gide scaffolds across the three culture times (Figure 5(a) and Supplemental Figure S6a). Type II collagen was predominantly expressed in both engineered cartilages and was more homogeneous in bioprinted constructs. The intensity of type II collagen expression became more pronounced as culture time increased, which was consistent with Safranin-O staining (Supplemental Figure S6b). The distribution of type II collagen expression was also like Safranin-O positive matrix formation in both the bioprinted constructs and Chondro-Gide scaffolds. Additionally, to assess for the presence of a bone forming phenotype, hypertrophic collagen marker, type × collagen, immunofluorescence was performed. Type × collagen was observed in both bioprinted constructs and Chondro-Gide scaffolds across the three culture times (Figure 5(b) and Supplemental Figure S6a). Similarly, to type II collagen, the expression of type × collagen became more pronounced with culture time (Supplemental Figure S6b).

Immunofluorescence of in vitro constructs across culture time. (a) Type I (red) and II (green) collagen and (b) Type × collagen (red). The blue color is from DAPI staining, which indicate cell nuclei. Scale bar: 100 µm.
GAG/DNA quantification of in vitro engineered cartilages
Biochemical analyses were performed in duplicates to quantify the GAG and DNA contents of scaffolds following each culture period (3, 6, 9 weeks, n = 6). The GAG/DNA ratios of Chondro-Gide scaffolds at 3, 6, 9 weeks were 25.2 ± 4.7, 46.0 ± 9.0, 59.2 ± 16.4 respectively. GAG/DNA ratios of bioprinted constructs at 3, 6, and 9 weeks were 39.6 ± 8.9, 59.8 ± 10.8, 71.7 ± 21.7, respectively. Within both bioprinted and Chondro-Gide groups, culture time was shown to have a significant effect on GAG/DNA content (p < 0.0001, Figure 4(c)). A significant difference in GAG/DNA ratios was observed between 3 and 6 weeks (p = 0.0040 for Chondro-Gide, p = 0.0113 for bioprinted), and 3–9 weeks (p = 0.0120 for Chondro-Gide, p = 0.0168 for bioprinted) for both scaffold types. However, there was no significant difference in GAG/DNA ratios between 6 and 9 weeks of culture (p = 0.1863 for Chondro-Gide, p = 0.2718 for bioprinted). There was a borderline significant difference in GAG/DNA content between scaffold types (p = 0.0519), with bioprinted constructs showing higher GAG/DNA ratios than Chondro-Gide scaffolds (significant higher at 3 weeks with p = 0.0269). The Bern score evaluation is well correlated with the GAG/DNA assay (Figure 4(d)).
Mechanical properties of in vitro engineered cartilages
To assess the suturability of bioprinted constructs and Chondro-Gide scaffolds, a suture test was performed. A single 5-0 PROLENE suture was made on the edge of each construct and scaffold and then subsequently observed for damage. Chondro-Gide scaffolds were able to withstand suturing at all time points (Figure 6(a)). Bioprinted constructs, however, were only able to withstand suturing at 9 weeks of culture. To assess the bending modulus of the engineered cartilages, a Three-Point bending test was performed on the constructs and scaffolds at each culture time. Both bioprinted constructs and Chondro-Gide scaffolds became more robust overtime. The bending modulus of Chondro-Gide scaffolds at 3, 6, 9 weeks of culture were 0.0675 ± 0.00995, 0.213 ± 0.0233, 0.287 ± 0.0513 MPa, respectively. For bioprinted constructs, the bending modulus was 0.0309 ± 0.00704, 0.177 ± 0.0557, 0.298 ± 0.0577 MPa at 3, 6, 9 weeks, respectively. Bending modulus was found to increase significantly with increasing culture time for both scaffold types (p < 0.0001, Figure 6(b)). The mean difference between Chondro-Gide and bioprinted bending modulus was 0.0366 MPa at 3 weeks, 0.0360 MPa at 6 weeks, and −0.0114 MPa at 9 weeks. Chondro-Gide scaffolds were almost twice that of bioprinted constructs at 3 weeks, but at 9 weeks, the bioprinted constructs showed a slightly higher bending modulus compared to Chondro-Gide. Due to non-sufficient donor numbers for bending modulus testing (n = 3), no significant differences between scaffold types were observed. Bending modulus was also shown to increase with culture time to a greater degree in bioprinted constructs than Chondro-Gide scaffolds.
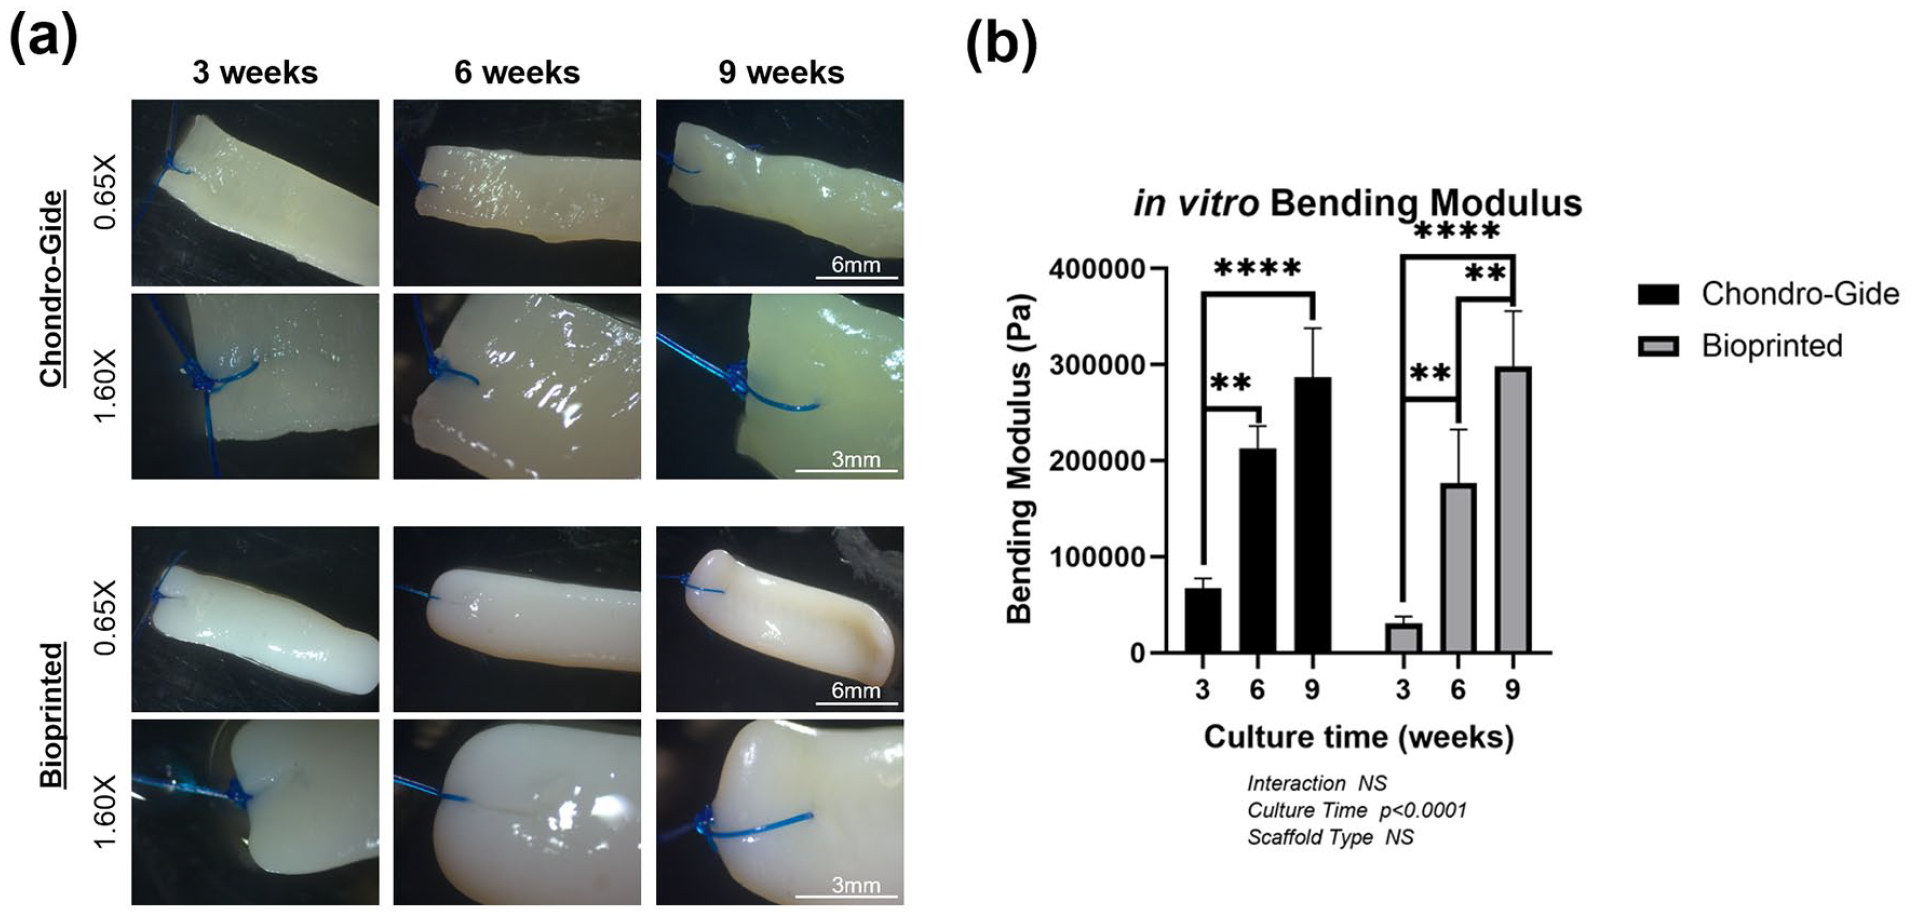
(a) Suturability of Chondro-Gide scaffolds and bioprinted constructs across culture time. Images are taken at 0.65x and 1.60x magnification. (b) Bending modulus of in vitro constructs across culture time. Data was analyzed by two-way ANOVA and corrected with the Bonferroni post hoc test. NS: non-significant. Scale bars: 6–3 mm for 0.65x and 1.60x, respectively. Star (*) represent the significant difference with regarding of culture time after Bonferroni post hoc correction: ** represents 0.001 < p<0.01, *** represents 0.0001 < p <0.001, **** represents p < 0.00001. Pound (#) represent the significant difference with regarding of scaffold type after Bonferroni post hoc correction: # represents 0.01 < p < 0.05.
SEM of in vitro engineered cartilages
SEM was used to visualize the ultrastructural differences between bioprinted constructs and Chondro-Gide scaffolds across the different cultivation times. At 3 weeks of culture, both bioprinted constructs and Chondro-Gide scaffolds showed evidence of remodeling, denoted by the presence of fibrous structures on the surface of the cartilages (Figure 7). Chondrocytes were also found inside the lacuna structures at 3 weeks in the bioprinted constructs. After 6 weeks of culture, the distribution of ECM fibers increased and became more even in both bioprinted constructs and Chondro-Gide scaffolds, and by 9 weeks, both engineered cartilages were completely covered by a uniform layer of ECM. Bioprinted constructs at 3 weeks were shown to resemble native tissue most closely. This resemblance however was lost at 6 weeks as more ECM was deposited on the surface of the structures.
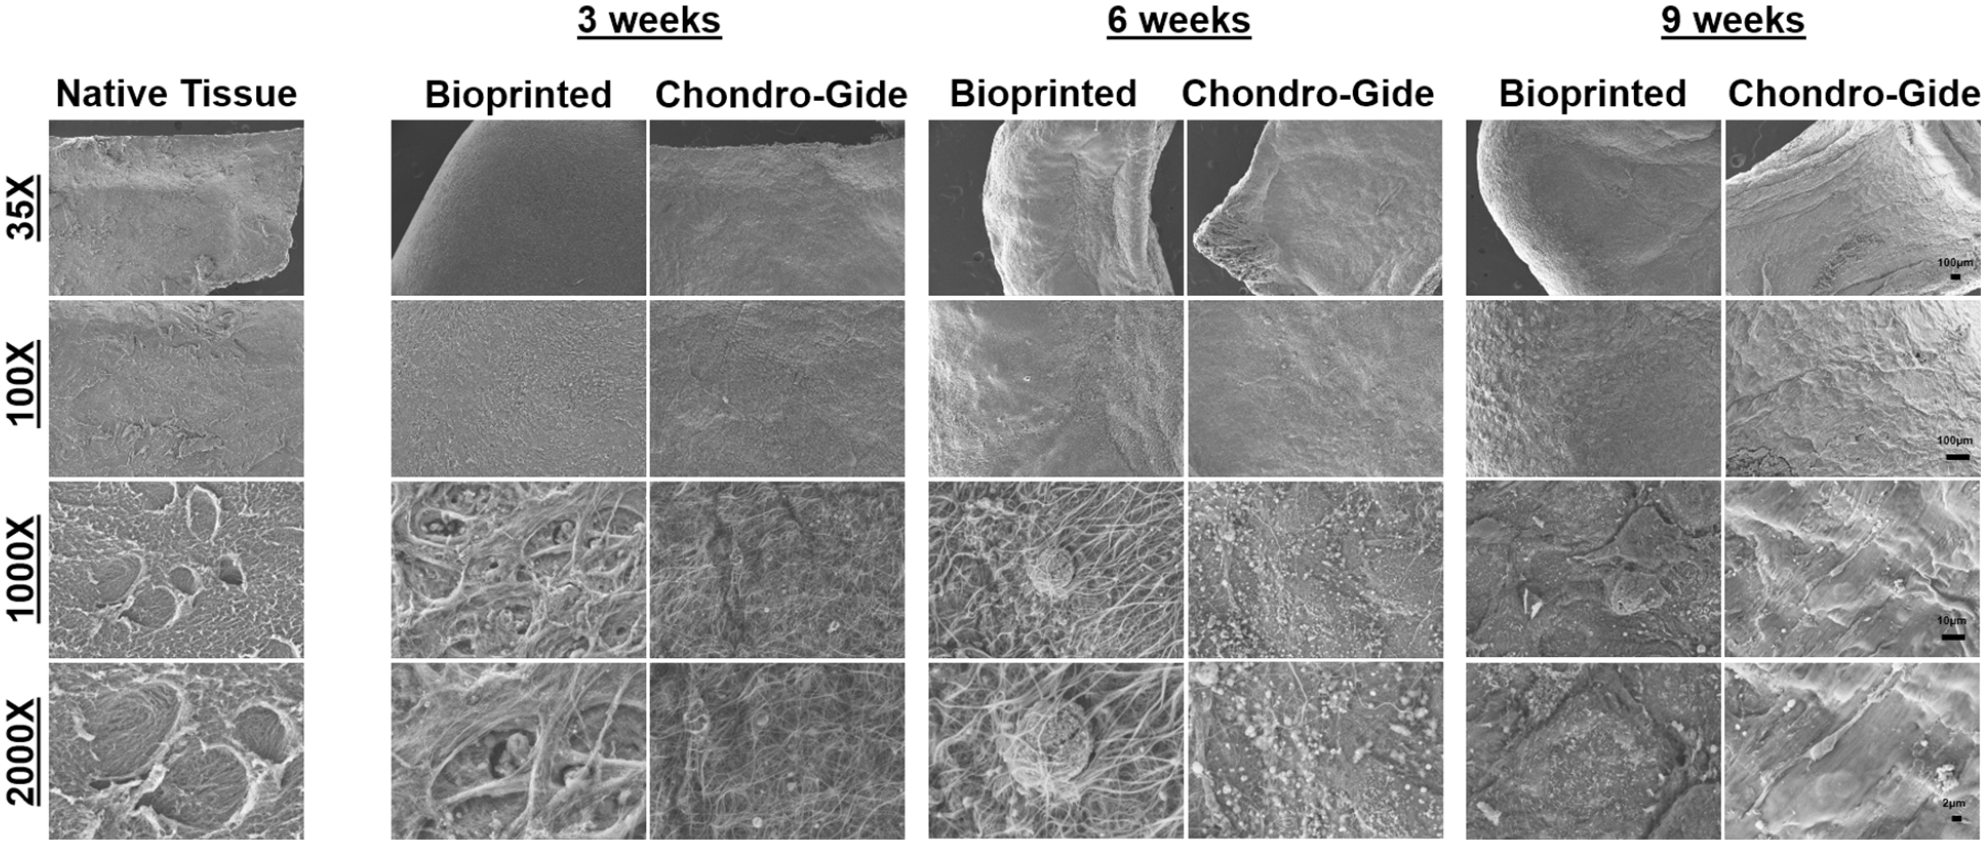
SEM imaging of in vitro constructs across culture time. Magnification of images is 35x, 100x, 1000x, and 2000x. Scale bars are 100, 10, 2 µm for 35x/100x, 1000x, and 2000x, respectively.
Gene expression of in vitro engineered cartilages
RT-qPCR was used to quantify the expression of chondrogenic (ACAN, SOX9, COL2A1, CO1A2), hypertrophic (COL10A1), osteogenic (RUNX2), and adipogenic genes (PPARγ). Additionally, the expression of the collagen cross linking enzyme (LOX) was quantified as well. The results were analyzed by two-way ANOVA and corrected with Bonferroni post hoc tests.
The expression of chondrogenic-related genes was all found to be affected by culture time. Only ACAN expression was shown to have a significant interaction between scaffold type and culture time (p = 0.0088, Figure 8). For bioprinted constructs, the expression of ACAN was found to increase with increasing culture time, with significant differences in expression between 3 and 6 weeks, 3 and 9 weeks. However, for Chondro-Gide scaffolds, ACAN expression was found to increase only from 3 to 6 weeks and then decrease from 6 to 9 weeks (no significant differences). A significant difference was found at 9 weeks between bioprinted construct and Chondro-Gide ACAN expression. Both the expression of COL2A1 and SOX9 were significantly affected by culture time (p < 0.0001–p = 0.0006, respectively), as the expression for both genes increased with increasing culture time. COL1A2 expression was also significantly affected by culture time (p = 0.0004), but instead, expression decreased with increasing culture time. There were no significant differences in COL2A1, SOX9, and COL1A2 expressions between bioprinted constructs and Chondro-Gide scaffolds. The expression of COL10A1 was significantly upregulated as the culture time increased (p < 0.0001), with no significant differences between scaffold types. There was also a significant decrease in PPARγ expression (p < 0.0001) with culture time, with no significant differences between scaffold types. A significant interaction was also found between scaffold type and culture time for LOX (p = 0.0006). For bioprinted constructs and Chondro-Gide scaffolds, the expression of LOX was shown to increase and decrease significantly with culture time, respectively. The expression of RUNX2 was not affected by either culture time or scaffold type.
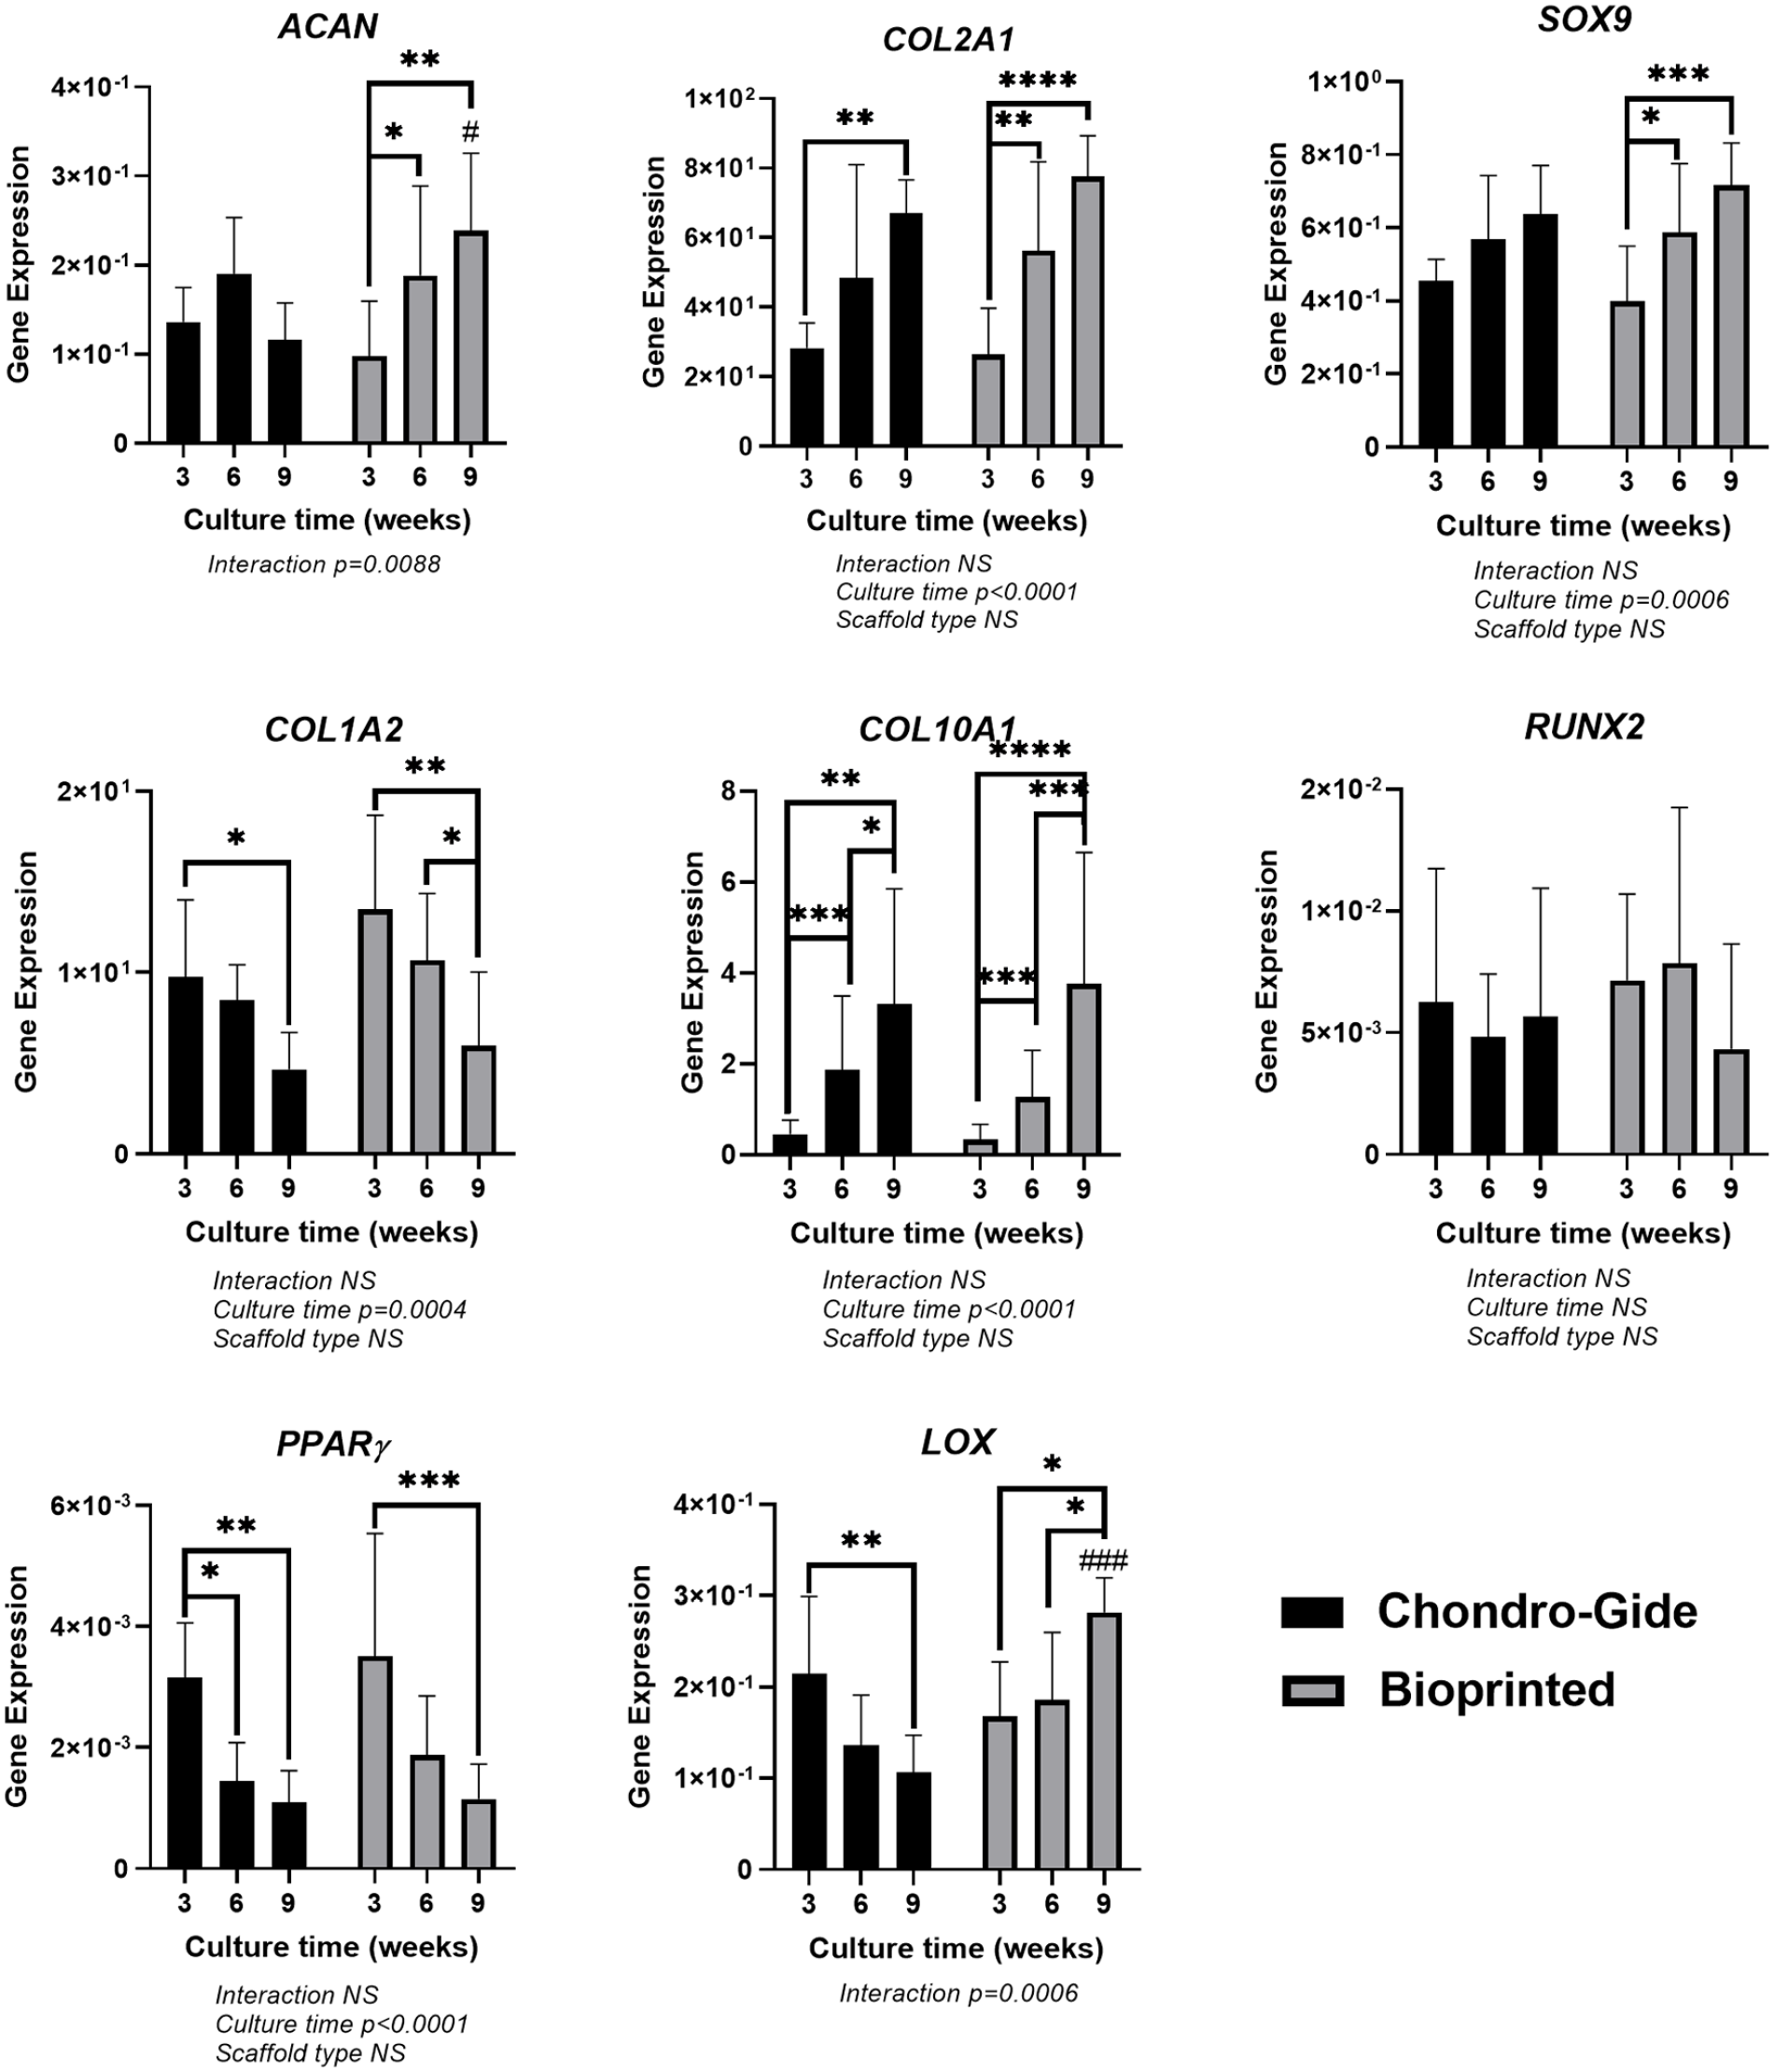
Gene expression of in vitro constructs. Values shown are 2-ΔCt values from RT-qPCR. Statistics were done using ΔCt values. Data was analyzed by two-way ANOVA and corrected with the Bonferroni post hoc test. Housekeeping genes used were ACTB, B2M, and YWHAZ. n = 6 donors (in duplicate). NS: non-significant. Star (*) represent the significant difference with regarding of culture time after Bonferroni post hoc correction: * represents 0.01 < p < 0.05, ** represents 0.001 < p <0.01, *** represents 0.0001 < p <0.001, **** represents p < 0.00001. Pound (#) represent the significant difference with regarding of scaffold type after Bonferroni post hoc correction: # represents 0.01 < p < 0.05, ### represents 0.0001 < p < 0.001.
Gross morphology of engineered cartilages after in vivo implantation in nude mice
Following implantation in nude mice, the gross morphologies of the engineered cartilages were assessed for macroscopic differences. After 5 weeks of implantation, both bioprinted constructs and Chondro-Gide scaffolds maintained their original size and shape (Figure 9(a)). Both engineered cartilages were smooth and opaque following in vivo culture compared to the gluey and formless appearance of non-precultured engineered cartilages (empty scaffolds).

(a) Gross morphology of constructs and scaffolds before and after implantation. (b) Histology and immunofluorescence of in vivo bone formation proteins, including type × collagen (red represents positive type × collagen, which is a marker of chondrocyte hypertrophy), CD31 (green represents positive CD31, CD31 is a marker of angiogenesis), BSP (red represents positive bone sialoprotein formation), and Alizarin Red (orange color represents positive calcification). COL10; type × collagen, CD31; cluster of differentiation 31, BSP; bone sialoprotein. Scale bar: 100 µm.
Histology and immunofluorescence after in vivo implantation
To characterize the nature of the ECM following implantation, Safranin-O and Masson’s trichrome staining were performed to assess and compare the matrix composition of in vivo cultured engineered cartilages to in vitro controls. Following in vivo culture, both cell-laden bioprinted constructs and Chondro-Gide scaffolds showed peripheral loss of proteoglycan-rich matrix, denoted by the loss of Safranin-O staining (Figure 10, all the explanted donors are shown in Supplemental Figure S7). The intensity of Safranin-O staining was overall fainter in the in vivo cartilages compared to the in vitro cartilages. No matrix deposition was observed in empty scaffolds. Collagen deposition, denoted by aniline blue, was slightly different between in vitro and in vivo cartilages. Engineered cartilages implanted in vivo appeared to have a more intense collagen staining in the periphery that contrasted Safranin-O staining, like native tissue. However, in vitro cartilages appeared to have a more diffuse and generalized distribution of collagen staining. Bioprinted constructs overall had more collagen staining than Chondro-Gide in both the in vitro and in vivo conditions. Collagen deposition that was observed in both empty scaffolds was most likely due to mouse skin cell infiltration, which is supported by the presence of cell nuclei and lack of human specific collagen expression detected by immunofluorescence (Figure 10). To characterize and compare the collagen deposition in the in vivo cultured engineered cartilages to those cultured in vitro, types I and II collagen immunofluorescence were performed. The expression of type I and II collagens were shown to be maintained in the cell-laden engineered cartilages following in vivo culture (all the explanted donors are shown in Supplemental Figure S8), with type II collagen expression being the most pronounced. Type II collagen expression was also more intense in in vivo than in vitro cartilages. To determine whether macrophages contributed to the loss of the proteoglycan-rich matrix in vivo, BM8 immunofluorescence was performed (Supplemental Figure S10). Macrophages were observed in both in vivo cultured engineered cartilages, suggesting a phagocytic role of macrophages in proteoglycan loss. To assess the extent of bone formation in the in vivo cartilages, a few different analyses were performed. CD31, BSP, type × collagen immunofluorescence, and Alizarin Red S staining were performed to detect blood vessel invasion, bone ossification, chondrocyte hypertrophy, and calcium deposition in the in vivo cartilages, respectively. There was no evidence of blood vessel invasion, bone growth, or mineralization in either the cell-laden bioprinted constructs or Chondro-Gide scaffolds (Figure 9(b), Alizarin Red S for explanted scaffolds and native tissue are shown in Supplementary Figure S9). Empty scaffolds implanted in vivo showed some evidence of blood vessel invasion. In vitro parallel-cultured engineered cartilages served as a negative control for both BSP and Alizarin Red S staining. Type × collagen expression was observed in both bioprinted constructs and Chondro-Gide scaffolds in vivo, however, this staining was like in vitro controls.

Histology and immunofluorescence of chondrogenic related proteins, including Safranin-O/Fast Green straining, Masson’s Trichrome staining, and type I and II collagens immunofluorescence. Scale bar: 100 µm.
Mechanical property after in vivo implantation
To assess the effects of in vivo culture on the mechanical properties of engineered cartilages, a three-point bending test was performed before and after implantation in nude mice. Bending modulus was shown to increase from 0.287 ± 0.0513 to 0.534 ± 0.189 MPa in Chondro-Gide and from 0.298 ± 0.577 to 0.582 ± 0.0444 Pa in bioprinted constructs. All three donors showed an increase in bending modulus after implantation. The size of the implanted Donor #1 is untestable due to the size limitation.
Discussion
In this study, we have used human nasoseptal chondrocytes (hNC)-laden bovine type I collagen hydrogel to 3D bioprint engineered nasal human cartilage. Our results supported the biofabrication of a robust and mechanically suturable engineered human nasal cartilage that is comparable if not better than engineered human nasal cartilage graft from hNC-seeded porcine type I and III collagen membrane scaffold, Chondro-Gide. The bioprinted tissue was characterized by increased cellular viability from the time of biofabrication to the endpoint of 9 weeks of in vitro tissue development at which point there was a fall in the measured cellular viability relative to 3- and 6-week time points. The reason for the decline is unclear but the majority of the cells’ morphology at 9 weeks seem to be consistent with the adhesive model of cell migration in 3D collagen lattices, suggesting that a number of cells may have migrated out of the engineered tissue construct after the 9 weeks long of ECM accumulation and matrix remodeling. 38 However, this would need to be verified in future studies.
Furthermore, our results emphasize the capacity of the extensively cell culture expanded hNCs, up to six cell population doublings, in cell growth media supplemented with TGF-β1 and FGF-2 of been able to synthesize and organize cartilage ECM within the hNCs-laden type I collagen hydrogel for bioprinting and within the type I/III collagen membrane scaffold. These results are consistent with our previous works13,22 and Fulco et al.’s 3 work using the collagen membrane scaffold. Since the functional component of cartilage is its ECM, 39 we evaluated the progression of tissue maturation over time. After 3, 6, 9 weeks of chondrogenic culture, we first analyzed for cartilaginous ECM formation by visualizing sulfated proteoglycan via Safranin-O staining, collagen deposition via Masson Trichrome staining, human types I and II collagen via immunofluorescence (Figure 4(a, b) and 5(a)). The bioprinted constructs showed a uniform distribution of Safranin O positive, collagen, and human types I/II collagen distribution relative to the same ECM distribution in the porcine-derived type I/III collagen membrane scaffolds. Thus, one benefit of the bioprinting approach for fabrication of the engineered nasal cartilage graft is that it allowed the hNCs to be homogenously distributed within the bovine-derived type I collagen hydrogel before the 3D layer-by-layer deposition of the hNCs-laden hydrogel. In contrast, the distribution of the hNCs synthesized cartilaginous ECM appeared to be less uniformly distributed and restricted to the porous layer of the porcine-derived type I/III collagen membrane scaffold albeit with some evidence of the ECM extending into the smooth compact layer of the membrane over the course of the in vitro tissue maturation.
Quantitative measures of the chondrogenic capacity (i.e. GAG/DNA) of the hNCs within the two matrices used in this study supports the superiority of the microenvironment of the hydrogel in facilitating the chondrogenic redifferentiation of the hNCs. The GAG/DNA values for the bioprinted engineered nasal cartilage were higher than in the porcine-derived type I/III collagen membrane scaffolds with magnitudes of 14.38, 13.74, 12.48 µg/µg for 3, 6, 9 weeks, respectively. This superiority is consistent with reports that the branched network of loose bundles of collagen fibers as found in collagen hydrogels as supposed to the membrane-like flatten wall internal structure of the fibers presented in the porous collagen sponges supports the round chondrocytic phenotype of chondrocytes.40–42 However, it is interesting to note that while the chondrogenic capacity of the hNCs within the hydrogel matrix was superior relative to the collagen membrane scaffold, the gene expression of types I and X collagen were not different between the hydrogel and membrane scaffold as previously reported between the different internal structures of chitosan-based scaffold forms of sponges and hydrogels. 40 To that end, our finding seems to suggest that both the internal structure and composition of scaffolds play a role in the phenotypic expression of the cells in any given scaffold. The higher GAG/DNA contents in collagen I bioink group may be attributed to a superior display of synthetic capacity of the hNCs within the hydrogel microenvironment as well the entrapment of the synthesized ECM within the hydrogel matrix.
Given the fact that the mechanical strength of cartilaginous structures is by reason of their ECM’s composition and organizational structure, it is no surprise that as the ECM synthesized by the hNCs increased and accumulated with in vitro culture duration within the bioprinted constructs that it played a vital role in the development of its tensile properties (Figure 6(a)). As the images (Figure 6(a)) demonstrate, after 3 weeks of culture, the bioprinted constructs were unable to hold surgical sutures an indication of a weak tensile strength. However, it was not until after 9 weeks of in vitro culture that the bioprinted constructs’ tensile properties was adequate to hold the surgical sutures without failure. In contrast, the high tensile strength of the collagen membrane was adequate to hold surgical sutures regardless of the in vitro culture duration of the due to the arrangement of its collagen fibers. 3 It is interesting to note that the ultrastructure of native human septal cartilage and that of the collagen membrane-derived engineered nasal cartilage looked very similar regardless of the in vitro culture maturation time with obvious tightly organized collagen fibers, while porous spaces are evident in the bioprinted constructs of engineered cartilage at 3 and 6 weeks but not at the 9 weeks culture time when the ultrastructure looked similar to the ultrastructure of the native septal cartilage and collagen membrane-derived engineered cartilage. To that end, it is reasonable to speculate that the subsequent filling or remodeling of the spaces contributed to the augmented tensile strength of the bioprinted construct after 9 weeks. The increased lysyl oxidase (LOX) expression which relatively peaked at 9 weeks coincided the improved tensile strength (Figure 8). Thus, given LOX’s functionality in crosslinking collagen and improving mechanical strength of engineered cartilage, we speculate that LOX contributed to the augmented tensile strength after the 9 weeks of maturation.43,44 The mechanism underlying the observed upregulation of LOX in the bioprinted constructs and its decline in the collagen membrane-derived constructs is unclear but may be associated with alterations in local hypoxia microenvironment as the cartilaginous ECM is deposited and remodeled within the cell-laden constructs. Makris et al has shown that LOX expression could be induced through hypoxia. 43 One possibility is a limited access of the hNCs-media contact in the compact layer of the collagen membrane scaffold which may have led to a local hypoxic environment, resulting in a higher LOX gene expression at 3 weeks. However, as culture time increased, the de novo synthesized and deposited ECM by the hNCs remodeled with extension into the compact layer leading to a disruption of the local hypoxic microenvironment with concomitant decline in LOX gene expression. In contrast, the hNCs within the bioprinted hydrogel constructs had high initial cell-media contact that permitted a homogenous access of media dissolved oxygen to the hNCs. But as the hNCs within the bioprinted construct synthesized, deposited, and remodeled the de novo ECM during maturation local hypoxic microenvironments emerged leading to increased LOX expression.
In addition to the bioprinted engineered cartilage improved tensile characteristics as judged by its suturability, the bending modulus of the bioprinted cartilage experienced a larger increase with culture maturation time than the collagen membrane-derived engineered cartilage constructs. This finding further supports the concept that the gradual improvement in the tensile strength and suturability of the bioprinted engineered cartilage aligned with increased ECM production and accumulation within the hydrogel scaffold.
Monolayer expanded chondrocytes expressed adipogenic, chondrogenic, and osteogenic markers genes and encoded proteins after respective inductions.45,46 Therefore, we investigated the expression of adipogenic, chondrogenic, and osteogenic marker genes to assess in vitro phenotypic stability of the chondrogenically stimulated monolayer-expanded hNCs. Our findings showed a gradual decline in adipogenic (PPARγ) and fibrogenic (COL1A2) marker gene expression regardless of whether the collagen membrane or hydrogel scaffold was used during in vitro maturation of the engineered cartilage constructs. In contrast, chondrogenic markers’ gene expression (COL2A1, SOX9, ACAN) increased with culture time in the cell-laden hydrogel bioprinted constructs and to some extent similarly in the collagen membrane albeit with a notable drop in ACAN expression at 9 weeks. These results further reinforce the superiority of the hydrogel microenvironment in the enhancing the chondrogenic phenotype of the chondrogenically stimulated monolayer-expanded hNCs.
The expression of COL10A1, a marker of hypertrophic chondrocyte has been shown to correlate with the propensity of chondrogenically induced bone marrow mesenchymal stem cells to undergo transformation akin to endochondral ossification. 47 As such, we investigated the expression of COL10A1 and observed its upregulation with culture maturation time in both the cell-laden bioprinted and the collagen membrane constructs. Furthermore, its encoded protein, type X collagen, was evident via immunofluorescence in the constructs (Figure 5(b)). To ensure that the engineered cartilage constructs were stable phenotypically in vivo without the risk of undergoing ossification, the constructs after 9 weeks of in vitro maturation were subcutaneously implanted in immunodeficient nude mice. There was no evidence of ossification regardless of whether the engineered cartilage construct was bioprinted or collagen membrane-derived after 5 weeks of implantation in the mice. This finding was consistent with our previous findings in regard to engineered cartilage in the collagen membrane scaffold. 13 Interestingly, Aksoy et al. 48 showed native nasal septal cartilage contain small amounts of Type X collagen. Thus, it is reasonable to speculate that compositionally our engineered cartilage constructs resemble native nasoseptal cartilage.
In vivo preservation of the engineered cartilage constructs poses several challenges: the shrinkage and deformation of the construct due to the skin tension,49–51 the calcification of tissue-engineered cartilage,13,47,49,52 and the preservation of cartilage-like ECM after implantation. 14 In this study, the bioprinted constructs were able to maintain their gross morphology even after 5 weeks of implantation. However, the gross morphology of the cell-free scaffolds deformed and shrunk suggesting some sort of remodeling or cell-mediated contraction had taken place (Figure 9). Following other histological and immunofluorescence assessments in addition to the above-mentioned assessment for bone formation after in vivo implantation, positive CD31 fluorescence were evident in the cell-free scaffolds suggesting an invasion of endothelial cells which may contributed to the observed shrinkage through cell-mediated contraction of the scaffold. Moreover, Safranin-O positive ECM staining was notably reduced after in vivo implantation, but the fluorescence of types I and II collagen remained unchanged as prior to in vivo implantation. These findings are consistent with previous studies of implanted engineered nasal cartilages.13,53 But it is unclear the underlying mechanism of the decline of the Safranin O positive ECM. We reasoned it could be due to macrophage invasion from the nude mouse.54–56 Thus, we assessed the presence of macrophage with anti-F4/80, a unique marker of murine macrophages in the explanted tissue engineered constructs, 57 the F4/80 immunofluorescent results are shown in Supplemental Figure S10. The assessment proved positive for the presence of macrophages and supported the mechanistic possibility that the decline of the Safranin O positive ECM may have been mediated by macrophage secreted matrix metalloproteinases as previously reported.56,58,59
The mechanical strength of both engineered cartilage constructs increased almost two-fold after in vivo implantation as shown in Table 3. This finding suggested that the constructs underwent further remodeling or maturation in vivo after 9 weeks of in vitro maturation. This finding therefore raises the question; what is an adequate duration for in vitro maturation of engineered cartilage to achieve mechanical robustness for surgical handling prior to reconstructive surgery? Previous work, albeit in articular cartilage repair, indicated that 2 weeks of in vitro maturation of engineered cartilage resulted in better integrative repair relative to 6 weeks of in vitro maturation. 60 To this end, it is reasonable to suggest that a timeframe that enables suturability or mechanical handling during reconstructive surgery is appropriate given that further in vivo maturation is inevitable.
Bending modulus before and after implantation.

A potential limitation of our study was that only male donors were included which was due to the limited donor supply from the hospital. Previous research has not shown any significant differences between males and females in terms of nasal cartilage compositions and shapes.61,62 A pilot study might be worth future investigation to compare the effects of sex on the compositions of engineered cartilage tissues.
Conclusion
This study demonstrated the perspective of bioprinting engineered cartilage grafts with similar histological, molecular, and mechanical characteristics as those derived from the use of clinically approved type I/III collagen membrane scaffolds both in vivo and in vitro. Moreover, the mechanical characteristics of the bioprinted engineered grafts increased after in vivo implantation. Overall, this study showed strong evidence of the potential to engineer human nasal cartilage grafts for nasal reconstructive surgery via 3D bioprinting.
Supplemental Material
sj-docx-1-tej-10.1177_20417314221086368 – Supplemental material for In vitro maturation and in vivo stability of bioprinted human nasal cartilage
Supplemental material, sj-docx-1-tej-10.1177_20417314221086368 for In vitro maturation and in vivo stability of bioprinted human nasal cartilage by Xiaoyi Lan, Yan Liang, Margaret Vyhlidal, Esra JN Erkut, Melanie Kunze, Aillette Mulet-Sierra, Martin Osswald, Khalid Ansari, Hadi Seikaly, Yaman Boluk and Adetola B Adesida in Journal of Tissue Engineering
Footnotes
Acknowledgements
We are grateful for the donation of the type I/III collagen membrane scaffold, Chondro-Gide, from Geistlich Pharma AG, Switzerland. We would like to thank the surgeons from Division of Otolaryngology and associated operating room nurses at the University Hospital of Alberta (Edmonton, Alberta), Grey Nuns Community Hospital (Edmonton, Alberta), and the Leduc Community Hospital (Leduc, Alberta) for assistance with procurement of human nasal septal tissue specimens. We acknowledge the staff in the Scanning Electron Microscope Laboratory in the Department Earth and Atmospheric Sciences, University of Alberta for taking the SEM images. We acknowledge the help of the Cell Imaging Center in the Faculty of Medicine and Dentistry, University of Alberta for the use of the confocal microscope. The schematic diagram is created with ![]() . We acknowledge Zhiyao (Hilda) Ma in Prof. Adetola Adesida’s lab for writing the algorism to quantify the immunofluorescence intensity and cell number using python.
. We acknowledge Zhiyao (Hilda) Ma in Prof. Adetola Adesida’s lab for writing the algorism to quantify the immunofluorescence intensity and cell number using python.
Author contributions
XL conducted the experiments and was responsible for experimental design, data acquisition, analysis, and manuscript writing. YL and MK contributed to the animal surgery. MV contributed to the manuscript writing. EJNE, MV, MK, and AMS were involved in immunofluorescence, gene expression, and cell culture. MO, KA, and HS involved in nasal cartilage procurement, and review. YB was involved in supervision and final manuscript review. ABA conceived and supervised the study, was responsible for writing and final review of the manuscript. All authors read and approved the final manuscript.
Availability of data and materials
Declaration of conflicting interests
The author(s) declared no potential conflicts of interest with respect to the research, authorship, and/or publication of this article.
Funding
The author(s) disclosed receipt of the following financial support for the research, authorship, and/or publication of this article: Financial support was provided by Canadian Institutes for Health Research (CIHR PS 159,661) to ABA, MO, KA, and HS, Alberta Cancer Foundation-Mickleborough Interfacial Biosciences Research Program (ACF-MIBRP 27,128) to ABA, MO, and KA, Edmonton Civic Employees Charitable Assistance Fund (RES0041788) to XL, YB, and ABA, Natural Sciences and Engineering Research Council of Canada – Discovery Grant Program (NSERC RGPIN 06431) to YB, Canadian Foundation for Innovation (CFI 33786) to ABA, University Hospital Foundation (RES0028185) to ABA.
Supplemental material
Supplemental material for this article is available online.
References
Supplementary Material
Please find the following supplemental material available below.
For Open Access articles published under a Creative Commons License, all supplemental material carries the same license as the article it is associated with.
For non-Open Access articles published, all supplemental material carries a non-exclusive license, and permission requests for re-use of supplemental material or any part of supplemental material shall be sent directly to the copyright owner as specified in the copyright notice associated with the article.