
Abstract
When repairing cartilage defects a major challenge is achieving high-quality integration between the repair tissue and adjacent native cartilage. Matrix-rich cartilage is not easily remodeled, motivating several studies to trial enzyme treatment of the tissue interface to facilitate remodeling and integration. Studying and optimizing such processes is tedious, as well as potentially expensive, and thus simpler models are needed to evaluate the merits of enzyme treatment on cartilage tissue integration. Herein, we used engineered cartilage microtissues formed from bone marrow-derived stromal cells (BMSC) or expanded articular chondrocytes (ACh) to study the impact of enzyme treatment on cartilage tissue integration and matrix remodeling. A 5-min treatment with collagenase appeared to improve cartilage microtissue integration, while up to 48 h treatment with hyaluronidase did not. Alcian blue and anti-collagen II staining suggested that collagenase treatment did facilitate near seamless integration of cartilage microtissues. Microtissue sections were stained with Picrosirius red and characterized using polarized light microscopy, revealing that individual microtissues contained a collagen network organized in concentric shells. While collagenase treatment appeared to improve tissue integration, assessment of the collagen fibers with polarized light indicated that enzymatically damaged networks were not remodeled nor restored during subsequent culture. This model and these data paradoxically suggest that collagen network disruption is required to improve cartilage tissue integration, but that the disrupted collagen networks are unlikely to subsequently be restored. Future studies should attempt to limit collagen network disruption to the surface of the cartilage, and we recommend using Picrosirius red staining and polarized light to assess the quality of matrix remodeling and integration.
Introduction
Cartilage has limited capacity for regeneration, motivating investment into cell therapies for cartilage defect repair. In addition to the challenge of generating new cartilage tissue, researchers have struggled to identify strategies that enable high-quality integration of new repair tissue with native cartilage tissue. Mature cartilage is a matrix-rich tissue in which cells contribute to only approximately 2% of the tissue volume. 1 An artifact of this cell-matrix organization, is that chondrocytes (ACh) are effectively “trapped” or contained within discrete lacunae. 2 These organizational characteristics limit ACh capacity to migrate from lacunae, thereby limiting their capacity to contribute to remodeling or fill at the interface between native and repair cartilage tissue. This problem is endemic in all cartilage repair strategies.
When cartilage defects are repaired using “mosaicplasty,” an osteochondral plug(s) is harvested from a non-weightbearing region on the joint and implanted into the defect site.3–5 ACh in both the plug and adjacent tissue are trapped within their respective lacune, and there is typically poor integration between the plug and adjacent cartilage tissue.3–5 If multiple osteochondral plugs are used to fill a large defect site, integration between the plugs is also poor. Matrix-induced autologous chondrocyte implantation (MACI) was the first FDA approved cell and scaffold-based cartilage repair therapy,6,7 and in this process in vitro expanded ACh are seeded onto a collagen membrane which is implanted into the cartilage defect site. As the implanted ACh are not trapped in lacune, they can remodel and form new cartilage tissue. However, integration with adjacent native cartilage tissue remains problematic, 8 again because of limited capacity of the transplanted ACh and the ACh in the native tissue to remodel the mature matrix at interface between the new and native cartilage at the edge of the defect.
A logically pleasing strategy to attempt to improve cartilage tissue integration is through the partial break-down of cartilage extracellular matrix (ECM) at the defect interface using enzymes to liberate ACh, or at least permit remodeling of the matrix at this interface. A number of studies have pursued this objective using collagenase,9–13 chondroitinase, 14 hyaluronidase,9,10 or trypsin. 15 One clinical study reported that brief collagenase pretreatment of the cartilage defect site enhanced the integration of repair tissue. 9 Collagenase treatment of the tissue was reported to enable migration of the ACh into the wound edge and improve both integration and biomechanical properties.9–12 While enzymatic treatment seems to be a rational method to improve cartilage tissue integration, there is no gold standard for this approach, and there remains no routine clinical uptake of these approaches that we are aware of.
While large animal models would allow study and optimization of protocols for enzyme treatment to improve cartilage tissue integration, these models are complex, 16 and the cost per animal can make it unfeasible to complete complex studies with multiple variables and replicates. Our group has developed high throughput cartilage microtissue models,17–19 and have previously used these models to study the integration of cartilage microtissues with each other with the goal of either generating defect fill tissue or to assemble large biphasic osteochondral tissues.20,21 We use microwell platforms to enable generation of hundreds-to-thousands of uniformly sized cartilage microtissues from either bone marrow stromal cells (BMSC, sometimes referred to as “mesenchymal stem cells”) or ACh,17–19 the two most used cell types in cartilage engineering studies. The capacity to mass-produce a uniform cell-tissue product make microtissues an ideal tool for studying or optimizing bioprocesses, such as investigations into how enzyme treatment can influence cartilage tissue integration. Herein, using cartilage microtissues as a model system, we characterized cartilage tissue integration following treatment with either Collagenase Type II or hyaluronidase. We aimed to determine if enzyme treatment would improve cartilage microtissue integration and to characterize the matrix quality in tissues formed from enzyme treated microtissues.
Methods
A schematic of the experimental design used in this study is presented in Figure 1. Cartilage microtissues were manufactured in the Microwell-mesh over 14-day culture periods, using previously described methods (Futrega et al.,18,19 see Figure 1(a) and protocol below). Microtissues were treated with enzyme for the specified duration of time (Figure 1(b)), and then put into amalgamation cultures for a further 14 days (Figure 1(c)). The quality of cartilage-like tissue in microtissues and in amalgamated microtissues was characterized using histology, biochemical assays, and mechanical assays as shown in Figure 1(d).
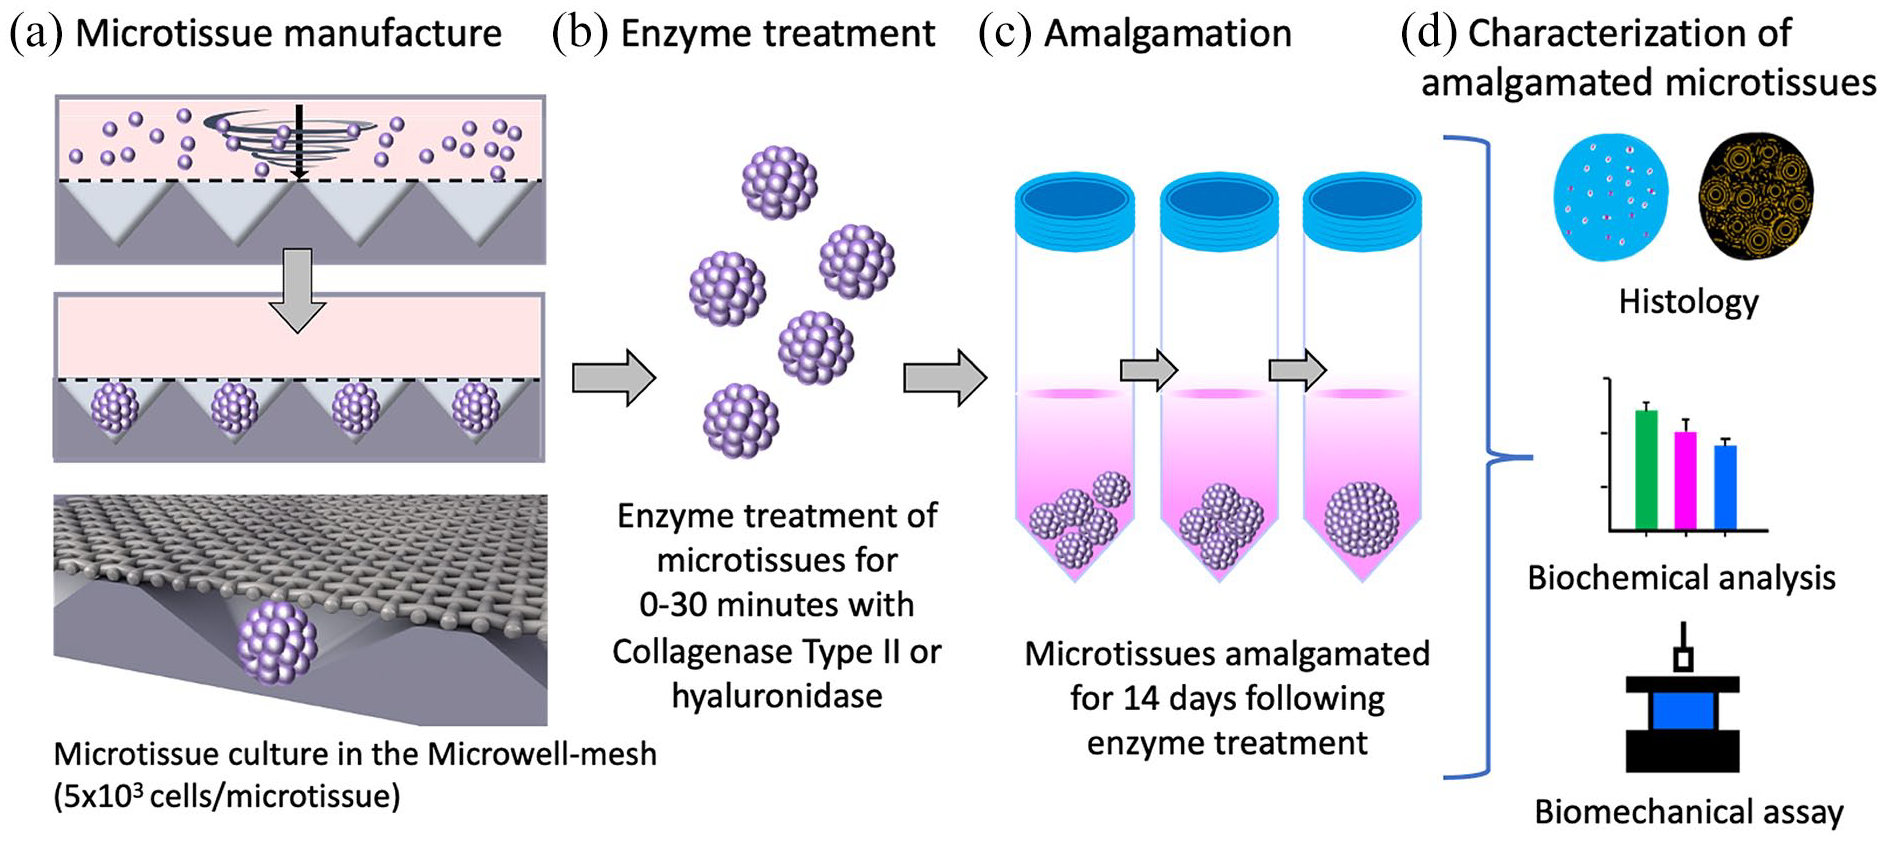
Schematic of experimental procedure. (a) BMSC or ACh cell suspensions were seeded into the microwells at the base of the microwell-mesh via centrifugation, yielding hundreds of uniformly sized microtissues. (b) BMSC or ACh derived microtissues were harvested after 14 days of chondrogenic culture, and exposed to Collagenase Type II or hyaluronidase enzyme for the specified duration. (c) Microtissues were permitted to amalgamate over a further 14-day culture period. (d) Amalgamated microtissues were characterized using histological, biochemical, and biomechanical assays.
Isolation and expansion of human BMSC
The collection of bone marrow aspirates from informed and consenting healthy volunteer donors was approved by the Mater Health Services Human Research Ethics Committee and the Queensland University of Technology Human Ethics Committee (Ethics No.: 1300000833). BMSC were isolated from bone marrow aspirates donated by a male (BMSC donor 1) and a female (BMSC donor 2) in their twenties. BMSC isolation was described previously18,22 and included density gradient centrifugation and tissue culture plastic adhesion. Cells were distributed into 5x T175 flasks (Thermo Fisher Scientific), each containing 35 mL of Low Glucose Dulbecco’s Modified Eagle Medium (LG-DMEM) containing GlutaMAX (Gibco, Thermo Fisher Scientific). The medium was supplemented with 100 U/mL penicillin/streptomycin (Gibco), 10% fetal bovine serum (FBS; Life Technologies), 5 μg/mL porcine heparin sodium salt (Sigma-Aldrich), and 10 ng/mL fibroblast growth factor-1 (FGF-1; Peprotech). Cells were incubated at 20% O2, 5% CO2, 37°C to allow plastic adherence. After 24 h, the medium containing non-adherent cells was replaced with fresh media, and expansion of adherent cells was continued under 2% O2, 5% CO2 at 37°C until cells reach 80% confluency. The adherent BMSC were passaged using 0.25% Trypsin-EDTA (Thermo Fisher) and re-seeded in T175 flasks at a density of ~1500 cells/cm2. We have refined these culture conditions and used this method of cell expansion in several previous studies focused on BMSC and BMSC chondrogenesis.18,23–26 BMSC from passage 3 were used for experiments described here.
Isolation and expansion of human articular chondrocytes
The collection of cartilage tissue was approved by the Holy Spirit North Side Hospital Human Ethics Committee and the Queensland University of Technology Human Research Ethics Committee (Ethics No. 1400001024). Surgical discards from the joint replacement of 70-year-old male (ACh donor 1), 77-year-old male (ACh donor 2), and 74-year-old male (ACh donor 3). ACh were isolated from cartilage tissue using the previously described process. 27 Briefly, cartilage tissue was sliced into smaller pieces and washed three times with PBS (Supplemental Figure S1). Tissue pieces were digested overnight at 37°C in a solution composed of LG-DMEM, Collagenase Type II (300 U/mL, Glibco), and antibiotic antimycotic solution (100 U/mL penicillin, 0.1 mg/mL streptomycin, and 0.25 μg/mL amphotericin B, Sigma-Aldrich). The digested ACh were centrifuged at 350 × g and washed thrice with LG-DMEM. ACh were seeded into T175 flasks at a density of ~1500 cells/cm2, in 35 mL of LG-DMEM plus Glutamax supplemented with 10% FBS, 10 ng/mL FGF-1, and 5 µg/mL heparin and the antibiotic antimycotic solution. ACh were cultured in a 37°C incubator with 2% O2 and 5% CO2. The medium was replaced every 3 days and ACh passaged when confluency reached 80%. Experiments were conducted using ACh at passage 3.
Fabrication of the microwell-mesh
Cartilage microtissues were manufactured from BMSC or ACh using the “Microwell-mesh” cell culture platform. The fabrication method for the Microwell-mesh was described previously, 18 and is briefly summarized here. The Microwell-mesh is a microwell platform with a nylon mesh bonded over the microwell openings. The mesh pore size is large enough to allow single cells to be centrifuged through the mesh, and into the microwells. Once the cells contact each other, they self-assembled into microtissues, which are too large to escape back through the mesh. The mesh retains the microtissues in discrete microwells over extended culture periods, and over multiple medium exchanges. Here, sheets of microwells were cast from polydimethylsiloxane (PDMS, SYLGARD™ 184 Silicone Elastomer Kit, Dow Silicones Corporation, Midland, MI, USA) on a polystyrene mold to yield a pyramidal array of microwells (2 mm × 2 mm square × 0.8 mm deep). Using a punch (Amazon.com), disks of 34 mm diameter were punched from the PDMS sheets. A nylon (6/6) mesh with 36 µm square pore openings (Amazon.com) was bonded over the top of the microwell openings using a thin coat of silicone glue (Selleys Aquarium Safe, Padstow, New South Wales). Excess mesh was trimmed around the PDMS disk, and the platform anchored into the bottom of six well plates (Nunc) with a dab of silicone glue. Plates were sterilized using 70% ethanol for at least 1-h. Centrifugation at 3000 × g was used to dispel any trapped bubbles from microwells. To eliminate ethanol, the plates were rinsed three-times with Invitrogen™ UltraPure™ DNase/RNase-Free distilled water and dried in a 60°C oven over night, and stored until needed. Prior to use in culture, wells were soaked for 10 min in a 5% Pluronic F127 (Sigma-Aldrich) solution to reduce cell adherence to the PDMS surface, thus encouraging cell aggregation. 24
Cartilage microtissue culture
Cartilage microtissues were manufactured from BMSC or ACh using the Microwell-mesh culture platform described above. Each well was first filled with 3 mL of cell-free chondrogenic differentiation medium. Chondrogenic differentiation medium was formulated from High Glucose DMEM (HG-DMEM), supplemented with 100 µg/mL sodium pyruvate (Glibco), 100 U/mL penicillin/streptomycin (Glibco), 100 nM dexamethasone (Sigma-Aldrich), 10 ng/mL TGF-β1 (PeproTech), 1% ITS-X (Gibco), 40 mg/mL L-proline (Sigma-Aldrich), 200 mM ascorbic acid 2-phosphate (Sigma-Aldrich). The Microwell-mesh plate was centrifuged for 3 min at 3000 × g to force medium into microwells and displace any air bubbles. To inoculate cultures, 1 mL of chondrogenic differentiation medium containing 1.25 × 10⁶ BMSC or ACh was added to each well, and the plate centrifuged at 500 × g for 3 min to pellet cells into microwells. Each microwell contained approximately 5000 cells and these cells self-assembled to form discrete microtissues. Microtissues were cultured for 14 days under 2% O2, 5% CO2 at 37°C. A full volume medium exchange was performed every 2 days, with some medium saved (−80°C) for further analysis.
Amalgamation of microtissues
Cartilage microtissues were harvested from Microwell-mesh after peeling back the mesh, as previously described,18,19 and rinsed with HG-DMEM. Approximately 40 microtissues in 1 mL of HG-DMEM were transferred to single wells in 12 well plates (Nunc). The microtissues from BMSC donor 1 and 2, and ACh donor 3 were digested for 0, 5, 15, or 30 min with Collagenase Type II enzyme (Sigma-Aldrich) diluted to 300 U/mL or 3% Hyaluronidase (Sigma-Aldrich) in HG-DMEM. In extended studies, microtissues were digested in hyaluronidase for 48 h, and then amalgamation assessed. Digested microtissues were immediately washed thrice with HG-DMEM, and transferred into 2 mL sterile tubes (Sarstedt Australia Pty Ltd) containing 1 mL of the chondrogenic medium prepared using the formulation described above. These amalgamation cultures were continued for 14 days under 2% O2, 5% CO2 at 37°C, with full medium exchanged every 2 days. Based on histology from these initial screening assays, 5 min of Collagenase Type II digestion was selected for replicate studies. All experiments were replicated using microtissues formed from BMSC donors 1 and 2, as well as ACh donors 1 and 2.
Histological sectioning of tissues
Microtissues cultured for 14 days in the Microwell-mesh, were washed with PBS, and fixed in 4 % paraformaldehyde (PFA, Sigma-Aldrich) for 30 min at room temperature. Fixed microtissues were embedded in Tissue-Tek OCT compound (Sakura Finetek), 5 µm sections generated using a Leica Cryostat CM1950 (Leica Biosystems), and sections collected onto poly-lysine coated slides (ThermoFisher Scientific). Slides were frozen at −30°C until further processing. Before staining, sections were fixed onto the slides with 4 % PFA for 20 min at room temperature, and then washed with PBS. Larger amalgamated microtissues were subjected to an extended 1-h fixation in 4% PFA, and then embedded in paraffin wax. Paraffin-embedded tissues were sectioned at 5 µm thickness using a Leica Microtome RM2235 (Leica Biosystems), and sections collected onto poly-l-lysine coated slides. Slides were stored at room temperature, and de-waxed using xylene prior to rehydration with a graded ethanol series and staining.
Histology and immunohistochemistry
To characterize tissue GAG deposition and nuclei, histology slices were stained with 1% Alcian blue (Sigma-Aldrich) followed by counterstaining with Nuclear fast red (Sigma-Aldrich). The presence of collagen type II in tissues was determined by immunohistochemistry staining. A border was drawn around the tissue sections on slides using a PAP pen (Sigma-Aldrich). Antigens were exposed by treating the tissue with hyaluronidase (2 mg/mL Sigma-Aldrich), and incubating in a humidified chamber for 48 h at 37°C. Following the incubation, tissues were washed with 0.025 % Triton X-100 in PBS, and non-specific antibody binding blocked by incubating with 10% Normal Goat serum (Thermofisher-Scientific) at room temperature for 10 min. Tissues were then incubated overnight at 4°C with primary antibody against collagen II (Abcam, ab34712, raised in rabbit, 1:400 dilution). Sections were treated with 0.3 % H2O2 for 15 min and washed with 0.025% Triton X-100/PBS. Secondary goat anti-rabbit IgG antibody (Abcam, ab6721, 1:1000 dilution) was applied for 2 h at room temperature. The slides were washed three times with PBS and stained with 3,3′-Diaminobenzidine (DAB) kit chromogen (Biocare Medical™) for 5 min. Tissue sections were then counterstained with Nuclear fast red for 2 min, and then dehydrated through a decreasing gradient concentrations of ethanol. The slides were cover-slipped with Eukitt hard mount media (Sigma-Aldrich) after clearing in xylene. Stained sections were examined, and images were captured using an Olympus BX63 upright motorized epifluorescence microscope equipped with a Halogen lamp.
Characterization of collagen fibril network in amalgamated cartilage tissues
Sections from BMSC and ACh tissues cultured for 14 days in chondrogenic media, as well as those amalgamated for an additional 14 days, were stained with Picrosirius red solution (Abcam, ab 246832) following the manufacturer’s protocol to characterize the collagen fibril network, which is visible under polarized light.28,29 Briefly, sections were rehydrated in a descending ethanol series for 2 min each in 100% ethanol, followed by 95%, and finally 80% ethanol. Picrosirius red solution was deposited over sections and incubated at room temperature for 1 h. Samples were rinsed twice with 0.5% glacial acetic acid solution (Sigma-Aldrich), and then dehydrated in an ascending ethanol dilutions, cleared in xylene, and mounted using Eukitt hard mount media (Sigma-Aldrich). The orientation of the collagen fibrils was captured by means of birefringence using polarized light on an Olympus BX63 optical microscope.
Glycosaminoglycan (GAG) and DNA quantification
GAG content in the culture medium and in tissues was quantified using 1,9-dimethyl-methylene blue (DMMB, Sigma-Aldrich) assay, as previously described.20,21,30 Microtissues, and amalgamated microtissues, were digested overnight at 60°C in 1 mL solution containing 1.6 U/mL papain and L-cysteine (both from Sigma-Aldrich). Twenty-five microliter of tissue digest or the medium collected during medium exchanges was combined with 200 µL of DMMB dye in 96 well plates (Nunc), and absorbance was measured at 590 nm in a plate reader (ThermoFisher’s Multiscan GO). A standard curve was generated using dilutions of chondroitin sulfate sodium salt extracted from shark cartilage (Sigma-Aldrich). DNA content in the tissues was estimated using the PicoGreen assay, as per the manufacturer’s instructions (ThermoFisher). PicoGreen solution was added to the tissue digests in half volume black 96 well plates (Costar) and samples read at 480 nm excitation and 520 nm emission on a plate reader (OMEGA FLUOstar multi-plate reader, BMG Labtech). A DNA standard curve was generated using λ-DNA (Quant-iT™ PicoGreen™ dsDNA Assay Kit, ThermoFisher).
Mechanical testing
The mechanical properties of the 14 days cultured microtissues and amalgamated tissues were assessed using the CellScale Microtester G2 (CellScale, Canada). Tissues were mounted on a flat stainless-steel platform and submerged in PBS at 37°C. Microtissues were compressed by a small square stainless-steel flat compression plate adhered to the end of a 6 cm tungsten microbeam (510 µm). Amalgamated tissues were compressed by a spherical stainless steel micro-indenter (931 µm) rigidly fixed to the end of a microbeam (510 µm). Optical zoom was set at 3X and the diameter of the microtissues was measured using tracking points in the CellScale software. A compression magnitude was ramped to 5000 µN for 20 s, which was held for 10 s and recovered by 20 s at “Force” control mode. The cycle was repeated four times at the data output frequency of 5 Hz. The Young’s modulus and Poisson’s ratio for the microtissue was determined by minimizing the sum-squared error of the experimental and modeled compressive displacement (δ) from the final cycle using the following Hertzian half-spaced contact mechanics’ model 31 :

where F is the compressive force, E is Young’s modulus of the microtissue, R is the radius of the microtissue, and ν is Poisson’s ratio of the microtissue. The Poisson’s ratio was considered up to a particular delta value (δ/R ⩽ 0.1).
An indentation Hertz model was applied to determine Young’s modulus of the amalgamated microtissues. A load (P)-depth (h) relationship was interpreted using the following Hertzian contact theory for the spherical indenter displacements. 32

The mean E value was obtained from force-displacement data after fitting with the experimental curves measured with the spherical indenter up to h/R = 0.2.
Statistical analysis
Quantitative data are represented as mean ± standard deviation (SD) of four biological replicates (n = 4). Statistical analysis was performed using GraphPad Prism version 8. Statistical significance was determined by one-way analysis of variance (ANOVA) with Tukey’s post-hoc test and p < 0.05 was considered as statistically significant.
Results
Microtissue growth and enzymatic treatment
As depicted in Figure 2(a) and (c), there was incremental growth of BMSC and ACh microtissues over 14 days when cultured in chondrogenic induction medium, similar to our previously reported results.18,19 On day 14, microtissues were harvested and treated with Collagenase Type II for 0, 5, 15, or 30 min. Figure 2(b) shows the visual impact on BMSC microtissue of increasing the duration of enzyme treatment. Following 5 min of collagenase treatment, the edge of the microtissues appeared rough, indicating early liberation of cells from the surface of the microtissues. Further increases in the duration of enzyme digest resulted in liberation, and detachment, of cells from microtissues at 15 min, and microtissue fragmentation at 30 min. Figure 2(c) show the growth of ACh microtissues over 14 days and Figure 2(d) shows the enzymatic treatment of ACh microtissues with Collagenase Type II for 0, 5, 15, or 30 min. ACh microtissues appeared less sensitive to collagenase than BMSC microtissue, with breakdown of ACh microtissues only being visibly appreciable at 30 min (Figure 2(d)). Hyaluronidase enzyme appeared to disrupt the surface of microtissues following 5 min of treatment (Supplemental Figure 2B). However, unlike collagenase, hyaluronidase did not result in any fragmentation of the microtissues after 30 min. Increasing hyaluronidase treatment to 48 h resulted in adhesion of the microtissues to each other, rather than the expected breakdown of microtissues (Supplemental Figure 2B).

BMSC and ACh cartilage microtissue culture and enzymatic digestion. (a) Each microwell was seeded with approximately 5000 BMSC, and the microtissues grew incrementally over the 14-day culture. (b) Microtissues were treated with Collagenase Type II for 0, 5, 15, or 30 min. (c) Each microwell was seeded with approximately 5000 ACh, and the microtissues grew incrementally over the 14-day culture. (d) Microtissues were treated with Collagenase Type II for 0, 5, 15, or 30 min. Arrows show the liberation of cells from microtissues, or microtissue fragmentation following enzymatic treatment. Scale bars = 500 µm.
Histology and cartilage microtissue amalgamation
BMSC or ACh were cultured as discrete microtissues for 14 days and then permitted to amalgamate for a further 14 days in culture. Microtissue’s capacity to amalgamate was first assessed using histology, as shown in Figure 3. Alcian blue stained sections show that when microtissues were not treated with collagenase, they did attach to each other, but that amalgamation was modest. In these instances, the amalgamated tissue was fragile, and there were clear gaps between adjacent microtissues. This pattern was similar for microtissues derived from BMSC donors 1 and 2, as well as ACh donor 1. By contrast, microtissues assembled from ACh donor 2 cells amalgamated to a greater extent, even without collagenase treatment (Figure 3, bottom row).

Alcian blue staining of sections from BMSC and ACh microtissues cultured for 14 days, and following amalgamation for a further 14 days. First column, 14 day cultured microtissues; second column, microtissues amalgamated without enzymatic treatment; and third column, microtissues amalgamated after 5 min of Collagenase Type II treatment. Scale bars = 100 µm.
When microtissue were treated for 5 min with collagenase, microtissue amalgamation appeared to be near seamless (Figure 3, right column). Alcian blue staining was intense and uniform across the amalgamated BMSC or ACh microtissues. When enzyme treatment was increased to 15 or 30 min the process was not improved (Supplemental Figure 3). In amalgamated tissues formed from BMSC microtissues treated for 15 or 30 min with collagenase there appeared to be localized areas of intense Alcian blue staining the corresponded to the core of individual microtissues, with weaker staining in the areas outside of these cores. This suggested either matrix loss or a defect in the amalgamated matrix. The same pattern was not visible in the amalgamated ACh microtissues. Instead, the collagenase treated ACh microtissues formed a relatively seamless and uniform tissue (Supplemental Figure 3), but extending the enzyme treatment beyond 5 min did not appear to yield improvements. Cumulatively, these data indicated that 5 min of collagenase treatment was sufficient to dramatically alter the capacity of BMSC or ACh microtissues to amalgamate.
When cartilage microtissues formed from ACh were treated with hyaluronidase for 5 min, 30 min, or even 48 h, amalgamation was not meaningfully improved (Supplemental Figure 5). Alcian blue-stained sections of amalgamated microtissues that had been treated with hyaluronidase for 48 were less intense than controls, suggesting that extended enzyme treatment depleted the microtissues of some GAG content.
BMSC and ACh derived microtissues were processed after 14 days of culture, and demonstrated uniform and intense collagen II staining (Figure 4), similar to our previous reports.18,19 When these microtissues were treated with collagenase for 5 min, and then amalgamated, they also stained intensely and uniformly for type II collagen (Figure 4, right column). The silhouette of individual microtissues could be seen in some regions of the amalgamated tissue, although this was much less obvious than in amalgamated tissues formed from microtissues that had been treated with enzyme. When microtissues had been treated with hyaluronidase for 5 min, 30 min, or 48 h, collagen II staining was intense, and uniform, but individual microtissues remained visible within the amalgamated tissue (Supplemental Figure 5). Because hyaluronidase did not appear to improve microtissue integration, most subsequent analysis focused on collagenase treatment.

Immunohistochemistry staining for collagen type II of sections from BMSC and ACh microtissues cultured for 14 days, and also microtissues that had been amalgamated for a further 14 days. First column, 14 day cultured microtissues; second column, microtissues amalgamated without enzymatic treatment; and third column, microtissues amalgamated after 5 min of Collagenase Type II treatment. Scale bars = 100 µm.
Collagen fibril alignment within amalgamated tissues
We used picrosirius red staining and polarized light microscopy to determine how enzyme treatment impacted collagen fibril organization in amalgamated microtissues. Under bright field light, all microtissues and amalgamated tissues stained intensely with picrosirius red suggesting dense collagen fibril content (Figure 5). Using bright field analysis, it was not possible to decern the collagen fibril network between discrete microtissues in the amalgamated product. However, examination of microtissues under polarized light revealed that individual microtissues contained collagen fibrils organized in concentric shells (Figure 5, first column). When BMSC microtissues were amalgamated without enzymatic treatment, the collagen network in discrete microtissues dominated the amalgamated tissue, with the concentric shells of collagen in each microtissue appearing to be independent of the amalgamated mass. Thus, while microtissues had amalgamated, there was little evidence of remodeling and integration of a continuous collagen network between adjacent, amalgamated microtissues. By contrast, when BMSC microtissues had been treated with Collagenase Type II for 5 min, the collagen networks in discrete microtissues had been disrupted, and the concentric shells of collagen fibrils were no longer visible. A collagen network appeared to form in concentric circles around the outside of the amalgamated microtissues, but with little coherent collagen fibril network through the core of the amalgamated tissue.

Picrosirius red staining of collagens in sections from BMSC microtissues cultured for 14 days, and following amalgamation for a further 14 days. Stained tissues sections were assessed either using bright field or polarized light microscopy. First column, 14 days microtissues; second column, microtissues amalgamated without enzymatic treatment; and third column, microtissues amalgamated after 5 min of Collagenase Type II treatment. Image scale bars = 100 µm.
Similarly, ACh microtissues that had been amalgamated without Collagenase Type II treatment, maintained collagen fibril organization that identified each discrete microtissue, rather than a continuous network between microtissues (Figure 6). The impact of collagenase was not as profound for ACh microtissues, although there was, again, a general disruption of the discrete microtissue collagen network, without replacement with an integrated, continuous network between neighboring, amalgamated microtissues.
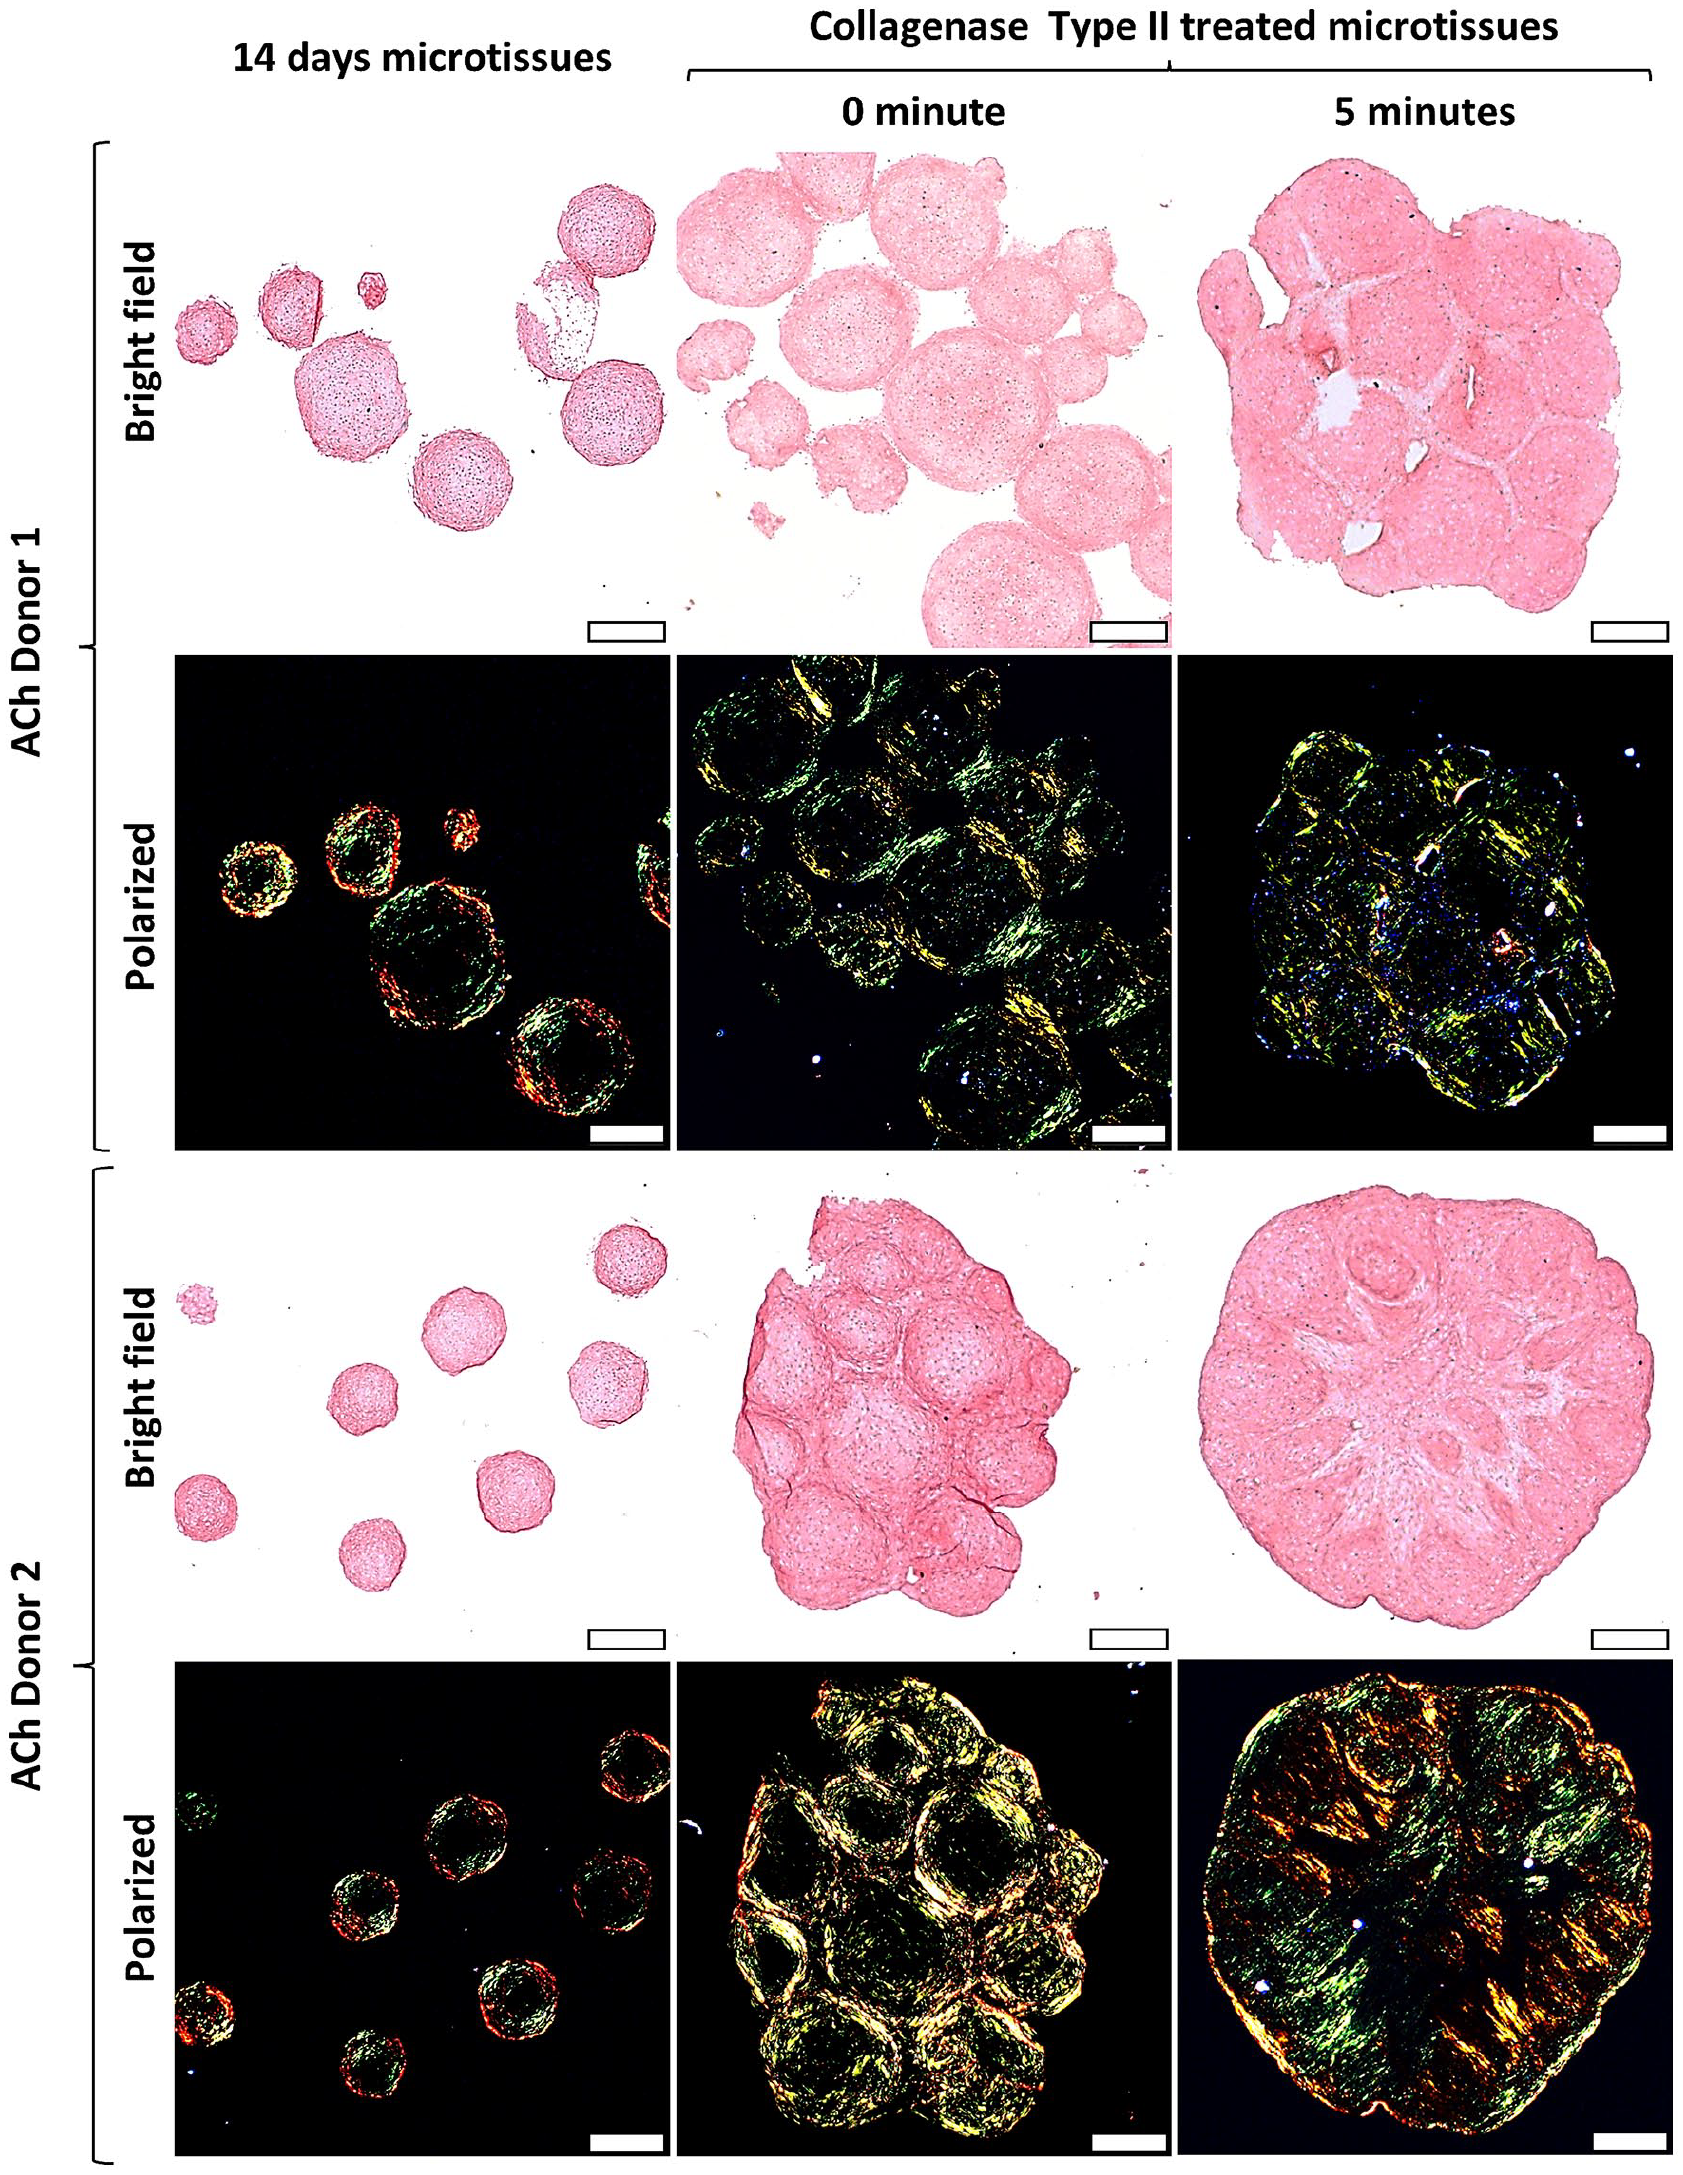
Picrosirius red staining for collagens in sections from ACh microtissues cultured for 14 days, and following amalgamation for a further 14 days. Stained tissues sections were assessed either using bright field or polarized light microscopy. First column, 14 day microtissues; second column, microtissues amalgamated without enzymatic treatment; and third column, microtissues amalgamated after 5 min of Collagenase Type II treatment. Image scale bars = 100 µm.
To better understand the state of the collagen network in microtissues immediately following collagenase treatment, but before further culture, we examined histological sections from these tissues using Alcian blue and picrosirius red staining (Supplemental Figure 4). Immediately following enzyme treatment, cells on the surface of the microtissues could be seen to be partially liberated from matrix in the Alcian blue stained sections, and these cells presumably assisted subsequent integration with other microtissues. However, these Alcian blue stained sections also demonstrated that while there may be some structural damage inflicted on the cartilage matrix, cells within the core of the microtissues remained enclosed in discrete lacunae, and these cells appeared unlikely to be able to traverse the intact matrix separating cells from each other. Picrosirius red staining, and polarized light microscopy revealed that there was damage to the internal collagen network at this early time point, immediately following enzyme treatment.
In contrast to the effects of collagenase, hyaluronidase treatment of ACh microtissues did not result in significant disruption of the collagen network (Supplemental Figure 5). Polarized light microscopy analysis of picrosirius red stained amalgamated tissues revealed that the collagen network associated with discrete microtissues dominated the amalgamated tissues. This pattern was unchanged for 0, 5, 30 min or 48 h of hyaluronidase treatment.
GAG secretion profiles
The amount of GAG secreted or lost into the medium can be used as a surrogate for the rate of GAG accumulation in tissues.18,19 In this study, GAG lost into the medium can also be a useful indicator of matrix integrity following enzymatic treatment. Culture media was collected every 2 days for GAG quantification during the 14-day production of cartilage microtissues. GAG in the culture medium of BMSC donor 2 microtissues was noticeably greater than donor 1 microtissues, although GAG media profiles followed a similar trend (Figure 7(a), and Supplemental Figure S6A). BMSC microtissues released increasing quantities of GAG over the first week of chondrogenic induction culture, but stabilized at a reduced rate towards day 14. The release of GAG from ACh donors 1 and 2 microtissues increased until day 10, and then plateaued at approximately 35 ± 5 µg GAG/mL secreted into culture media (Figure 7(d), Supplemental Figures 6E and 7A).

GAG released into media from BMSC or ACh microtissues and amalgamated microtissues. GAG secreted into the media (a) from BMSC donor 1 (red) and 2 (blue) microtissues cultured for 14 days in the Microwell-mesh, and (b and c) following treatment without (red) or with Collagenase type II for 5 min (blue), and subsequent amalgamation culture for a further 14 days. GAG secreted into the media (d) from ACh donor 1 (gray) and 2 (green) microtissues cultured for 14 days in the Microwell-mesh, and (e, f) following treatment without (gray) or with Collagenase type II for 5 min (green), and subsequent amalgamation for a further 14 days. Data represent mean ± SD of four biological replicates (n = 4). *** represents p < 0.001 compared with controls that were not treated with enzyme. .
We continued to track GAG released into the medium after microtissues were treated with enzyme, and amalgamated into larger tissues. Collagenase treatment caused a greater than 10-fold increase of GAG release for BMSC donor 2 microtissues compared to the non-treated group (Figure 7(c)). By contrast, collagenase treatment led to a three-fold increase in the GAG released into the medium for BMSC donor 1 microtissues (Figure 7(b)). For both BMSC donors 1 and 2, the greatest GAG quantity released as a result of enzymatic treatment was collected within the day 2 medium exchange (2 days after enzyme treatment and amalgamation). For ACh microtissues, collagenase treatment also led to significant GAG release into the medium at the day 2 medium exchange (Figure 7(e) and (f)), with subsequent GAG release being similar between enzymatic and nonenzymatic treatments after day 2.
GAG content retained in microtissues
As described above, it was clear that GAG was released into the medium as a result of collagenase treatment of microtissues. We subsequently quantified the GAG remaining in the amalgamated tissues to see if matrix GAG quantity was restored over the subsequent 14-day culture of the amalgamated microtissues. Figure 8(a) to (c) shows that GAG, DNA, and GAG/DNA quantities in amalgamated BMSC microtissues was reduced with collagenase pre-treatment, but this was only statistically significant for BMSC donor 2. GAG, DNA, and GAG/DNA was significantly reduced for both ACh donors 1 and 2 in amalgamated microtissues that had been pre-treated with collagenase, compared with untreated tissues (Figure 8(d)–(f)).

Quantification of GAG, DNA, and GAG/DNA retained in tissues formed from BMSC or ACh. The data to the right of the dashed line represents data for amalgamated tissues that were cultured following treatment with or without Collagen type II. GAG quantification (a) in BMSC donor 1 (red) and 2 (blue) microtissues cultured for 14 days in the Microwell-mesh, and following treatment without (red) or with Collagenase type II treatment for 5 min (blue) and amalgamated for additional 14 days. DNA quantification (b) was measured for each condition, and GAG/DNA (c) was calculated for each tissue condition. GAG secreted into the media (d) from ACh donor 1 (gray) and 2 (green) microtissues cultured for 14 days in the Microwell-mesh, and following treatment without (gray) or with Collagenase type II treatment for 5 min (green) and amalgamation for 14 days. DNA quantification (e) was measured for each condition, and GAG/DNA (f) was calculated for each tissue condition. Data are presented as mean ± SD of four biological replicates (n = 4). *** represents p < 0.001 compared with controls that were not treated with enzyme.
Mechanical assessment of amalgamated microtissue
The mechanical properties of BMSC and ACh cartilage microtissues and their amalgamated counterparts were characterized using a CellScale Microtester G2. The force and tip displacement data were obtained for each type of cartilage microtissue and amalgamated tissue, and the Hertzian half-contact mechanic and contact formula used to estimate Young’s modulus (Figure 9). Microtissues formed from both BMSC and ACh donors, and cultured for 14 days, demonstrated a similar stiffness, of approximately ~400 kPa. Following a further 14 days of amalgamation culture, the BMSC tissue’s stiffness increased by 39% for Donor 1 and 36% for Donor 2 (Figure 9(a)). By contrasts, the stiffness of amalgamated ACh tissues remained similar to individual ACh microtissues (Figure 9(b)). When Donor 1 BSMC and Donor 1 ACh microtissues were treated with enzyme before amalgamation, the tissues were similar to controls generated without enzyme treatment. However, Donor 2 BMSC and Donor 2 ACh enzyme treated tissues were 61% and 69% less stiff than non-enzyme treated controls.

Mechanical assessment of BMSC and ACh derived microtissues, and amalgamated tissues without or with Collagenase Type II pre-treatment. The data to the right of the dashed line represents data for amalgamated tissues that were cultured following treatment with or without collagenase. (a and b) represents Young’s modulus of the BMSC and ACh derived cartilage tissues, respectively. Data represent mean ± SD (n = 4). p < 0.05 compared with untreated (0 min) amalgamated microtissues.
Discussion
A major challenge associated with cartilage defect repair is achieving high-quality integration between the repair tissue and remaining native tissue. ACh are effectively trapped within lacunae by the dense matrix in mature cartilage tissue, preventing them from migrating to the repair tissue interface, and remodeling the dense matrix at this interface. 2 If physical entrapment, and matrix density, is the cause of impaired integration, then disrupting the matrix with enzymatic treatment could theoretically improve tissue integration. Various studies have evaluated the capacity of enzymes such as collagenases,9–13 chondroitinase, 14 hyaluronidase,9,10 or trypsin 15 to disrupt established cartilage matrix, and facilitate integration of cartilage repair tissue. However, thus far, there is no accepted enzymatic protocol to improve cartilage tissue integration. A barrier to the successful development of such protocols may be the labor-intensive models used to evaluate the capacity of enzymatic treatment to improve cartilage tissue integration. Herein, we adapted a high throughput microtissue model, commonly used to study cartilage tissue development,18,19 to evaluate the capacity of Collagenase Type II or hyaluronidase to facilitate cartilage tissue integration.
We initially characterized the effect of 5, 15, or 30 min of Collagenase Type II treatment on BMSC and ACh microtissues. For both BMSC and ACh microtissues, 5 min of collagenase treatment significantly improve amalgamation, relative to the amalgamation of control microtissues that had not been exposed to enzyme. Increasing collagenase treatment beyond 5 min was not beneficial for either BMSC or ACh microtissues, and so all subsequent collagenase treatments were performed for 5 min only. In contrast to Collagenase Type II, 5 min, 30 min, or 48 h of hyaluronidase treatment did not appear to modify the amalgamation of ACh microtissues. Cells at the surface of cartilage microtissues are typically only loosely confined within lacunae, and these cells can contribute to remodeling and bridging of microtissues with each other during amalgamation. Following 5 min of collagenase treatment cells near the surface of microtissues can be seen to be increasingly liberated from matrix, and this outcome is obvious in histological images of these microtissues (Supplemental Figure 4). These liberated cells likely contribute to improved integration following enzyme treatment. Effectively, these observations mirror previous studies which report that collagenase treatment enabled the migration of ACh out of enzyme treated tissues into the wound edge, resulting in improved integration and biomechanical properties of the resulting repair tissue.9–12
In the 2 days following collagenase treatment, the amalgamated microtissues lost considerable GAG into the culture medium. GAG elution tapered after approximately 2 days culture, suggesting that, at least superficially, the tissue had recovered from enzyme treatment or had stabilized. At the end of 14 days culture following amalgamation, Donor 1 BMSC microtissues, which had been treated with collagenase, accumulated GAG matrix (GAG/DNA) similar to amalgamated microtissues that had not previously been treated with enzyme. While GAG/DNA content was lower in the other amalgamated tissues, these tissues accumulated a reasonable 5–15 µg/µg GAG/DNA matrix content. While this is less GAG/DNA content than the controls in this study, such a GAG/DNA quantity may be viewed as reasonable in historical contexts. For example, in a previous study, before we routinely supplemented BMSC expansion medium with FGF-1, we would frequently observe that tissues accumulated approximately 2–5 μg/μg GAG/DNA over 14 days of induction culture. 17 Nevertheless, the reduced GAG content in some of amalgamated tissues reported here indicated that enzyme treatment could be compromising tissue quality.
Histological sections of amalgamated tissues stained with Alcian blue or anti-collagen type II yielded images that suggested that amalgamation was improved when tissues were treated with collagenase for 5 min. To better understand the quality of the collagen network we stained sections with Picrosirius red stainings, and imaged tissue slices using polarized light microscopy. Polarized light characterization of individual microtissues revealed that the collagen fibril network within single microtissues was organized in concentric layers or shells through the diameter of the spheroids. When BMSC or ACh microtissues were amalgamated without enzymatic treatment, a collagen network formed between the tissues, but the pattern of concentric layers within each microtissue remained intact, seemingly undisturbed. Thus, while a collagen bridge connected these adjacent microtissues, the collagen network within individual microtissues had not remodeled, and the network within individual microtissues remained discrete. Ultimately, analysis of Alcian blue and collagen II antibody-stained tissue suggested reasonable integration, while analysis of the collagen fibrils revealed that the integration of collagen fibrils throughout the bulk amalgamated tissue was only modest.
When BMSC or ACh microtissues were treated with Collagenase Type II, integration appeared to be incrementally improved when assessed using histology sections stained with Alcian blue or anti-collagen II antibody. However, when sections were stained with Picrosirius red, and visualized using polarized light, it was apparent that enzyme treatment had disrupted the collagen network within microtissues. While we report on only four cell populations (2 × BMSC donor and 2 × ACh donors), this critical outcome was consistent across all experimentation. Effectively the concentric shells of collagen visible in unmanipulated microtissues was no longer discernible, and any subsequent remodeling did not appear to yield an obvious alternative continuous network. A ring of collagen fibrils formed around the outside of the amalgamated microtissues, likely tracking the attachment of cells that coated the surface of the bulk amalgamated tissue. Thus, while Alcian blue or anti-collagen II staining gave the appearance of improved amalgamation following collagenase treatment, analysis of the collagen network made it clear that remodeling over the 14-day culture period was insufficient to restore the fibril network damaged by the enzyme. Treatment of cartilage microtissues with hyaluronidase did not appear to modify tissue integration, and hyaluronidase did not modify the collagen network within discrete microtissues that made up the amalgamation. These data suggested that failure of the enzyme, hyaluronidase, to disrupt the collagen fibril network limits the capacity of this enzyme to modulate microtissue integration.
A critical observation from this study is that the lacunae structures in the microtissue cartilage appeared to remain intact following collagenase treatment. Thus, while enzyme treatment was aggressive enough to disrupt the collagen network, the remaining matrix was sufficiently intact to retain cells within discrete lacune, and this intact matrix also likely prevented cell migration and matrix remodeling within the cores of the microtissues. This creates a paradox where even catastrophic damage to the collagen network is insufficient to enable the cell migration required to repair the network. It is possible that extending the culture time, or implanting the tissue in vivo, would provide the time required to restore the collagen network, but it is more likely that the restricted movement of the cells will prevent the remodeling required to generate a durable articular cartilage-like tissue. Based on these observations we developed the model shown in Figure 10. The summary of Alcian blue stained sections (Figure 10(a)–(d)), extracted from the previously presented studies in the Results section, demonstrate that while collagenase treatment may damage the collagen network, cells within the interior of the microtissue remain trapped within lacunae and are physically separated from each other. As a result, the model presented in Figure 10(e) and (f) shows that brief enzyme treatment will result in collagen network damage that the cells will likely never be able to access to adequately repair or remodel. It is true that there may be some repair of damaged matrix via enzymes that can diffuse from cells into the matrix, 33 but if the cells cannot access the damaged matrix then new fully intact collagen fibrils will not be laid down. The inability of cells in our model to remodel the collagen between them is consistent with data demonstrating that collagen turnover in mature cartilage is minimal; previous studies used isotope tracking to demonstrate that there was effectively negligible collagen turnover in adult articular cartilage. 34 Because of the fixed position of ACh in lacune, it may be that attacking the collagen network will inevitably lead to damage that cannot be repaired through a remodeling process.

Model of collagenase damage and failure to repair or remodel. Tissues are stained with Alcian blue, and counterstaining with Nuclear fast red. At all time points, cells are contained in lacunae, and have limited capacity to repair collagen network damage in the matrix between lacunae. (a) Image of a Alcian blue stained section of BMSC microtissue cultured for 14 days, and which has not been treated with enzyme. (b) Image of a Alcian blue stained section of BMSC microtissue cultured for 14 days, and which has been treated with collagenase for 5 min. (c) Image of a Alcian blue stained section of BMSC microtissues cultured for 14 days, treated with collagenase for 5 min, and amalgamated for 7 days. (d) Image of a Alcian blue stained section of BMSC microtissues cultured for 14 days, treated with collagenase for 5 min, and amalgamated for 14 days. (e and f) Model of how collagen network could be damaged between cells, and how this matrix may not be within reach of cells to enable remodeling. Solid orange bars are intended to represent intact collagen fibrils, while dashed bars are intended to represent collagen fibrils damaged to some extent by the enzyme treatment. Scale bars = 50 µm.
We considered that perhaps briefer collagenase treatment could be beneficial. However, variation in data derived from the 5-min enzyme treatment provides useful insight into the strengths and weaknesses of incrementally more or less breakdown of the collagen network. For example, ACh Donor 2 microtissues (Figure 6) had slightly greater collagen network damage than Donor 1, and as a result Donor 2 microtissues integrated together slightly better. Perhaps the most valuable insight is that within each amalgamated structure, the areas that integrated the best also appeared to have suffered the greatest damage to the collagen network in those localized areas (see Figures 5 and 6). This pattern was true for ACh and BMSC microtissues from both donors. Like the previous analysis, these data suggests that the 5-min digestion time is likely the right order of magnitude, but that improved integration appeared to be strongly correlated with local collagen network damage.
Mechanical data from amalgamated microtissues suggested that enzyme treatment did compromise the Young’s modulus of the tissue. Reduced GAG/DNA matrix content in some enzyme treated tissues did correlate with reduced stiffness. The tests executed in our studies evaluated the stiffness/modulus of the tissue but did not assess tissue durability. One of the remarkable features of cartilage is its capacity to withstand millions of compressive cycles over a lifetime. 35 It is possible that the modest drop in Young’s modulus as a result of enzyme treatment underestimates the impact collagen network damage could have on tissue durability. While we are advocates for the use of picrosirius red staining in combination with polarized light to characterize collagen networks and tissue integration, we also acknowledge its limitations. Picrosirius red staining in combination with polarized light provides greater resolution of the collagen network than antibody staining, but this remains a relatively superficial and qualitative tool. For example, there could be many small cuts on a fibril, and these defects might not be detected using this staining and imaging method. For this reason, even this method may underestimate the amount of collagen damage or possibly overestimate remodeling repair. Because of the challenge of inflicting and quantifying a precise amount of damage to the collagen network, it might be more useful to model this phenomenon. Models could be used to assess incremental network damage and possible improvements in integration at the tissue interface, and with the goal of predicting how much of an improvement in integration would be required to offset varying amounts of collagen network damage, especially in the context of tissue durability.
Studying microtissue amalgamation may also provide insight into clinical cartilage repair processes where cartilage defects are filled with spheroids, such as the process used by co.don AG.36,37 In their clinical process, spheroids formed from 3 × 10⁵ ACh each, cultured for 21 days, and then implanted into cartilage defect sites. Our data suggest that there is little remodeling of the collagen network within discrete microtissues cultured for 14 days, and we speculate the spheroids used by co.don AG will also maintain discrete collagen networks, rather than assimilate into a fully integrated tissue. Like our own microtissues, it is likely that each of the spheroids used by co.don would be connected by a ribbon of collagen wrapping over the surfaces of each of the spheroids, and likely this ribbon of cells/tissue will function to anchor the repair tissue to the subchondral bone. We cannot find examples of their tissue stained with Picrosirius red staining and examined under polarized light. The maintenance of discrete collagen networks within each spheroid is likely not optimal, but equally, it may also be possible that this outcome is better than current alternatives; phase III trial data from co.don’s work are yet to be released, but should provide useful efficacy data. 38 Understanding how spheroids integrate with each other, and how they adjacent to tissue, is likely to identify opportunities to improve the use of spheroids as fill material, and possibly opportunities to improve the durability of repair tissue.
Limitations in this study include focus on enzyme treatment of cartilage microtissues that had been cultured for 14 days. In previous work we demonstrated that cartilage microtissues cultured for less than 4 days integrated better than those cultured for 7, 9, or 14 days. 27 While it was our intention in this paper to study the impact of enzyme treatment on the integration of relatively mature cartilage tissue, there may be merit in assessing the benefit of enzyme treatment using less developed tissues, thus effectively pursuing optimization in a less challenging model. A flaw in this approach is that it is integration with mature native cartilage tissue that is most challenging, and thus focus on less mature tissue may be moot. There also may be merit in assessing combinations of enzymes; perhaps a combination of enzymes would enable improved microtissue integration with briefer collagenase exposure, thereby minimizing damage to the internal collagen network. Finally, it is possible that enzyme digestion times and concentrations could be further optimized, and that extended cultures or even animal models could be used to validate that our short-term culture observations persist long-term. Because of the afore mentioned challenge of quantifying collagen network damage, we believe there would be merit in modeling this process prior to proceeding with additional experimental work, and especially before investing in animal models.
In this paper we demonstrate that microtissues can be used to efficiently generate uniform substrates to evaluate the merit of different enzymatic treatment on cartilage tissue integration. The repetitive tissue unit organization facilitates efficient detection and quantification of patterns associated with treatment outcomes. While enzymatic treatment has conceptual appeal for improving cartilage tissue integration, we were not able to prove that this approach has merit. Importantly, the data generated here suggest that integration of cartilage tissue appears to require disruption of the collagen fibril network, but that, paradoxically, it appears that this network is unlikely to be restored once damaged. To our knowledge, none of the previous studies which have evaluated the use of enzymes to facilitate cartilage tissue integration have used Picrosirius red staining in combination with polarized light to characterize collagen networks and tissue integration. Our data highlight that while traditional Alcian blue or anti-collagen type II staining may suggest high quality tissue integration, Picrosirius red staining of the same tissue, and analysis using polarized light, may reveal a collagen network that is fragmented or disconnected. Because effective cartilage integration is dependent on the quality of the collagen network, we suggest that Picrosirius red staining and analysis using polarized light should be incorporated into future studies. Finally, because Picrosirius red staining and analysis using polarized light may not identify small defects in the collagen network, we recommend that researchers consider whether repair of damage inflicted by enzymes is feasible and include this consideration in their conceptual thought analysis or modeling.
Supplemental Material
sj-docx-1-tej-10.1177_20417314221074207 – Supplemental material for Collagenase treatment appears to improve cartilage tissue integration but damage to collagen networks is likely permanent
Supplemental material, sj-docx-1-tej-10.1177_20417314221074207 for Collagenase treatment appears to improve cartilage tissue integration but damage to collagen networks is likely permanent by Md. Shafiullah Shajib, Kathryn Futrega, Travis Jacob Klein, Ross W Crawford and Michael Robert Doran in Journal of Tissue Engineering
Footnotes
Acknowledgements
The authors thank the TRI Histology Facility for help with tissue processing and sectioning, and the Mater Hospital for BMA collection.
Author Contributions
MSS, KF, TJK, RWC, and MRD designed research, analyzed data, and wrote the paper; MSS, KF, TJK, and MRD performed research. MSS prepared the data and the figures.
Data
The datasets used and/or analyzed during the current study are available from the corresponding author on reasonable request.
Declaration of conflicting interests
The author(s) declared no potential conflicts of interest with respect to the research, authorship, and/or publication of this article.
Funding
The author(s) disclosed receipt of the following financial support for the research, authorship, and/or publication of this article: MRD, RWC, and TJK gratefully acknowledge project support from the National Health and Medical Research Council (NHMRC) of Australia (Project Grant APP1083857) and NHMRC Fellowship support of MRD (APP1130013). The Translational Research Institute (TRI) is supported by Therapeutic Innovation Australia (TIA). TIA is supported by the Australian Government through the National Collaborative Research Infrastructure Strategy (NCRIS) program.
Ethics
Bone marrow aspirates were collected from informed and consenting volunteer healthy adult human donors at the Mater Hospital, Brisbane, Australia. Ethics approval for aspirate collection was granted by the Mater Health Services Human Research Ethics Committee and the Queensland University of Technology Human Ethics Committee. Articular chondrocytes were collected from with the approval of Holy Spirit North Side Hospital Human Ethics Committee and the Queensland University of Technology Human Research Ethics Committee.
Supplemental material
Supplemental material for this article is available online.
References
Supplementary Material
Please find the following supplemental material available below.
For Open Access articles published under a Creative Commons License, all supplemental material carries the same license as the article it is associated with.
For non-Open Access articles published, all supplemental material carries a non-exclusive license, and permission requests for re-use of supplemental material or any part of supplemental material shall be sent directly to the copyright owner as specified in the copyright notice associated with the article.