
Abstract
Peripheral nerve injury and the associated muscle atrophy has an estimated annual healthcare burden of $150 billion dollars in the United States. When considering the total annual health-related spending of $3.5 trillion, these pathologies alone occupy about 4.3%. The prevalence of these ailments is rooted, at least in part, in the lack of specific preventative therapies that can be administered to muscle while it remains in the denervated state. To address this, skeletal muscle-derived ECM (skECM) was injected directly in denervated muscle with postoperative analysis performed at 20 weeks, including gait analysis, force production, cytokine quantification, and histological analysis. skECM was shown to be superior against non-injected muscle controls showing no difference in contraction force to uninjured muscle at 20 weeks. Cytokines IL-1β, IL-18, and IFNγ appeared to mediate regeneration with statistical regression implicating these cytokines as strong predictors of muscle contraction, showing significant linear correlation.
Keywords
Introduction
The status of data relevant to nerve injury and muscle atrophy are unfavorably staggering. Currently about 20 million Americans are dealing with PNI/MA-related ailments, or about 6 out of every 100 people. 1 Annually, 3 out of every 100 admittances to a trauma center are specific to a nerve injury. 2 Admittances for PNI affects males disproportionately, with rates being 85% men of 39.9 ± 14.2 years of age. 3 Slower and poorer quality healing in the aging population is also well reported.4,5 Patients who experience nerve injury are then more likely to be diagnosed with chronic pain. As muscle atrophy progresses, this population is exceedingly likely to require physical therapy and/or occupational therapy services for more than 3 months post-injury. 6 Surveys of this patient population 1 year post-injury report 40% as being unable to return to work due to residual complications.7,8 Taken together, the annual United States expenditure on PNI/MA is approximated to be $150 billion annually, 9 or when considering the totality of annual US health-related spending, $3.5 trillion, 10 PNI/MA occupies about 4.3%.
To address this profound clinical and socioeconomic challenge, an intramuscular therapy was studied in a nerve transection injury model with the aim of mitigating denervation atrophy. The rodent sciatic nerve transection and repair model was leveraged for inducing atrophy of skeletal muscle. A skeletal muscle-derived extracellular matrix (skECM) was then injected directly into the gastrocnemius to mitigate denervation atrophy. Two preparations of skECM were compared, being a micronized, particulate format (p-skECM) and a pepsin-digested format (d-skECM). The process for rendering skECM was based on previously published protocols, 11 though a peracetic acid (PAA, 1% [v/v]) disinfection step is added to the process after decellularization given the sterility requirement of FDA-regulated ECMs, historically being medical devices. 12 Further, the process of making a particulate skECM reduces time in the overall process, and minimizes the handling time of the preparation, therefore reducing the probability of contamination after the disinfection process. These skECM preparations elucidate homologous use cases of skECM, that is, an ECM of skeletal muscle being injected into skeletal muscle rather than an ECM of some other tissue-based origin.
Methods
Decellularization of porcine skeletal muscle
Figure 1 displays the process flow to create skECM. Skeletal muscle was harvested from the hindlimbs of recently-deceased Yorkshire pigs and then frozen at −80°C until processing. Prior to chemical exposure, muscle was cut into segments of approximately 1 cm3. Segments were processed in an Erlenmeyer flask at a mass-to-solution ratio of 1 g tissue to 10 ml solution; this mass-to-solution ratio was maintained throughout the decellularization and disinfection processes and was performed under constant stirring set to 400 rpm. SDS, Triton X-100, and PAA solutions were all 1% concentration in DI water (all chemicals, Millipore Sigma, St. Louis, MO). PAA-based disinfection and all subsequent processes were performed aseptically, in a biosafety cabinet to maintain sterility. After disinfection, rinses of 1 ×PBS and DI water ensued where PAA was considered sufficiently removed when colorimetric PAA test paper no longer reacted with rinsate (MQuant, 5–50 mg/l PAA, Millipore Sigma), typically after four rinses in 1 × PBS and an additional two to four rinses in DI water.

Flow diagram for producing skeletal muscle-derived extracellular matrix (skECM) in particulate (p-skECM) and digested (d-skECM) formats.
After thoroughly rinsing, skECM was frozen overnight at −80°C and then freeze dried for 20–24 h (FreeZone 2.5 l Benchtop Freeze Dryer, Labconco, Kansas City, MO). The freeze-dried skECM then diverged for preparing either p-skECM or d-skECM. For p-skECM, freeze-dried skECM was milled into a fine particulate (A11 Basic Analytical Mill, IKA, Wilmington, NC). For preparing d-skECM, freeze-dried skECM was digested in a pepsin hydrochloride (HCl) solution in 1N HCl (10 mg pepsin HCl per 1 mg tissue dry weight) under constant stirring for 72 h. The d-skECM was titrated to neutral with 10 × PBS and again freeze dried. Both skECM preparations were sealed and stored at ambient temperature until rehydration at 8% [w/v] in injectable saline, and then injected.
Scanning electron microscopy
skECM samples were prepared for scanning electron microscopy (SEM) via hydration to their target injection concentration of 8% [w/v]. All samples were cryo-sectioned at 8 µm onto glass slides, fixed in 10% neutral buffered formalin, rinsed in 95% ethanol, and then rinsed with water via 60-s submersions. Slides were dried at ambient temperature prior to sputter coating. Sputter coating and SEM were performed on native porcine muscle and both preparations of skECM. Samples were sputter coated with a gold/palladium mixture for 60 s at 20 milliamperes (Desk V TSC Turbo Molecular-Pumped Sputter Coater, Denton Vacuum, Moorestown, NJ) followed by SEM at 200×, 500×, and 1000× magnifications (Zeiss Sigma VP, Oberkochen, Germany).
Transection injury to the sciatic nerve and intramuscular skECM injection
Figure 2(a) illustrates relevant anatomy of the rodent hindlimbs, where all rats had one limb (Contralateral) unoperated and the other transected (Injury). To induce injury to the sciatic nerve (n = 24), the surgical site was prepared by shaving the fur with an electric razor. The sciatic nerve was accessed via 2 cm transverse incision at the inguinal region of the right hindlimb. The gluteus muscle was dissected to expose the sciatic nerve, and injury was induced by transecting the nerve approximately 0.5 cm from the bifurcation (Figure 2(b)–(d)). The transection was repaired with 9–0 nylon microsuture (Microsurgery Instruments, Inc., Bellaire, TX) and the wound was then closed with 5–0 absorbable suture (Ethicon, Somerville, NJ) (Figure 2(e)).

Relevant anatomy and images of wound creation and skECM injection: (a) callouts of relevant anatomy in the hindlimbs, (b) exposure of the sciatic nerve, (c and d) transection of the sciatic nerve, (e) repair of the wound site used to access the sciatic nerve, and (f and g) injection of skECM into the gastrocnemius.
Rodents received one of two intramuscular therapies, being either p-skECM (n = 8) or d-skECM (n = 8). Approximately 0.50 cc of either skECM preparation was injected into the gastrocnemius immediately after closure of the wound. The needle was inserted through skin at the base of the Achilles tendon, extending proximally on the hindlimb, and therapy was injected over approximately five passes (Figure 2(f) and (g)). The gastrocnemii of Control limbs (n = 8) were not manipulated.
Walking track analysis
To assess changes in gait, a walking track was designed (Solid Works CAD/CAM Dassault Systems, Waltham, MA) and fabricated in three parts: The Door, the Main Segment, and the End Segment (Figure 3(a)). Main Segments had the dimensions of 10 cm length by 8 cm width, where six bores (6 mm diametrical by 3 mm deep) were designed into both faces of the part such that magnets could be press-fitted into the faces. Eight Main Segments were 3D printed using polylactic acid (Raise3D, Irvine, CA), each having magnets press-fitted into their faces, simplifying assembly, disassembly, and cleaning after each use. The Door was designed to hang over the walls of each Main Segment, and the End Segment covered both the top and the rear exit, creating a darkened space. Each rodent’s hind-feet were coated with water-soluble paint, which imprinted footprints onto the paper laid into the track. Six footprints per walk were used to calculate sciatic function index (SFI) with representative contralateral and injured prints shown in Figure 3(b). Evaluators were blinded to groups prior to walking. SFI was performed consistent with the previous methods 13 with the equation presented in Figure 3(b).
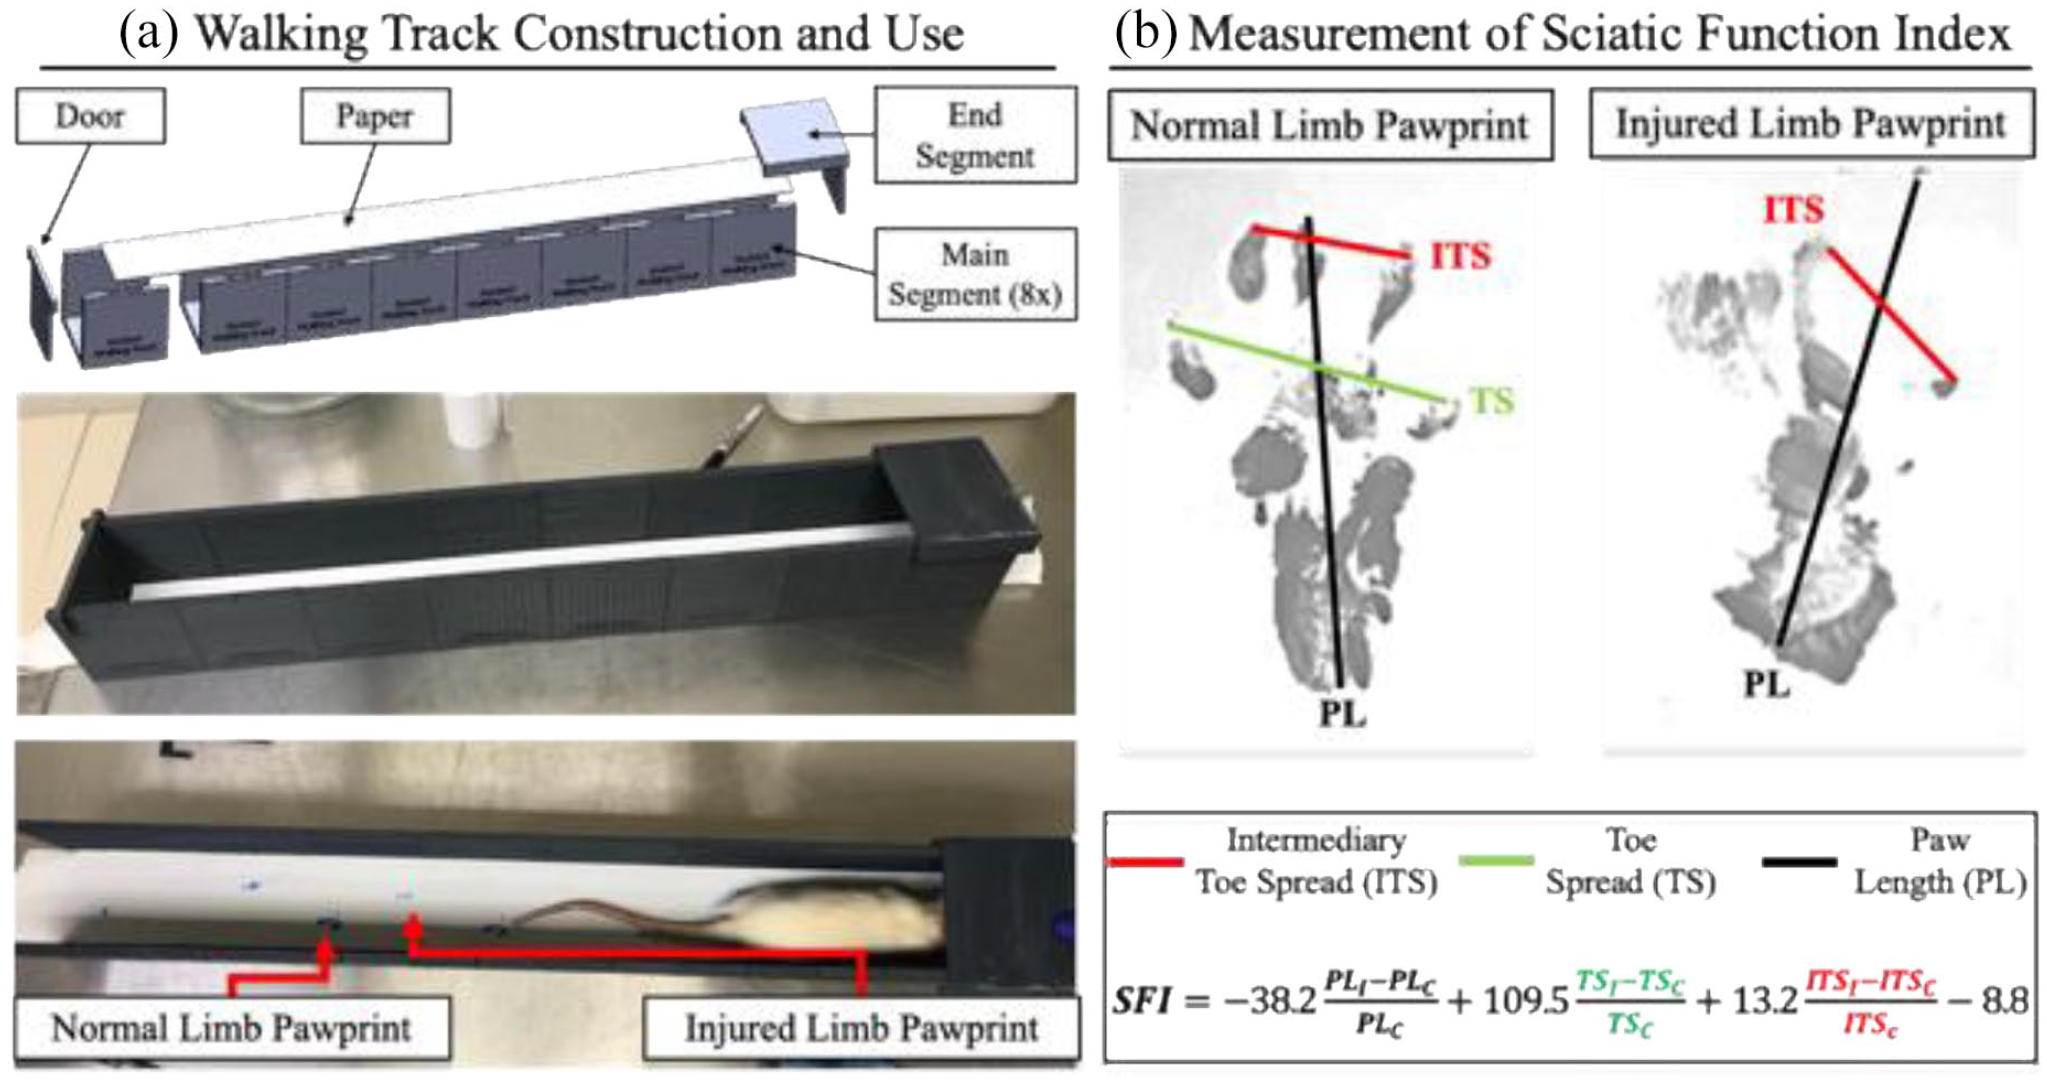
(a) A walking track was designed in CAD and 3D printed for use in measuring toe spread during rodent gait and (b) representative pawprint images of Control rodent and the relevant line measurements for calculating the sciatic function index (SFI). In the SFI equation, subscripts of “i” and “c” denote injury and contralateral, respectively.
Contraction force measurement
Nerve stimulatory cuffs (1 cm length) were fabricated from 1/16″ ID Tygon tubing (McMaster-Carr 5155T12); two de-insulated wires (Cooner Wire AS-631) were inserted through tubing and glued into place 5 mm apart (Supplemental Figure 1A). Each rodent was sedated in 2% isoflurane in oxygen, the gastrocnemius was dissected by cutting the calcaneus, and then securing the bone to a load cell. A custom gantry was used to secure the knee (Supplemental Figure 1B). Stimulation was induced by stimulus isolator at 0.50 mA (A320, World Precision Instruments, Sarasota, FL), and the contraction force of the load cell was read via MyDAQ coded in LabVIEW (NI, Austin, TX). Optimum fiber length was established by tensioning gastrocnemii until the highest twitch force was established. Tetanic force generation was induced via stimulations at 1, 10, 20, 30, 40, 50, 60, 70, 80, 100, and 150 Hz, each over a 1 s duration. After stimulations of ⩽80 Hz, 40 s of rest was allocated, and at 100 and 150 Hz, 60 s were allocated. Animals were euthanized via CO2 asphyxiation on completion of electrophysiology, and their gastrocnemii and tibialis anterior (TA) muscle harvested from both hindlimbs for mass measurements, protein quantification and/or histological staining. All rodent experimentation was approved by the University of Pittsburgh Institutional Animal Care and Use Committee (IACUC).
Histology
All samples were stored at −80°C. All samples were prepared at the McGowan Institute for Regenerative Medicine Histology Core Laboratory (University of Pittsburgh, Pittsburgh, PA), where 8 µm cryo-sections were cut and mounted from frozen blocks. Slides were stained with Masson’s trichrome (American MasterTech, Lodi, CA), and Oil Red O (O0625, Millipore Sigma), each per manufacturer’s instructions. All images were captured on using BZ-X800 Biological Microscope (Keyence, Itasca, IL).
Protein quantification
Samples were minced with fine surgical scissors and then were extracted in 4 M guanidine HCl in 0.05 M Trizma Base (both Millipore Sigma, St. Louis, MO) at an approximate ratio of 1 g tissue per 5 ml extractant over 3 days, inverting constantly. Samples were exposed to 2.5 ml extractant over the first 24 h and then an additional 2.5 ml extractant over the following 48 h. Extractants were combined, purified using 15 k MWCO filtration columns (4200 rpm for 30 min at 4°C), and then reconstituted in 1 × PBS (diluted 1:4). Quantification of granulocyte/macrophage colony stimulating factor (GM-CSF), interferon (IFN)-γ, interleukin (IL)-1β, IL-4, IL-6, IL-10, IL-13, IL-18, tissue inhibitor of metalloproteinases (TIMP)-1, tissue necrosis factor (TNF)-α, and vascular endothelial growth factor (VEGF) was performed using a Luminex assay (LXSARM-12, R&D Systems, Minneapolis, MN) via Bio-Plex 200 (Bio-Rad, Hercules, CA). Enzyme-linked immunosorbent assays (ELISA) were used to quantify insulin-like growth factor (IGF)-1 (MG100, R&D Systems) and muscle skeletal receptor tyrosine-protein kinase (MuSK, MBS943725, MyBioSource, San Diego, CA). Absorbance from both ELISAs were measured using a Tecan Infinite 200 Pro (Switzerland) plate reader at 450 nm with wavelength correction at 570 nm. All protein expressions are presented as normalizations to contralaterals.
Statistical analysis
JMP Pro (Cary, NC) was used for all analyses. Robust ANOVA with Bonferroni post hoc corrections were used for comparing SFI measurements and muscle masses. Repeated Measures ANOVA with Tukey HSD post hoc was used to compare force output. In both uses of ANOVA, normality of residuals were verified with a Shapiro-Wilk W test prior to analyses. Prior to analyses of multiplexing data, distributions were assessed for goodness of fit based on their relative Akaike information criterion (AIC), an estimator of the prediction error within a given dataset, providing probabilistic weight on whether a sample originates from a given distribution. The distribution hypothesis was tested using Anderson-Darling. Generalized Regression based on the assessed distribution were used to determine difference of groups using Tukey post hoc. For regression analyses, correlations above R2 > 0.75 were considered strong, correlations within 0.75 ⩾ R2 ⩾ 0.25 were considered moderate, and correlations with R2 < 0.25 were considered weak. Significance was considered at p < 0.05 throughout.
Results
Microstructure of porcine muscle and skECM
Figure 4 displays the surface topography and structure of native porcine muscle, p-skECM and d-skECM by SEM. The myofiber striations can be appreciated in the native porcine muscle, indicative of the normal skeletal muscle structure. Both p-skECM and d-skECM image sets occur after substantial chemical exposure though the decellularization, disinfection, and digestion (d-skECM) processes. From these, the resulting p-skECM is a porous scaffold with few lose fibrillar strands; conversely, the d-skECM scaffold is shown as increasingly weblike relative to the p-skECM, where the pores are more akin to a collagenous meshwork.

Scanning electron microscopy at 200×, 500×, and 1000× magnifications of native porcine muscle, partulate skECM (p-skECM), and digested skECM (d-skECM).
Walking track analysis
Results of the walking track analysis are presented in Figure 5, where Figure 5(a) displays representative pawprints from the Contralateral and Injury Conditions at Week 1 and Week 20. In all cohorts, there was improvement of SFI within each Cohort over the 20-week duration, with the Control showing the least significant increase (p = 0.049) relative to the skECM Cohorts, where both showed more significant recovery (both, p < 0.0001). Both skECM preparations resulted in significantly higher SFI values at 20 weeks when compared to Control at 20 weeks, (both, p < 0.001). Resulting SFI from the skECM preparations were not significantly different from one another (Figure 5(b), p = 0.573), where the fidelity in toe-spread can be appreciated in the representative images at 20 weeks, especially when compared to that of the Control. Additionally, R2 values trend better toward linear correlation in the skECM Cohorts (both moderately correlated, that is 0.75 ⩾ R2 ⩾ 0.25, relative to Control (weakly correlated, R2 < 0.25).
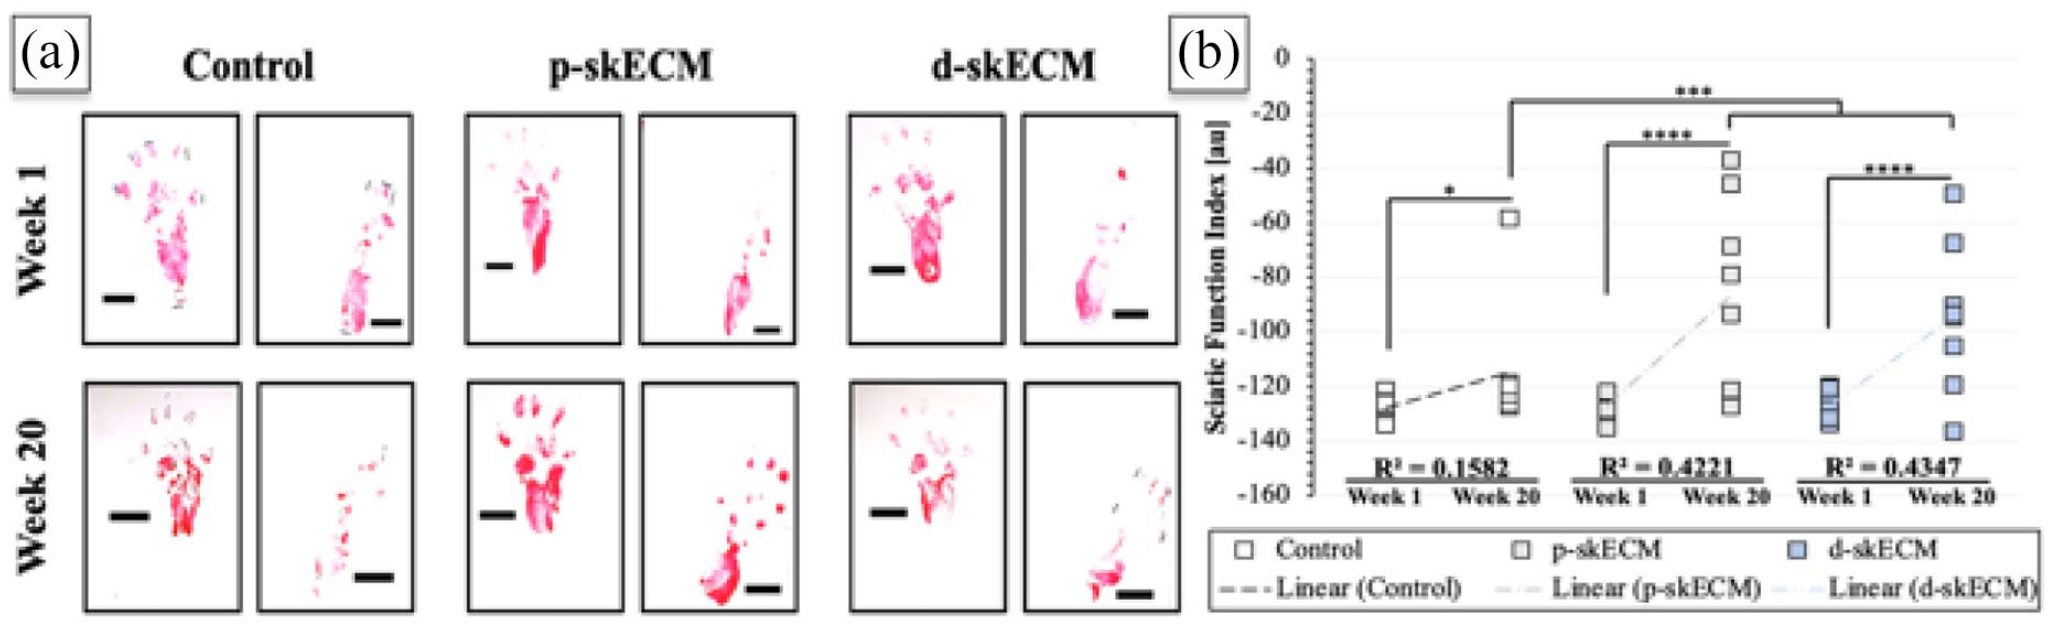
(a) Representative pawprints at Week 1 and Week 20 across conditions and (b) results from SFI measurement across Cohorts where boxes are individual measurements.
Gastrocnemii and TA muscle mass analysis
Supplemental Figure 2 presents the gastrocnemii and TA masses, where the injured muscle is normalized to the contralateral (left) as well as normalized to the overall rodent body mass (right). Cohorts’ gastrocnemii present statistical difference when normalizing either by the contralateral or the body mass; animals treated with d-skECM were shown to have significantly higher massed gastrocnemii relative to Control (p < 0.01) when normalizing by the Contralateral gastrocnemius mass, though this comparison does not hold when normalizing to the body mass of the rodent (no significance when comparing groups). When comparing TA normalizations however, the trends are not affected; as shown in both normalizations of the TAs distal to the sciatic nerve transection, both cohorts receiving an skECM injection into the gastrocnemius resulted in larger TA muscles than the Control (all, p < 0.001). No statistical differences were shown between the two cohorts receiving skECM preparations regardless of normalization. Note that no manipulation was performed on the TA muscles, and the skECM preparations were injected into the gastrocnemius only.
Muscle contraction force
Figure 6 presents the force outputted by gastrocnemii normalized by the rodent body mass as well as normalization based on the mass of the gastrocnemius, respectively. In both figures, frequency sweeps (left) and the tetanic contraction forces (right) are shown, where stimulation of the sciatic nerve at 100 Hz induced the strongest contraction force of the contralateral, uninjured gastrocnemii. When normalized to the rodent body mass, it can be seen in the frequency sweep that the Contralateral gastrocnemii were able to generate more force compared to any other group. In the chart breaking out the force generated at 100 Hz stimulation, the contraction force generated by Contralateral gastrocnemii was significantly greater than Injury Control (p < 0.0001) and p-skECM-treated (p = 0.030) gastrocnemii. Body mass-normalized force generated by Contralateral gastrocnemii was not different, however, from d-skECM-treated (p = 0.105) gastrocnemii.
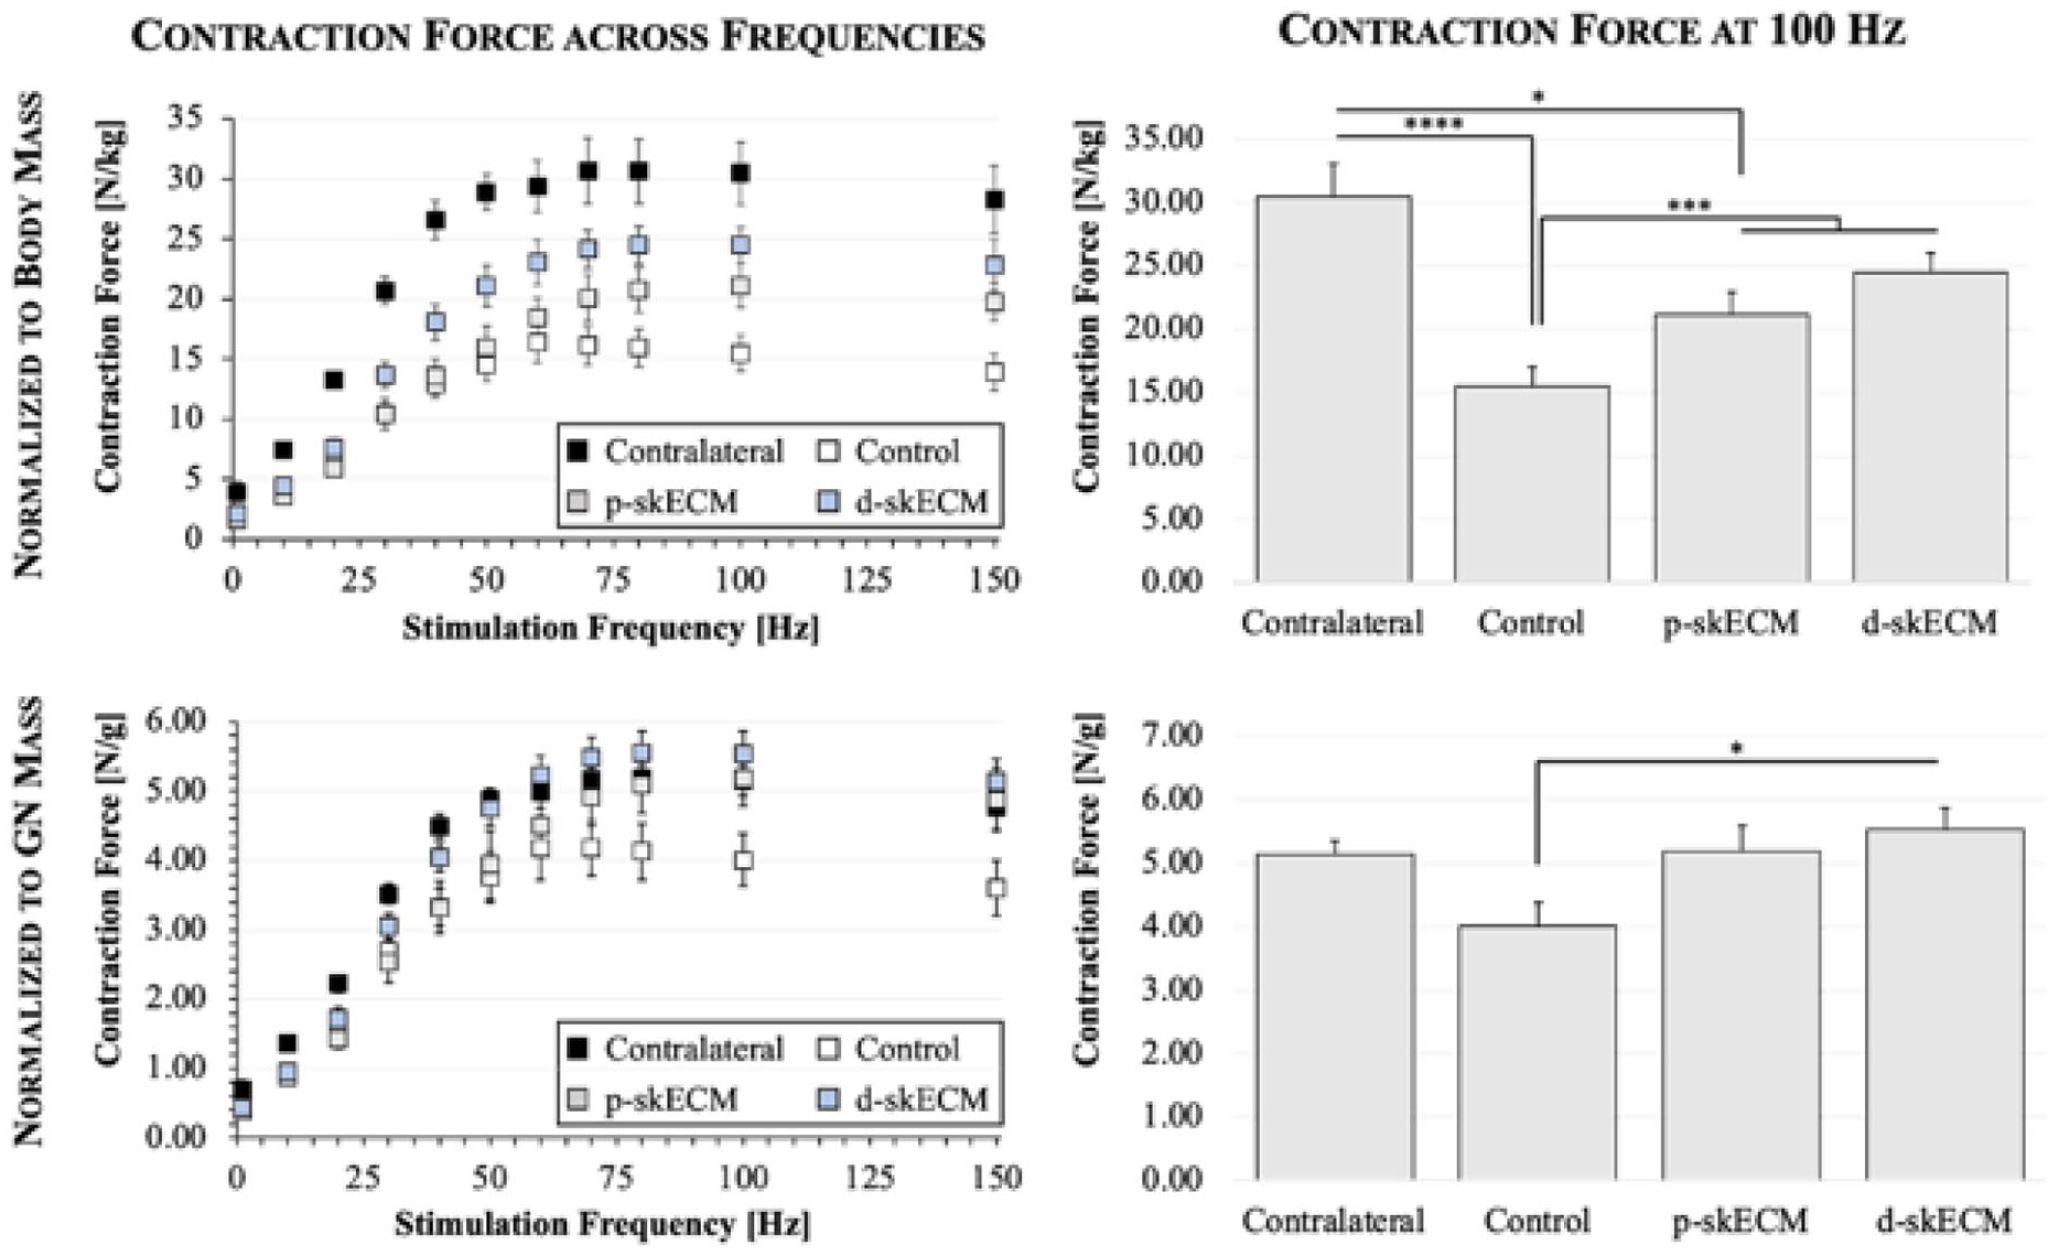
Gastrocnemii contraction force normalized to rodent body mass (top row) and normalized to gastrocnemius mass (bottom row). Plots in the left column display force generated across all stimulation frequencies and where bar charts (right column) present the force generated at maximum tetanic contraction. Mean ± SEM.
In contrast to the frequency sweep shown in at the top of Figure 6, the frequency sweep in the bottom row Figure 6 shows the maximum gastrocnemius-normalized force is not generated by Contralateral muscles, but rather is generated by gastrocnemii having been treated with d-skECM, albeit not significantly greater. At the maximum contraction force, only d-skECM-treated gastrocnemii showed significantly greater force generation relative Control (p = 0.033). No differences were presented in any other comparisons (p ⩾ 0.133 for each comparison).
skECM histology
Figure 7 displays representative Masson’s Trichrome staining of gastrocnemii. Imaging of the entire field is presented for each Condition, as well as magnified images of areas of interest. In trichrome staining, healthy muscle appears as red with degenerating fibers staining a lighter red relative to the healthy muscle. Collagens/fibrous tissue appear blue with necrotic tissue staining a deeper blue relative to normal fibrous tissue, and nuclei appear as deep purple/black puncta. From the images, the muscle fibers appear of a similar red color across all groups, with perhaps the Control cohort appearing a slightly deeper red than the other conditions. Stranding fibrosis was present most abundantly in the Control cohort. The p-skECM conditions presented blue staining atop, and perhaps with the myofibers; this may be remnants of the injected skECM, though in the d-skECM cohort, this architecture was not observed as pervasively.

Representative trichrome staining of gastrocnemii across conditions.
Figure 8 displays representative Oil Red O (red) staining for lipid content accumulated in the gastrocnemii. The Contralateral gastrocnemii and those gastrocnemii injected with d-skECM appeared similar in their lipid content, where Oil Red O-positivity can be seen at the periphery of the muscle; lipid deposits, however, were not totally eliminated by the treatment of gastrocnemii with d-skECM, as shown in the magnified section. Both the p-skECM and Control cohorts presented significantly more lipid accumulation relative to the d-skECM cohort. These lipid deposits were present both at the periphery of the muscle segment as well as within the muscle itself.

Representative Oil Red O staining of gastrocnemii across conditions.
Quantified proteins in gastrocnemii
Figure 9 presents growth factors and cytokines quantified in the gastrocnemii, ordered alphabetically. The values are shown as normalizations to the protein concentration of the respective cohorts’ contralateral gastrocnemii. The cohort injected with d-skECM was shown to have significantly higher expression of GM-CSF and IGF-1 relative to both Control and p-skECM cohorts. Control gastrocnemii showed significantly higher expression of IL-1β, IL-18, IFNγ, TIMP-1, and TNFα relative to both p-skECM and d-skECM. Control gastrocnemii showed significantly higher expression of IL-4 and IL-13 compared to the p-skECM cohort only; Control gastrocnemii showed significantly higher expression of IL-2 and IL-10 compared to the d-skECM cohort only. Significant differences in relative expressions between p-skECM and d-skECM cohorts were shown in with GM-CSF and IGF-1 only.

Quantification of cytokines in skECM-injected gastrocnemii. Cytokine concentration is normalized to that in the contralateral gastrocemius. Mean ± SEM.
Correlations of force to intramuscular cytokine concentration
Univariate analysis was performed against force generated and proteins quantified where significances of correlations are mapped in Supplemental Figure 3. IFNγ was the only cytokine significantly correlated to force (p = 0.0088) and is plotted in Figure 10(a) and is governed by equation (1) where

Figure 10(b) adds IL-1β, IL-18, and their interacting effects into the linear model with IFNγ. The addition of these cytokines improved the model fit from moderate (R2 = 0.2614) to strong (R2 = 0.7825). The x-axis “Predicted Force” is governed by equation (2).
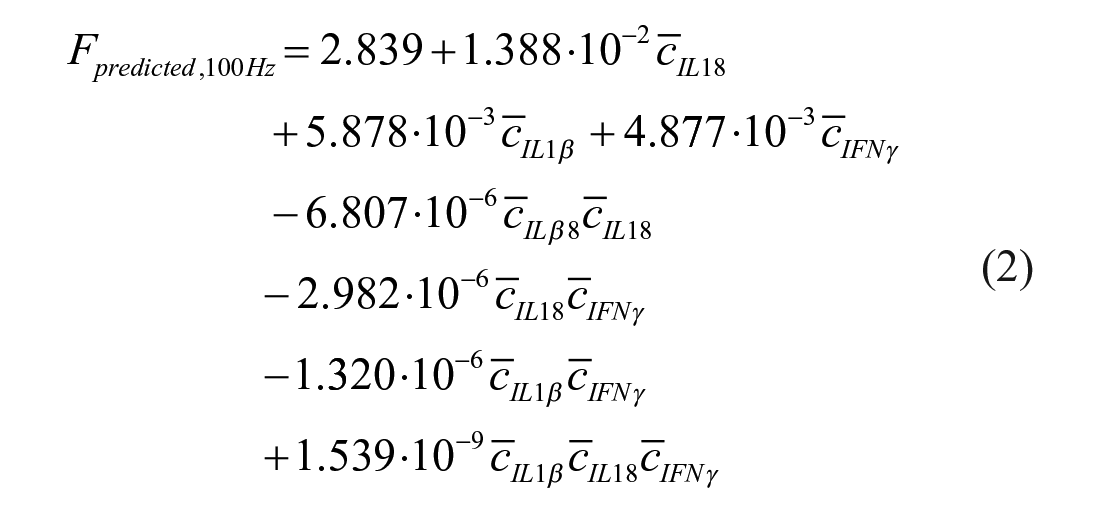
Figure 10(c) presents the log worth plot for all the factors and their interactions, and their worth in terms of their contribution to force prediction. While IL-18 is not a significant predictor, it reaches significance is its interactions with IL-1β and the three-way interaction between IL-1β, IL-18, and IFNγ. Figure 10(d) to (f) present leverage plots of IFNγ, IL-1β, and the interacting effects of IFNγ, IL-1β, and IL-18, respectively. The plots present the trend that each of the factor has on the force measurement, where protein concentration of IFNγ and the interacting effects of the three cytokines are proportional to force, and the concentration of IL-1β is inversely proportional to force.
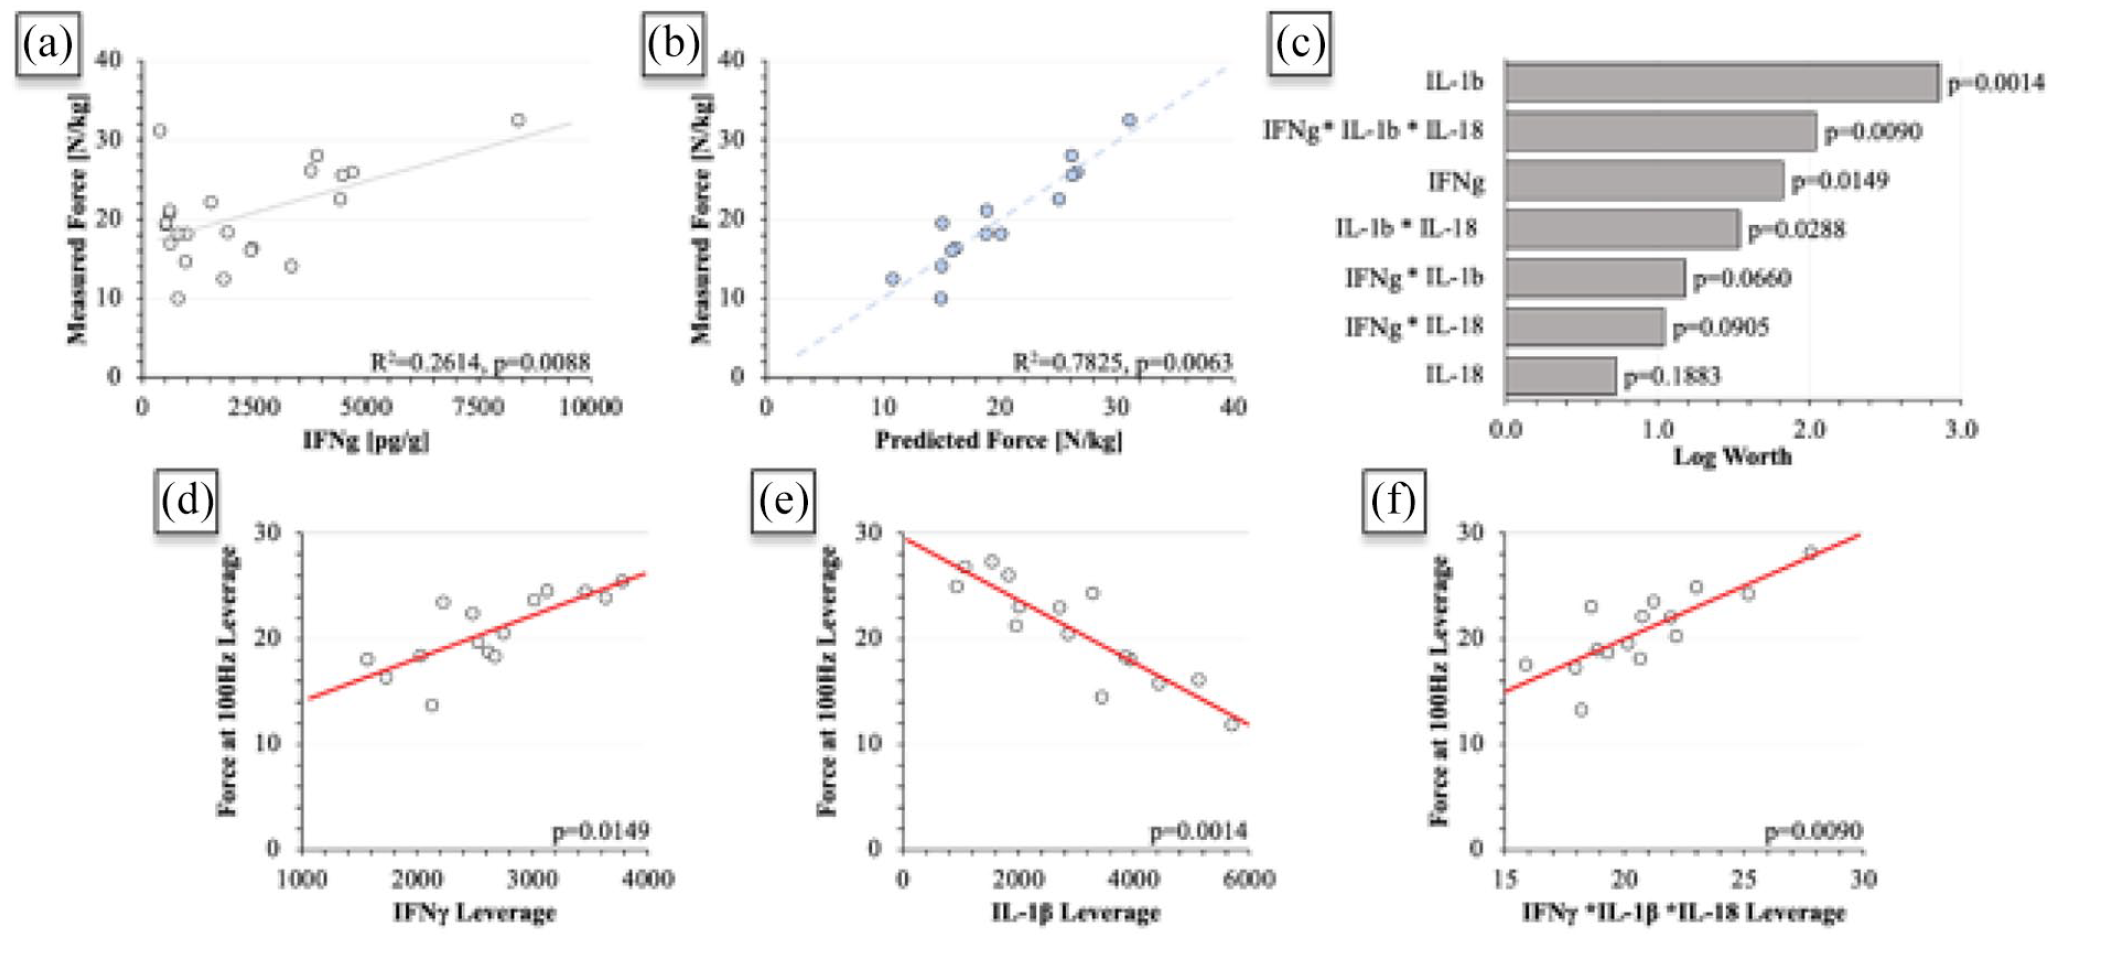
(a) Contraction force as predicted by IFNγ, (b) contraction force as predicted by IFNγ, IL-1β, IL-18, and their interacting effects, (c) log worth chart displaying the factors’ contribution to the linear regression shown in (b), and (d–f) leverage plots of IFNγ, IL-1β and the interacting effects of IFNγ, IL-1β, and IL-18, respectively.
Discussion
Atrophic muscle after a denervation injury is characterized by a reduction in bulk mass due to shrinkage of individual muscle fibers. 14 This is accompanied by a loss in muscle power, complemented by and accelerated from collagenous deposition. 15 Concomitantly, these phenomena cause significantly altered mechanical and biochemical properties relative to the pre-atrophied state. Normal muscle possesses a stiffness of approximately 12 kPa and several groups have shown that varying substrate stiffness outside the 5–20 kPa range significantly decreases satellite cell capacity for both proliferation and differentiation.16,17 Additionally, fibrotic muscle can reach stiffnesses up to 30 kPa, 18 adversely impairing the ability of satellite cells to regenerate the atrophic muscle and decreasing its contractile potential. 19 Based on this, it is perhaps unsurprising that poor myoblast survival in the damaged muscular environment has been attributed to damaged ECM, 20 even though the ECM only comprises approximately 5% of the overall muscle mass relative to its other constituents. 21
In an effort to restore properties of the normal mechanical environment within the atrophic muscular environment, two preparations of injectable skECM were created and injected into the gastrocnemii of rodents having undergone a sciatic nerve transection, inducing denervation atrophy. Porcine skeletal muscle was prepared in a particulate and a digested preparation per Figure 1, where the principal process difference is the exposure of skECM to a pepsin-based solution. Two studies investigating intramuscular skeletal muscle-derived ECM hydrogels prepared similarly to the d-skECM processes have been published to date: While d-skECM has been shown to increase angiogenesis and cell survival in a rodent ischemia model 22 and increase satellite cell differentiation, 23 a digested preparation has not been examined against its non-digested counterpart directly. Such digestion alters the microstructure of the protein substantially (Figure 4). The skECM loses the striated, myofibrillar appearance, which is unsurprising given the processes as a whole and is consistent with the structures of other skECM prepared similarly.24,25
Gait analysis via SFI, showed significant differences between the groups, compared both in terms of their linear fit (R 2 ) as well as means across groups. Both skECM preparations showed significantly improved SFI relative to Control (Figure 5, p < 0.001). SFI calculation is prone to large discrepancies between animals, 26 illustrated in both skECM cohorts in the scatter plot, where approximately half of the animals in each group healed well, but deviated largely from those that did not. This study was longer than previously published studies quantifying SFI, 27 where the added healing time may have favorably impacted restoration of SFI. Time alone as the contributing factor to increasing SFI seems unlikely, however, given the continued impairment in Controls.
Tetanic contraction force quantification resulted in two different trends when normalizing by the overall mass of the rodent versus the mass of the gastrocnemius responsible for the force generation (Figure 6). Based on normalization by rodent body mass, the force generated by Contralateral gastrocnemii differed from Control (p < 0.0001) and p-skECM (p = 0.0490) cohorts but did not differ from the d-skECM cohort (p = 0.1050). In a study leveraging a muscle defect to the gastrocnemius with a bulk skECM repair, approximately 80% of the gastrocnemius force was returned relative to contralateral gastrocnemii at 6 weeks. 28 Full transections damaging the muscle as well as the local nerve showed more variable returns of force, being approximately 40%–80% of the contralateral,29,30 consistent with force returns here. When contraction force is normalized by based the gastrocnemius mass, the only significantly different comparison is d-skECM from Control. The overall similarities in force per muscle mass across conditions is perhaps suggestive of the completion of regeneration, consistent with fiber area measurement. 31
Control gastrocnemii showed significantly higher relative expressions of IL-1β, IL-18, IFNγ, TIMP-1, and TNFα relative to both p-skECM and d-skECM (Figure 9), where it is perhaps the case that the skECM preparations are acting to downregulate these cytokines and therefore result in increased tetanic force production relative to Control. As a standalone variable IFNγ was most predictive of force (Supplemental Figure 3, Figure 10(a)). IFNγ upregulation in and of itself may not necessarily be detrimental, but in the context of the upregulated cytokines collective in the Control cohort, may be adversely affecting force (re)generation. In the context of the broader model including IL-1β and IL-18 with IFNγ (Figure 10(b)), IL-1β becomes most significantly predictive of force and is inversely proportional to force generation (Figure 10(c) and (e)). Linear regression analyses correlating cytokines in plasma to muscular function have been performed, though it is not clear whether regression of quantified intramuscular cytokines and force has been performed to date. Blood plasma regression analysis showed that IL-6 was significantly and negatively correlated to handgrip strength. 32 In a similar correlation analysis, IL-6 blood levels were shown significantly and negatively correlated to muscle mass and muscle strength in the elderly, exacerbated by presence of TNFα. 33 In the denervation model here, intramuscular IFNγ, IL-1β and IL-18 are implicated as having strongly (R2 ⩾ 0.75) correlated effects with respect to force generation.
It is known that the inflammatory process has profound impact on regenerating or degenerating muscle, affecting its function. 34 The effects of IL-1β and IFNγ the regenerating muscle has been mixed. It has been shown that IFNγ is required for efficient muscle regeneration, can hasten skeletal muscle repair and limit fibrosis. 35 IFNγ also regulates macrophage phenotype in muscle from dystrophic (mdx) mice during the period of acute muscle damage and the following regenerative stage. 36 Despite these findings, it has also been shown that IFNγ inhibits muscle-specific gene upregulation, including myogenin, when myoblasts are presented with supraphysiological IFNγ levels. 35 It has been demonstrated by linear correlation that IL-1β and IFNγ were able to induce iNOS gene expression in skeletal muscle. 37 Coordinating the initial inflammation and activating satellite cells to express MYOD, IFNγ has been suggested to be an early regulator of myogenesis, 38 and seemingly continues to impact repair with respect to muscle power through 20 weeks as presented here.
IL-1β has been implicated in metabolic adaptations of skeletal muscle occurring in response to stresses. 39 It has been reported that IL-1β-positive neutrophils support physical performance by potentially alleviating fatigue. 40 In masseter muscles, locally increased IL-1α/β supports functional activity by maintaining glucose homeostasis, which also involved IL-6; IL-1α/β with IL-6 were shown to have direct involvement in muscle performance and fatigability,41,42 with concentration here trends here corroborating these findings. IL-1β-polarized macrophages have been reported to reduce intramuscular lipid, 43 though this finding seems to be at odds with the visual lipid deposits found in the Control and p-skECM-treated gastrocnemii (Figure 8). Intramuscular lipid accumulation and force generation may not be mutually exclusive, however, given reports that moderately upregulated intramuscular lipid accumulation does not affect contractile force. 44
While IL-18 alone did not significantly predict force, its two-way and three-way interactions are significant predictors (Figure 10(c)). IL-18 has been reported to cause muscle wasting though mechanisms similar to TNFα, 45 which also mediates inflammatory state-based muscle strength and mass loss.46,47 Similarly, elevated plasma and intramuscular levels of TIMP-1 results in muscle strength loss, 48 where the Control showed highest relative expressions of each. IL-18 has a role in maintaining healthy skeletal muscle, with expression in type-II muscle fibers,49,50 the predominant fiber type in rat gastrocnemii. 51 IL-18 may be also involved in regulating intramuscular lipid metabolism and hypertriglyceridemia, controlling local access to energy stores.52,53 While high intramuscular expression of IL-18 has been reported in inflammatory diseases and myopathies,54,55 the IL-18 concentrations did not appear to follow the trends in the Oil Red O staining (Figure 8). Taken together, perhaps the effects and interactions of IL-1β, IL-18, and IFNγ prolonged upregulation of satellite cell proliferation combined with regulation of injury lipogenesis and inflammation contributed to the increased contraction force.
Both skECM preparations performed similarly with respect to the relative expressions in growth factors/cytokines, differing significantly only in the relative concentrations of GM-CSF and IGF-1. GM-CSF is responsible for recruitment of M1-like macrophages responsible for healing damaged muscle,56,57 and IGF-1 has a direct and well-established role in muscle hypertrophy. 58 Since digestion will produce a unique profile of cryptic molecules, some of which possess bioactive properties, it is possible that these unique properties of the d-skECM were increasingly available to have paracrine effects on the local cellular environment.59,60 Alternatively, the host-material interface has been shown to be a mediator of paracrine signaling as well based on the topography of the biomaterial being implanted,61,62 where perhaps the reduced lipid expression result from continued expression of GM-CSF and IGF-1 in the d-skECM cohort relative to the p-skECM cohort. In the canonical PI3K/AKT/IGF-1 pathway, binding of IGF-1 excreted from damaged myoblasts activates AKT phosphorylation for continued protein synthesis from myofibers while limiting lipogenesis, 63 possibly causing the discrepancies in lipid accumulations of the skECM conditions. GM-CSF has also been shown as an antifibrotic cytokine,64,65 perhaps contributing to the lessened collagenous deposition as shown in the Masson’s Trichrome imaging of the d-skECM relative to Control and p-skECM (Figure 7). Injections of skECM resulted in significantly higher expression of VEGF relative to the Control cohort. VEGF overexpression has been used as a therapy for tissue ischemia and muscle-specific VEGF knockout in mouse skeletal muscle reduces the presence of intramuscular capillaries by approximately 50%, significantly decreases endurance time by approximately 80% (in the context of exercise), and dampens the angiogenic-specific response to exercise training. 66 Despite IGF-1 and GM-CSF being more significantly expressed in the d-skECM-injected cohort, and VEGF being more highly expressed in both skECM conditions, return of force was not significantly greater between skECM conditions, nor did these cytokines correlate to force output.
Regulatory considerations of skECM
Comparison between ECM preparations is exceedingly important, particularly from regulatory and translational perspectives. Though particulate or powdered ECMs are clinically marketed currently, 67 digested ECMs enjoy the majority of academic focus. 68 In fact, studies directly comparing particulate ECM to a digested ECM are exceedingly rare, having been performed in bone ECM where digestion was shown to attenuate the M1/M2 macrophage infiltrate in vivo. 69 The study here employs a “homologous use” case, where a therapy of a specific origin (skeletal muscle) is being used to treat a pathology of the same tissue type (atrophy in skeletal muscle). Homologous use cases have a history of specific regulation by FDA, and specifically, 21 CFR 1271.10(a)(1) details the statutory requirements of packaging and labeling a Human Cell/Tissue Product (HCT/P) that is being marketed for homologous use in the clinic. In this context, the marketing of an HCT/P is discussed with respect to Section 361 of the Public Health & Safety Act as it pertains to homologous use, and not to Section 351, which is oriented to cell and tissue products that are either non-homologous use or do not meet the requirements for minimal manipulation (e.g. cell therapies, biologics). While HCT/Ps are human in origin, the process of making skECM, and p-skECM in particular is essentially identical to current processing methods being employed commercially for HCT/Ps today. If the origin tissue was human rather than porcine, the regulatory burden my potentially be significantly mitigated since HCT/Ps do not require the more rigorous premarketing standards that traditional medical devices, drugs, or biologics require, where registration with FDA is the prerequisite rather than a premarket clearance or an approval.
Despite this, the FDA is moving toward more stringent requirements of 361 HCT/Ps, where FDA’s July 2020 Guidance for Industry: “Regulatory Considerations for Human Cells, Tissues, and Cellular and Tissue-Based Products: Minimal Manipulation and Homologous Use,” where the Agency makes specific note of 21 CFR 1271.3(ff) Processing, and that a means of decellularization does indeed constitute “processing,” and therefore falls out of the interpretation of minimal manipulation. This is a large departure from the historical interpretation as many decellularized products are marketed under the HCT/P umbrella, particularly acellular dermal matrices 70 and bone void fillers. 71 This interpretation does, however, enable the potential for a porcine-derived ECM, highly similar to the ones created here to be regulated as a medical device, and perhaps through 510(k) pathway as micronized porcine urinary bladder matrix (see submission K153754 via fda.gov).
Study limitations
While skeletal muscle atrophy is marked by loss of overall muscle mass,72–75 assessments of fiber cross-sectional area and atrophy-specific markers like myosin heavy chain (MHC), MyoD, or laminin would enhance the understanding of atrophy on the cellular scale,76–78 particularly if multiple cross-sections can be quantified from each muscle explant as muscle has been show to atrophy nonuniformly across the muscle body.79,80 Such analyses coupling semi-quantitative IF/IHC with proteomics would be ideal to further elucidate mechanisms,81–83 particularly when coupled with the correlation statistics presented here. Unfortunately, the COVID-19 pandemic detracted from work being performed in the laboratories and animal facility, which was concurrent with this study. Restrictions on animal ordering and husbandry precluded the expansion of the study. While contraction force is a highly relevant and commonly-utilized measure of muscle function, additions of EMG and nerve conduction velocity would also have been ideal. MuSK was shown without difference across all three groups, though a biophysical confirmation by nerve conduction would make an increasingly robust case that the nerves did indeed heal similarly across cohorts, and therefore did not impede the healing of the muscle. Finally, though downregulations of a series of cytokines is shown, IHC, or ideally, multi-labeled IF for inflammatory-specific cells would be ideal for better elucidating the mechanisms of healing.
These correlations have several limitations. Foremost, increasing the animal numbers and early time-points would serve to better elucidate variability and time-based changes, especially in cytokine expressions. Increased animal numbers would also serve to increase the statistical power in performing any statistical method, but particularly for correlations, increasing cohort number would allow for additional interactions to be compared without losing degrees of freedom. The addition of a cohort receiving an intramuscular injection without nerve repair post-transection would also serve as an illuminating comparison, which would also model a clinical, non-invasive use case of the injectable for the patient populations opting to not have reparative nerve surgery or those who delay surgery. While achieving statistical significance with disparate treatment conditions only serve to strength the case of the cytokines’ contributions, the ability to control for individual injury cohorts would strength, and even perhaps quantify similar correlations in increasingly greater detail. In searching the literature for similar studies, several publications correlating functional muscle force to levels of cytokines in the blood plasma. Any future investigation repeating the work would greatly benefit from the additional insight that could be provide when comparing systemic to local cytokines and then perform multivariate analyses.
Conclusions
For treating skeletal muscle denervation atrophy, two formats of skeletal muscle-derived ECM (skECM) were prepared and injected directly into the gastrocnemius after a transection injury and repair was administered to the sciatic nerve. Rats were assessed at 20 weeks postoperatively with the skECM Conditions showing significant return in contraction force relative to uninjured contralateral muscle, with marked improvement in toe spread relative to non-injected Controls as measured by sciatic function index. Conditions injected with skECM showed significant downregulations in their relative expressions of pro-inflammatory cytokines such as of IL-1β, IL-18, IFNγ, TIMP-1, and TNFα. Further, IFNγ, IL-1β, and IL-18 and their interacting effects were significantly correlated to the outputted contraction force. Such a method of regression analysis may provide a powerful tool for establishing increasingly explicit mechanisms responsible for translating intramuscular concentration of proteins to function muscle force during regeneration. Further, skECM possesses a high degree of clinical translatability given the prevalence of ECMs currently marketed and appears particularly well suited to address the homologous use case of denervation atrophy in skeletal muscle.
Supplemental Material
sj-docx-1-tej-10.1177_20417314211032491 – Supplemental material for Intramuscular injection of skeletal muscle derived extracellular matrix mitigates denervation atrophy after sciatic nerve transection
Supplemental material, sj-docx-1-tej-10.1177_20417314211032491 for Intramuscular injection of skeletal muscle derived extracellular matrix mitigates denervation atrophy after sciatic nerve transection by Benjamin K Schilling, Jocelyn S Baker, Chiaki Komatsu and Kacey G Marra in Journal of Tissue Engineering
Footnotes
Acknowledgements
The authors would like to thank Denise Prosser and the UPCI Cancer Biomarkers Facility and Luminex Core, which is supported in part by award P30CA047904. The authors would like to thank the Nanoscale Fabrication and Characterization Facility (NFCF) at the University of Pittsburgh, Pittsburgh, PA for their assistance in microscopy.
Declaration of conflicting interests
The author(s) declared no potential conflicts of interest with respect to the research, authorship, and/or publication of this article.
Funding
The author(s) disclosed receipt of the following financial support for the research, authorship, and/or publication of this article: Funding for the work detailed in this manuscript was received from a Pilot Research Grant from the Plastic Surgery Foundation (PSF, Award Number 414208) as well as from a seed grant from the Department of Health of the Commonwealth of Pennsylvania (Award Number 4100085242).
Supplemental material
Supplemental material for this article is available online.
References
Supplementary Material
Please find the following supplemental material available below.
For Open Access articles published under a Creative Commons License, all supplemental material carries the same license as the article it is associated with.
For non-Open Access articles published, all supplemental material carries a non-exclusive license, and permission requests for re-use of supplemental material or any part of supplemental material shall be sent directly to the copyright owner as specified in the copyright notice associated with the article.