
Abstract
The preclinical development process of chemotherapeutic drugs is often carried out in two-dimensional monolayer cultures. However, a considerable amount of evidence demonstrates that two-dimensional cell culture does not accurately reflect the three-dimensional in vivo tumour microenvironment, specifically with regard to gene expression profiles, oxygen and nutrient gradients and pharmacokinetics. With this objective in mind, we have developed and established a physiologically relevant three-dimensional in vitro model of colorectal cancer based on the removal of interstitial fluid from collagen type I hydrogels. We employed the RAFT™ (Real Architecture For 3D Tissue) system for producing three-dimensional cultures to create a controlled reproducible, multiwell testing platform. Using the HT29 and HCT116 cell lines to model epidermal growth factor receptor expressing colorectal cancers, we characterized three-dimensional cell growth and morphology in addition to the anti-proliferative effects of the anti–epidermal growth factor receptor chemotherapeutic agent cetuximab in comparison to two-dimensional monolayer cultures. Cells proliferated well for 14 days in three-dimensional culture and formed well-defined cellular aggregates within the concentrated collagen matrix. Epidermal growth factor receptor expression levels revealed a twofold and threefold increase in three-dimensional cultures for both HT29 and HCT116 cells in comparison to two-dimensional monolayers, respectively (p < 0.05; p < 0.01). Cetuximab efficacy was significantly lower in HT29 three-dimensional cultures in comparison to two-dimensional monolayers, whereas HCT116 cells in both two-dimension and three-dimension were non-responsive to treatment in agreement with their KRAS mutant status. In summary, these results confirm the use of a three-dimensional in vitro cancer model as a suitable drug-screening platform for in vitro pharmacological testing.
Keywords
Introduction
Cancer is one of the leading causes of death worldwide with an estimated 12.6 million people diagnosed in 2008, accounting for approximately 7.6 million deaths globally. 1 Cancer prognosis would improve with better therapeutic regimens, particularly when tumours cannot be managed by surgical resection alone and require subsequent chemo- or radiotherapy. The majority of current models for therapeutic and pharmacological investigations are carried out in either two-dimensional (2D) reductionist in vitro cell culture or severe combined immunodeficient (SCID) animal models. It is, however, becoming increasingly apparent that microenvironmental factors play an important role in controlling both the progression of cancer and the chemotherapeutic response to treatment. 2 Although highly useful, 2D in vitro cell models lack the sophistication of cellular orientation and cell–matrix interactions, while animal models often overlook host factors that are typically involved in disease progression such as the immune system. 3 Both types of investigations are routinely used by pharmaceutical companies, but efficiency of drug discovery and clinical translation remain suboptimal. For example, this holds true for the family of Endothelin A receptor antagonists, for example, atrasentan. Despite encouraging preclinical data, the agents failed to demonstrate a benefit in clinical trials and therefore have not progressed to the clinic. 4 To address the gap between 2D culture systems and in vivo models, three-dimensional (3D) cell culture systems such as multicellular tumour spheroids and scaffold-based approaches have been used as a bridge to further our understanding of cancer biology, particularly how the cells may respond to treatment in a 3D environment. Of the available 3D in vitro models, spheroid assays are widely used for therapeutic testing; 5 however, they are inherently limited by their size (400–600 µm) resulting from nutrient and O2 deficiency. Spheroids develop a necrotic core surrounded by a rim of viable cells (100–300 µm) in the periphery. 6 Due to the absence of a matrix, cancer cells have restricted mobility, a key parameter in the development of micrometastases in vivo. More recent approaches have utilized natural or synthetic scaffolds. Natural scaffolds include extracellular matrix (ECM) proteins such as collagen, laminin or hyaluronic acid.7,8 They are largely malleable by cell behaviour, typically as a result of ECM degrading proteins such as matrix-metalloproteinases (MMPs). This is remarkably helpful for modelling the complex dynamic nature of tumours. Natural scaffolds are also appealing due to their biocompatibility and orientation that allows cell surface receptors such as integrins and discoidin domain receptors to interact with natural matrix proteins. Hyperhydrated gel systems such as collagen consist of cross-linked macromolecular networks of hydrophilic polymers. 9 However, this hyperhydration (~99% water) is not physiologically representative of any tissue in the in vivo environment, and ultimately, more biomimetic models are needed to model tumours accurately. Synthetic scaffolds such as polyethylene glycol (PEG) and polyglycolic acid (PGA) are biodegradable scaffolds that function to mimic the macromolecular structures of the ECM.10,11 Compared to natural scaffolds, they are mechanically stiffer and therefore suitable for modelling the dense tumour microenvironment. However, they are not without their disadvantages, often having to undergo surface modifications to improve cell attachment, migration and scaffold degradation. 12
In this article, we describe for the first time the creation and use of a 3D collagen-based multiwell platform for therapeutic validation into colorectal cancer. Tissue-engineered 3D cultures are generated by the RAFT™ (Real Architecture For 3D Tissue) technology, a process based on the removal of water from hyperhydrated collagen hydrogels. 13 This controlled removal of water provides a structurally and physiologically relevant matrix. We chose colorectal as the demonstrator cancer and used the HT29 and HCT116 cancer cell lines to create 3D cultures and monitored growth, morphology and response to targeted treatment. The cell lines were chosen for their KRAS mutant status − HCT116 mutant and HT29 wild-type. 14 The expression of the epidermal growth factor receptor (EGFR) was investigated as a biomarker and compared to 2D monolayer expression levels. EGFR was targeted for treatment using cetuximab, the monoclonal antibody raised against the EGFR receptor. These preclinical data demonstrate the use of our 3D cultures as a simple, fast and consistent model for drug testing. We propose this as a suitable in vitro model to help bridge the gap between conventional 2D monolayer studies and complex in vivo animal models.
Materials and methods
Cell maintenance
The HT29 human colorectal adenocarcinoma cell line and the HCT116 human colorectal carcinoma cell lines (both from the European Collection of Cell Cultures, Sigma–Aldrich, Dorset, UK) were used. HT29 and HCT116 cells were routinely cultured in 2D monolayers in Dulbecco’s modified Eagle’s medium (DMEM) supplemented with 1 g/L glucose, 10% fetal bovine serum (FBS), 100 units/mL penicillin and 100 µg/mL streptomycin (all from Invitrogen, Paisley, UK) at 37°C in standard cell culture conditions (5% CO2/air and 95% humidity).
Preparation of 3D cultures
The 3D cultures were prepared using the RAFT™ 3D cell culture system in 96-well plates as detailed by the manufacturer’s instructions (TAP Biosystems, Royston, UK). In brief, 2.8 mL of Minimal Essential Medium (MEM 10×) was added to 22.4 mL of rat-tail collagen type I. This solution was neutralized by 1.6 mL of the neutralizing solution provided, before 1.2 mL of the cell suspension was added (1.96 × 10⁶ cells/mL). The collagen–MEM–cell solution was mixed gently and aliquoted into the 96-well plate (240 µL per well) and placed on a plate heater (37°C) for 15 min, initiating collagen fibrillogenesis to produce a cell-populated collagen hydrogel. While still on the heater, biocompatible hydrophilic RAFT™ absorbers were placed on the hydrogels and left for 15 min (Figure 1). This process removes some interstitial fluid while preserving cell viability and creates a more physiological matrix (9.59% ± 0.64% collagen as measured by freeze drying to determine the wet and dry weight). Fully supplemented medium was added to each well, and the plates were placed in the incubator, under standard culture conditions.

A schematic diagram of how 3D cultures are created.
Cell proliferation and morphology
HT29 and HCT116 cultured in 3D were seeded at a density of 1.96 × 10⁶ cells/mL per 3D culture. Preliminary cell density studies indicated that this was the optimum cell density for growth and ease of imaging (data not shown). Metabolic activity was assessed over 14 days using the alamarBlue® assay according to the manufacturers’ protocol (Invitrogen). AlamarBlue measures the chemical reduction of resazurin to resorufin by mitochondrial activity and provides an indicator of metabolic activity. DMEM without phenol red (Invitrogen) was used to minimize saturation of the fluorescent dye. In brief, 100 µL of alamarBlue solution (10% solution in fully supplemented DMEM) was added to each well. The samples were incubated for 4 h at 37°C and the solution transferred to a black-bottom 96-well plate to obtain a fluorescent reading at excitation of 530 nm and emission 620 nm. Cell morphology was also monitored in real time by live-cell phase-contrast imaging using a Nikon, Eclipse TE300 microscope.
Immunofluorescence
Cell morphology was confirmed by immunofluorescence. The 3D cultures were fixed in 4% paraformaldehyde for 30 min and washed thoroughly in phosphate-buffered saline (PBS) (three washes for 5 min each). The cultures were permeabilized with 1% Triton X-100 (TX-100) for 15 min and again washed thoroughly with PBS. This was followed by incubation with an anti-tubulin primary antibody solution (Abcam, Cambridge, UK; at 1:200 in a blocking solution of PBS containing 1% bovine serum albumin (BSA) and 0.2% TX-100) overnight at 4°C. The samples were then washed three times in PBS for 5 min each and incubated with a Cy3 conjugated secondary antibody (Jackson ImmunoResearch, West Grove, PA, USA; 1:200), Alexa Fluor 488 conjugated Phalloidin (Invitrogen; 1:40) and 4′,6-diamidino-2-phenylindole (DAPI) diluted in the blocking solution for 2.5 h at room temperature. The cultures were then washed three times with PBS for 5 min each and imaged using an Olympus IX71 Inverted Fluorescent Microscope fitted with a Prior z-focus drive.
Gene expression analysis
Gene expression levels of EGFR were measured with one-step quantitative reverse transcription polymerase chain reaction (qRT-PCR) using a LightCycler® system (Roche, Hertfordshire, UK). Cells were collected from 3D collagen gels by digestion in 100 units/mL collagenase (from Clostridium histolyticum) in Tris buffer (Sigma–Aldrich) for 2 h. RNA was extracted from cells in either 2D or 3D after 3 days in culture using the RNeasy Mini Kit (Qiagen, Crawley, UK) according to the manufacturer’s instructions. Total RNA was quantified using a nanodrop spectrophotometer measuring at 260/280 nm. All experiments were performed in triplicate.
Drug treatment in 2D and 3D
For 2D monolayer experiments, HT29 cells and HCT116 cells were seeded at a density of 18,000 and 17,000 cells/cm2, respectively. Cells were allowed to grow overnight before being serum-starved for 24 h in serum-free DMEM. The 3D cultures were seeded at a density of 20,000 cells (1.96 × 10⁶ cells/mL) for both cell lines. The 3D cultures were maintained for 6 days before being serum-starved for 24 h prior to treatment. This was carried out to give the cells time to acclimatize to the new environment and for cellular aggregates to form. Cellular aggregates in this context are defined by the migration and adhesion of cancer cells to each other to form cell clusters. Cetuximab (Merck, Darmstadt, Germany) was diluted in serum-free DMEM over a range of concentrations immediately prior to treatment and incubated for 48 h (2D monolayers) or 72 h (3D cultures). Controls were treated with serum-free DMEM only. Metabolic activity was measured using the alamarBlue assay and was considered an indicator of cell viability.
Evaluation of cell aggregate size
The surface area of 3D cellular aggregates (n = 10) was quantified using measurements based on their circumference using the ImageJ software (version 1.46v). The line tool was used to trace around the cellular aggregates, and the area was calculated using a predetermined scale that was set in ImageJ.
Statistical analysis
Data were presented as means and standard deviations of each group. Statistical analysis was carried out using a one-way analysis of variance (ANOVA) with post hoc Dunnett’s test. Significance was accepted at and below 0.05. Results were shown on occasion as percentages for ease of presentation. However, all statistical analyses were carried out on the original data.
Results
Cancer cell proliferation and morphology
To assess the metabolic activity of HT29 and HCT116 cells in 3D culture, the alamarBlue assay was used. Since the assay is non-toxic, multiple readings over a timescale were measured for each well. Increases in metabolic activity, taken as an indicator of cell proliferation, and therefore increases in cell number were determined over 14 days for both cell lines (Figure 2(a)). HT29 cells displayed a steady increase in cell number that appeared to plateau at day 14. Morphologically, the cellular aggregates appeared to grow in size consistently over the 14-day period, in line with the proliferation measurements. On the other hand, although HCT116 cultures exhibited an overall growth pattern over 14 days, there was a significant drop in the proliferation readings at day 7 indicating a quiescent state. However, phase-contrast images of HCT116 cellular aggregates showed no reduction or a slower rate of apparent growth between day 3 and day 7 (Figure 2(b)); therefore, any state of biochemical quiescence did not result in a concomitant morphological change.

Growth kinetics of HT29 and HCT116 cells in 3D culture. (a) The proliferation profile of HT29 and HCT116 colorectal cancer cells cultured in 3D over a 14-day period measured by the alamarBlue assay and (b) morphological analysis of HT29 and HCT116 3D cultures over a 14-day period. Single cells are seeded and migrate together over time to form cellular aggregates (scale bar − 50 µm).
The morphology of cellular aggregates was further determined by immunofluorescent analysis of the cytoskeletal proteins tubulin and F-actin. Tubulin is involved in regulating microtubule dynamics during cell division, while the actin filaments are involved in many processes including cell motility and the maintenance of cell junctions. 15 Figure 3 demonstrates the different morphological phenotypes of cellular aggregates of the two cancer cell lines in 3D culture. HT29 cells formed irregularly shaped aggregates of cells with a defined expression of F-actin visible at cell–cell junctions. HCT116 cell aggregates demonstrated a more ‘grape-like’ phenotype with the cells apparently forming loose clusters with poor cell–cell adhesion in comparison to HT29 cells. 16 Semi-quantitative analysis of the phalloidin stain demonstrated a twofold increase in fluorescent intensity of HT29 cells in comparison to HCT116 cells (data not shown). Expression of tubulin was limited to the outer edges of HT29 aggregates, while HCT116 expression was localized to the spindle fibres of dividing cells throughout the aggregate.

Immunofluorescent analysis of cytoskeletal proteins on colorectal cancer cultures. HT29 and HCT116 cells in 3D cultures were maintained for 14 days, fixed and stained for tubulin (red) and F-actin (green – phalloidin). Nuclei were stained with DAPI (blue) (scale bar − 50 µm).
Over-expression of EGFR in 3D compared to 2D monolayer cultures
To determine gene expression levels, total EGFR messenger RNA (mRNA) expression was assessed in HT29 and HCT116 cells cultured in 2D and in 3D by qRT-PCR. EGFR mRNA copy number was standardized to 50,000 copies of G6PDH to ensure that possible differences in cell number did not interfere with expression levels. Analysis of EGFR mRNA levels on cells cultured in 2D showed that HCT116 cells expressed double the EGFR level of the HT29 cells (Figure 4). This difference was illustrated further in 3D cultures cultured for 3 days, as EGFR expression was significantly upregulated in comparison to 2D monolayers. HT29 3D cultures expressed roughly twice the levels of EGFR in comparison to their monolayer counterparts (p < 0.05). Similarly, EGFR gene expression in HCT116 3D cultures was also increased approximately threefold in comparison to 2D (p < 0.01).
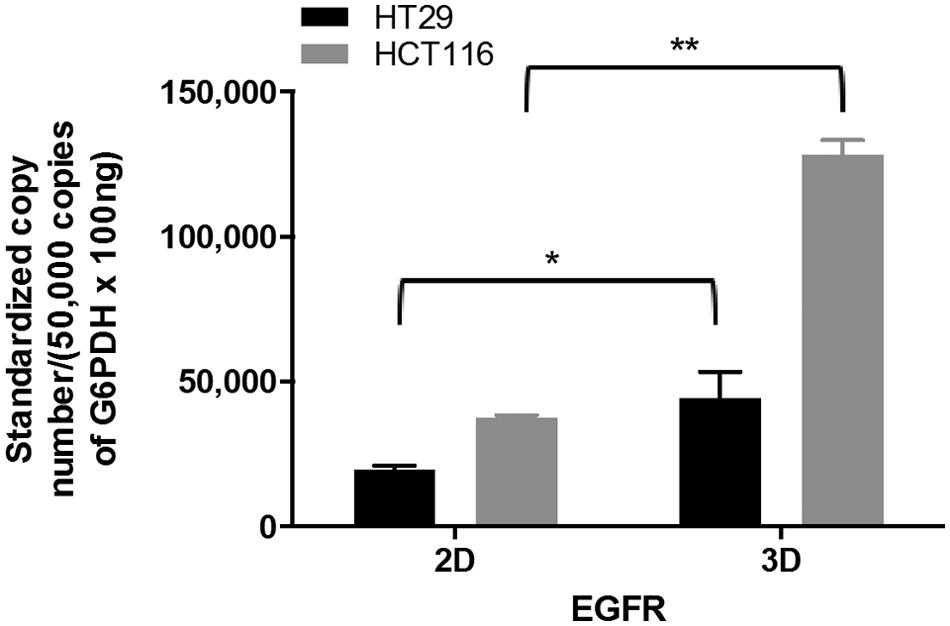
Quantitative RT-PCR analysis of EGFR mRNA levels in colorectal cancer cells. HT29 and HCT116 cells were cultured for 3 days in either 2D or 3D cultures. RNA was extracted and quantified and qPCR was performed using G6PDH as a housekeeping gene. Data are presented as the mean ± SD.
Inhibitory effect of cetuximab on 2D monolayer and 3D cultures
To determine the cytotoxicity of cetuximab, HT29 and HCT116 cells cultured in 2D and in 3D were treated for 48 and 72 h, respectively, and growth inhibition was assessed by the alamarBlue assay. In 2D monolayers, a concentration of 0.34 nM of cetuximab in HT29 cells resulted in a 60% reduction in proliferation in comparison to untreated controls (p < 0.001), while HCT116 cells appeared to be non-responsive (Figure 5(a)). Interestingly, at higher concentrations, cetuximab appeared to stimulate the growth of HCT116 cells; however, this was not statistically significant. Cetuximab was less effective in 3D cultures demonstrating a 40% reduction in HT29 proliferation at 3.4 nM; while again, HCT116 cultures were non-responsive (Figure 5(b)) at all concentrations. As a secondary measure of response to drug treatment, the size of cellular aggregates was measured after treatment and compared to untreated controls (Figure 5(c)). A dose-dependent decrease in the size of cellular aggregates broadly correlated with cetuximab treatment efficacy as measured by alamarBlue. The size of HT29 cellular aggregates reduced by up to 35% in size (p < 0.05) when treated with 3.4 nM cetuximab compared to untreated controls, while the size of HCT116 cellular aggregates remained largely unaffected by treatment at any concentration.
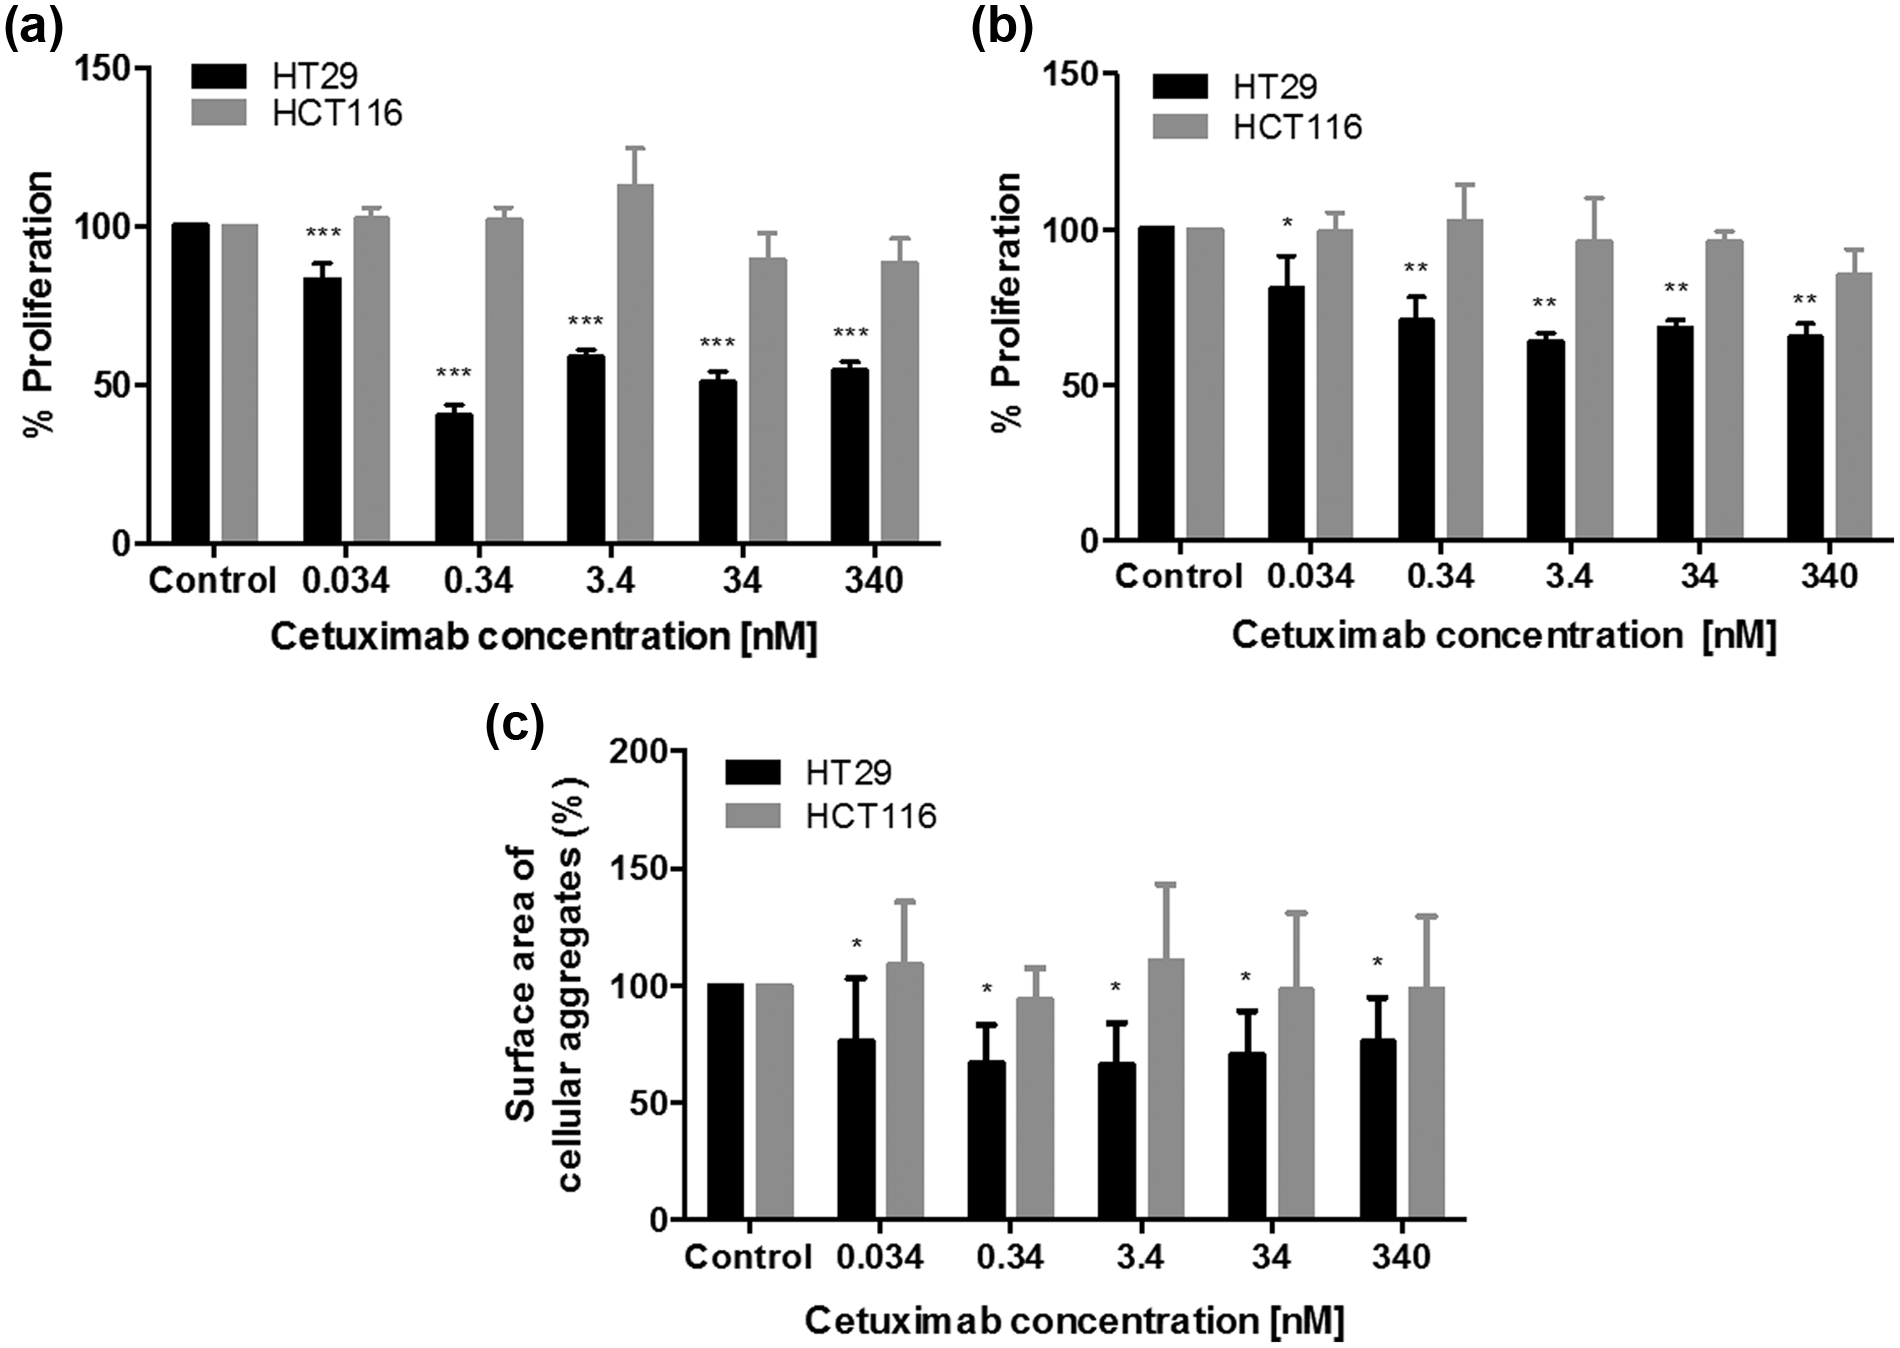
The inhibitory effect of cetuximab on colorectal cancer cells cultured in 2D and 3D. (a) HT29 and HCT116 cells were cultured in 2D and treated for 48 h with cetuximab. (b) HT29 and HCT116 3D cultures were cultured for 7 days and treated for 72 h with increasing concentrations of cetuximab. Cetuximab-treated 3D cultures were then fixed and the (c) surface area of 10 random cellular aggregates was measured using the ImageJ software and calculated as a percentage of the control (n = 4). Data are presented as the mean ± SD.
Discussion
Classical 2D monolayer culture provides us with a medium to explore basic mechanistic investigations into cancer cell behaviour in vitro. However, the simplicity of this system does not recapitulate cell–cell and cell–matrix interactions found within the tumour architecture that regulates key tumourigenic pathways. 17 The emergence of 3D in vitro cancer models aims to address these issues by providing a more biomimetic environment for cancer cells. To create our 3D model, we chose collagen type I as our basic matrix component. Collagen type I hydrogels are particularly useful because they are highly biocompatible, malleable by cell behaviour and mimic the basic ECM composition of the natural tumour microenvironment.18,19 Our previous work reported the development and characterization of a model of colorectal cancer based on plastic compression of collagen hydrogels. 20 The model was created with distinct compartments: a plastically compressed collagen gel populated by cancer cells which was nested in uncompressed collagen populated with fibroblasts and endothelial cells. This manipulation of collagen density for mimicking the dense nature of solid tumours was the first use of this technique for culturing cancer cells in 3D. The aim of this study was to produce and characterize the use of a consistent, scaled down 3D model with physiological levels of collagen as a potential drug-screening platform using two colorectal cancer cell lines and their response to EGFR inhibition.
Prior to drug testing, we characterized the growth characteristics of the two chosen colorectal cancer cell lines in 3D culture. The growth rates of HT29 and HCT116 cultures, as measured by metabolic activity, varied slightly. HT29 cultures exhibited a gradual increase in proliferation and appeared to plateau between days 10 and 14. Morphologically, the cells did not stop increasing in size or number between these time points, implying an inability of alamarBlue to penetrate into the tight cellular aggregates. This problem of transferring 2D end-point assays to 3D cell culture has been highlighted before in detail, and cell morphology was investigated as a secondary assay of growth. 21 Equally, HCT116 cultures proliferated well over the 14-day period; however, at day 7, the proliferation profile appeared to drop transiently (Figure 2(a)). There was no concomitant reduction in the size of cellular aggregates, suggesting that the biochemical changes (reflected in the alamarBlue readings) may describe a short phase of quiescence, which did not affect gross cellular behaviour. HT29 and HCT116 cultures formed morphologically distinct cellular aggregates. Immunofluorescent staining of tubulin and F-actin demonstrated different expression levels for both cytoskeletal proteins. HT29 cultures exhibited a slightly lower, more heterogeneous level of expression of tubulin; however, this may have been an inability of the antibody to penetrate into the cellular aggregates (with HT29 appearing to form more tightly packed aggregates than HCT116). The penetration of antibodies and large molecules has always presented a significant issue in both in situ tumours and in vitro tissue-like substitutes. Xiang et al. 22 treated a spheroid model of mesothelioma with a fluorescently labelled SS1P immunotoxin antibody and monitored penetration over 16 h. The authors reported that the penetration of SS1P was limited to the outer periphery of the spheroids following 4 h of treatment indicating inadequate penetration to the core of the spheroid. The ‘grape-like’ morphology of HCT116 has been observed before in a panel of breast cancer cell lines cultured in 3D. 16 The authors found that eight out of nine cells that formed a grape-like phenotype were isolated from tumour metastases indicating an acquired ability of these cells to metastasize over the course of their evolution. This supports the reported invasive behaviour of HCT116 cells in comparison to HT29 cultures. 23 Furthermore, the immunofluorescent images in Figure 3 show the loosely bound morphology of HCT116 cells in addition to the cellular protrusions that are typically involved in cell motility. 24 These migratory fronts are classically driven by chemoattractants that stimulate intracellular pathways such as the EGFR pathway. A recent study by Patsialou et al. 25 demonstrated that macrophage-dependent invasion of breast tumour cells in a mouse model was driven by an epidermal growth factor (EGF)/colony-stimulating factor-1 (CSF-1) paracrine loop between host tumour cells and macrophages. 25 The implication of these protrusions in our 3D model may indicate an autocrine signalling pathway involved in the motility of HCT116 cells in physiologically relevant collagen gels.
The expression of EGFR has always been taken as a prerequisite for cetuximab therapy. HT29 and HCT116 (low and high expressing cell lines, respectively) expressions of EGFR were compared and shown to be greatly enhanced in 3D culture in comparison to 2D. The analysis of cetuximab therapy in our 3D model has demonstrated that EGFR expression levels do not necessarily correlate with cetuximab efficacy in vitro. This is consistent with findings in the literature. 26 Wild et al. measured the EGFR expression levels in 11 human carcinoma xenografts and their responses to cetuximab therapy. They revealed a very low correlation profile between EGFR expression in xenografts and response to cetuximab. However, in recent years, it has emerged that KRAS mutant status is a much more effective indicator of response to anti-EGFR therapy. 27 The HT29 cell line was chosen for cetuximab treatment in this case for its positive EGFR status and wild-type KRAS status and the HCT116 cell line for its KRAS mutant status. Although cetuximab was effective on HT29 cells in both 2D and 3D, its inhibitory effect was limited at high concentrations. This could be due to several reasons. First, HT29 cells are a BRAF mutant cell line which has been shown previously to lack a sufficient clinical response to cetuximab treatment in a small cohort of patients. 28 Although the precise mechanisms are not fully understood, it is believed that BRAF and KRAS mutant status should be taken together as indicators of cetuximab efficacy. Second, it has been suggested that immune-dependent mechanisms may contribute to an increase in the efficacy of cetuximab. 29 However, reduced efficacy in vitro may also be attributed to the lack of an immune component in our current 3D model. Hsu et al. demonstrated for the first time in a xenograft model of non-small cell lung cancer that increased cetuximab-mediated toxicity was driven by an immune-dependent mechanism. Complement activation leads to complement-dependent cytotoxicity which releases anaphylatoxins, such as C5a, that increase the recruitment and activation of effector cells. Furthermore, the differences between drug response in HT29 cells in 2D and 3D can also be attributed to drug pharmacokinetics. Similar to the in vivo scenario, our 3D model has displayed a level of ‘resistance’ or non-responsiveness to chemotherapeutic treatment in comparison to 2D cultures. The formation of cellular structures over time can function to hinder the penetration of large molecules such as cetuximab to the cells in the core, mimicking the in vivo drug barrier in tissues. Hence, improving the penetration of large molecules and drugs will be vital to maximizing the therapeutic potential of these agents. Finally, HCT116 cells either in 2D or 3D were resistant to cetuximab treatment, in line with their KRAS mutant status. Interestingly, exposure to cetuximab appeared to promote HCT116 growth by modest, not significant amounts. This increase is not sufficient to lead us to investigate whether this is an example of paradoxical activation of the mitogen-activated protein kinase/extracellular signal-regulated kinase (MAPK/ERK) pathway. However, it is interesting that no such pattern was observed in 2D HCT116 cultures, highlighting potential differences and usefulness of 3D models.
The work described here is the first to investigate the use of a 3D model of cancer with physiological concentrations of collagen for pharmacological testing. To date, the preclinical drug development process has focused mainly on the use of monolayer cell culture systems while disregarding microenvironmental cues that affect cell behaviour, gene expression and drug diffusion. Although use of spheroid cultures can address drug diffusion, further incorporation of ECM components such as collagen can help direct signals that facilitate intracellular cascade events between intracellular and extracellular spaces that may influence drug distribution. This model can be further improved by incorporating other components of the ECM and cell types that are localized to the tumour stroma such as endothelial cells or fibroblasts.
Conclusion
In this study, we have established the use of our simple and consistent tissue-engineered 3D model as a suitable drug-screening platform. Cells behave similar to the in vivo scenario, forming tumour-like cellular aggregates with visible cell–cell junctions in vitro. Furthermore, we have established that cetuximab efficacy is significantly lower in 3D cultures in comparison to 2D monolayers, independent of EGFR expression levels. This signifies the increasingly important role of matrix density and cellular architecture on drug uptake and distribution. This model could be used to further elucidate the biological mechanisms and physical limitations of drug penetration into in situ tumours.
Footnotes
Declaration of conflicting interests
The authors declare that there is no conflict of interest.
Funding
Umber Cheema is a David Phillips BBSRC fellow and Tarig Magdeldin is funded by the UCL Impact Studentship and TAP Biosystems.