
Abstract
Conventional studies indicate that the strength of crossmodal correspondence, which represents the connection between multiple senses and actual human perception, may influence pleasant or unpleasant emotions in some combinations of sensory modality and stimulus type. In this study, sensory evaluation experiments were conducted to evaluate the crossmodal correspondence between visual and auditory sense mediated by ‘complexity’ using closed curve shapes and tone sequences generated based on curvature entropy and tone entropy. The relationship between the sensory evaluation values of the ‘aesthetic preferences’ of the shape/tone sequence combinations and the weakness of crossmodal correspondence, that is, the difference of curvature and tone entropy, was fitted to the Wundt curve, one of the models of pleasant emotion. As a result, a strong correlation (0.64) was confirmed between the two. Bias due to the musician's experience was confirmed in the sensory evaluation values of some tone sequences.
How to cite this article
Osugi, K., Hayashi, J., Kato, T., & Yanagisawa, H. (2026). Relationship between aesthetic preference and ‘complexity’ mediated crossmodal correspondence of shape and tone sequence. i–Perception, 17(1), 1–17. https://doi.org/10.1177/20416695261420290
Introduction
In recent years, product design strategies that take into account multiple sensory responses have emerged. Examples of this include food packaging designs that improve the significance of selection through shapes that correspond to taste (Spence & Ngo, 2012), and soap container designs whose colour corresponds to its fragrance to improve the sensory evaluation value of the soap's expected cleaning effect (Gatti et al., 2014). This connection between multiple senses and human perception is known as crossmodal correspondence, which is defined as ‘a compatibility effect between attributes or dimensions of a stimulus (i.e., an object or event) in different sensory modalities (be they redundant or not)’ (Spence, 2020). This crossmodal correspondence can be seen in a variety of stimuli, such as brightness and size (Maurer et al., 2006), taste and sound (Bronner et al., 2012; Crisinel & Spence, 2009), shape and texture (Juravle & Spence, 2024), and form and smell (Gal et al., 2007; Seo et al., 2010). The strength of crossmodal correspondence has also been suggested to influence emotion. Specifically, the combination of a blue colour and a smooth shape, which is considered a strong correspondence, has been shown to increase pleasant emotion more than the combination of a blue shape and a complex shape, which is considered a weak correspondence (Bar & Neta, 2007; Lin et al., 2021; Spence, 2011; Wilson & Brewster, 2017). On the other hand, combinations of red visual stimuli and superheated stimuli, which are considered to have a stronger correspondence, have been found to increase unpleasant emotions more than combinations of blue visual stimuli and heated stimuli, which are considered to have a weak correspondence (Wilson & Brewster, 2017). These studies indicate that the strength of crossmodal correspondence may influence pleasant and unpleasant emotions, despite differences in sensory modality and stimulus type.
Crossmodal correspondence is interpreted in the predictive coding theory of neuroscience as ‘a phenomenon where, when two stimuli from different modalities are experienced simultaneously (hereafter, multimodal learning), the presentation of a stimulus from one modality predicts a stimulus from the other modality. Consequently, the actual stimulus is perceived as slightly closer to the predicted stimulus’. (Huang et al., 2024; Talsma, 2015). Furthermore, audiovisual reaction time measurements have demonstrated that crossmodal correspondence strengthens as the number of multimodal learning sessions increases (Huang et al., 2024). Predictive coding theory posits that the brain, based on a Bayesian model, treats the product of the prior distribution (the probability distribution of predicted stimuli) and the likelihood function (the probability distribution of actual stimuli) as the posterior distribution (the probability distribution of stimulus perception). It further assumes that the prior distribution is updated to the posterior distribution (learning) (Berniker et al., 2010). Here, the cognitive misalignment implies that the posterior distribution – the product of the prior distribution and the likelihood function – becomes biased toward the prior distribution. This bias is known to decrease as the variance of the prior distribution increases, thereby increasing free energy (a measure of information representing the difference between the actual stimulus and its prediction), which is parameterized by the difference between the prior and posterior distributions (Yanagisawa, 2021). Sekoguchi and Yanagisawa (2020) mathematically hypothesized that this free energy corresponds to Berlyne's (1960) arousal potential (i.e., positive affect follows an inverted U-shaped Wundt curve as a function of free energy). This hypothesis has been verified in several studies concerning aesthetic preferences for car or butterfly shapes, and the pleasantness of music deviating from musical rules (Miyamoto & Yanagisawa, 2021; Sasaki et al., 2024; Schoormans & Robben, 1997; Van de Cruys & Wagemans, 2011; Yanagisawa, 2021; Yanagisawa et al., 2019). Here, the variance of the prior distribution increases with insufficient learning iterations (Berniker et al., 2010). Therefore, the variance is considered to increase when the number of multimodal learning iterations, which is a factor in crossmodal correspondence, is low (i.e., it decreases when crossmodal correspondence is strong). Furthermore, this increase in prior variance has been shown to increase free energy (Yanagisawa, 2021). Based on the series of research results described above, it can be inferred that positive emotion takes an inverted U-shaped form as a function of the strength of crossmodal correspondence. However, most studies on crossmodal correspondence have qualitatively analysed the presence or absence of crossmodal correspondence using two levels of stimuli; few studies have used multilevel parameterized stimuli. To fill this gap, Hayashi et al. (2024) conducted a quantitative study of crossmodal correspondence mediated by ‘complexity’ for visual and auditory stimuli using two-dimensional closed curve shapes (2D shapes) as visual stimuli and tone sequences consisting of seven pitches as auditory stimuli. The results revealed that shapes with low (high) curvature entropy are more readily selected for tone sequences with low (high) tone entropy. This suggests that the smaller (larger) the difference between the two entropies, the stronger (weaker) the crossmodal correspondence becomes. Therefore, similarly to Sekoguchi and Yanagisawa (2020), by using the relationship between free energy and pleasant emotion, it may be possible to clarify the relationship between the weakness of crossmodal correspondence and pleasant emotion using combinations of multilevel visual and auditory stimuli selected with the difference between tone and curvature two entropies as a parameter. Here, as the difference between the two entropies increases (indicating weaker crossmodal correspondence), the level of arousal also increases. Therefore, to align the relationship between the difference in entropy and the level of arousal, we will express the difference in entropy as the ‘weakness’ of crossmodal correspondence.
The present study aims to examine the influence of crossmodal correspondence weakness on pleasant emotions. The study also fits the Wundt curve to the sensory evaluation value of ‘aesthetic preference’ for the same value and the combination of shape and tone sequence. This could be applied to diverse fields such as product design, multimedia art, user experience, and multisensory marketing if it clarifies the relationship between the weakness of crossmodal correspondence and pleasant emotion. For example, in product design, it could provide guidelines for deriving specifications related to multiple senses (shape, surface characteristics, sound, etc.) to achieve pleasant emotion toward the product (such as beauty or aesthetic preference).
The remainder of the paper is organized as follows. Section Indices of Stimuli describes the curvature and tone entropies, which are indices of ‘complexity’ of shapes and sequences, and the index of weakness of crossmodal correspondence, which is expressed as the difference between them. Section Experiment describes the experiment in detail and analyses the results of the experiment, and Section Conclusion presents the conclusions and limitations of this study.
Indices of Stimuli
‘Complexity’ of Shapes
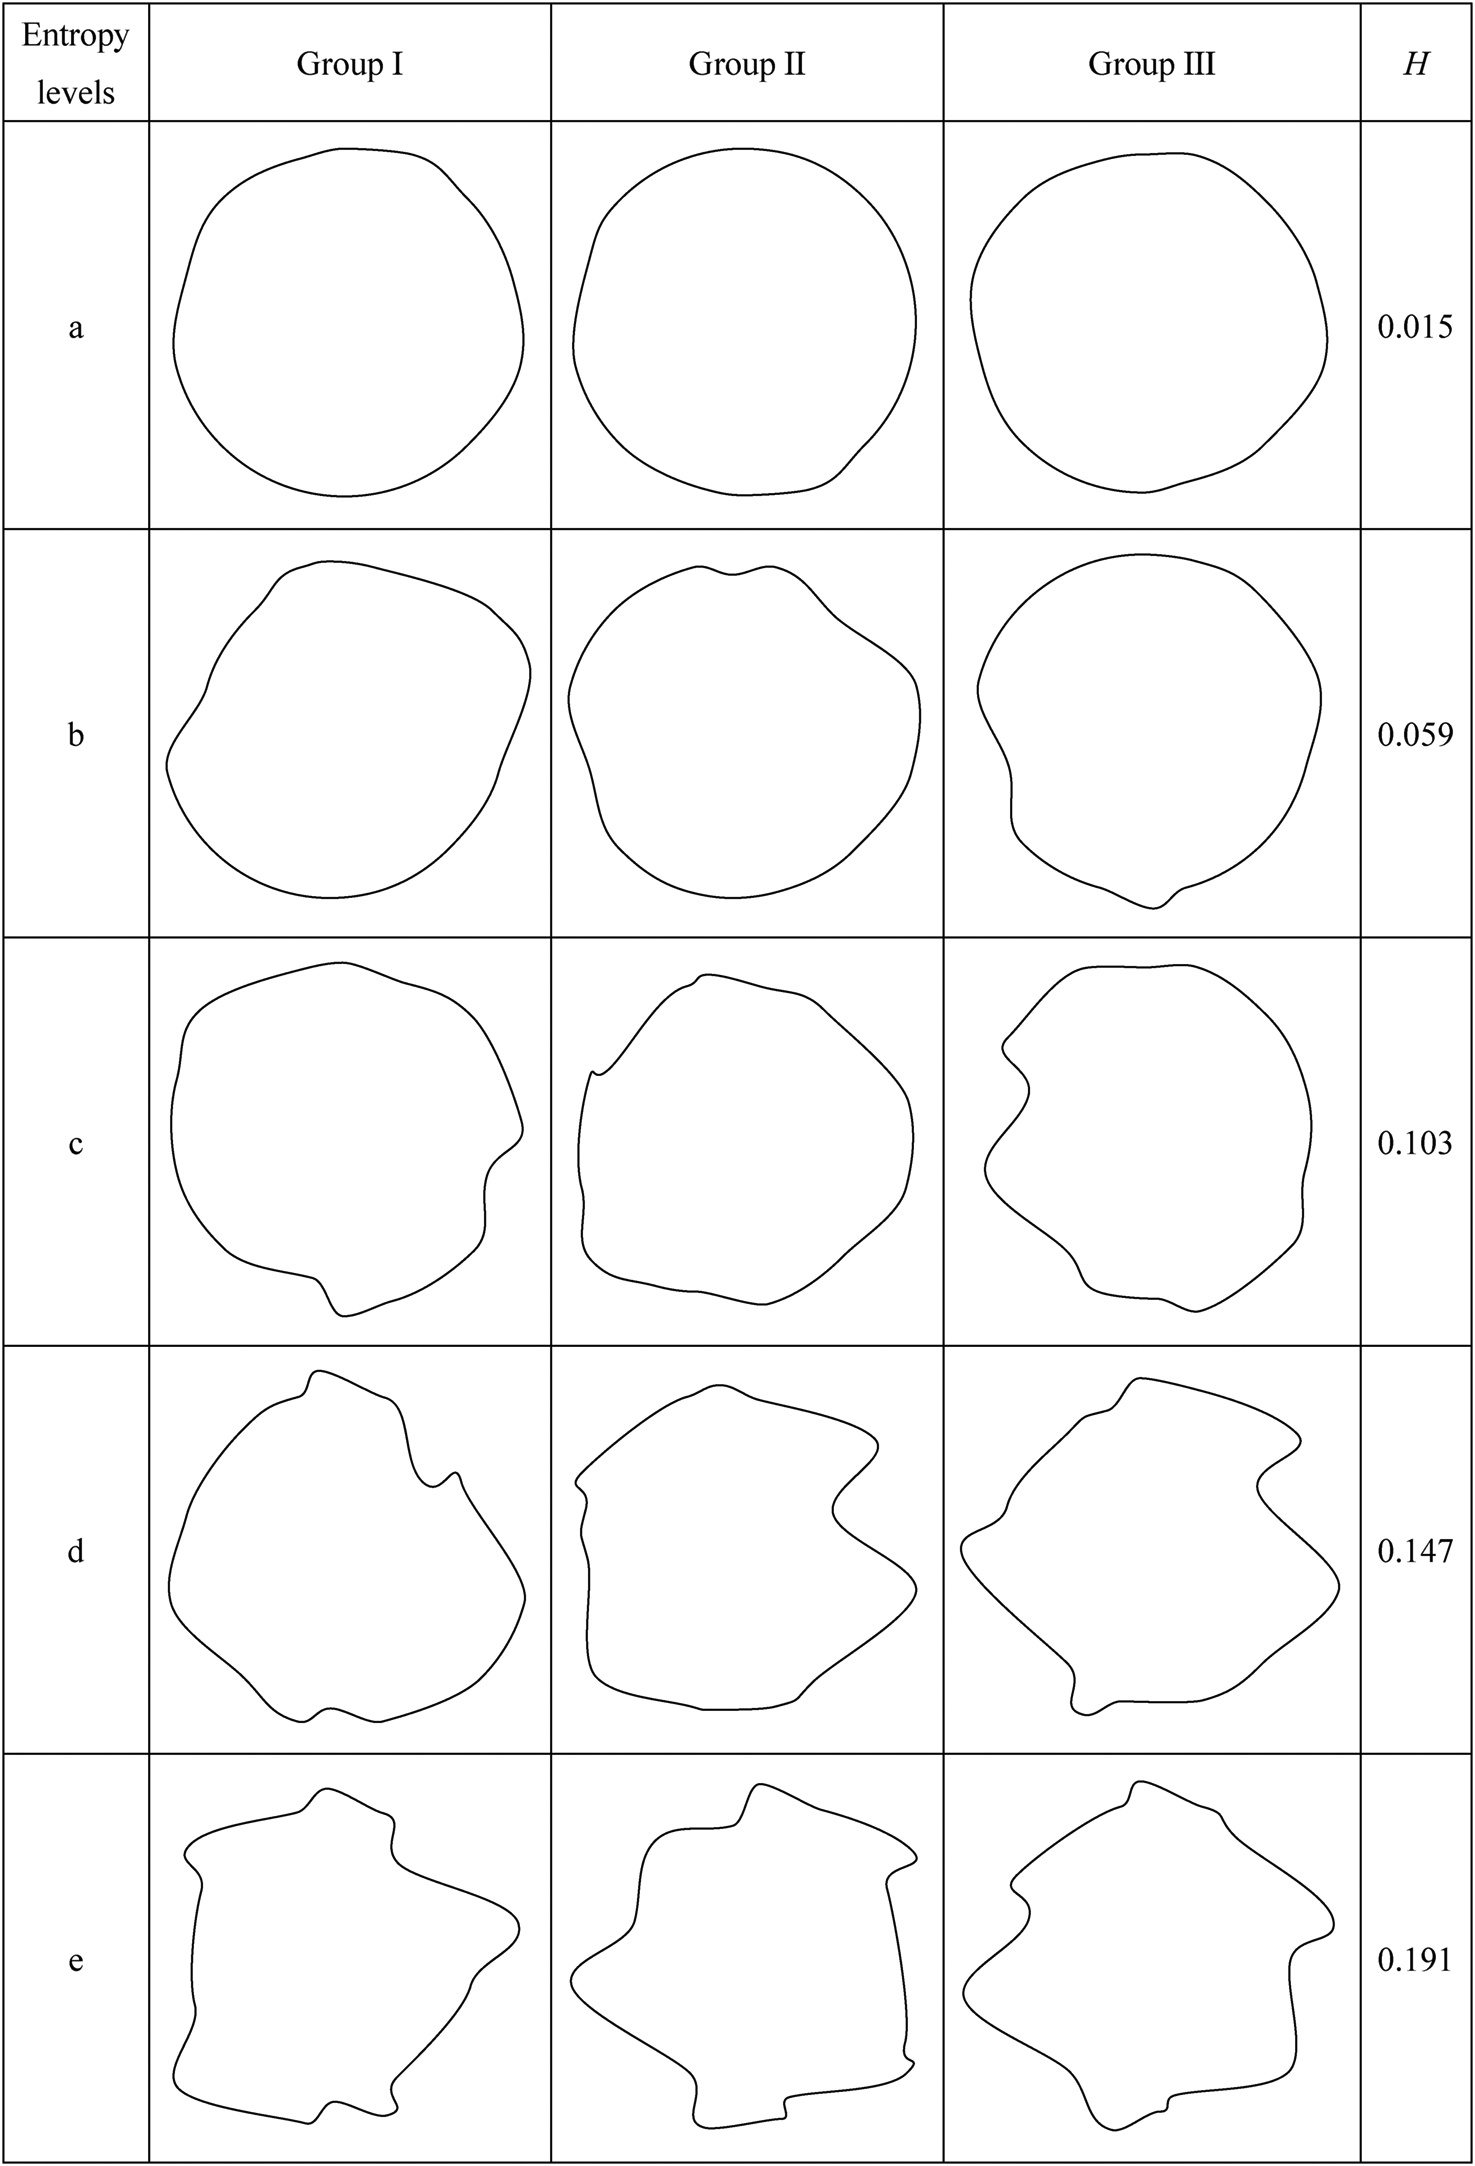
Fractal dimension (Spehar et al., 2003) and curvature entropy (Ujiie et al., 2012) have been proposed as quantifiers of 2D shape ‘complexity’. The former is applied to shapes with discrete features such as straight lines and texture patterns, while the latter is applied to shapes with continuous properties such as closed curve shapes. In this study, we used curvature entropy because it is appropriate for the ‘complexity’ of closed curve shapes (Biederman & Ju, 1988; Matsumoto et al., 2019), which are considered to have a significant impact on the impression of a product. The method for calculating curvature entropy is described in Equation (1).

First, the closed curve shape is divided equally and the curvature at each division point is calculated. Next, since the value of curvature varies with the size of the curve shape, the curvature is non-dimensionalized by multiplying the maximum radius from the centre of gravity of the closed curve shape by the curvature to obtain the non-dimensionalized curvature. The calculated non-dimensionalized curvature is then used to obtain the non-dimensionalized curvature function, which is a function of curve length and non-dimensionalized curvature, and the range of the non-dimensionalized curvature function is discretized by dividing it by the number of states V. Finally, using the probability of occurrence
‘Complexity’ of Tone Sequences
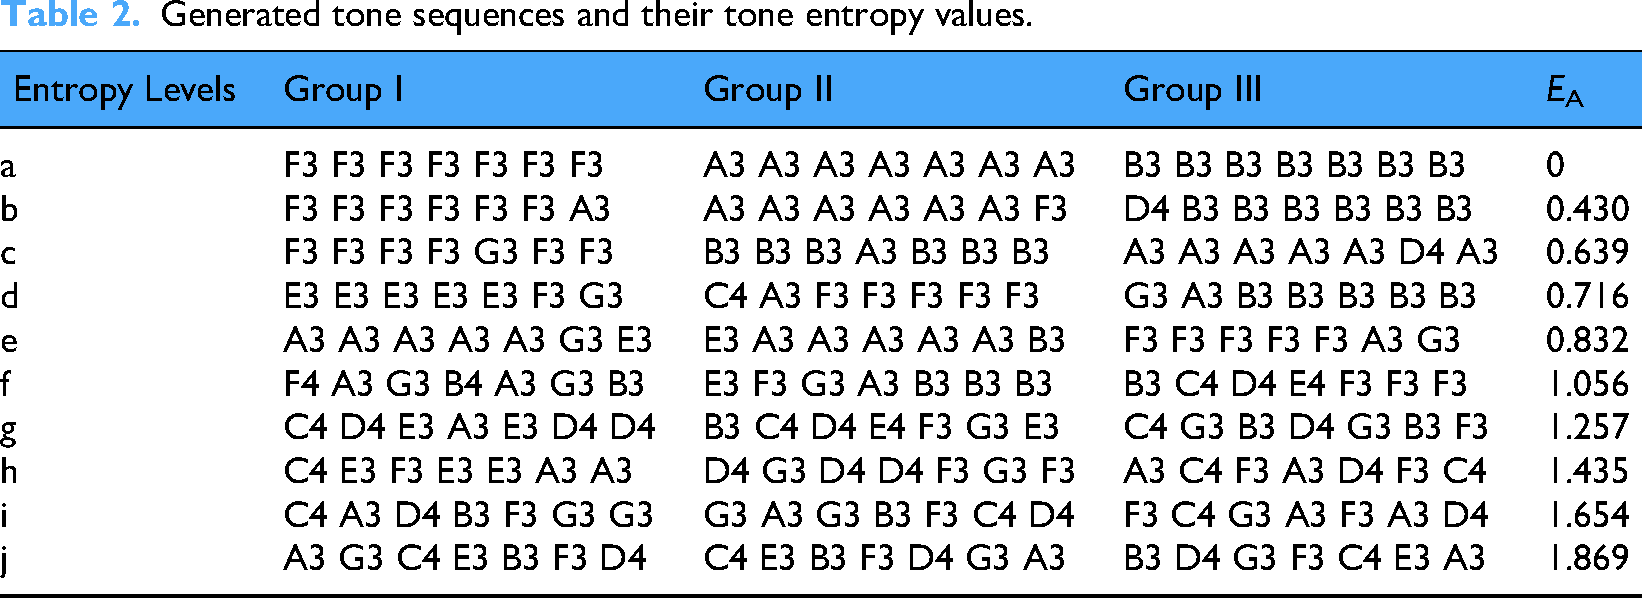
Fractal dimension (Beauvois, 2007) and tone entropy (Delplanque et al., 2019) have been proposed as quantification measures of ‘complexity’ of tone sequence. The former is applied only for long tone sequences of at least 64 tones (Beauvois, 2007) to quantify repeated representations. The latter is, however, calculated by the probability of occurrence of individual tones or intervals in a more localized manner and is applied only for short tone sequences of around seven tones. In this study, we used tone entropy because it is suitable for the ‘complexity’ of tones as short as seven tones (Hsu et al., 2021), where the repetition effect does not cause changes in aesthetic preferences. For pitch entropy, a preliminary experiment (Appendix 2) was performed to determine the most suitable out of the three types. Specifically, first-order entropy represents the probability of the occurrence of a pitch, second-order entropy represents the probability of the occurrence of a transition in a pitch, and averaged entropy is the average of the two. The results of the preliminary experiment supported the use of mean entropy, which had the strongest correlation with tone ‘complexity’. The mean entropy

First-order entropy E1 is the entropy of the probability
Weakness of Crossmodal Correspondence
As mentioned above, a previous study (i.e., Hayashi et al., 2024) has confirmed that crossmodal correspondence occurs when tone sequences with low (high) tone entropy and shapes exhibiting low (high) curvature entropy are combined. The relative magnitude of these two entropies is determined not by absolute evaluation, but by relative evaluation within the entropy range of the presented visual or auditory stimuli. In this study, the weakness of crossmodal correspondence is defined as the absolute value of the difference between normalized curvature entropy H′ for the shape and the normalized averaged entropy EA′ for the tone sequence |H′-EA′|. Normalization was performed to obtain maximum and minimum entropy values of 1 and 0, respectively, for the presented stimulus group.
Experiment
Stimuli
Shapes
The presented closed curve shape was created using a cubic Bézier curve. Fourteen connection points were defined that could be moved within a certain range. The movable range was defined as half the distance to the nearest junction point. The curvature of the 14 connection points defined was used as the design variable, and the absolute difference between the curvature entropy calculated from the 14 curvatures and the target value was used as the target characteristic.
The maximum and minimum values of curvature entropy were obtained by using particle swarm optimization to search for the shape that maximizes and minimizes the curvature entropy without setting a target value. The range of these two curvature entropy values was divided into four equal parts and three levels of curvature entropy values were added to obtain a total of five levels of curvature entropy values, which were then set as the target values for particle swarm optimization, and a search was conducted to obtain a shape with five levels of curvature entropy. The circle shape with the minimum (0) curvature entropy was excluded to account for simple contact effects (Graf & Landwehr, 2015; Hekkert et al., 2013; Zajonc, 1968). This is because shapes with many contact opportunities overestimate pleasant emotions compared to shapes with few contact opportunities (Bornstein, 1989; Shimizu et al., 2024).
In conventional studies, the variability in sample shapes and tone sequences was greater than the variability among participants. Therefore, this study prioritized confirming that similar results could be obtained across different samples by conducting verification experiments divided into three groups. Consequently, the above procedure was repeated three times, and a total of 15 shapes with five levels of curvature entropy were created, three each (Table 1). The shapes were presented as closed curve shapes, which are considered to be correlated with the sensory evaluation of ‘complexity’ (Ujiie et al., 2012).
Generated 2D shapes and their curvature entropy value.
Tone Sequences
A tone sequence consisting of seven tones was randomly created from the eight tones from E3 to E4 (Delplanque et al., 2019). The seven tones of the created tone sequence were used as design variables, and the absolute value of the difference between the mean entropy calculated from the seven tones and the target value was used as the target characteristic. The design variables that minimize the target characteristics were searched for by GRG nonlinear programming with integer constraints using the following procedure to create a sequence of tones.
Without setting a target value for tone entropy, the maximum and minimum values of tone sequence entropy were obtained by using GRG nonlinear programming to search for the tone sequence that maximizes and minimizes the target value. The range of these two tone entropy values was divided into nine equal parts and eight levels were added to obtain a total of 10 levels of tone entropy values. A search was then conducted by setting the values of the 10 levels of tone entropy to the target values of GRG nonlinear programming, and tone sequences with 10 levels of tone entropy were obtained. Among the randomly generated tone sequences, the last three tones of a tone sequence whose last tone corresponded to the tone predicted from the first two tones were excluded. This is because preference tends to increase when the last tone sequence is predictable, even if it is a complex tone sequence (Graf & Landwehr, 2015).
For the presented tone sequences, following the same reason as for the presented shapes, we created three tone sequences with 10 levels of tone entropy, for a total of 30 tone sequences (Table 2). The tone sequences were presented using the sound of a grand piano, which is considered to be less likely to cause differences in recognition of chord structures and chord progressions as a result of differences in musical experience (Bigand et al., 1996; Miyamoto & Yanagisawa, 2021; Palmer et al., 2013, 2016).
Generated tone sequences and their tone entropy values.
Procedure
Thirty participants were divided into three groups as for the shape and tone sequence to ensure proper experimental load and generalization performance. Group I included 10 participants (6 males and 4 females) aged 21 to 24, Group II included ten participants (6 males and 4 females) aged 20 to 26, and Group III included 10 participants (5 males and 5 females) aged 20 to 24. The following are the procedures for the sensory evaluation of crossmodal correspondence between the shape and the tone sequence performed by each participant.
Participants were seated in front of a shape monitor (BenQ GW2760) while wearing headphones (SHURE SRH440A) for the presentation of tone sequences (Figure 1). Before the start of the sensory evaluation, five sample shapes (Table 1) and 10 sample tone sequences (Table 2) were all presented to the participant. Only the shapes were presented to the participants. Seven-point scales were used to rate ‘complexity’ (1: strongly simple, 7: strongly complex) and ‘aesthetic preference’ (1: strongly disagree, 7: strongly agree). The order in which the shapes were presented was randomized. The participants were presented with only the tone sequences and asked to rate the ‘complexity’ and ‘aesthetic preference’ of the tone sequences in the same way as they rated the shapes. Ten seconds after the shape was presented, the tone sequence was also presented, and the participants were asked to evaluate their ‘aesthetic preference’ for the combination of the shape and the tone sequence. Participants were asked in a post-experiment interview about their impressions of the shapes and sound sequences treated in the experiment.

Experimental environment.
Results and Discussion
Figure 2 shows the relationship between the sum of the aesthetic preferences when the shape and tone sequences are presented individually and when they are presented simultaneously. The plots in the figure are divided into five groups, from Group 1 (low) to Group 5 (high), according to the magnitude of the difference between curvature entropy and tone entropy, a measure of the ‘complexity’ of the shape and tone sequences (Gap group). If the weakness of crossmodal correspondence does not affect aesthetic preferences, the plots are placed near the right ascending straight line. Figure 2 also shows that Gap groups with small differences in ‘complexity’ between shapes and tone sequences, such as Group 1 and 2, are placed higher than Group 4 and 5, which have larger differences. This suggests that the smaller the weakness of crossmodal correspondence is, the greater the aesthetic preferences when the shapes and tone sequences are presented simultaneously.
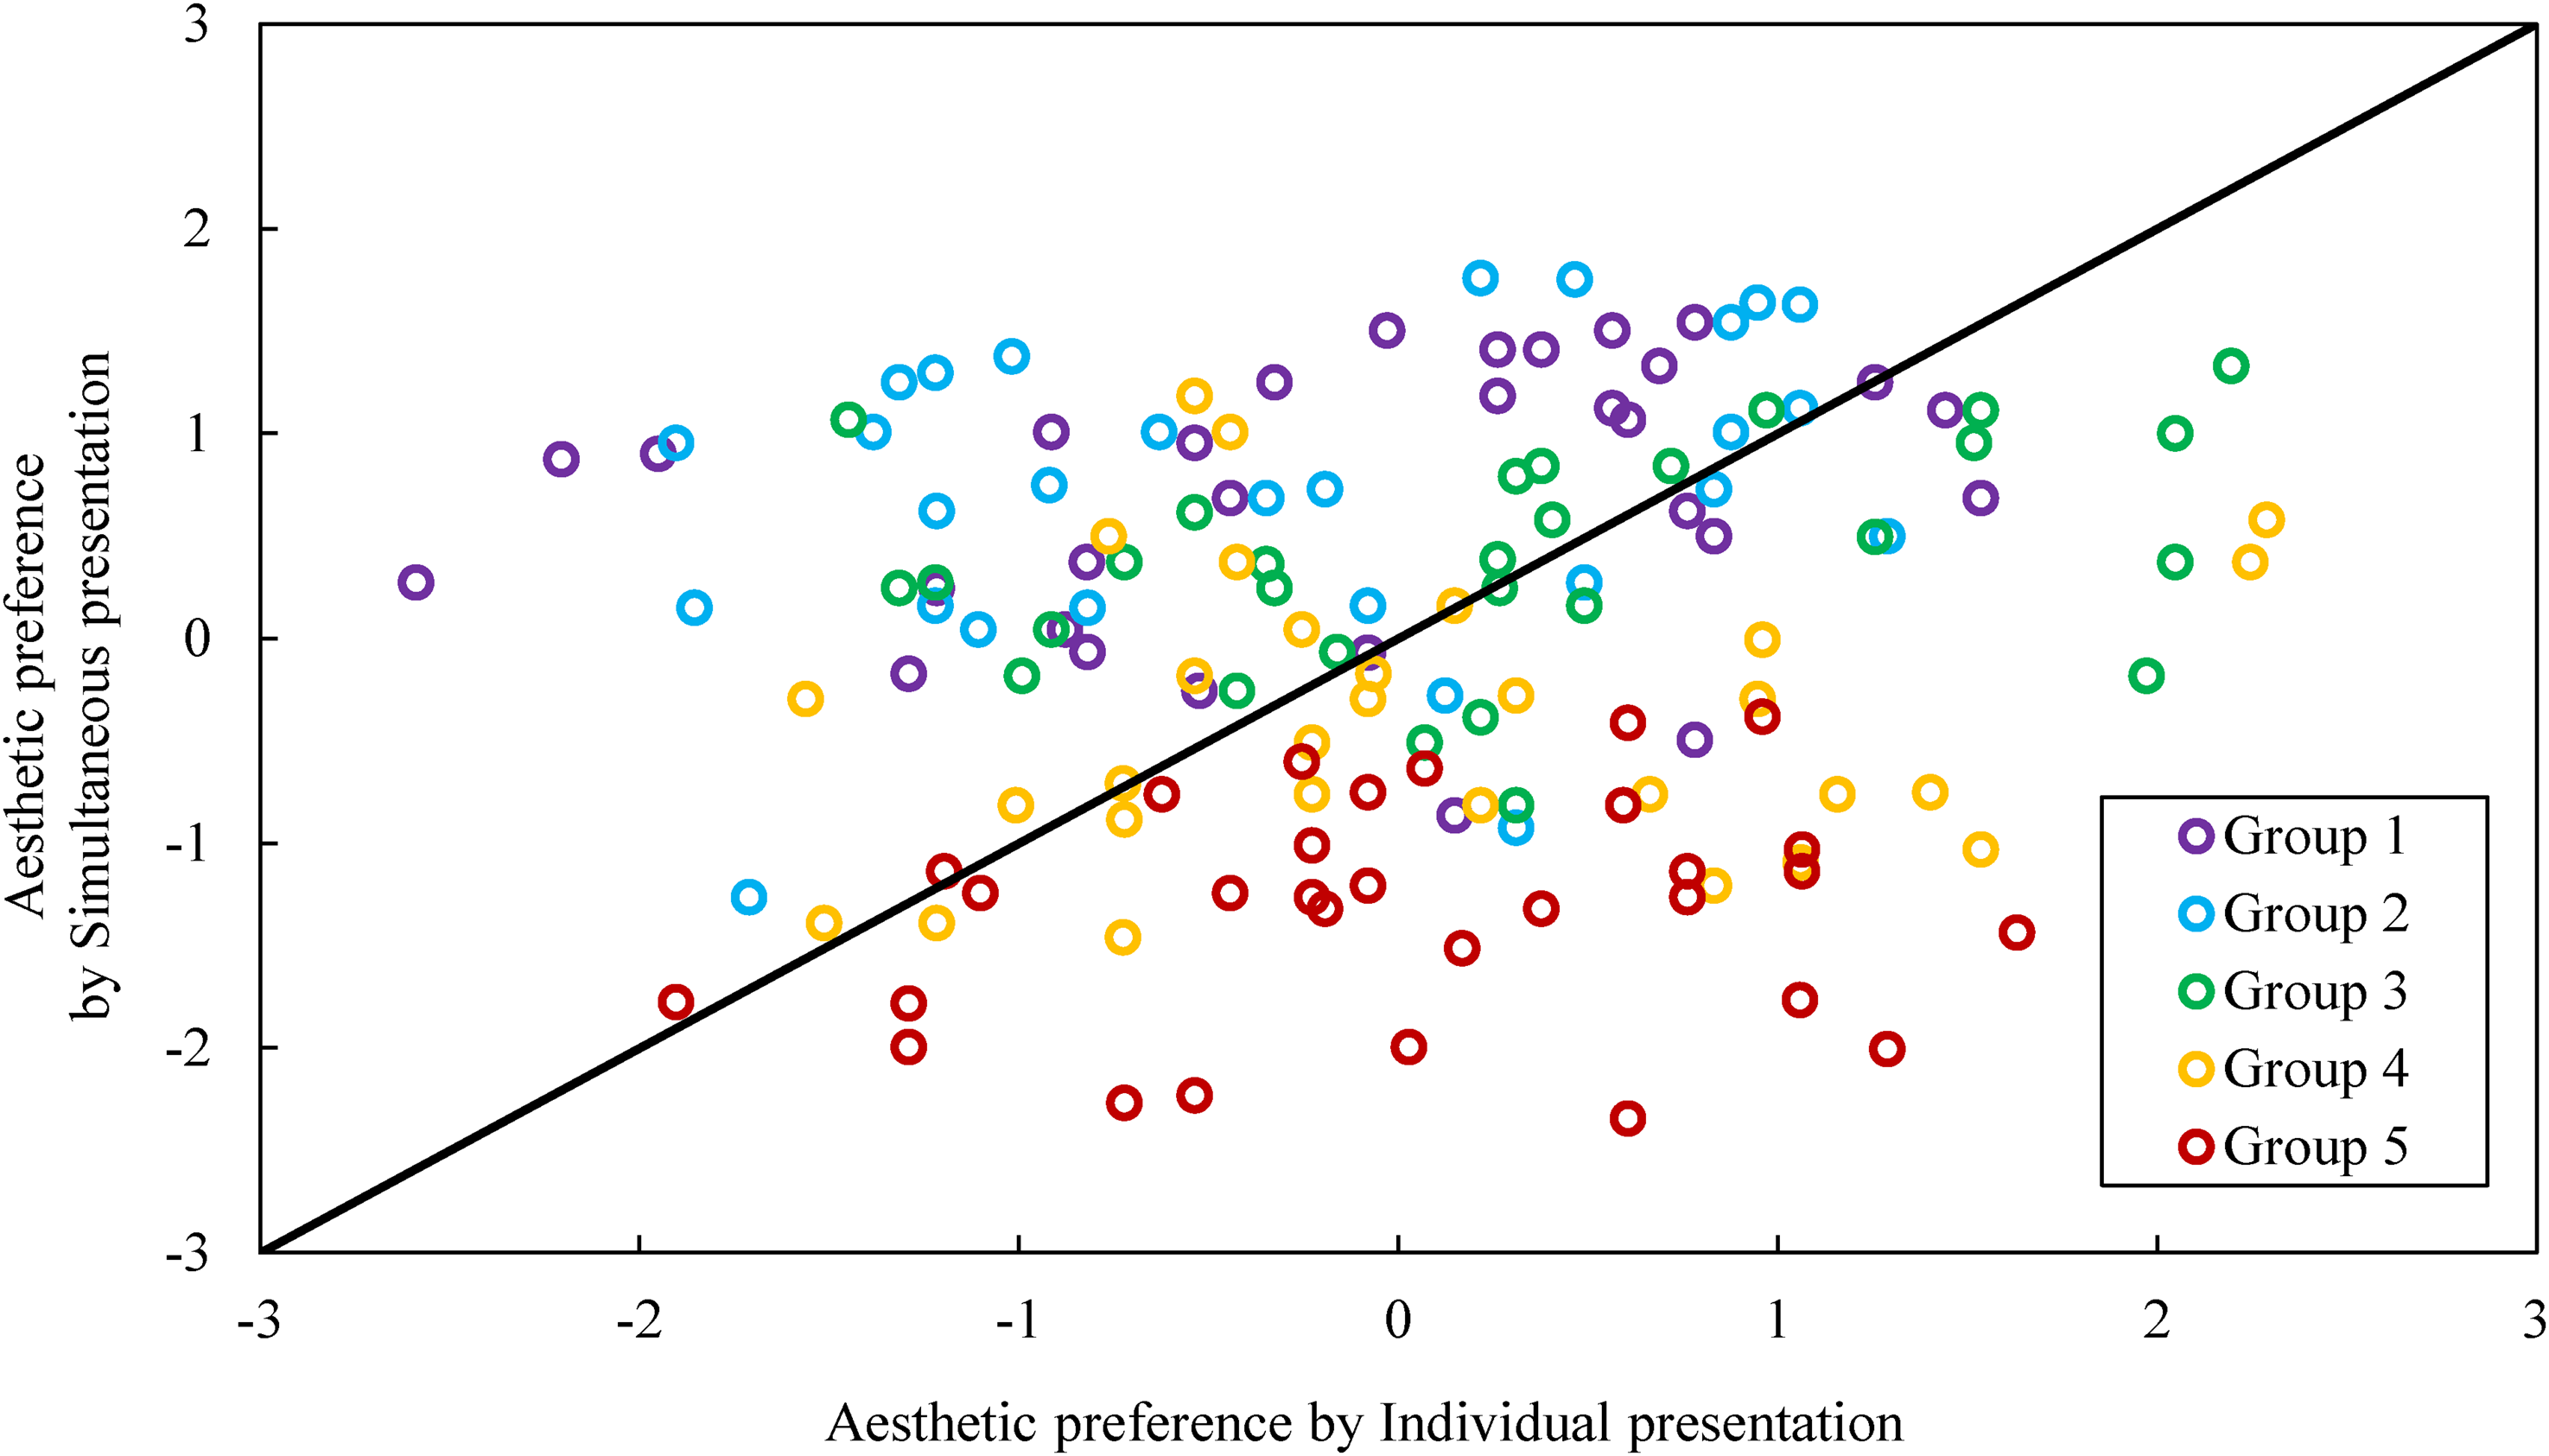
Relationship between the sum of aesthetic preferences.
We calculated the difference between the sum of the aesthetic preferences for the combination of shape and tone sequences and the sum of the aesthetic preferences for the shape and tone sequences alone (Difference of aesthetic preferences). This index represents the amount of change in aesthetic preferences due to weak crossmodal correspondence. We conducted a two-way ANOVA with the experimental group (Group I vs. Group II vs. Group III) and Gap group (Group 1 vs. Group 2 vs. Group 3 vs. Group 4 vs. Group 5) as factors. The results showed that the main effect of the experimental group was not significant (p = 0.99), while the main effect of Gap group was significant (p = 0.00).
Next, a box-and-whisker plot of Difference of aesthetic preferences for Gap group and the results of a Bonferroni multiple comparison test were performed (Figure 3).

Relationship between complexity difference and deviation of aesthetic preferences (mean of least squares error). *means p < 0.05, ****means p < 0.0001.
Figure 3 shows small (p < 0.05) and very small (p < 0.0001) p-values between some groups. Here, the effect size η2 is 0.41, confirming a large effect. Furthermore, while difference of aesthetic preference was positive and tended to increase in Groups 1 and 2, where the differences in shape and ‘complexity’ of tone sequences were small, while in Groups 3, 4, and 5, Difference of aesthetic preference changed from positive to negative values. On the other hand, Difference of aesthetic preference decreases from positive values to negative values in Groups 3, 4, and 5. Furthermore, focusing on Groups 1 and 2, where the Gap is small, we see that Difference of aesthetic preference in Group 1, where the Gap is small, is small, while in Group 2, where the Gap is large, Difference of aesthetic preference is large. These results suggest the same characteristics as the Wundt curve, that is, when the Gap is small (large), pleasant emotions are obtained (or not obtained), but when the Gap is too small, pleasant emotions are not obtained. In other words, the relationship between the weakness of crossmodal correspondence and aesthetic preferences is similar to the inverted U-shaped relationship of the Wundt curve.
Figure 4 shows a scatter plot of the sensory evaluation values for crossmodal correspondence weakness and aesthetic preference, with an approximation of the Wundt curve added. The explanation of the Wundt curve function and parameter selection is shown in Appendix 3.

Relationship between weakness of crossmodal correspondence and aesthetic preference.
Some tone sequences (Group I tone sequence f (denoted as tone sequence I-f), tone sequence I-g, tone sequence II-g, and tone sequence III-f) deviate from the Wundt curve, although the inverse U-shaped trend of the Wundt curve with a high coefficient of determination can be confirmed (R2 = 0.64). Three reasons for the deviation of these tone sequences from the inverted-U trend can be cited. First, as in tone sequences I-g, II-g, and III-f, the magnitude of the change in the tone sequence affects the evaluation of ‘complexity’. This was evident in the post-experiment interviews with the participants, where many commented that they felt more complex when the transitions between tones were large. Second, there are individual differences in the assessment of ‘complexity’ and ‘aesthetic preference’ among participants. This was inferred from the fact that the variation in sensory evaluation scores for ‘complexity’ and ‘aesthetic preference’ differed between participants (e.g., some participants gave extreme evaluations while others gave moderate evaluations). Third, participants felt that tone sequences with pitches not predicted by music theory models (Narmour, 1992), such as Sequence I-f and Sequence I-g, were complex. This was evident in the post-experiment interviews with the participants, where many of them commented that when a different scale from the prediction exists in the first half, the subsequent scales become unpredictable, and the entire sequence is perceived as complex. This aligns with the implicit realization model, which determines whether the prediction of the third tone that occurs after hearing two tones matches the third tone actually heard (Zbikowski & Narmour, 1993). According to this model, tone sequence I-f in Table 1 differs from the prediction of the fourth tone from the first three tones, and tone sequence I-g differs from the prediction of the third tone from the first two tones. Since such model predictions are more likely to occur in subjects with higher sensitivity to music, it is possible that these subjects overestimated the ‘complexity’ of such tone sequences more than other subjects (Margulis & Beatty, 2008, Roeder, 1993). In fact, during post-experiment interviews with participants, several participants with over 3 years of experience with musical instruments commented: ‘After A3 and G3, F3 would have been natural, but B3 came instead, making the tone sequence I-f feel complex’, and ‘Based on major and minor scale rules, after C4 and D4, E4 would have been natural, but E3 came instead, making the tone sequence I-g feel complex’.
In order to exclude the overestimation of ‘complexity’ due to musical knowledge, we analysed sensory evaluation values of crossmodal correspondence weakness and aesthetic preference when subjects with musical experience (more than 3 years of instrumental experience) were excluded (Figure 5).

Relationship between weakness of crossmodal correspondence and aesthetic preference without participants with musical experience.
Figure 5 shows that the sensory evaluation values for tone sequences I-f, I-g, II-g, and III-f, which previously did not follow the trend, are now located near the Wundt curve, confirming an inverse U-shaped trend of the Wundt curve with a high coefficient of determination (R2 = 0.69).
Conclusion
In this study, we examined the effect of the weakness of crossmodal correspondence on pleasant emotions using shapes and tone sequences generated based on a ‘complexity’ index. First, we proposed a quantification index for the weakness of crossmodal correspondence using the difference between the ‘complexity’ indices of the shapes and tone sequences. Next, we fitted the Wundt curves to the sensory evaluation values of ‘aesthetic preference’ for the same values and combinations of shape and tone sequences. The results suggest a possible influence of the weakness of crossmodal correspondence on pleasant emotions, and that the qualitative trend of the Wundt curve is consistent with that of its qualitative trend.
Specifically, the relationship between the weakness of crossmodal correspondence and pleasant emotion was found to be consistent with the qualitative trend of the Wundt curve, except for some tone sequences. Additionally, it was confirmed that the magnitude of the change in tone scale affected the evaluation of ‘complexity’. The corresponding tone sequence deviated from the trend of the Wundt curve in the relationship between the weakness of crossmodal correspondence and pleasant emotion. The greater the weakness of crossmodal correspondence, the smaller the aesthetic preference when the shape and tone sequence are presented simultaneously.
Regarding music knowledge, experienced musicians perceived tone sequences with tones not predicted by the model based on music theory as more complex. Therefore, it was confirmed that the corresponding tone sequences deviated from the trend of the Wundt curve in the relationship between the weakness of crossmodal correspondence and pleasant emotions.
The following study limitations – related to index and participant characteristics (discussed separately) – should be considered when interpreting the results of this study. Regarding index, the following two points are noted. First, it fails to consider indices of ‘complexity’ in tone sequences other than tone entropy. Therefore, it is necessary to verify whether similar results to this study can be obtained using other ‘complexity’ indices, such as the sum of pitch magnitudes in piano (Prince & Pfordresher, 2012) or the total number of deviations from strong beat in the hi-hat within drums (Mezza et al., 2023). Second, there is no guarantee that the proposed index of weakness of crossmodal correspondence (the difference between two entropies), which was based on the experimental results of a single prior study, is optimal. Therefore, it is necessary to compare the proposed index with other indices. Regarding participant characteristics, the following three points can be noted. First, it fails to account for participants’ cultural background (such as nationality, age, occupation, customs, history, and education), cognitive style (directions of mental information processing like empathizing or systemizing), and emotional state (such as energy or depression). These factors have been shown to influence aesthetic preferences (Greenberg et al., 2015; Lee et al., 2025; She et al., 2025). Therefore, experiments using participants of non-Japanese students and experiments collecting data on cognitive styles and emotional states are necessary to investigate their influence on aesthetic preferences. Second, while we excluded participants with a high level of music theory understanding based on the criterion of ‘three or more years of instrumental experience’, there is no guarantee that this criterion is optimal. Therefore, it is necessary to verify criteria that include factors such as the type of instrument played and the intensity of practice. Third, while the experiment was conducted with a sample size comparable to that of prior studies on crossmodal correspondence (Krugliak & Noppeney, 2016; Vi et al., 2020), the number of participants was limited compared to other conventional studies (Bonetti & Costa, 2017; Gurman et al., 2021). Therefore, to achieve greater generalizability, it is necessary to conduct experiments with a larger number of participants.
Footnotes
Author Contribution(s)
Funding
The authors disclosed receipt of the following financial support for the research, authorship, and/or publication of this article: This work was supported by the Japan Society for the Promotion of Science, (grant number 23K11746, 25H01132).
Declaration of Conflicting Interests
The authors declared no potential conflicts of interest with respect to the research, authorship, and/or publication of this article.