
Abstract
Traditional protective structures are usually equipped with ventilation systems. Main components of the latter are passive air blast safety valves. Their purpose in case of an explosive event outside the structure is to significantly reduce the blast pressure leakage into the structure in order to protect human individuals as well as technical installations. Until now, the performance determination of such valves is mostly realized by means of experimental tests in a shock tube. Considering industrial and modern civil protection applications with their practical implementation, additional methods are required to gain further insights into the behaviour of different valve closing mechanisms and to support novel developments as well as error analysis. For this reason, a practice-oriented procedure is presented, with the aim to extend the assessment of the closing behaviour and blast pressure leakage of passive air blast safety valves and the structural behaviour by numerical simulations. In a first preliminary step, potential software solutions have been evaluated based on literature research and expert knowledge. After evaluation of the obtained results, two different software pairs (fluid dynamic as well as structural dynamic tools) have been tested by carrying out indirectly coupled numerical simulations. The software pair APOLLO Blastsimulator & LS-DYNA achieved satisfactory results with the indirect coupling, so that direct fully coupled FSI simulations were additionally performed. To cover a broad range of blast safety valve applications, two different suitable test cases have been considered. In comparison to the experimental results, good agreement was achieved when analysing the pressure–time history of the blast pressure leakage and the closing time of the safety valve. Furthermore, the latter was confirmed by high-speed camera registrations during blast loading.
Keywords
Introduction
On the one hand, air blast safety valves have the purpose to protect technical installations as well as people inside building structures. In case of explosion events with the corresponding incident shock waves, the safety valve should close instantaneously and significantly mitigate the blast pressure leakage into the building interior. On the other hand, the safety valves are typically mounted at the intake or exhaust of ventilation systems and should therefore exhibit a low pressure drop in order to reduce the power consumption of the fans. The latter is especially important in new areas of application, for example, in industrial fields or modern protective buildings, as ventilation accounts for a large part of the operating costs. However, minimizing the pressure loss and material usage results in more filigree and compact safety valves, with the challenge to maintain the blast mitigation capability. Therefore, a detailed insight into the blast load behaviour of such devices is important for novel developments and eventual error analysis. The performance analysis of air blast safety valves at current date is mainly achieved with experimental tests in a shock tube by evaluating pressure–time histories, where numerical simulations seem to be the adequate choice to gain further detailed insights.
Regarding explosion protection valves, Sharma et al. (2016) carried out a comprehensive literature review. A classification of existing product types was elaborated, and different related studies were investigated, among others the topic of numerical modelling. One of the main conclusion was that there is a need to elaborate suitable techniques to minimize the blast pressure leakage in safety valves and that this topic has not been addressed in many studies in open literature. Fluid-Structure-Interaction (FSI) simulations are regarded as important to optimally characterize and design such blast mitigation devices. Mo et al. (2015) investigated numerically a safety valve for pipe-line systems. The device was modelled as a translational moving valve core connected to a spring. The simulations adequately revealed the flow field and the corresponding pressure distribution inside the safety valve during blast loading. In a preceding study to the present work, an evaluation and optimization procedure for passive air blast safety valves was developed, incorporating experimental as well as numerical fluid and structural dynamic analyses (Brenner et al., 2022). As a case study, the introduced method was exemplified on an existing safety valve. By applying indirectly coupled FSI simulations a novel valve design was elaborated, which revealed a three times higher volume flow rate at the same pressure drop of 200 Pa in normal operation, while still meeting the technical requirements during blast loading. It is also mentioned that future work, due to the encountered numerical issues, should investigate different FSI techniques to adequately simulate the overall safety valve behaviour.
Concerning FSI simulations, several studies handle the subject of highly deforming geometries and shock wave loads by coupling the fluid and structural dynamic analyses. Among others, Faucher et al. (2019) developed a novel computational framework dedicated to the simulation of fluid-structure systems under impact loading with a potential of structural failure. The proposed method was successfully validated by means of three different experiments considering failing tanks under impact, where for example one validation objective was to predict the evolution of the internal tank pressure. Another study analysed the structural behaviour of concrete-filled steel tube columns under near-field blast loading (Li et al., 2019). Due to the blast load, a significant denting of the columns was observed. The latter was predicted qualitatively as well as quantitatively with a satisfactory accuracy with the applied three-step modelling procedure. Aune et al. (2021) examined the effects of fluid-structure interaction of steel plates subjected to blast waves generated in a shock tube with an exposed area of 0.3 m × 0.3 m. Direct and indirect numerical simulations were carried out, where the former adequately predicted important quantities, such as plate mid-point deflection and velocity or blast wave overpressure. Also, an increase in pressure due to the deforming steel plate was observed. According to the authors, uncoupled simulations are appropriate for lower pressures, where direct coupled FSI simulations are mandatory for achieving adequate results at higher blast loads.
Corresponding to the literature search, direct coupled FSI simulations are increasingly applied to analyse the behaviour of blast loaded structures and seem to be necessary to completely capture all relevant effects. However, to the best of the authors’ knowledge, there are few studies considering the FSI approach specifically in the field of passive air blast safety valves. For this reason, as a follow-up study of Brenner et al. (2022), the present work aims to develop a practical procedure with the overall goal to correctly capture the blast pressure leakage and full structural response of passive air blast safety valves subjected to blast loads by means of numerical simulations. Since coupled simulations of short-time dynamic phenomena are challenging, a step-wise procedure is chosen. To start, possible suitable software solutions are evaluated, where the chosen fluid dynamic tools are first tested with empty shock tube geometries to ensure the correct blast load. Subsequently, the analyses are extended with a static model of the assessed safety valves and indirectly coupled FSI simulations are carried out to determine the blast pressure leakage. In a further step, direct coupled FSI simulations are performed to determine the complete structural response of the investigated blast mitigation systems. In order to cover a wide range of safety valve applications, the method is applied on two different test cases. For the validation of the numerical results, pressure–time histories measured in shock tube experiments as well as high-speed camera registrations are applied.
Simulation software
In a precedent study an indirect coupling approach using ANSYS CFX 18.2 (ANSYS® 2017) and ABAQUS/Explicit 2018 (Dassault Systèmes, 2018) for the simulation of air blast safety valves was proposed (Brenner et al., 2022). While the method was successful in general, numerical issues prevented the simulation of the full valve closure when complex geometries were considered. In order to overcome this limitation, possible software solutions for simulating short-time dynamic phenomena with respect to passive air blast safety valves were evaluated theoretically in a preliminary study as a first step. A criteria catalogue was elaborated with a differentiation between technical (e.g., integration of 3D models, numerical methods, data storage capabilities etc.) and cost/handling criteria (e.g., software structure, availability, documentation, etc.). An evaluation grid was generated based on the defined criteria and the different numerical tools were assessed by experts, software users as well as by means of a literature research. According to the evaluation, the software pair APOLLO Blastsimulator (Fraunhofer EMI, 2021) & LS-DYNA (Livermore Software Technology, 2021) seems to fit best for the present investigation.
Regarding APOLLO Blastsimulator, the Computational-Fluid-Dynamics (CFD) solver was developed specifically for the simulation of blast waves, detonations and gas dynamics. The tool solves the mass, momentum and energy conservation equations for unsteady flows of compressible, non-viscous and non-thermally conductive, chemically reactive or inert gas mixtures using a finite volume scheme with explicit time integration (Klomfass, 2018). The fluids air and helium applied in the present work are modelled as perfect gases (inert with no inter-molecular potential energy) with the corresponding equation of state (EOS)

The Finite-Element-Method (FEM) software LS-DYNA is developed for highly non-linear physical simulations. The equilibrium equation solved over each element of the meshed computation domain depends on the involved physics. In the case of a structural analysis, it is a force equilibrium. The main application areas are short range simulations with large deformations such as crash analyses and forming processes, where explicit time integration is used. The LS-DYNA code allows also multiphysics simulation and thus enables a wide range of applications. The load exchange with the APOLLO’s coupling interface works with a prebuilt subroutine, which can be activated with the keyword *USER_LOADING in the input file. LS-DYNA was successfully applied for several blast phenomena related studies, among others to analyse the pressure behaviour in an air-water shock tube (Khawaja et al., 2016) or to simulate the blast load behaviour and corresponding structural response of ISO containers (Børvik et al., 2009).
Examined test cases
The first test case examined in the present work includes a cylindrical safety valve with an approximately half-spherical steel shell (outer diameter of 225 mm) mounted with tension springs as closing mechanism (translational mode of operation, which represents approximately 80% of the tested devices at SPIEZ LABORATORY, see Figure 1(a)) with a loading of approximately 8 bar incident and 40 bar reflected pressure, respectively. The housing has a length of 240 mm, where the smaller and larger diameter is 210 and 300 mm, respectively. The perforated cylindrical shape (holes diameter of 12 mm) serves as a pressure reducer, which has a length and outer diameter of 315 and 296 mm, respectively. This allows to diminish the pass-through overpressure further and to release it over a longer time period. The second test case examines a cuboidal safety valve with a height, width and length of 155, 398 and 216 mm, respectively. Thin steel sheets serve as closing mechanism, which are bend during blast loading (elastic deformation and rotational mode of operation, see Figure 1(b)). The blast loading in this case is 1 bar incident and 3 bar reflected pressure, respectively. The considered test cases should cover a broad range of safety valve mechanisms typically implemented in modern protective structures and industrial buildings. 3D geometries of the investigated safety valves: (a) vertical cut of translational closing mechanism (light grey) and casing (dark grey) with pressure reducer (perforated tube) as well as tension springs (purple), (b) vertical cut of rotational closing mechanism (light grey) and casing (dark grey). Red solid and blue dashed arrows indicate the closing mechanism movement and the airflow path, respectively.
Experimental investigations and safety valve performance
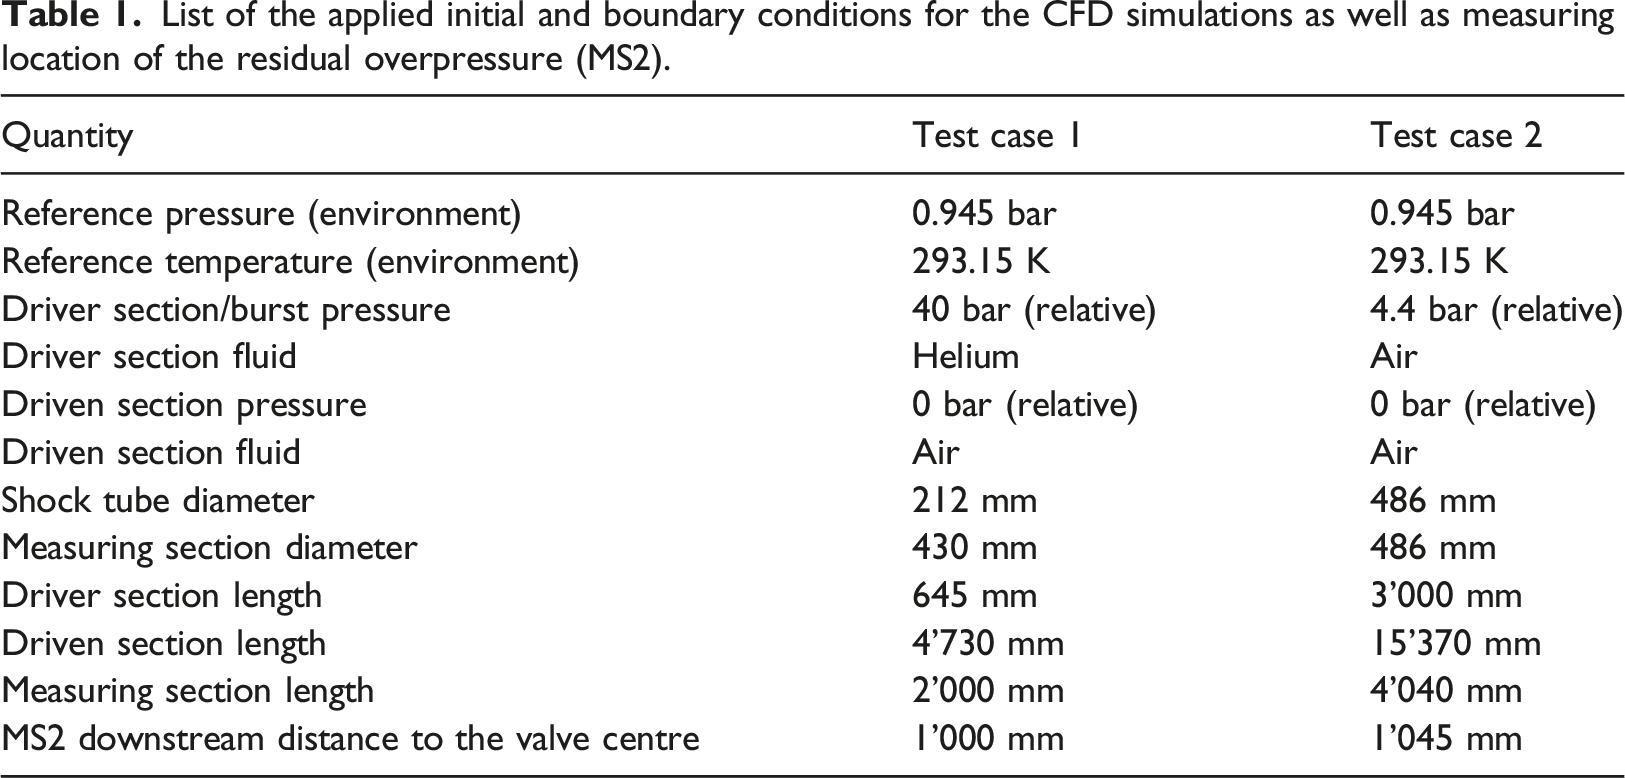
List of the applied initial and boundary conditions for the CFD simulations as well as measuring location of the residual overpressure (MS2).
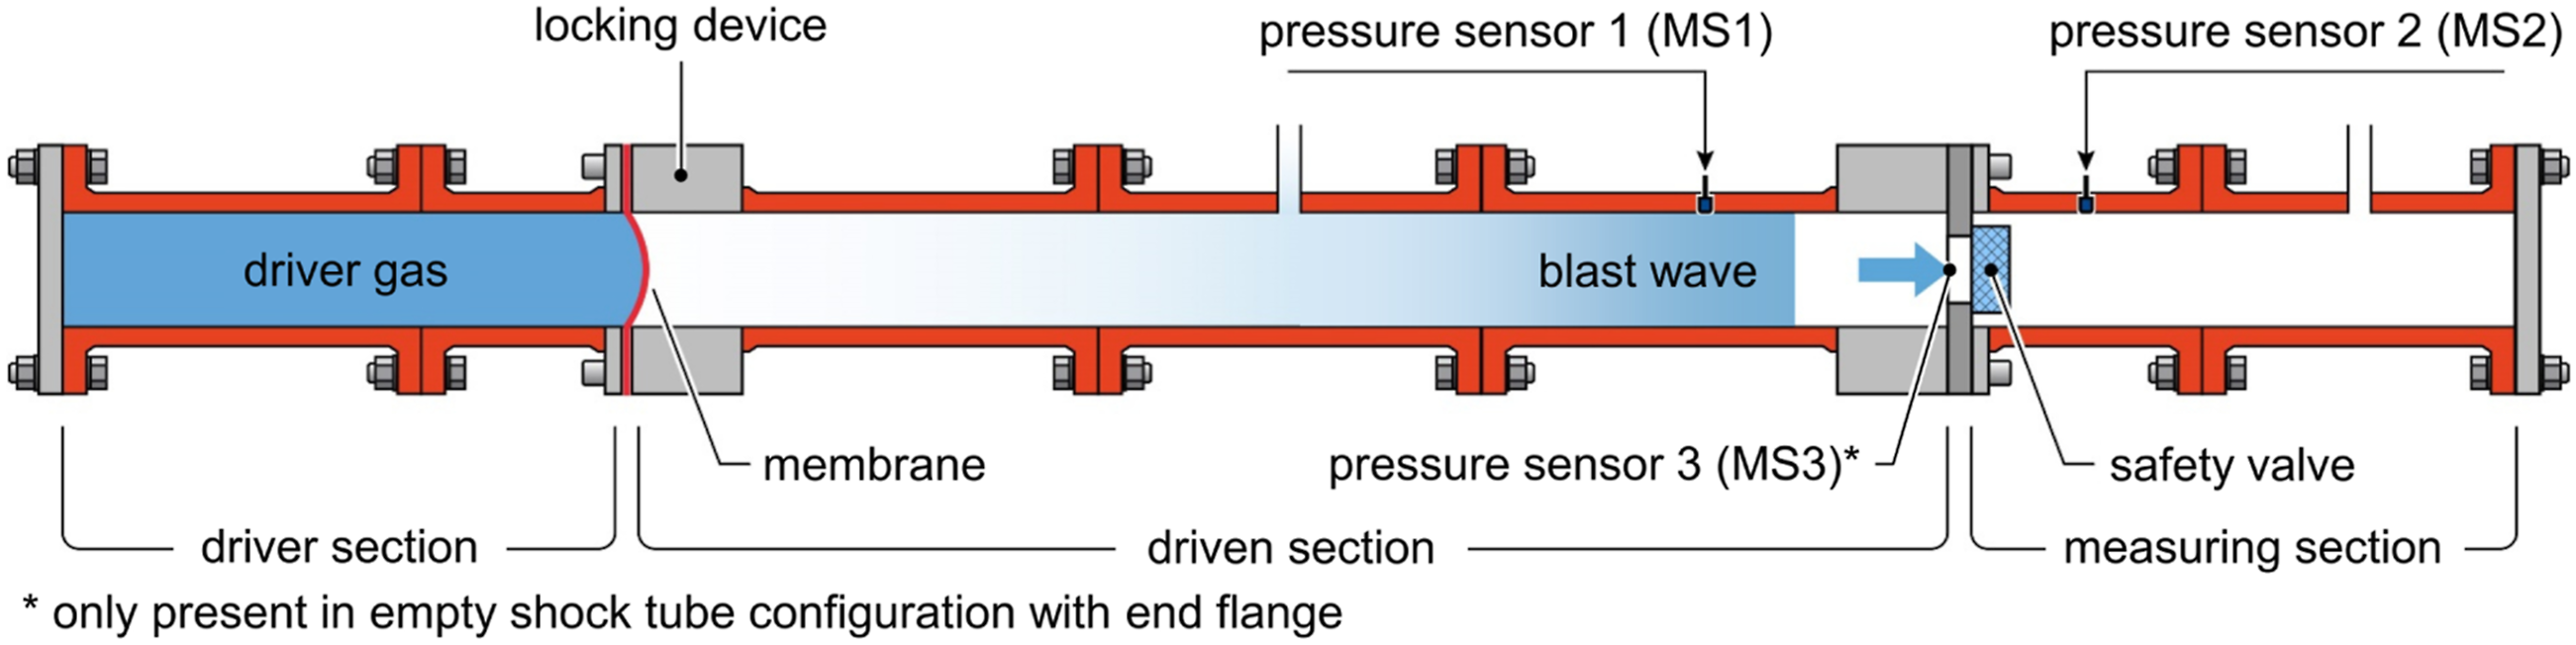
General schematic of the applied shock tubes to generate the blast loading as well as to measure the incident (MS1) and residual pressure wave (MS2) up- and downstream of the safety valve, respectively. In the empty shock tube configuration, the reflected pressure is measured at the end flange (MS3).
Figure 3 shows schematically a residual pressure–time history p
res
(t) of a blast wave at MS2, where the performance, meaning the blast mitigation capability, of passive air blast safety valves is typically characterized in terms of maximum residual overpressure p
res,max
, time of positive pressure phase Schematic representation of a residual pressure–time history p
res
(t) downstream of the safety valve with the maximum residual overpressure p
res,max
, residual impulse i
res
and time until first zero-crossing of the pressure curve 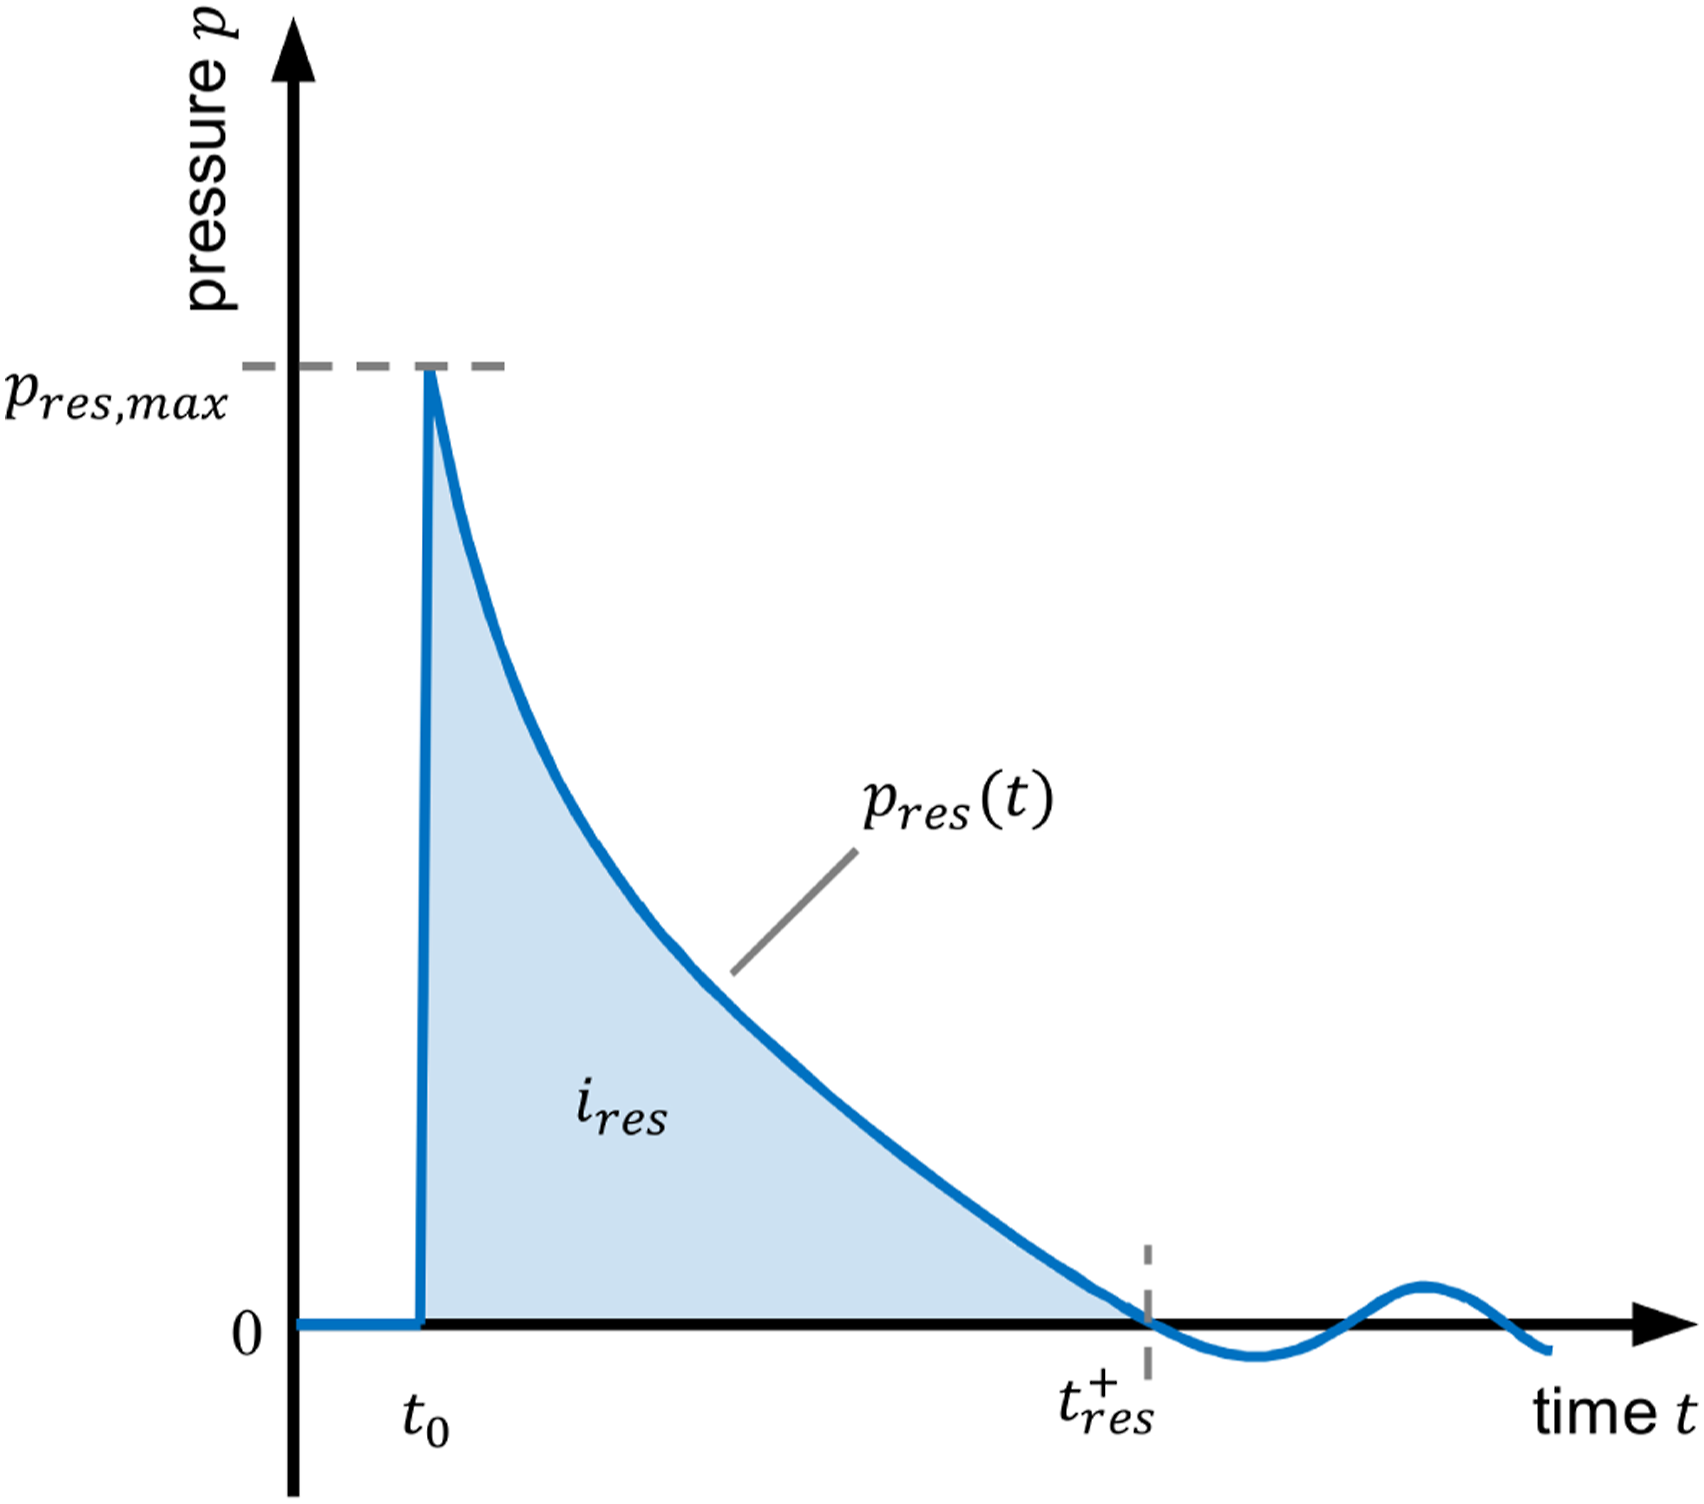
Simulation approach and FSI procedure
Empty shock tube simulations
To ensure the correct blast load of the safety valves, empty shock tube simulations are performed in a first step. For this purpose, the shock tube is modelled according to Figure 2 with the dimensions from Table 1, but the safety valve and measuring section are replaced with an end flange. The shock tube is modelled as a rigid non-moving body and a quarter model is applied to reduce the computation duration. A grid convergence study is carried out in order to minimize eventual discretization errors. The simulations achieved sufficiently good results from a voxel size of 1.25 mm. Consequently, this resolution was applied for all calculations. Thus, a mesh with an average of about 80 million elements was obtained for test case 1 and about 105 million elements for test case 2. Due to the DMA in APOLLO Blastsimulator, the number of elements may decrease or increase during the simulation.
Indirectly and directly coupled FSI simulations
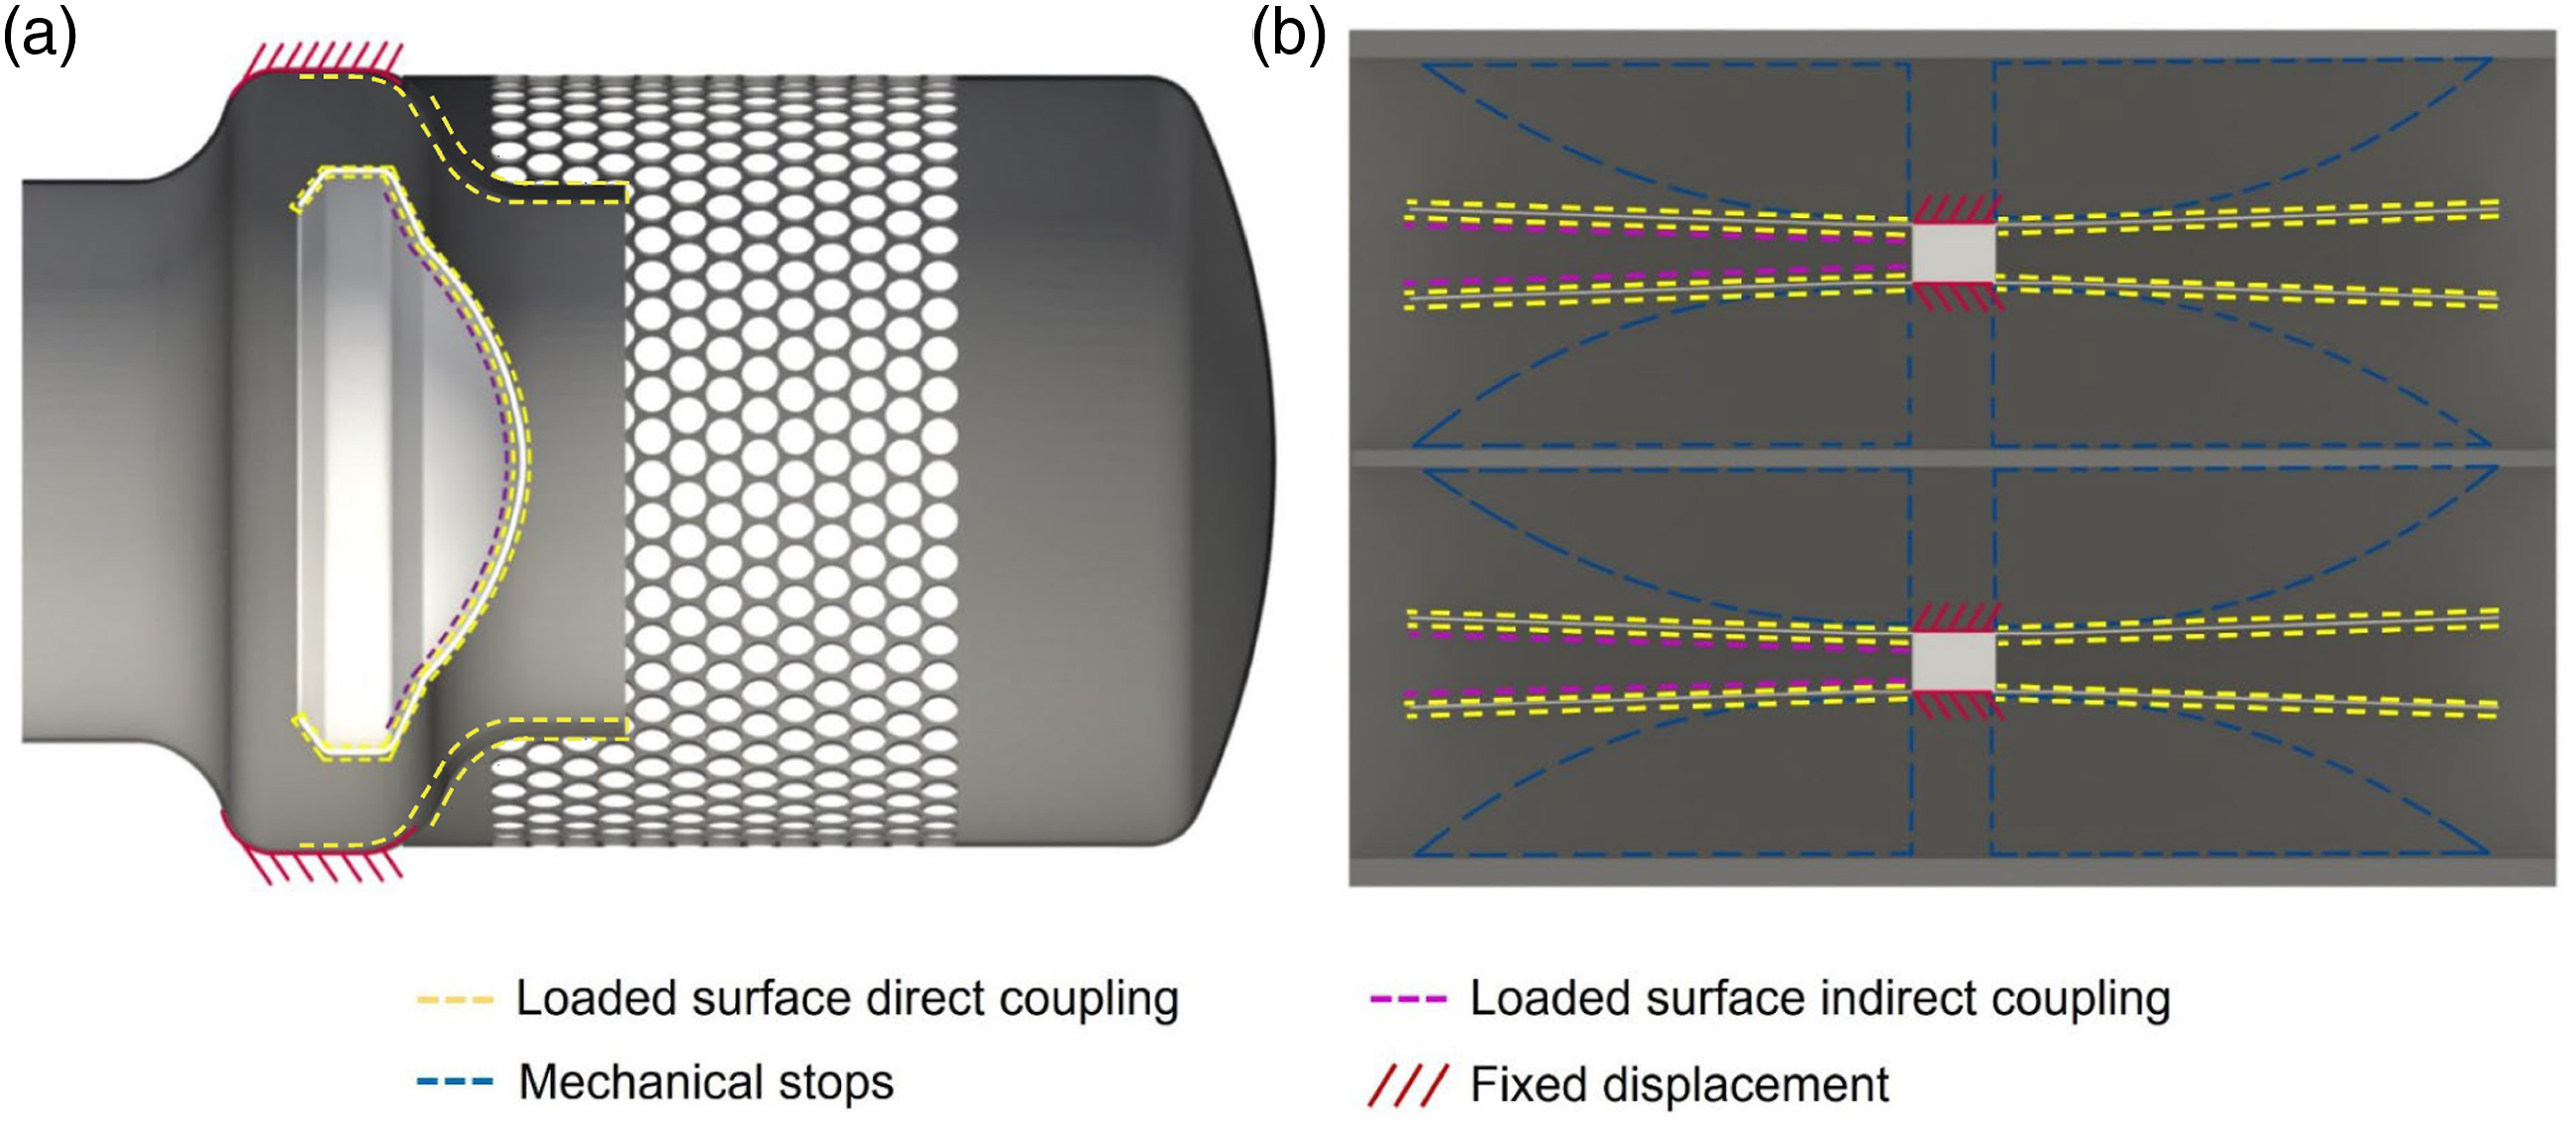
Indirectly coupled simulations are performed with the main purpose to determine the blast pressure leakage, where the whole shock tube with the mounted safety valve is modelled (compare Figure 2 and Table 1). The general procedure is as follows (compare Figure 4(a)): In a first fluid dynamic simulation, the closing mechanism is integrated as a static object and the pressure distribution on the latter is evaluated with respect to time. For the data transfer, the valve closing mechanism is manually divided into several segments, where from the CFD output an averaged pressure time sequence is calculated for each of them. The same segments are recreated in LS-DYNA from the volumetric mesh as a set of element surfaces. Through a loading with their corresponding pressure curves, the time-dependent pressure distribution can be implemented as a boundary condition in the structural analysis. It must be noted that the distribution accuracy depends on the amount and arrangement of segments. From the CSD simulation, the closing behaviour (i.e., the displacement with respect to time) of the mechanism is determined. This information is transferred back to the CFD analysis as a motion curve, where the safety valve closing mechanism is now modelled as a moving rigid body to capture its influence on the flow field. This is realized with the internal CSD mock-up of APOLLO Blastsimulator, which is used for both generating the pressure data at the surface of the coupled object and implementing the corresponding motion. The CSD mock-up is a rigid-body solver which is used in the program to mimic the coupling process between the CFD software and an arbitrary structural dynamics solver to facilitate the implementation and testing of the interface in other codes Klomfass and Heilig (2019). Ultimately, the residual pressure–time history, that is, blast pressure leakage is evaluated with a monitor point (gauge) at the position of MS2 in the measuring section. Comparison of the workflow of indirect (a) and direct (b) coupled simulations.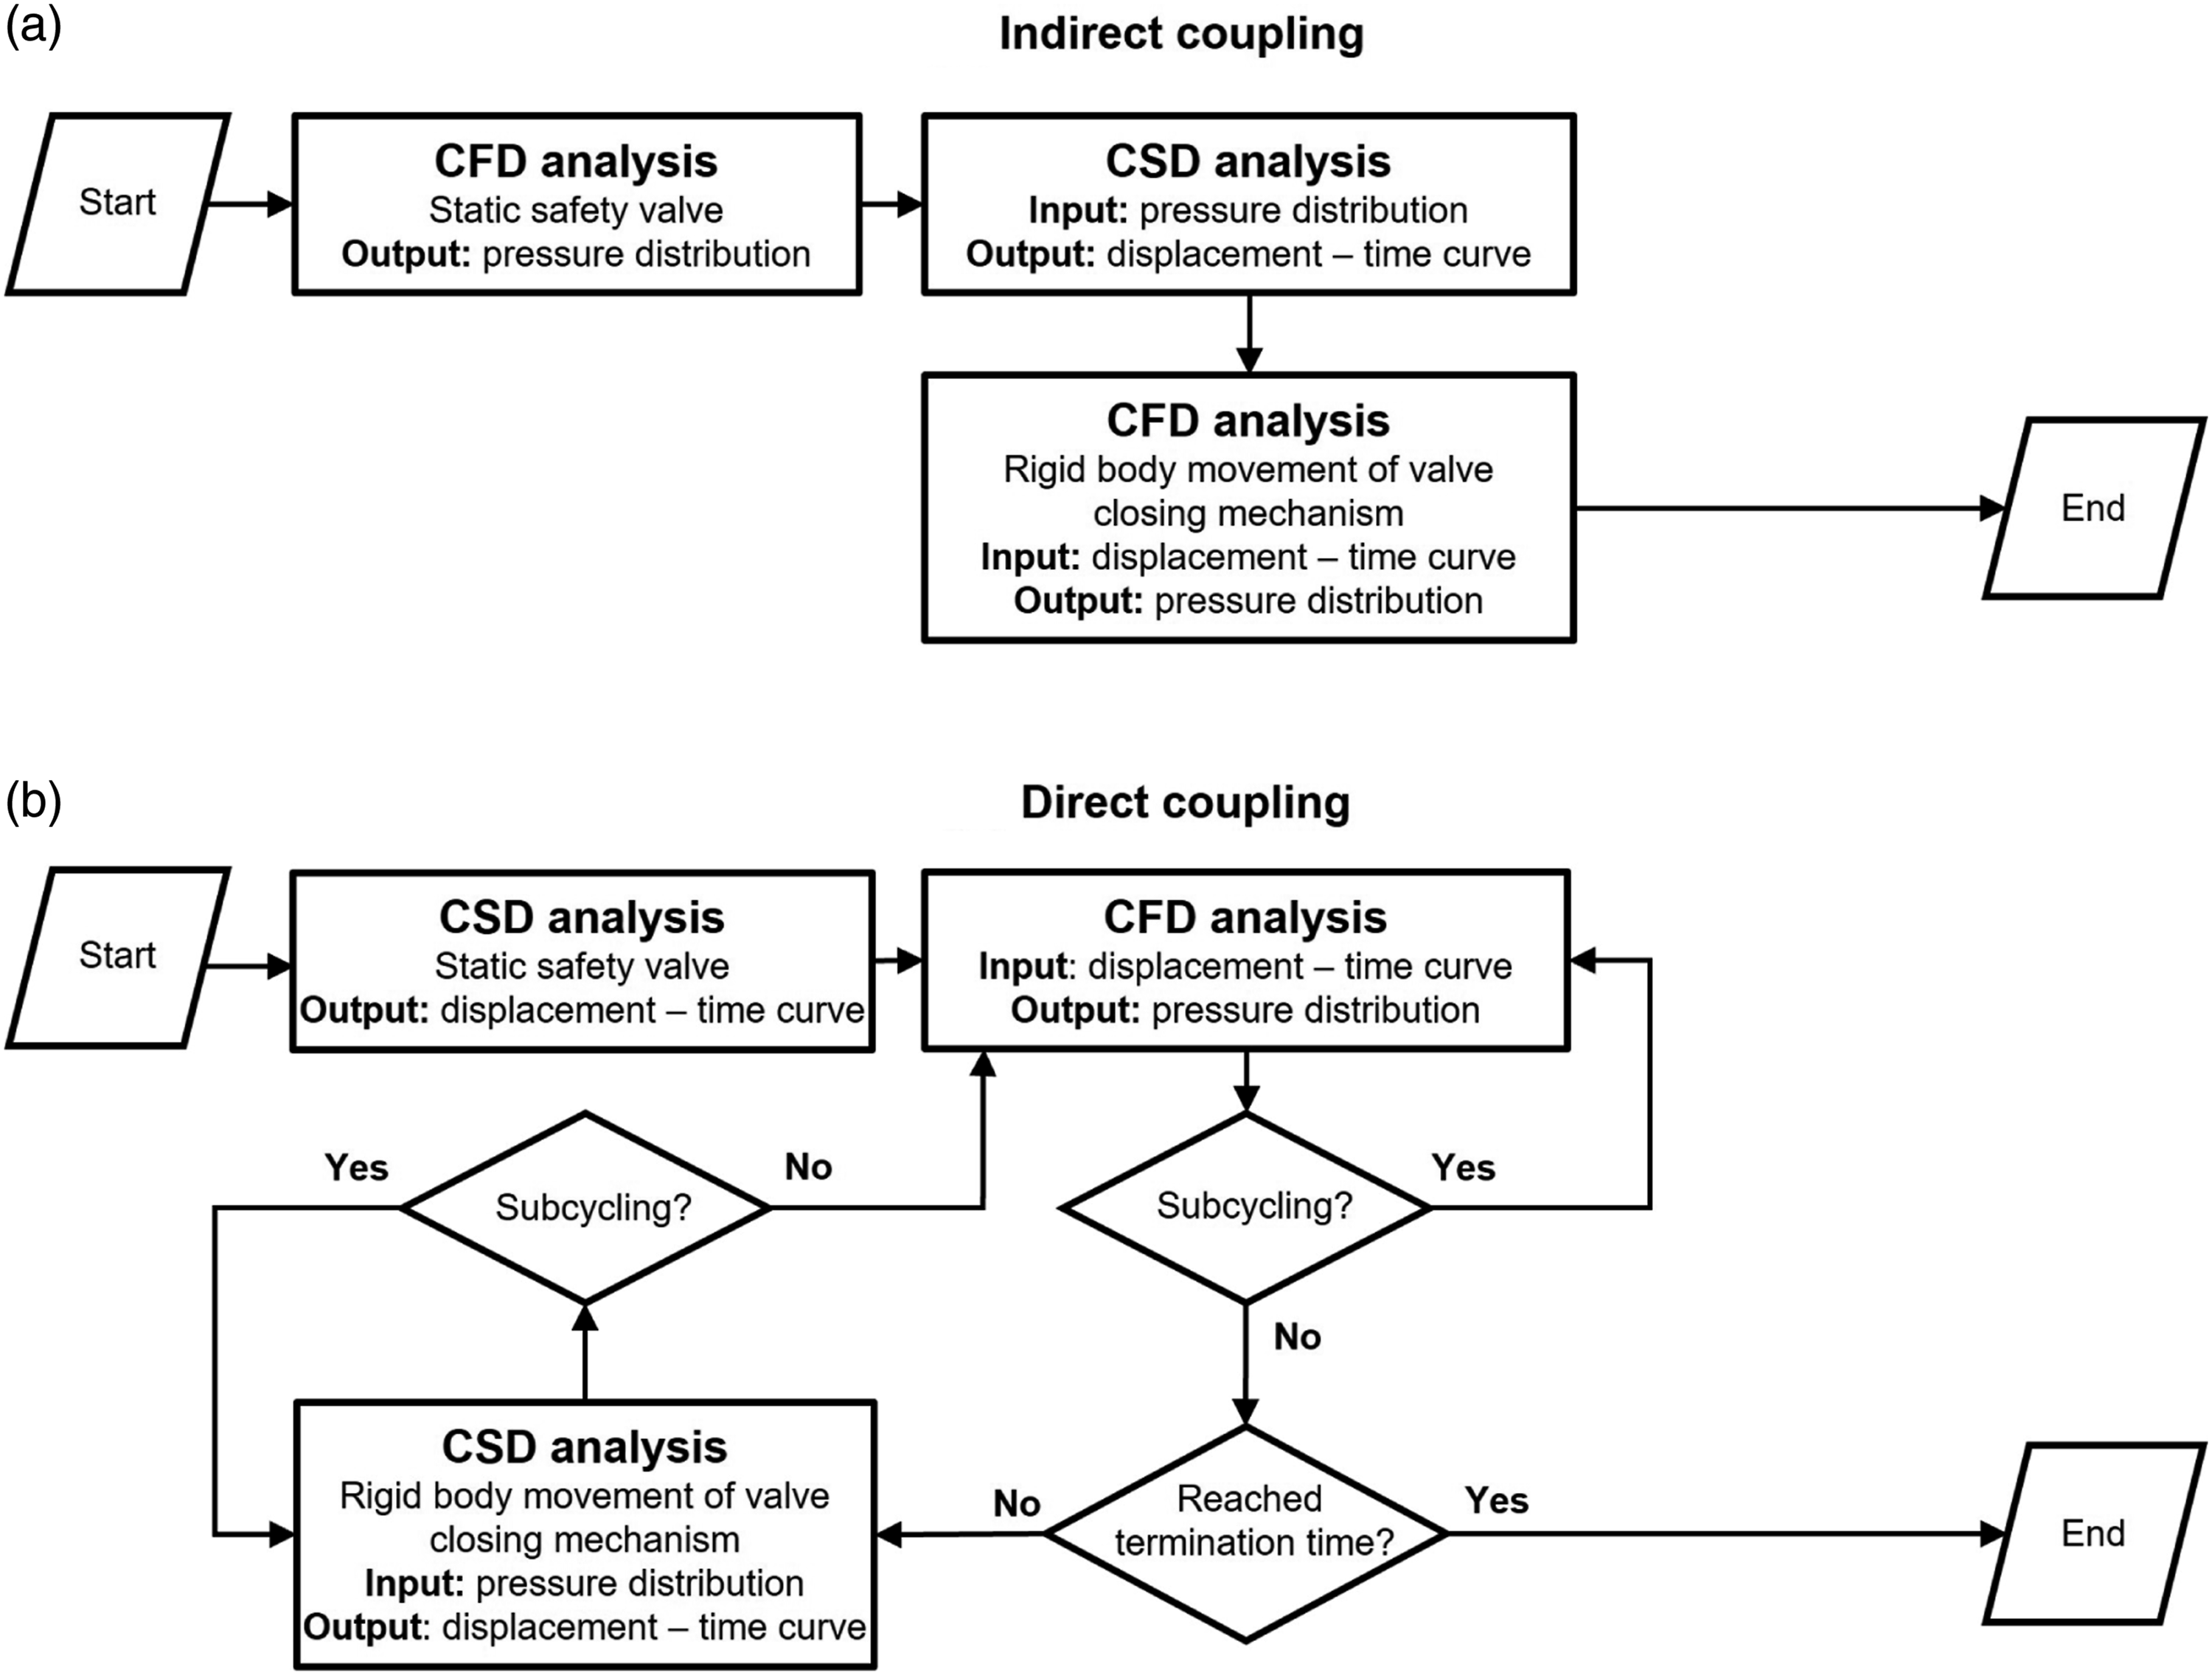
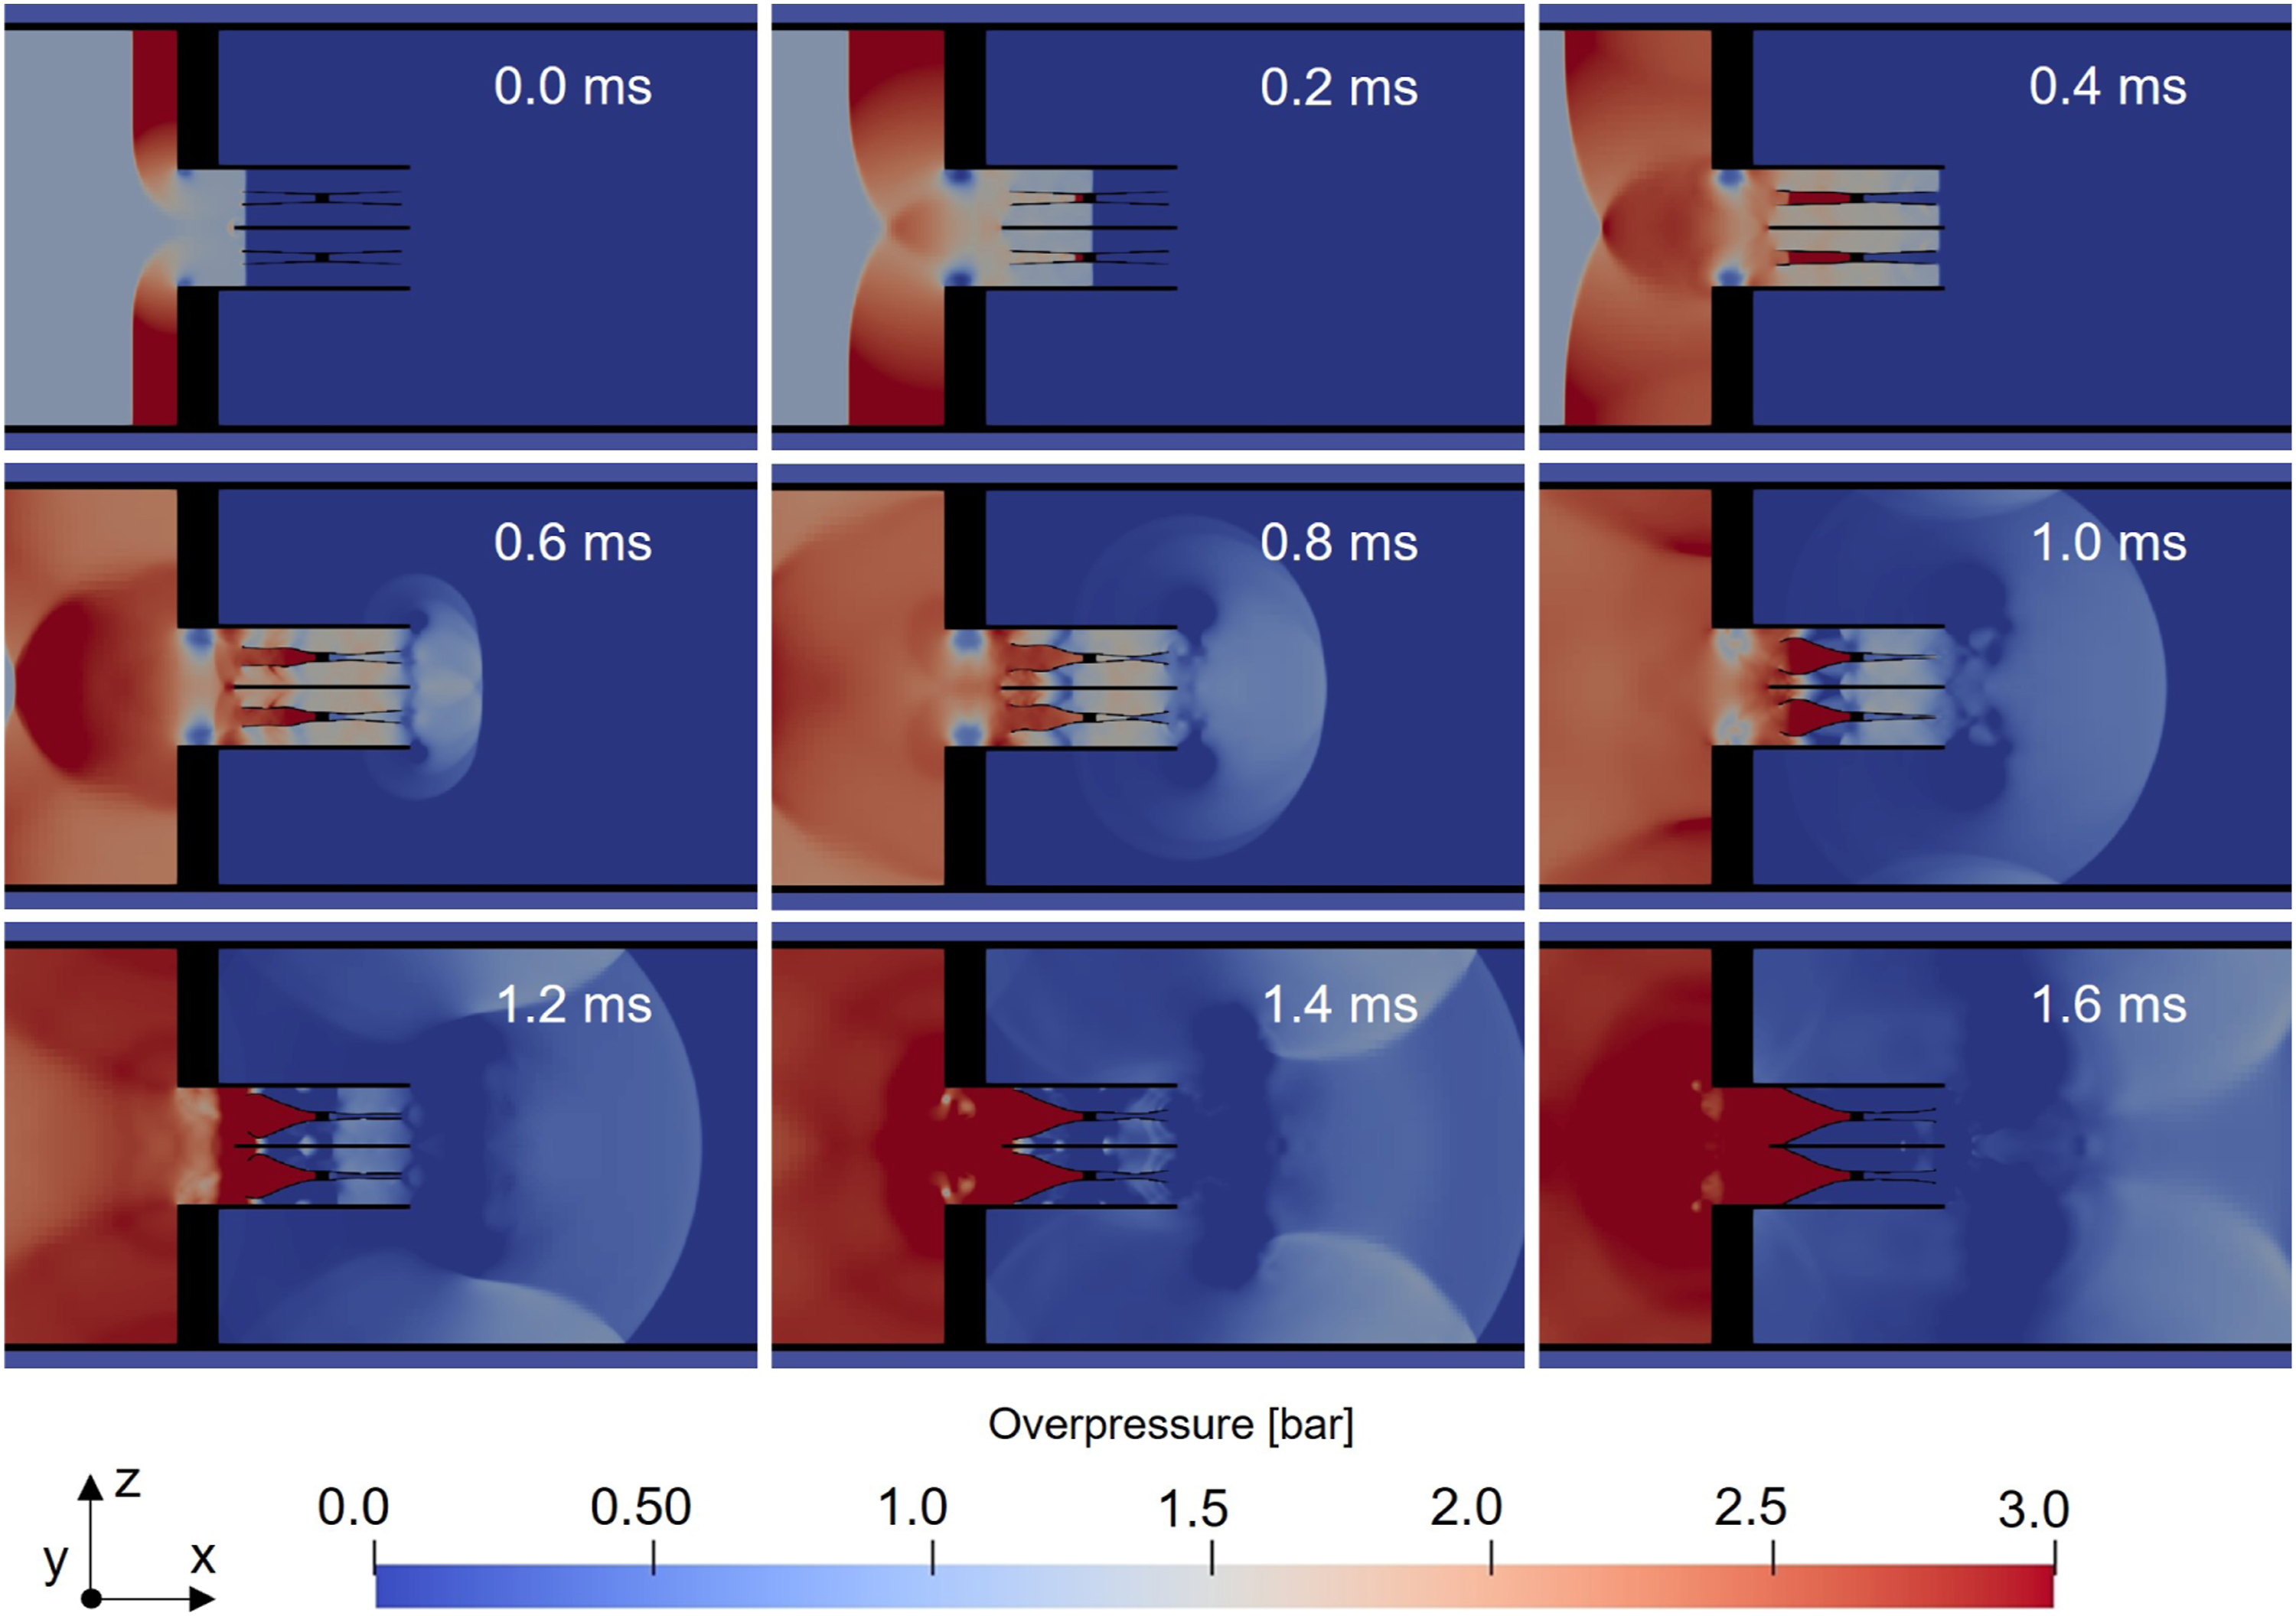
Directly, that is, fully coupled simulations (compare Figure 4(b)) are carried out in a further step to additionally capture the full structural response of the air blast safety valve when subjected to blast loading and to determine the corresponding effects on the fluid flow. With the provided coupling interface of APOLLO Blastsimulator the computed fluid pressure forces from the analysis are transferred to the CSD solver, where the structural deformation as well as displacement is computed and where the resulting new surface mesh is imported back to the CFD solver. This is repeated in a specified exchange interval until the end time of the simulation is reached. In order to save computation time, a maximum number of 10 subcycles is enabled in both CFD and CSD. Due to the DMA, the time step for each cycle can vary, where in the end an average time step of 0.18 µs for test case 1 and 0.15 µs for test case 2 was observed. This direct coupling becomes especially important in the case of air blast safety valves, since the closing of the safety valve has a significant effect on the fluid flow and vice versa. Presumably, this method delivers also more accurate and detailed results considering the blast pressure leakage in comparison to the rigid-body approach. As for the computational grid in APOLLO Blastsimulator, the adaptive meshing capability offers the advantage that changing geometry elements and overlays can be computed without causing issues. However, it must be noted that depending on the voxel size applied, very small geometry elements may no longer be represented correctly. As an example, Figure 5 shows a 12 mm hole in the pressure reducer located behind the safety valve. The voxels used in the mesh have a defined side length of 1.25 mm, and therefore, the 12 mm hole can no longer be accurately modelled (compare Figure 5, left). According to the mesh study, an additional refinement of the computation grid does not lead to a considerable improvement of the simulation results, but to a significantly higher computational effort. Consequently, the hole diameter was increased to 14 mm as a workaround (compare Figure 5, right). Influence of the adjusted hole diameter D in the pressure reducer (compare Figure 1): Voxel approximation with D = 12 mm (left) and D = 14 mm (right).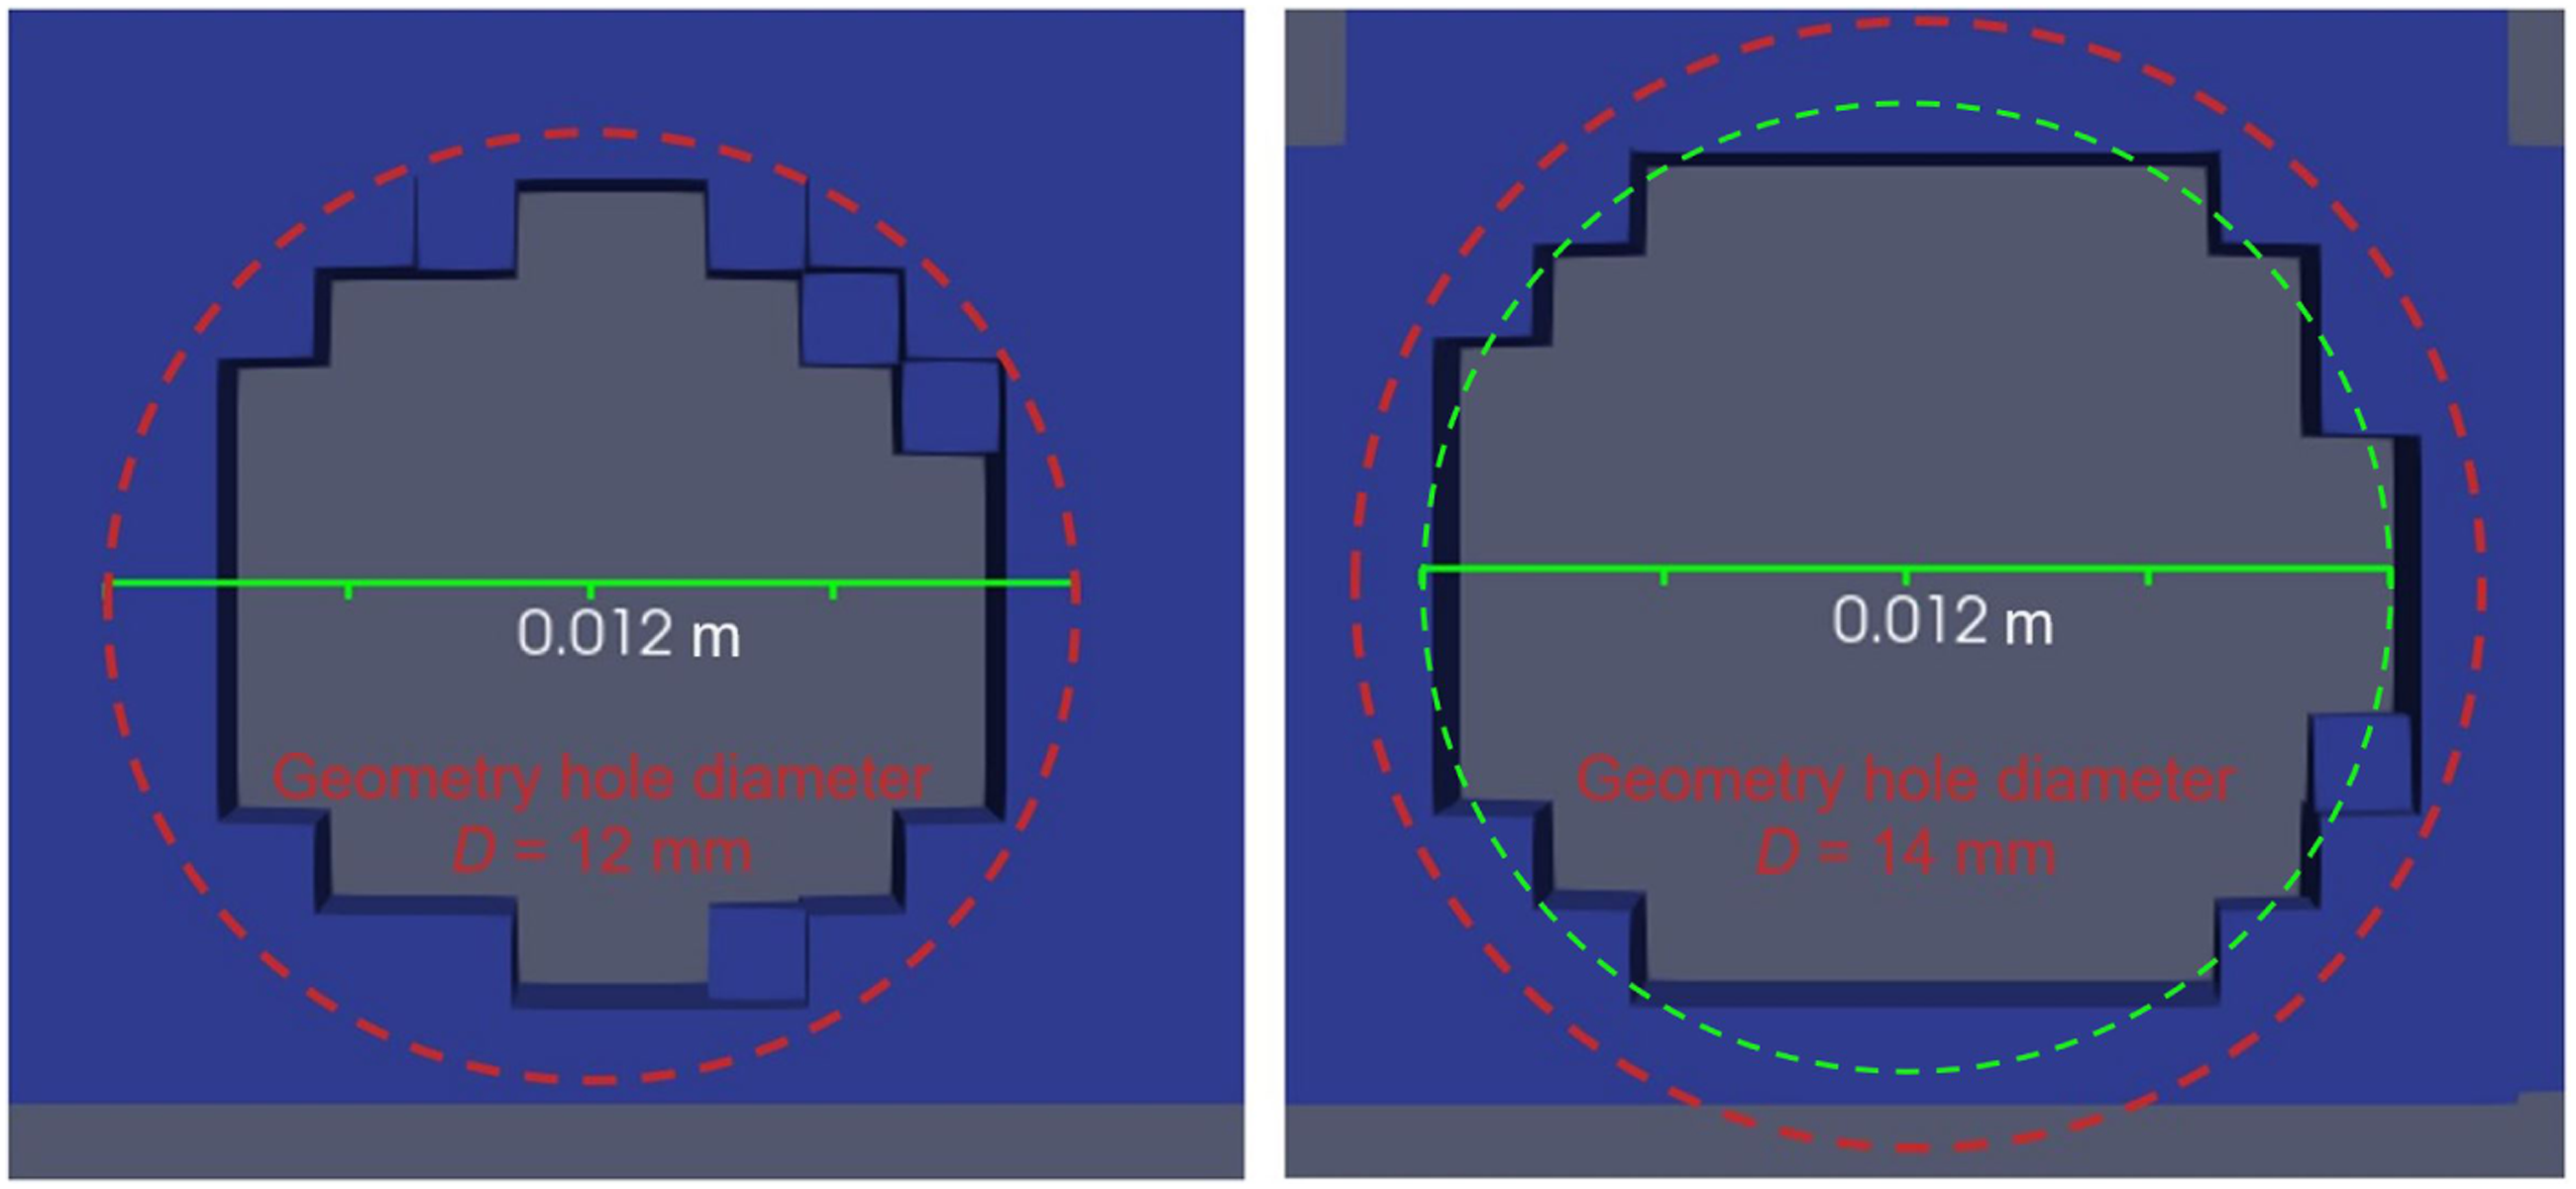
Boundary and initial conditions
Fluid dynamic simulation
In accordance with the empty shock tube experiments to generate the desired blast load, the CFD boundary and initial conditions in Table 1 apply for the test cases, where the membrane is considered burst at the start of the simulation (initial discontinuity in the flow field). The shock tube dimensions correspond to the test rigs, where the single shock tube segments as well as their connections are not modelled explicitly and the walls are assumed to be hydraulic smooth. This represents in good approximation the real situation. Furthermore, existing small vents in the driven and measuring section are not included in the simulation, since their influence on the flow field is negligible small when only the first incident pressure wave is considered.
Structural dynamic simulation
Applied steel material models and their coefficients.
3D geometry of the safety valves a vertical cut with corresponding boundary conditions of the CSD analysis: (a) test case 1 with translational mode of operation and (b) test case 2 with rotational mode of operation.
In the direct coupling approach, the structural response is additionally of interest and therefore a more accurate material model has to be chosen. In the present study, the Cowper-Symonds model is applied
Results and discussion
Test case 1
Empty shock tube
Figure 7 shows the comparison of the pressure–time histories of test case 1 at measuring location MS3 (end flange), which is important for the confirmation of the blast loading of the safety valve. It is observed that the peak reflected overpressure obtained by the CFD simulation and the measurement is 47 and 44.2 bar, respectively. Accordingly, the comparison shows that an adequate prediction of the peak overpressure is achieved in the numerical analysis (difference of approximately 6%). Nevertheless, the simulation reveals a slightly faster pressure decay after the initial peak and an underprediction of the pressure–time distribution, which results in a lower final impulse (evaluated 4 ms after the arrival of the pressure wave). In the measurements, an impulse of 70.5 bar·ms is observed, compared to 64.9 bar·ms of the CFD analysis. This deviation of approximately 8% is regarded as acceptable. Comparison of overpressure p(t) and impulse i(t) between the numerical and experimental analysis at measuring location MS3 (end flange) of the empty shock tube configuration for test case 1.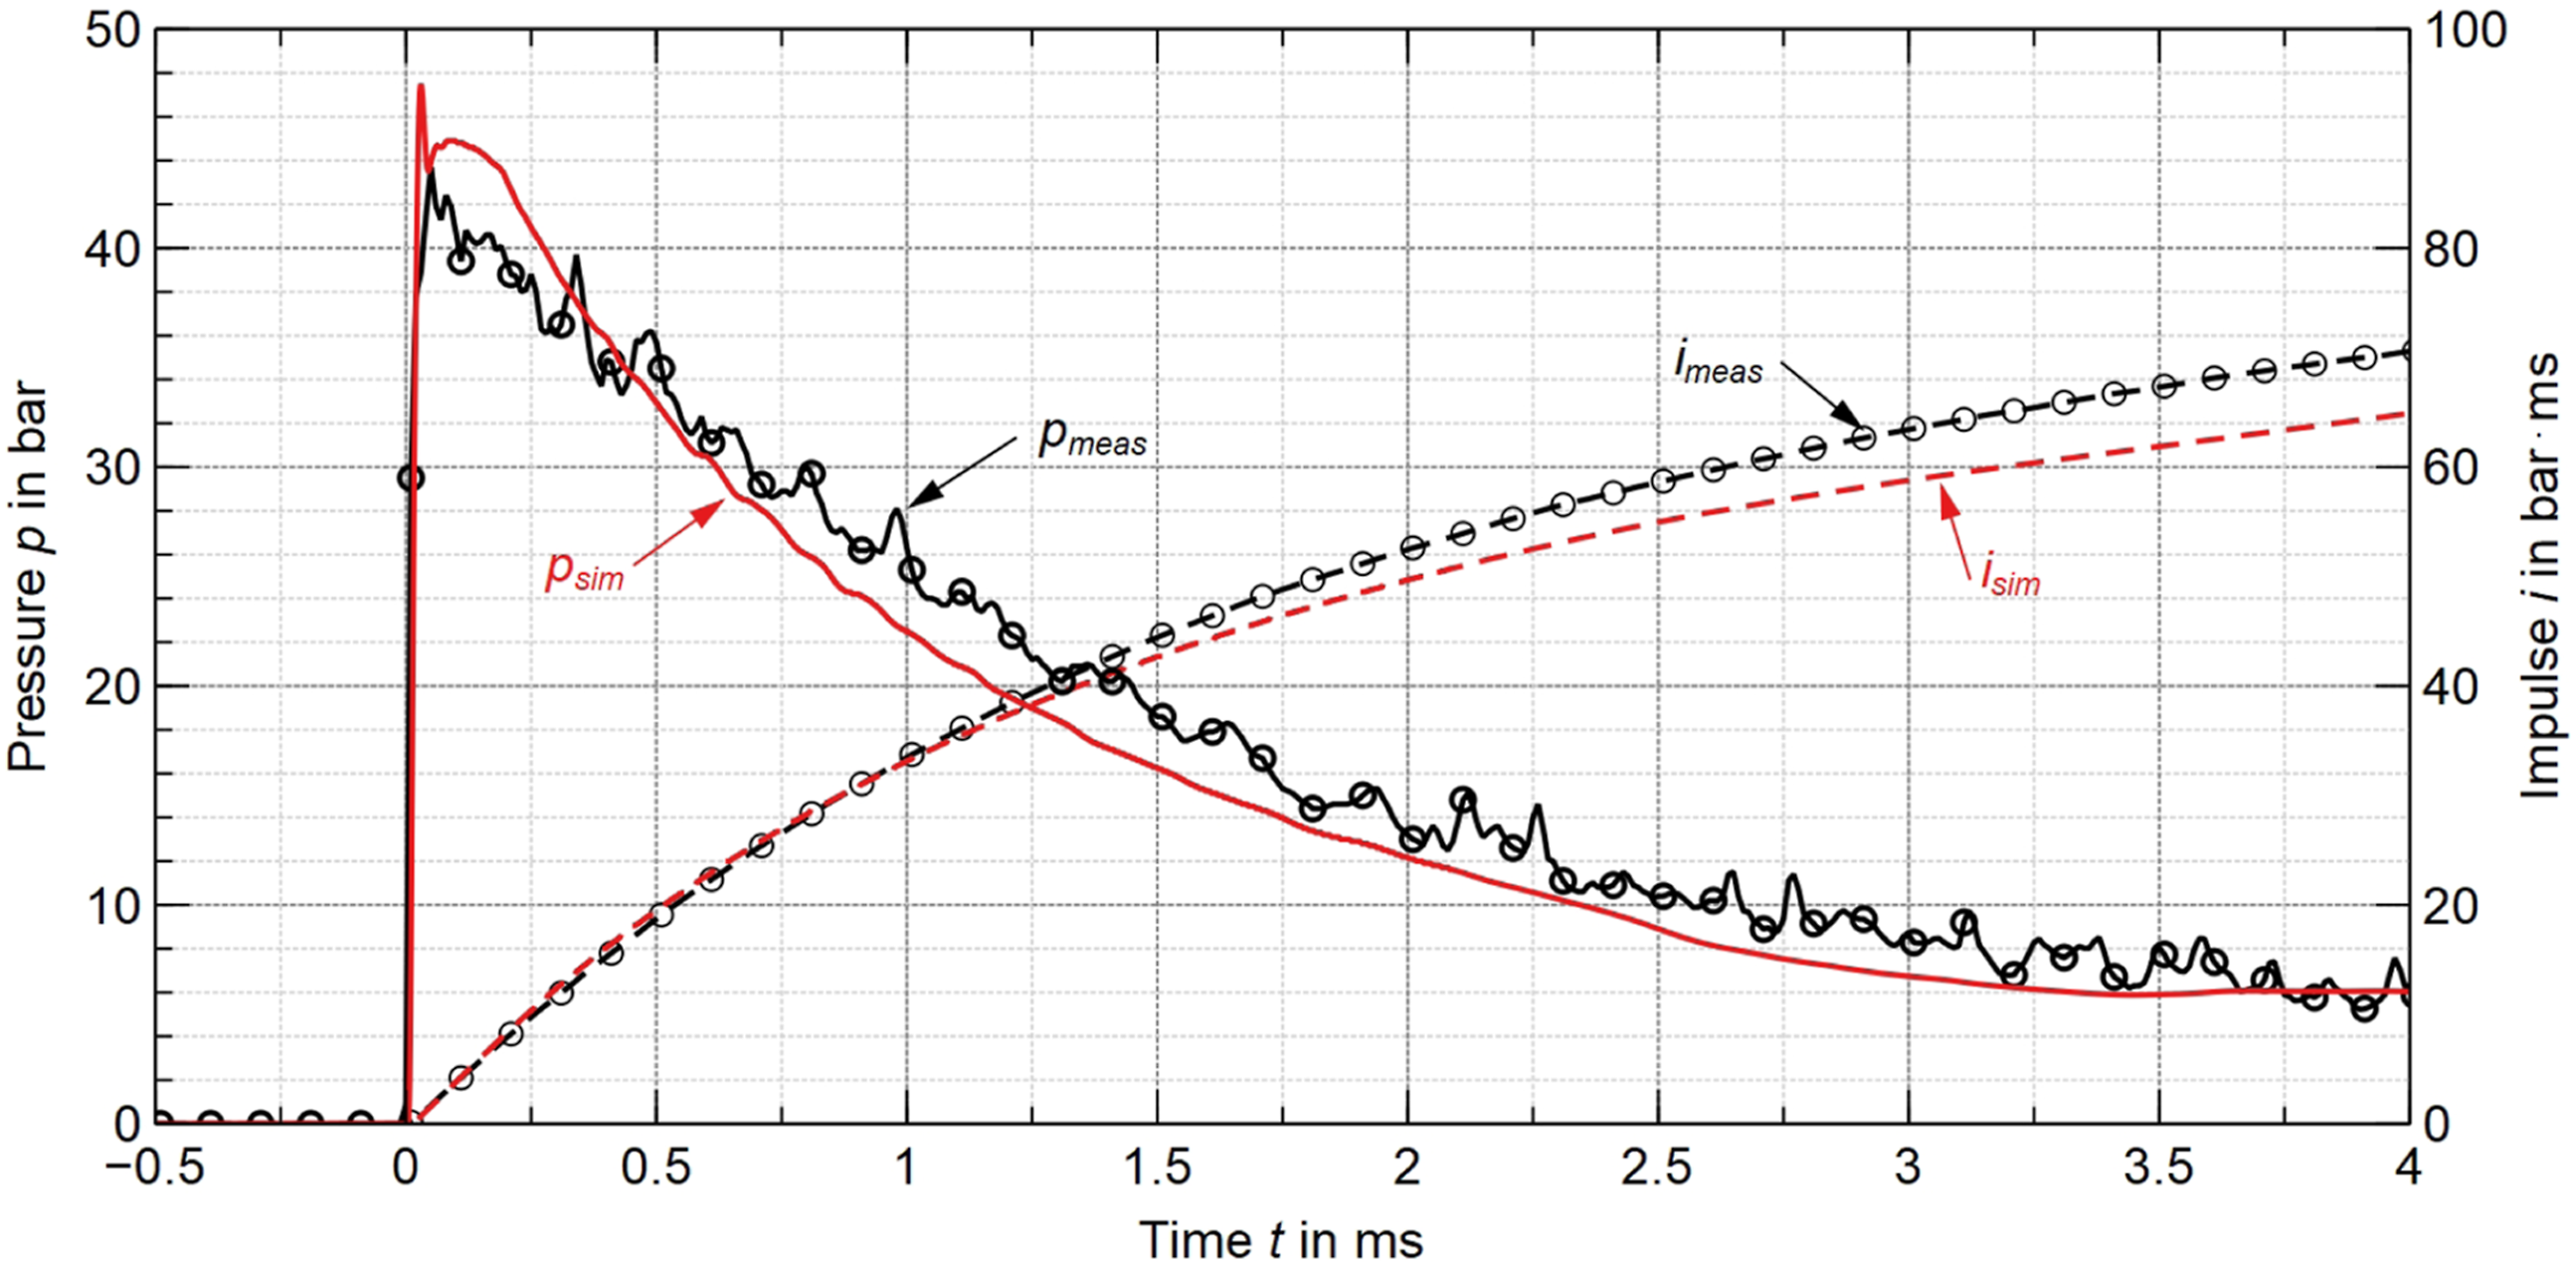
Structural dynamic analysis
Figure 8 shows the closing curves resulting from the LS-DYNA calculations (indirectly and directly coupled). Comparison of the computed closing curves in LS-DYNA with indirect and direct coupling for test case 1. 3D models show the safety valve in opened and closed state with an opening distance of 26 and 0 mm, respectively.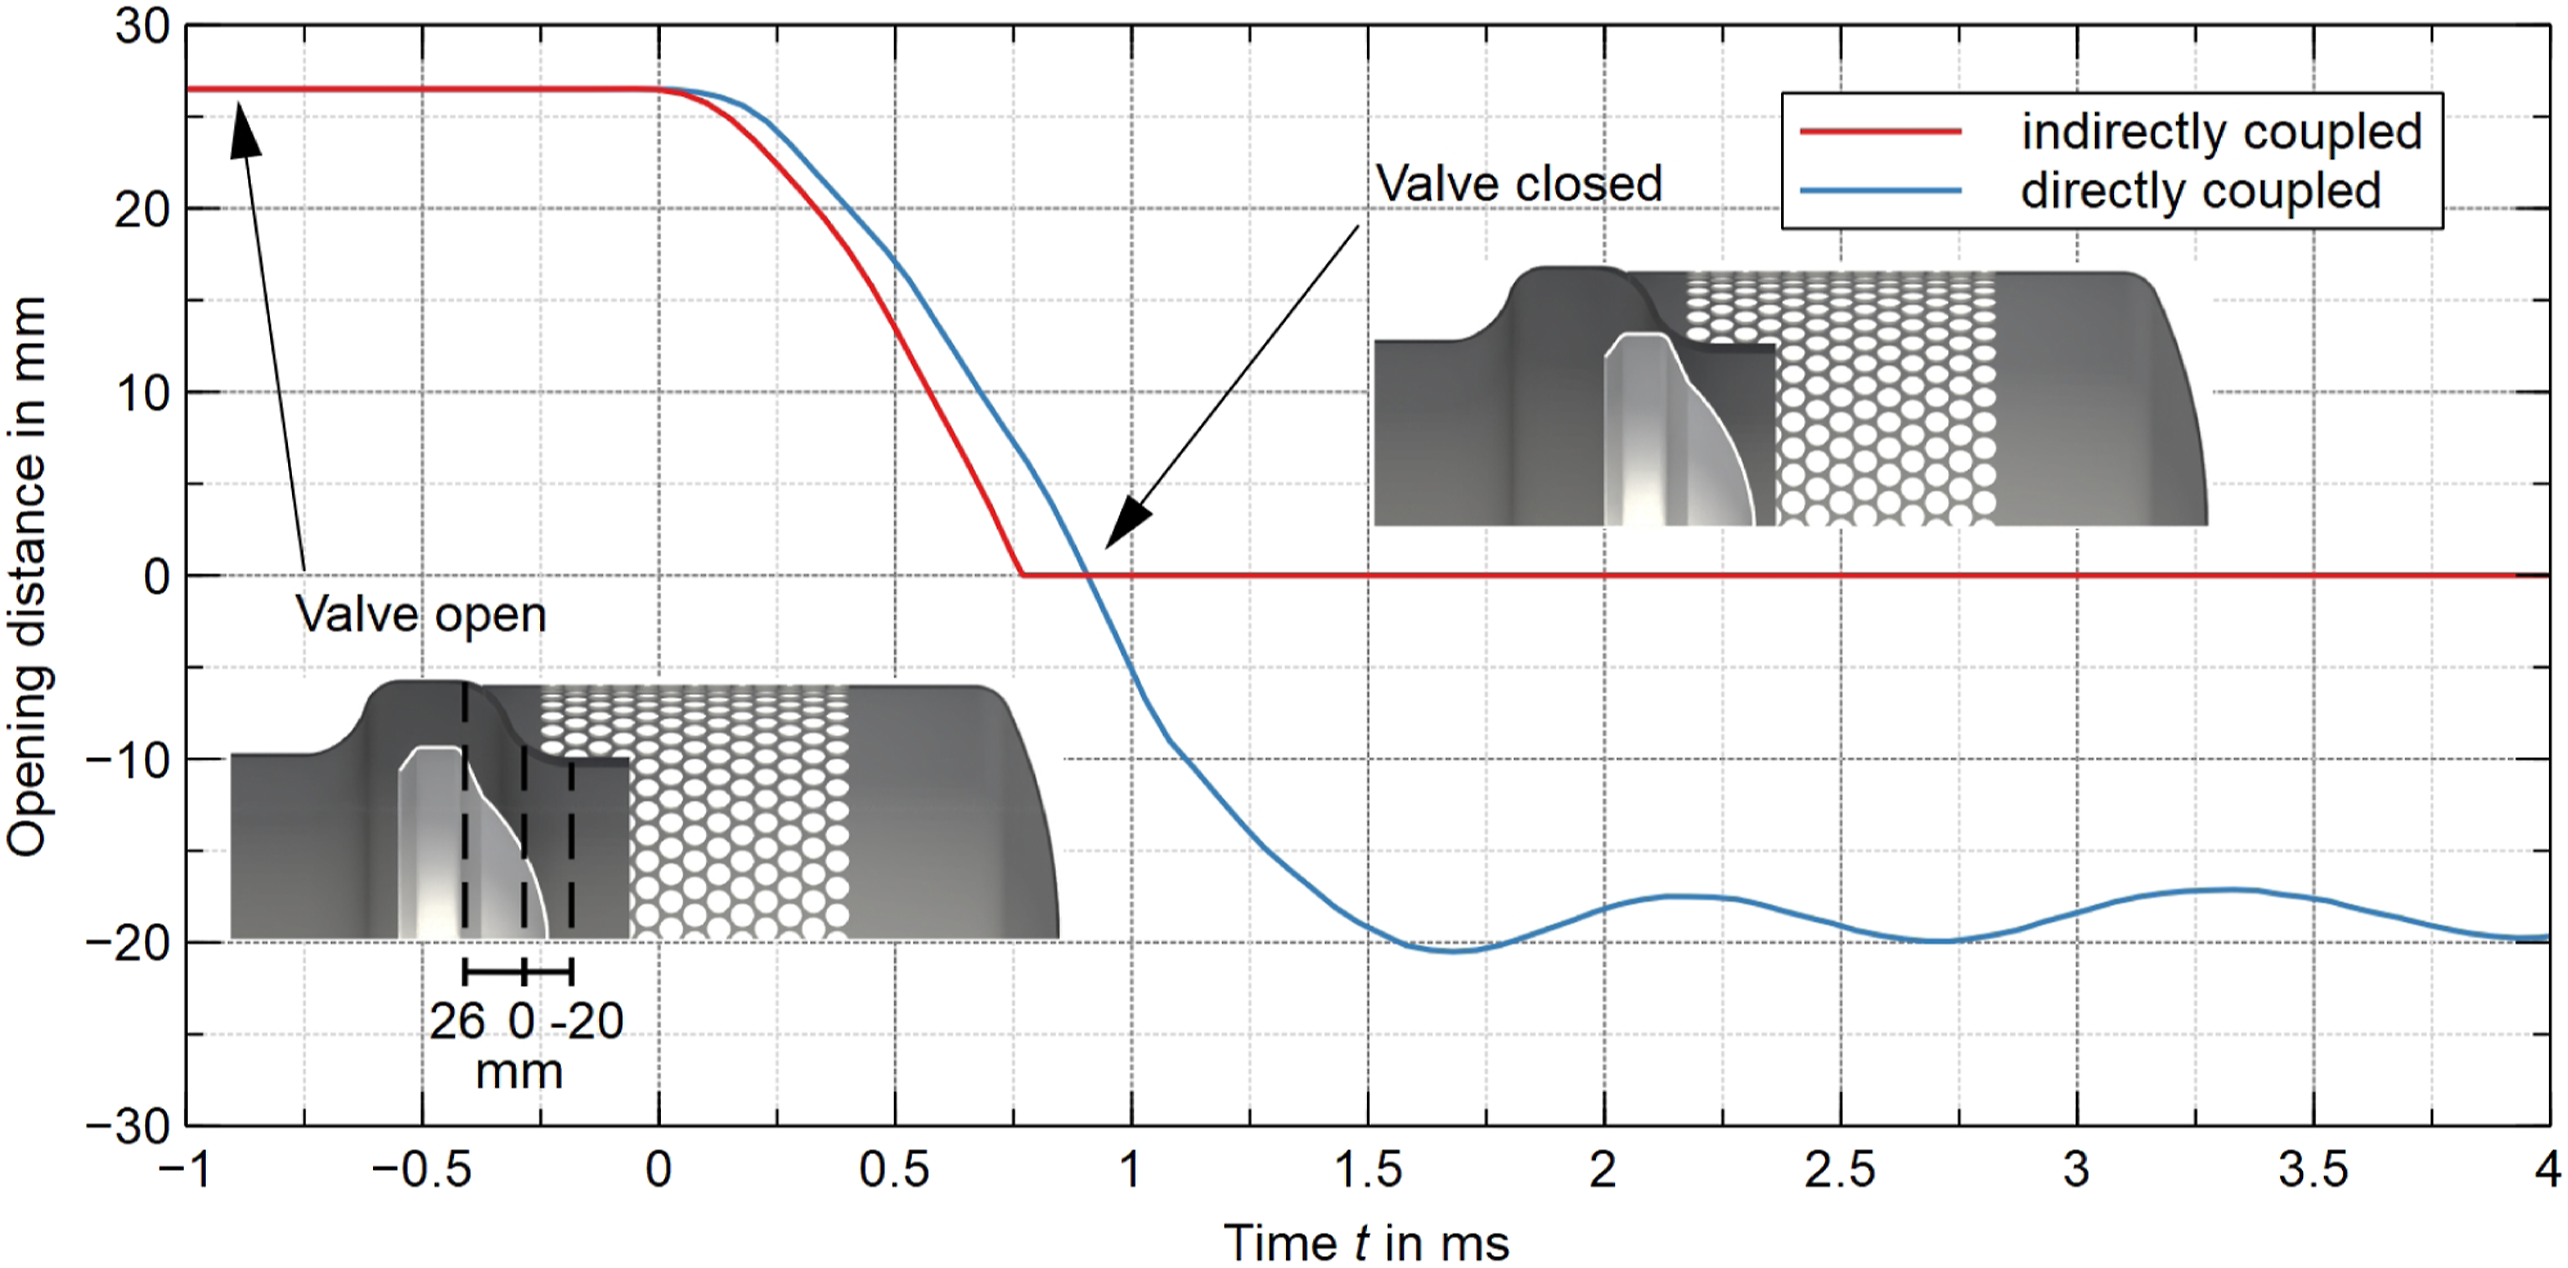
The displacement of the closing mechanism is represented by a one-dimensional time-dependent curve in axial direction, which has a direct influence on the blast pressure leakage. It can be seen that the closing behaviour of the two methods differs fundamentally, in particular after it is closed (opening distance = 0 mm). In a first phase, the blast wave reaches the half-spherical steel shell (t = 0 ms) and begins to accelerate it. This phase can be described as a rigid-body motion since the vibrations in the steel shell resulting from the impact of the pressure wave are negligible. The indirectly coupled simulation reveals a closing time t close ≈ 0.76 ms compared to t close ≈ 0.90 ms with direct coupling. On the basis of the before mentioned rigid-body motion, this difference could be caused by the coupling method. Whereas in the indirect coupling solely the pressure load is induced on the steel shell, in the directly coupled simulation the occurring air resistance is also considered. Therefore, the resulting force is smaller and the closing time longer. Another cause for the difference might be that the back side of the shell is also taken into account in the directly coupled CSD simulation. The high-speed camera recording in figure Figure 12 supports the outcome of the CSD analyses, where a closing time of 0.95 ms is observed. The faster closing in the simulations is plausible, considering the slightly higher peak reflected overpressure resulting from the empty shock tube simulations in comparison to the measurements (compare Figure 7).
As soon as the safety valve is closed, the difference of the coupling methods becomes apparent. In case of the indirect coupling, the steel shell remains closed at a fixed position, which is a consequence of the implementation as a rigid body in APOLLO. For the direct coupling, a more advanced material model was used (Cowper-Symonds) to be able to predict the behaviour after closure as well. The steel shell deforms plastically as soon as it is in contact with the casing and is squeezed into it. Consequently, the corresponding opening distance in Figure 8 reaches negative values. In Figure 9, the point for measuring the opening distance and the theoretical contact point on the casing are indicated with a red dot and dashed line, respectively. It is visible, that the measuring point passes the contact point while deforming. After the steel shell has reached its maximum deformation (minimum opening distance), it begins to oscillate. Due to this phenomenon a gap is observed, which opens and closes as long as the steel shell has not reached its equilibrium state. This described behaviour could not be reproduced in the coupled CFD analysis due to the resolution limitation by the voxel mesh size. Furthermore, the whole behaviour of the steel shell after it has reached its contact point strongly depends on its material modelling. The maximum von Mises stress of 1 GPa is above the ultimate strength of most steels and would lead to failure. However, this is a consequence of the chosen Cowper-Symonds model, its coefficients, the linear plastic behaviour and the resulting large deformations. On the one hand, the coefficients were estimated due to missing material data; on the other hand, the material model does not take non-linear plastic behaviour into account. In order to improve the structural behaviour, further studies should consider experimental material tests in combination with a more capable material model, that is, Johnson-Cook. Graphical representation of the deformation and von Mises stress in the directly coupled simulation of test case 1.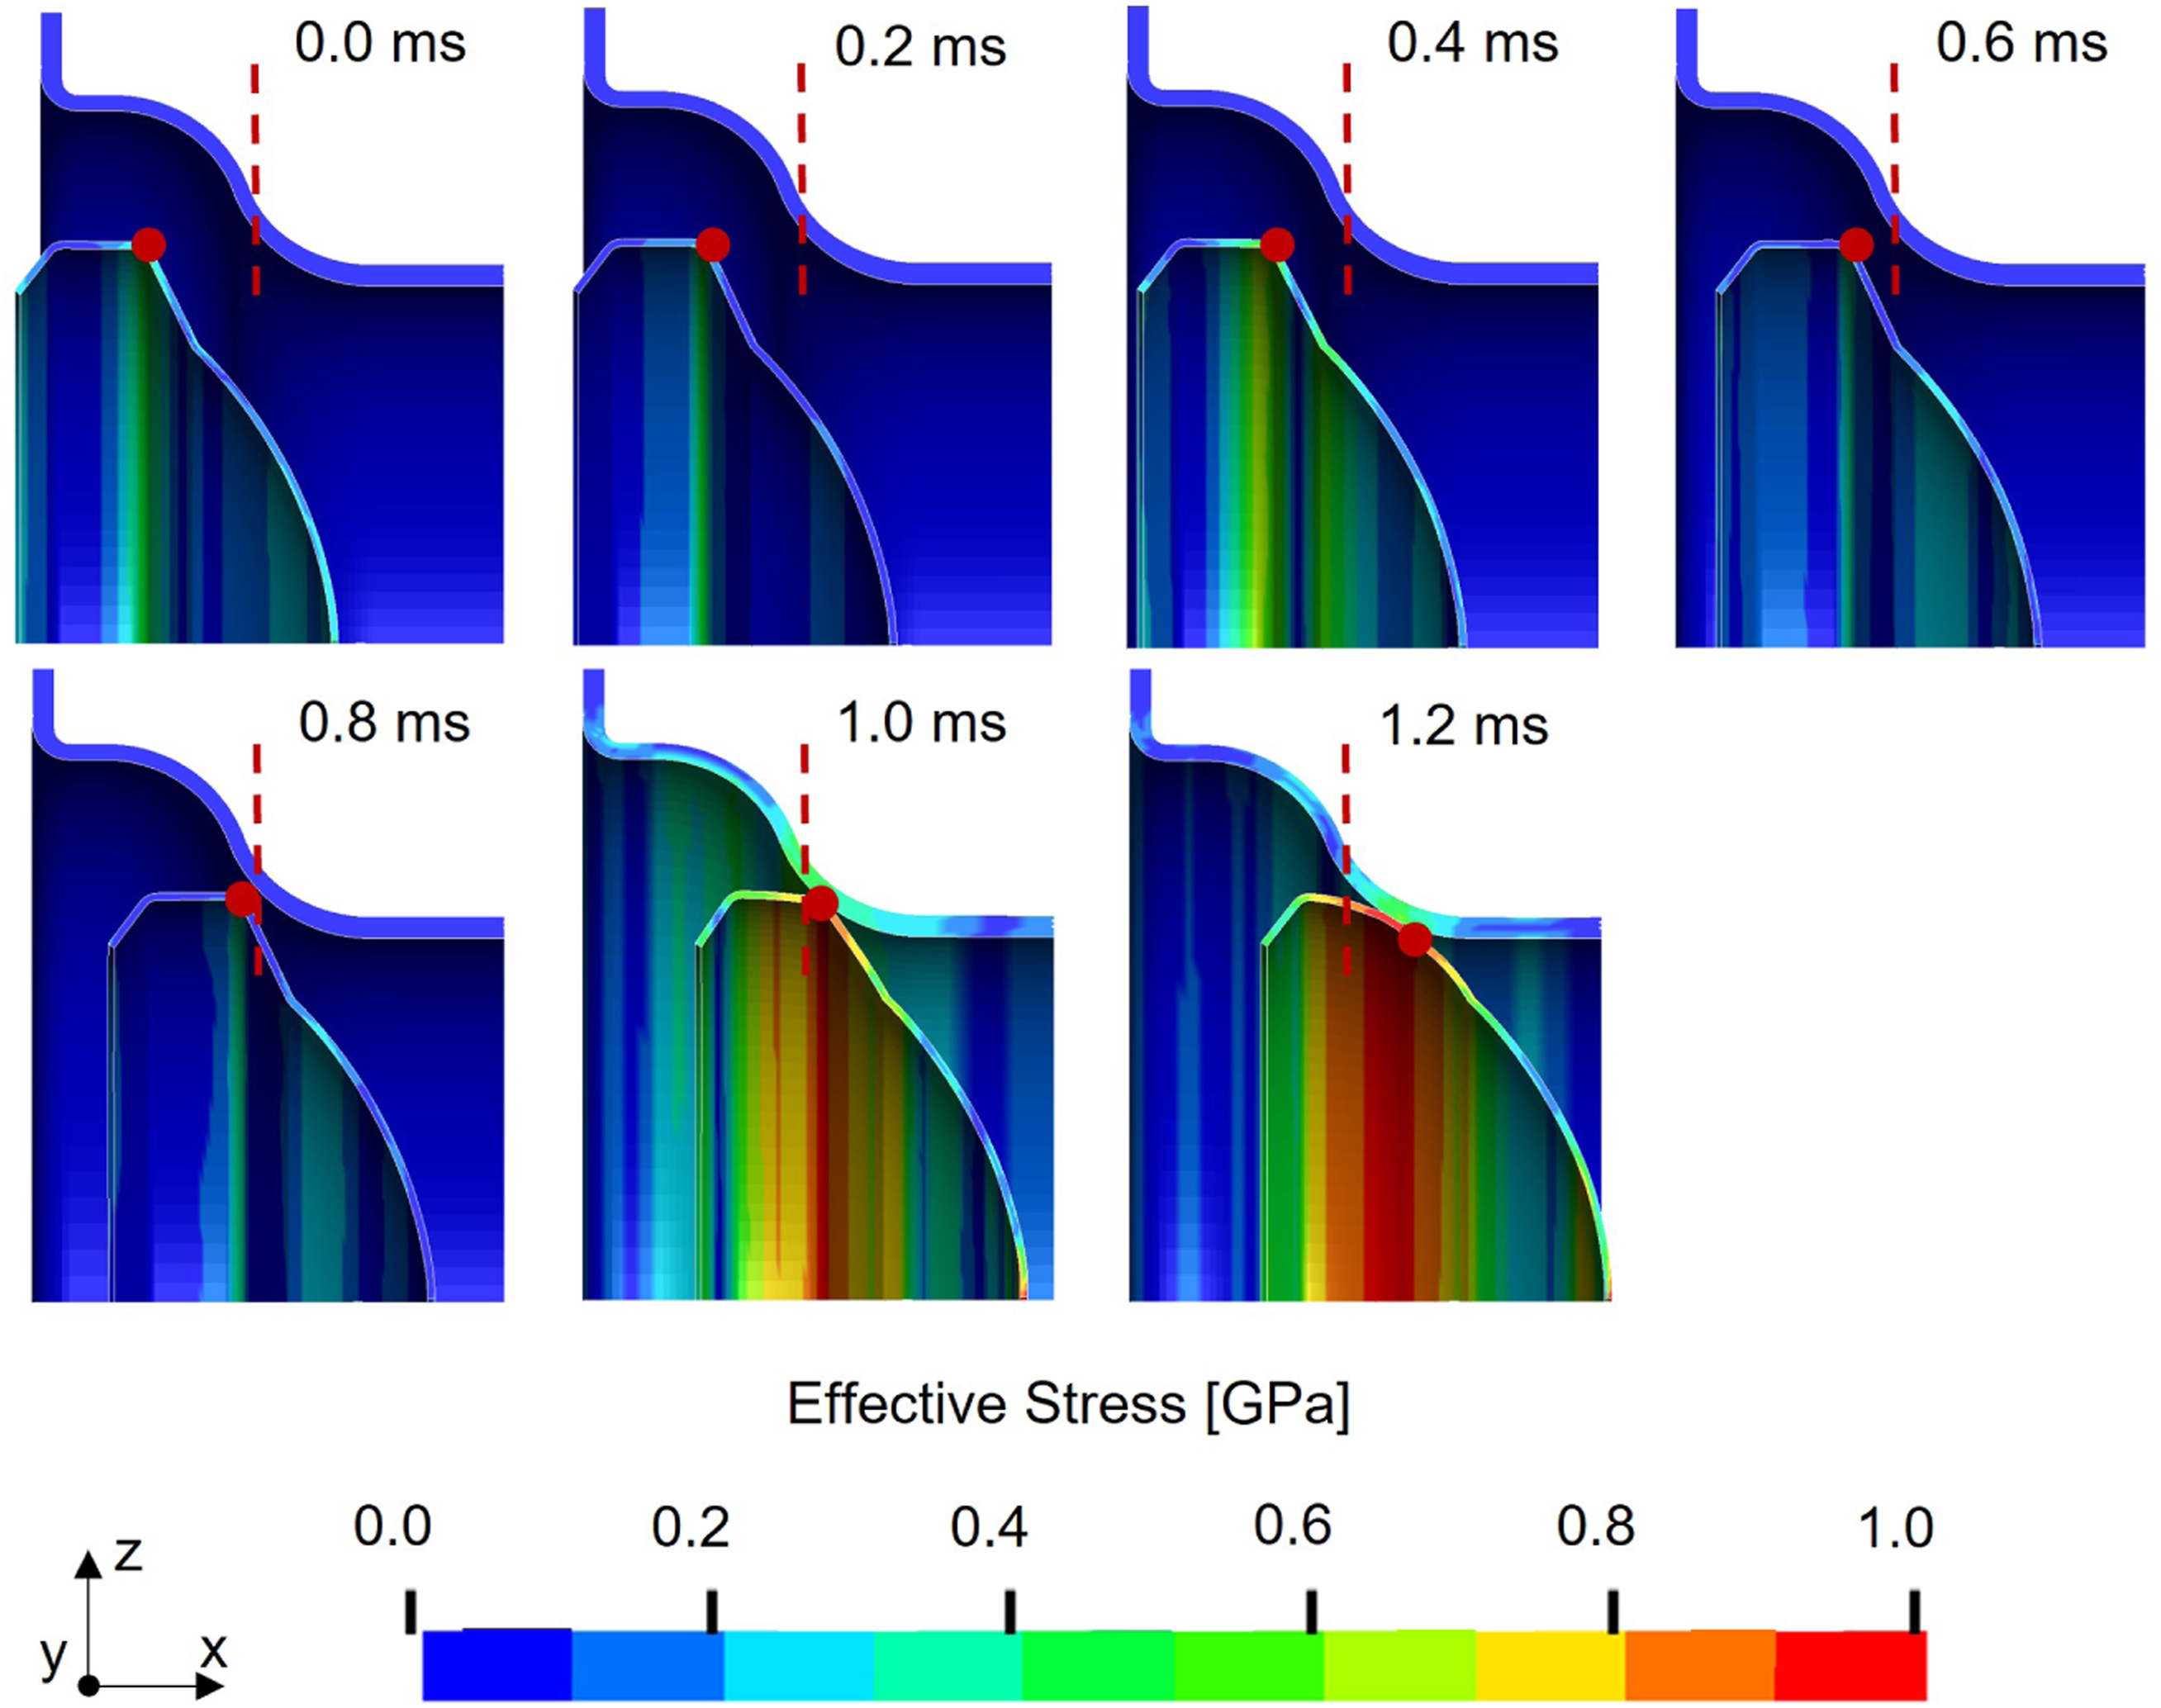
Fluid dynamic analysis
Figure 10 shows the residual overpressure (p
res
) and impulse (i
res
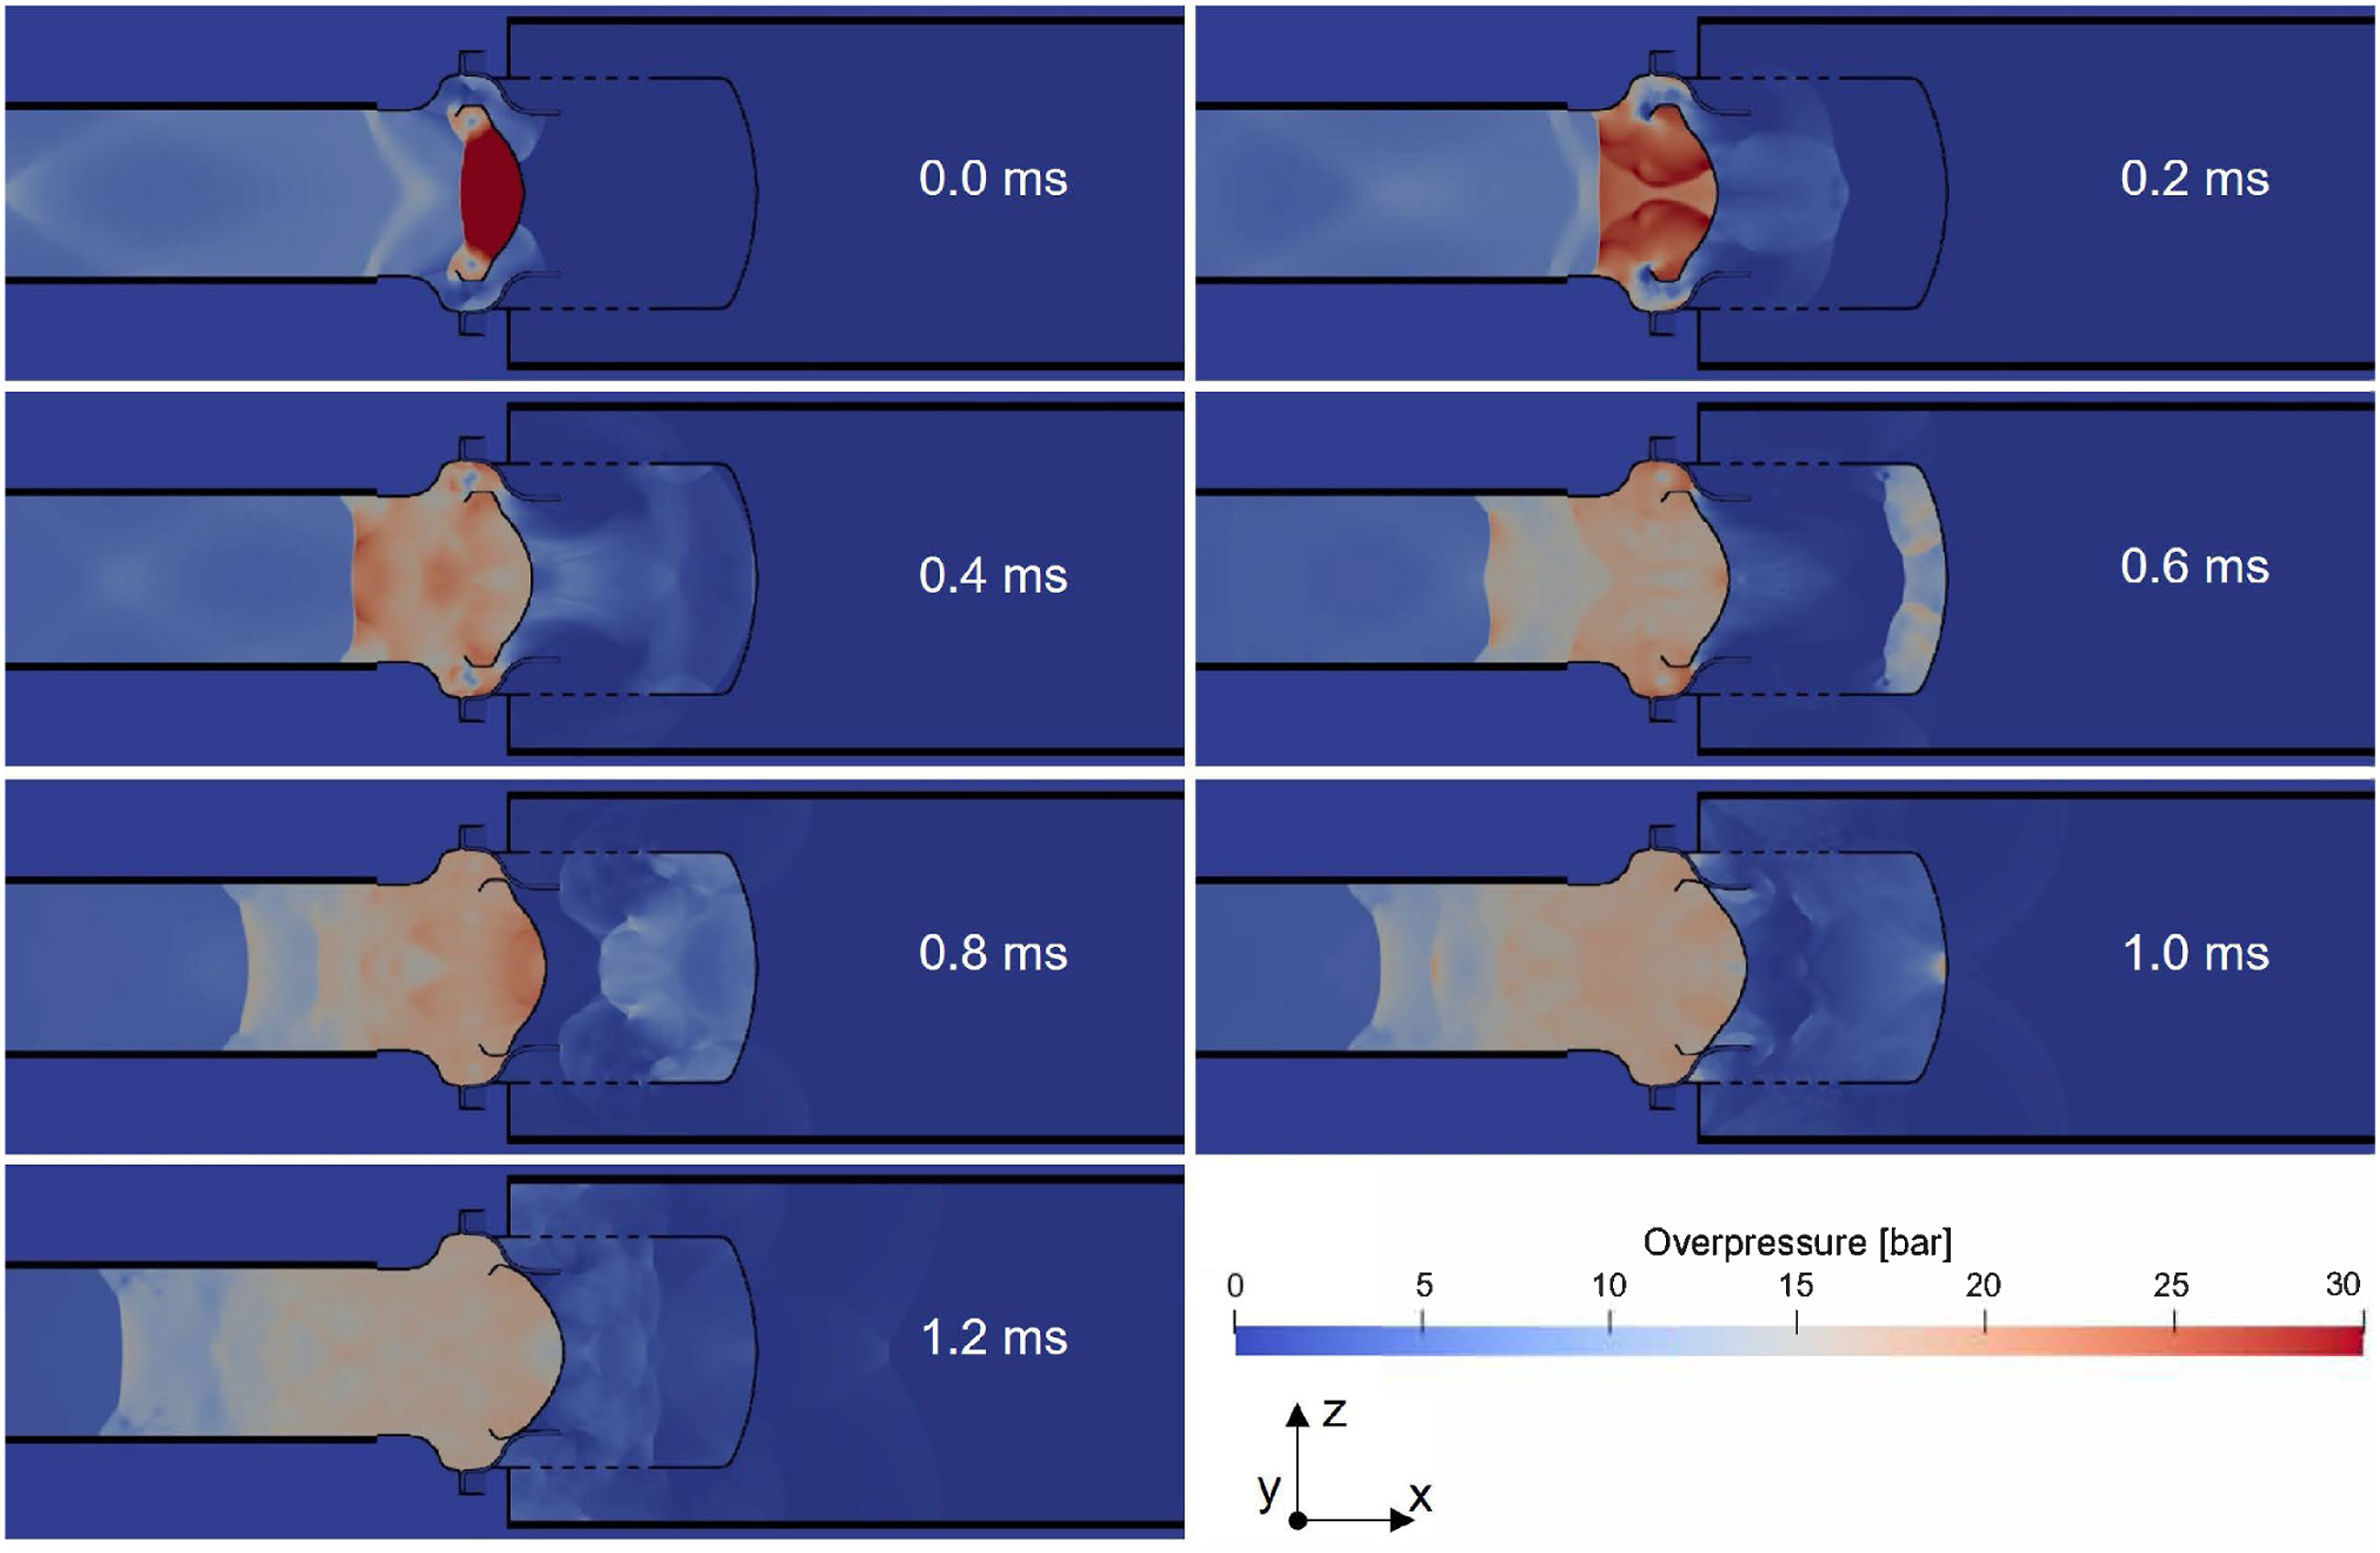
) of the measurement and the simulations at measuring location MS2 of test case 1, where pressure contour plots at different time steps are depicted in Figure 11. A maximum residual overpressure (p
res,max
) of 1.48 bar is found in the experiments, where 1.35 bar and 1.32 bar are obtained in the indirectly and directly coupled simulation, respectively. Moreover, the pressure contour plot reveals that the maximum residual overpressure is induced by the initial shock wave which is reflected in the pressure reducer. In the numerical analysis, the duration until first zero-crossing of the pressure varies from 3.20 ms (direct coupled) to 3.25 ms (indirect coupled) in comparison to 3.20 ms in the measurement. The difference in the residual impulse is 0.08 bar·ms (i
res
= 1.25 bar·ms in both simulations and i
res
= 1.33 bar·ms in the measurement). Therefore, all performance parameters to assess a passive air blast safety valve are adequately predicted with both coupling approaches (maximum deviation of 12% between the simulations and the measurement). Comparison between measurement and FSI simulations of the residual overpressure p
res
(t) and residual impulse i
res
(t) at measuring location MS2 of test case 1 (meas = measured data, indirect = indirect coupling, direct = direct coupling). Overpressure contour plots in a vertical cut through the safety valve and shock tube (mirrored quarter model) of test case 1 during blast loading at different time steps.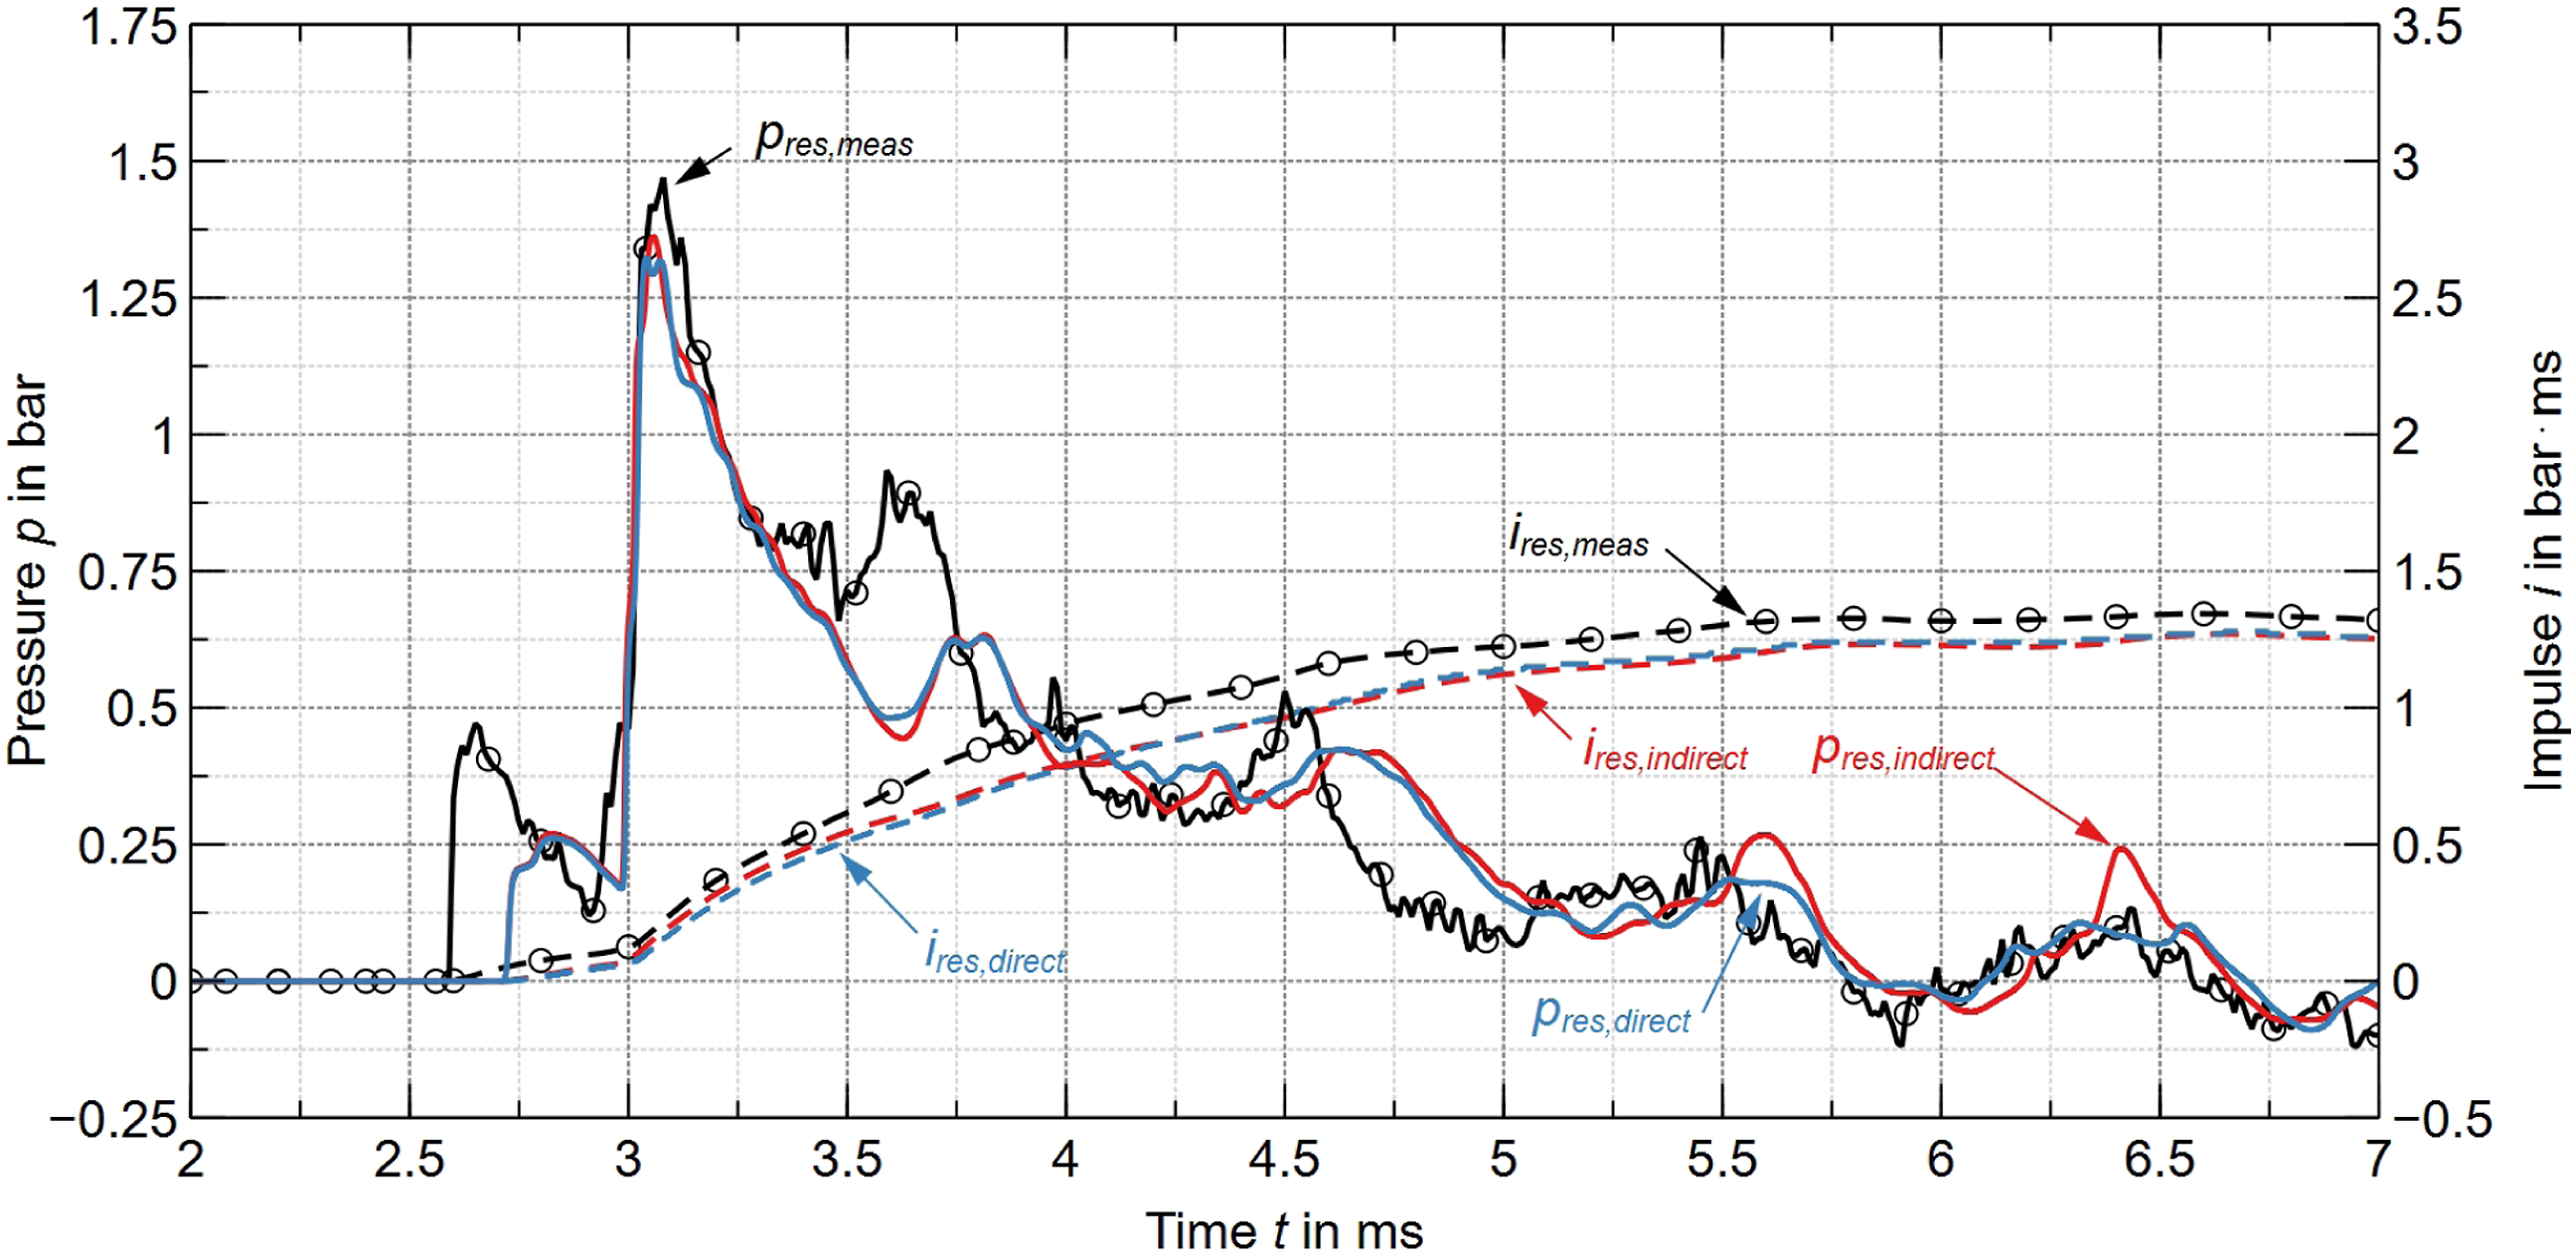
Despite this fact, a slight deviation in the overall pressure–time history is observed. For example, the initial overpressure is insufficiently predicted by both simulations. One possible cause might be the insufficient resolution of the holes in the pressure reducer by the cartesian voxel grid, where the volume flow rate until valve closure is underestimated, that is, the free surface area is smaller than in the real situation. Another possible cause could be that the pressure reducer is not transferred to LS-DYNA and is thus not taken into account structurally. In reality, the pressure reducer is also subjected to deformation and is additionally affected by the air blast. Similarly, the pressure rise at 3.6 ms in the measurement is underestimated, where the pressure peak in the simulation arrives 0.25 ms later and is less distinct (0.625 bar in comparison to approximately 0.9 bar).
As expected, the direct coupled simulation reveals a better agreement with the measurements, which is clearly visible starting from 5 ms. The indirectly coupled simulation shows two pressure peaks at 5.6 ms and 6.4 ms, which are not observed in the experiment. Possible reasons can be on the one hand the fixed defined motion curve and on the other hand the assumption of a rigid valve body in the CFD analysis. These simplifications have the consequence that the valve body does not deform, both at the impact of the pressure wave and at the impact of the valve body on the casing. In addition, the applied motion curve results in an inelastic behaviour, according to which the valve body does not open again after the first impact on the casing. The pressure contour plot of the direct coupling shows how the air blast leads to a deformation of the closing mechanism. Since in the direct coupling the pressure on all surfaces of the closing mechanism is taken into account, this leads to an oscillation in the closing curve. Nevertheless, indirectly coupled simulations can adequately predict the key performance figures of the blast pressure leakage, which might be appropriate for a time-efficient computation of simpler safety valve closing mechanisms.
High-speed camera recordings
Figure 12 shows the high-speed camera recordings of test case 1. At t = 0 ms, the air blast hits the safety valve closing mechanism, where the red cross marks the position of the steel shell. When the latter contacts the casing (red dotted line) at t = 1.0 and 1.2 ms, it shifts slightly in the axial direction. This behaviour is also reproduced in the directly coupled FSI simulation. High-speed camera recordings of the closing process in flow direction at 10’000 frames per second (time relative to the initial movement of the valve body) of test case 1. Additionally, the location of the recording is shown.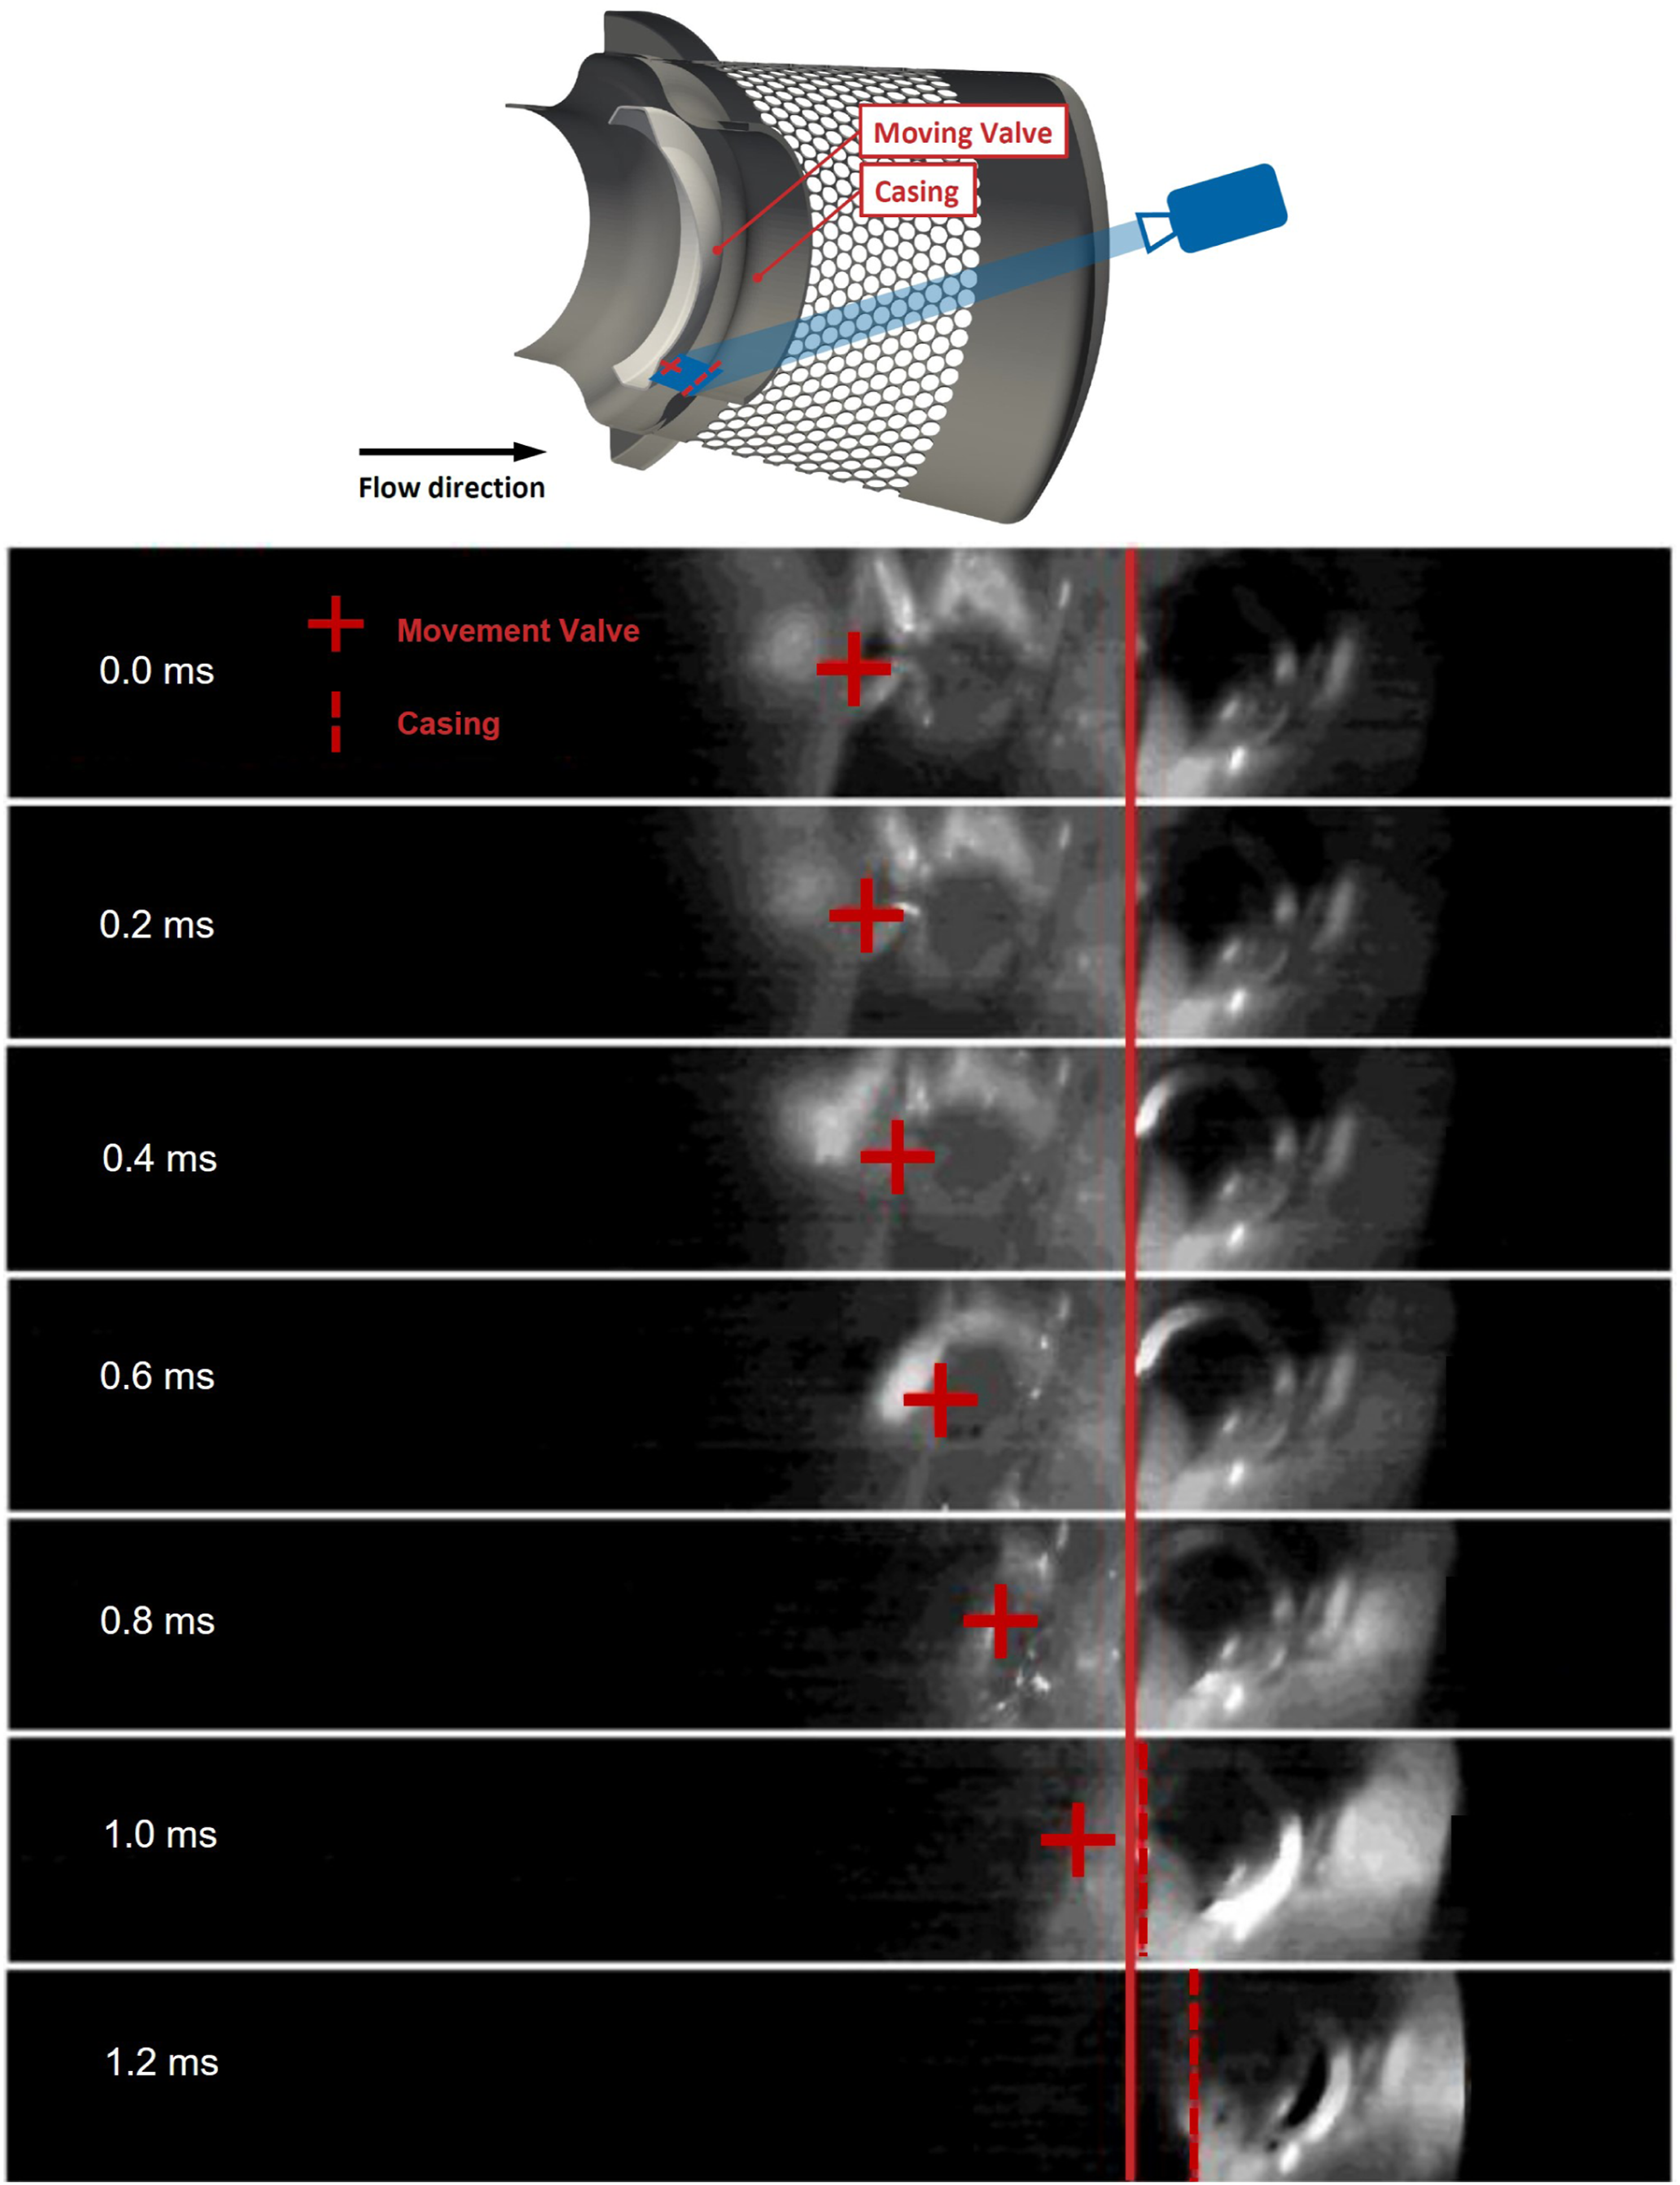
Test case 2
Empty shock tube
Figure 13 shows the comparison of the pressure–time histories of test case 2 at measuring location MS3 (end flange). The numerical analysis adequately approximates the measured pressure–time history, with a simulated peak overpressure of ca. 3.2 bar lying within the fluctuations of the measurement data. A possible reason for the pressure signal noise could be vibrations occurring at the shock tube, which is however not observed in test case 1. A larger deviation between the pressure curves is visible around 40 to 50 ms, where a possible reason might be the modelling of the membrane debris (assumption of a fixed remaining membrane ring), which results in additional pressure wave reflections. Due to this effect, the computed impulse after 80 ms shows a deviation of 10 bar·ms (i = 98 bar·ms in the simulation and i = 88 bar·ms in the measurement). Since the blast loading during the first milliseconds are relevant for the closing behaviour of the safety valve, the simulation results are regarded as acceptable. Comparison of overpressure p(t) and impulse i(t) between the numerical and experimental analysis at measuring location MS3 (end flange) of the empty shock tube configuration for test case 2.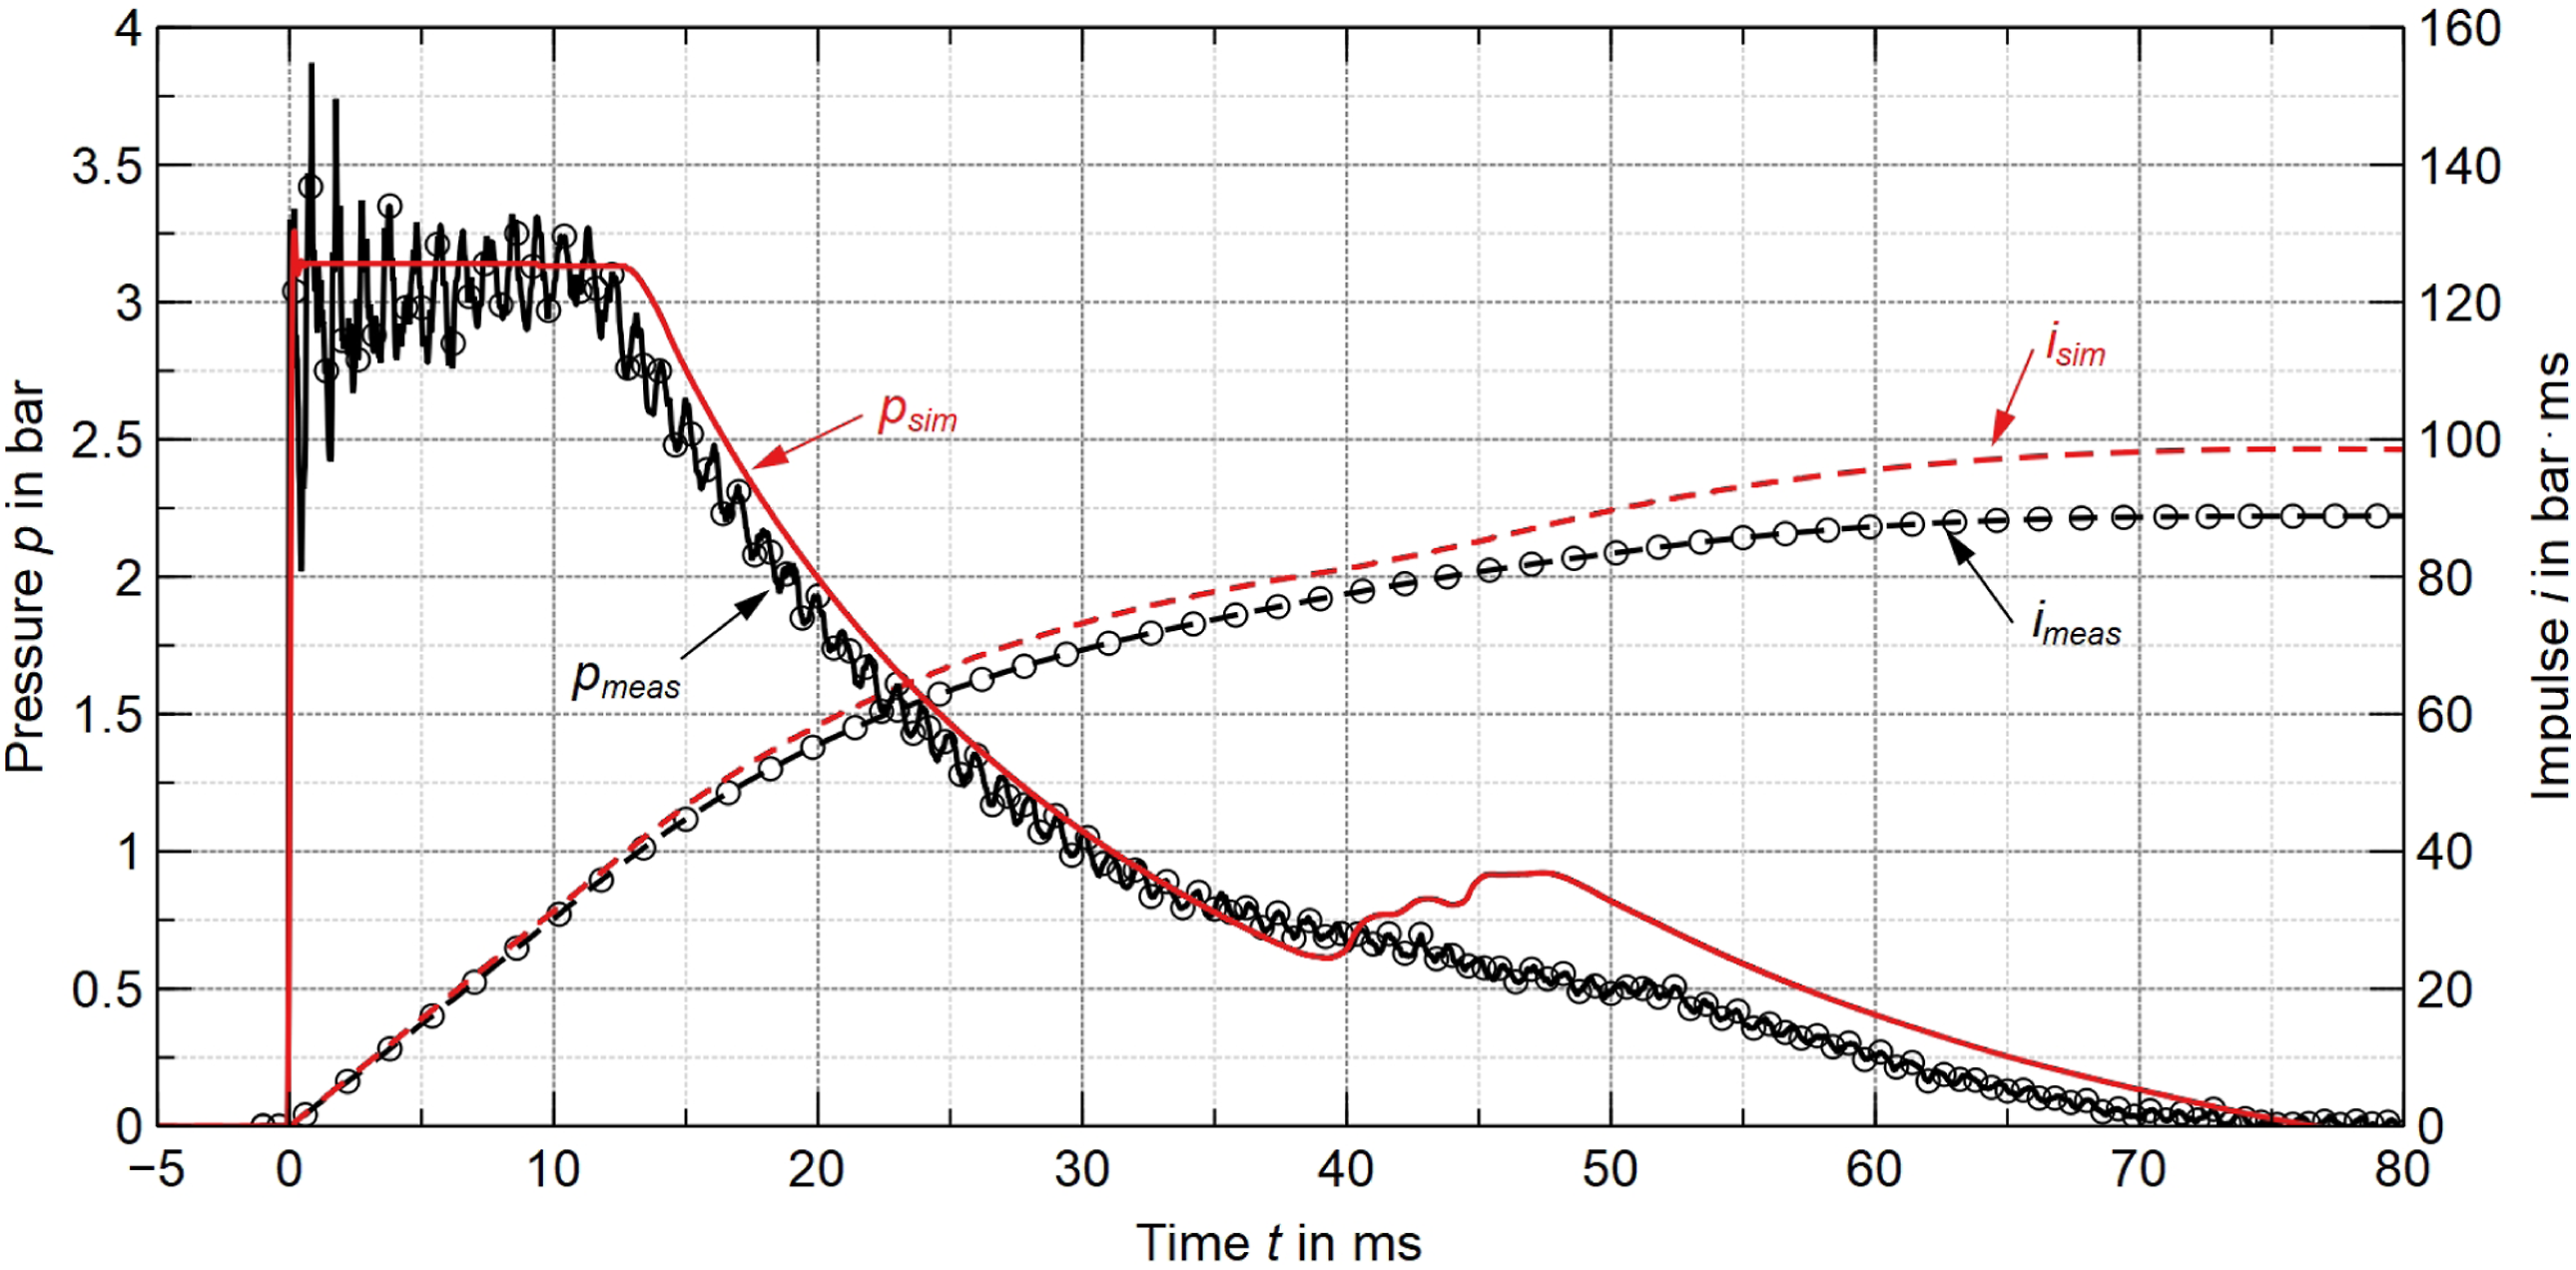
Structural dynamic analysis
Figure 14 depicts the closing curves calculated in LS-DYNA. Since thin metal sheets are the key component in the closing mechanism of the safety valve in test case 2, their deformation was also considered in LS-DYNA. A difference in the closing behaviour is apparent considering the closing time and the metal sheet movement characteristics during deformation. The indirectly coupled simulation reveals a closing time t
close
≈ 0.85 ms compared to t
close
≈ 1.5 ms with direct coupling. This observed deviation can be attributed to the coupling method and the material modelling. The thin metal sheets were loaded on one side and both sides in the indirect and direct coupling, respectively, which significantly influences their deformation. Additionally, a strain rate dependent material model with plastic regime (Cowper-Symonds) was applied in the directly coupled simulation compared to the linear elastic model used for indirect coupling. Comparison of the computed closing curves in LS-DYNA with indirect and direct coupling for test case 2. 3D models show the safety valve in opened and closed state with an opening distance of 27 and 0 mm, respectively.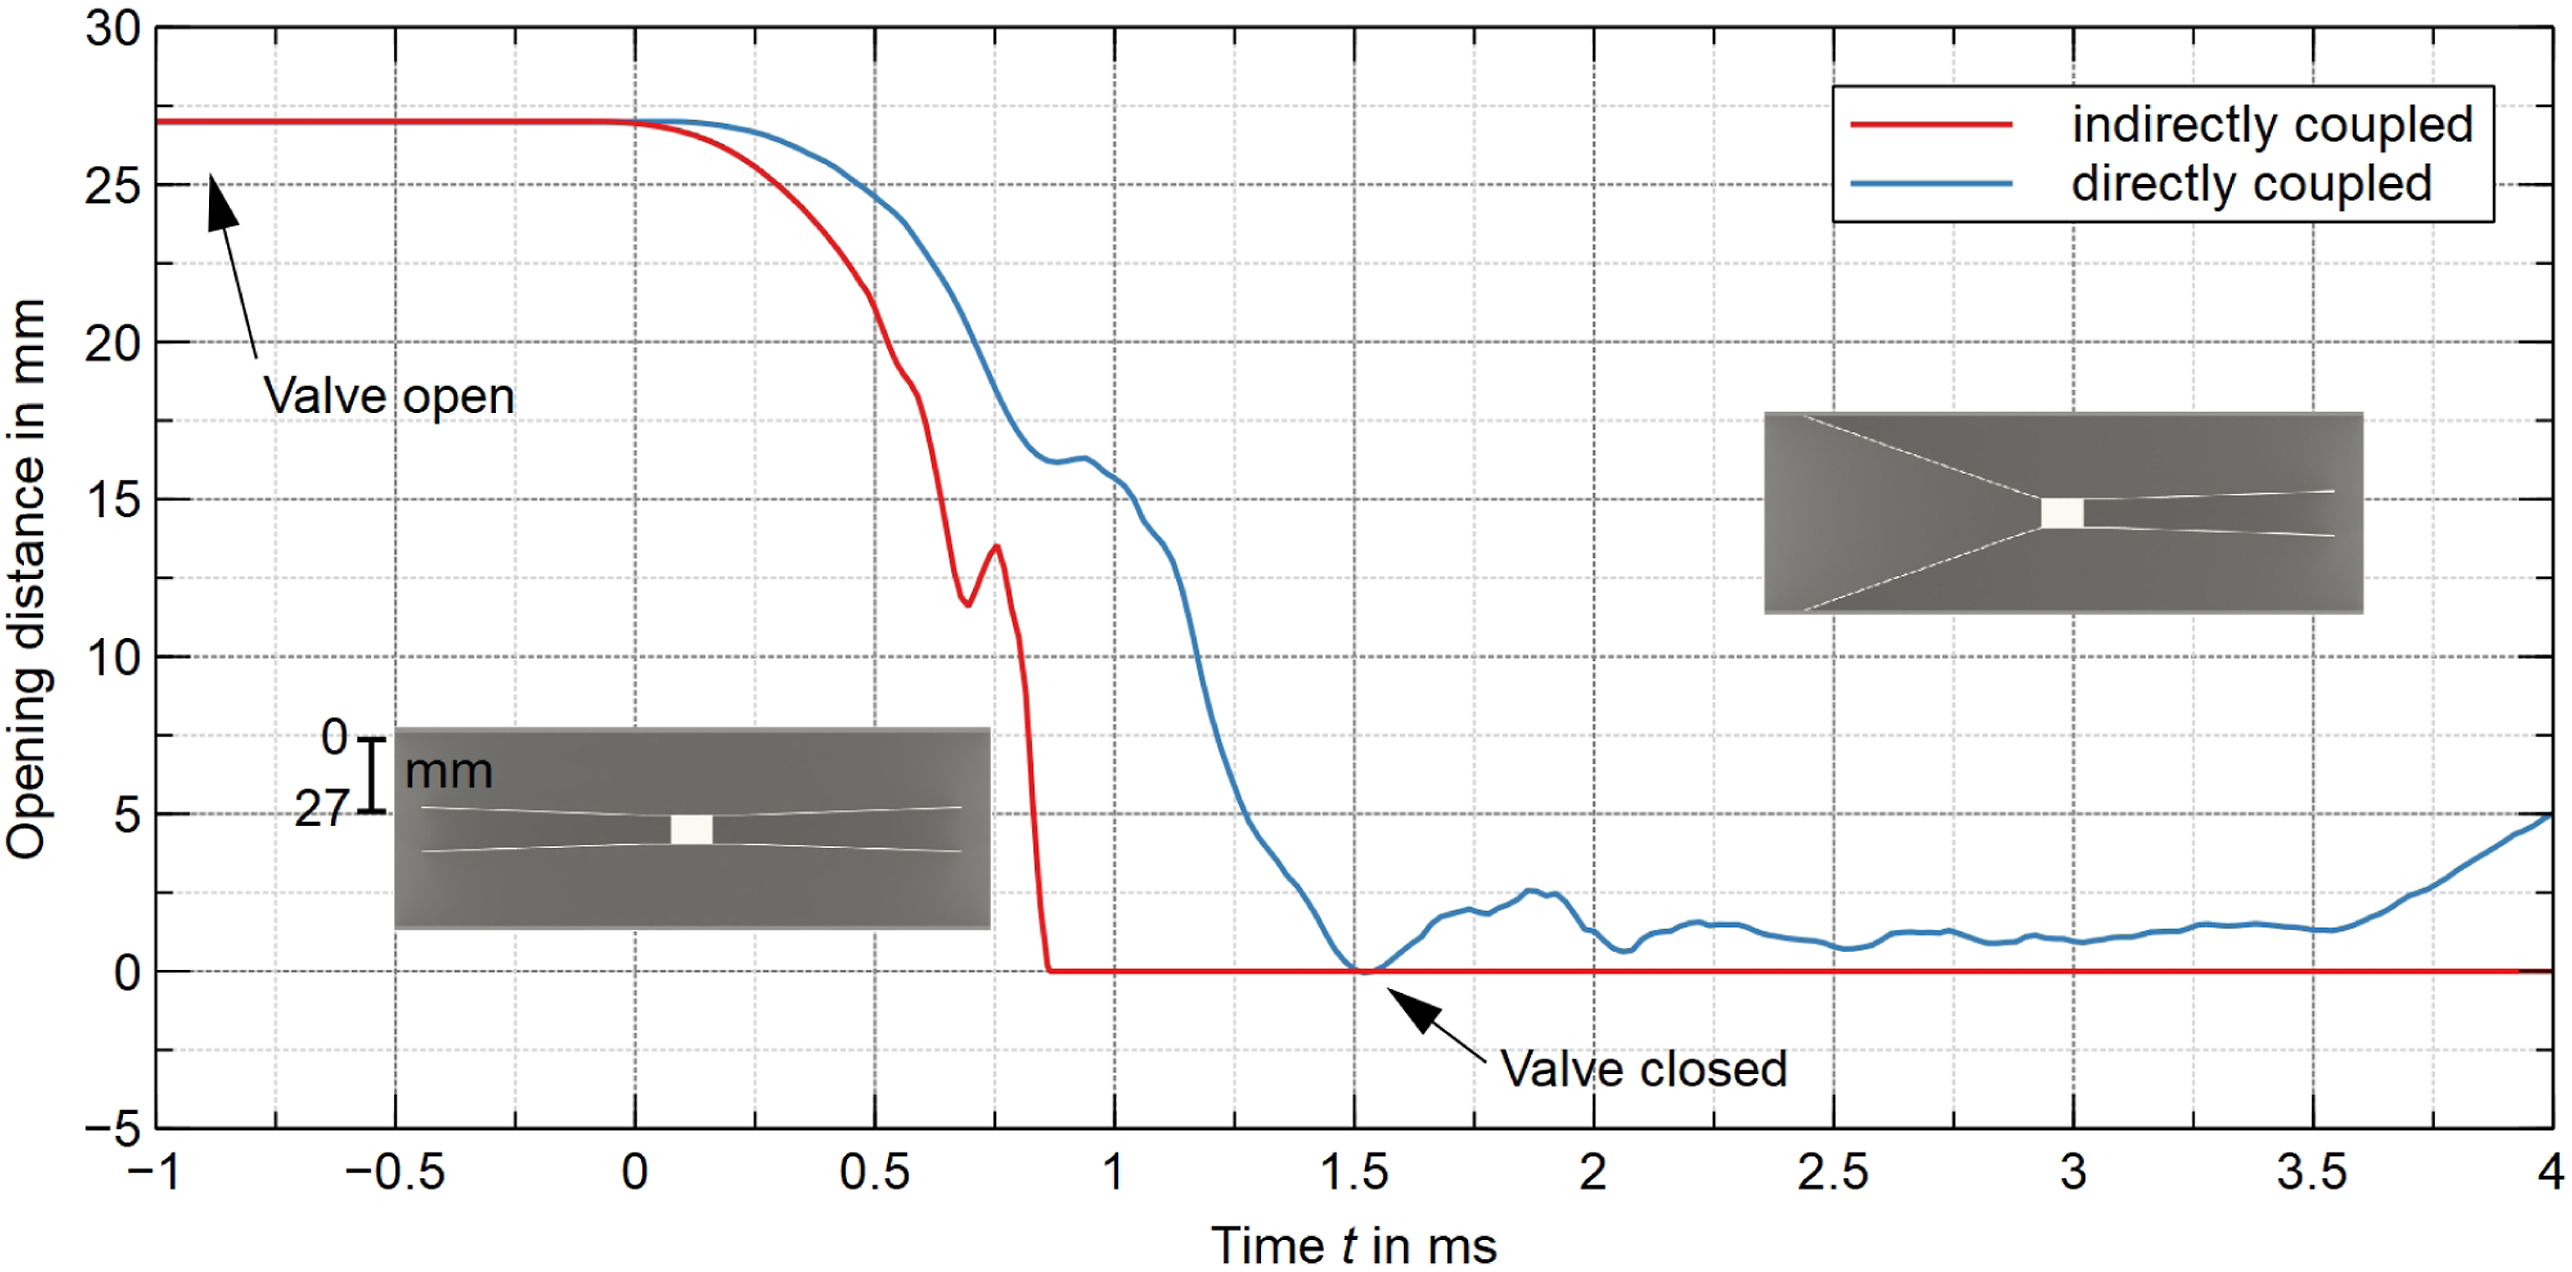
It can be assumed, that the closing time itself is influenced by the coupling method whereas the material modelling affects the closing behaviour. The former is driven by the resulting force distribution, which obviously changes through a double-sided loading. The latter includes the increase of the opening distance while closing for both methods. As presented in Figure 15, this is a result of the pressure load distribution. The thin metal sheets tip does not move while the rest of the sheet is closing. Thus, high strain rates Graphical representation of the deformation and von Mises stress in the directly coupled simulation of test case 2.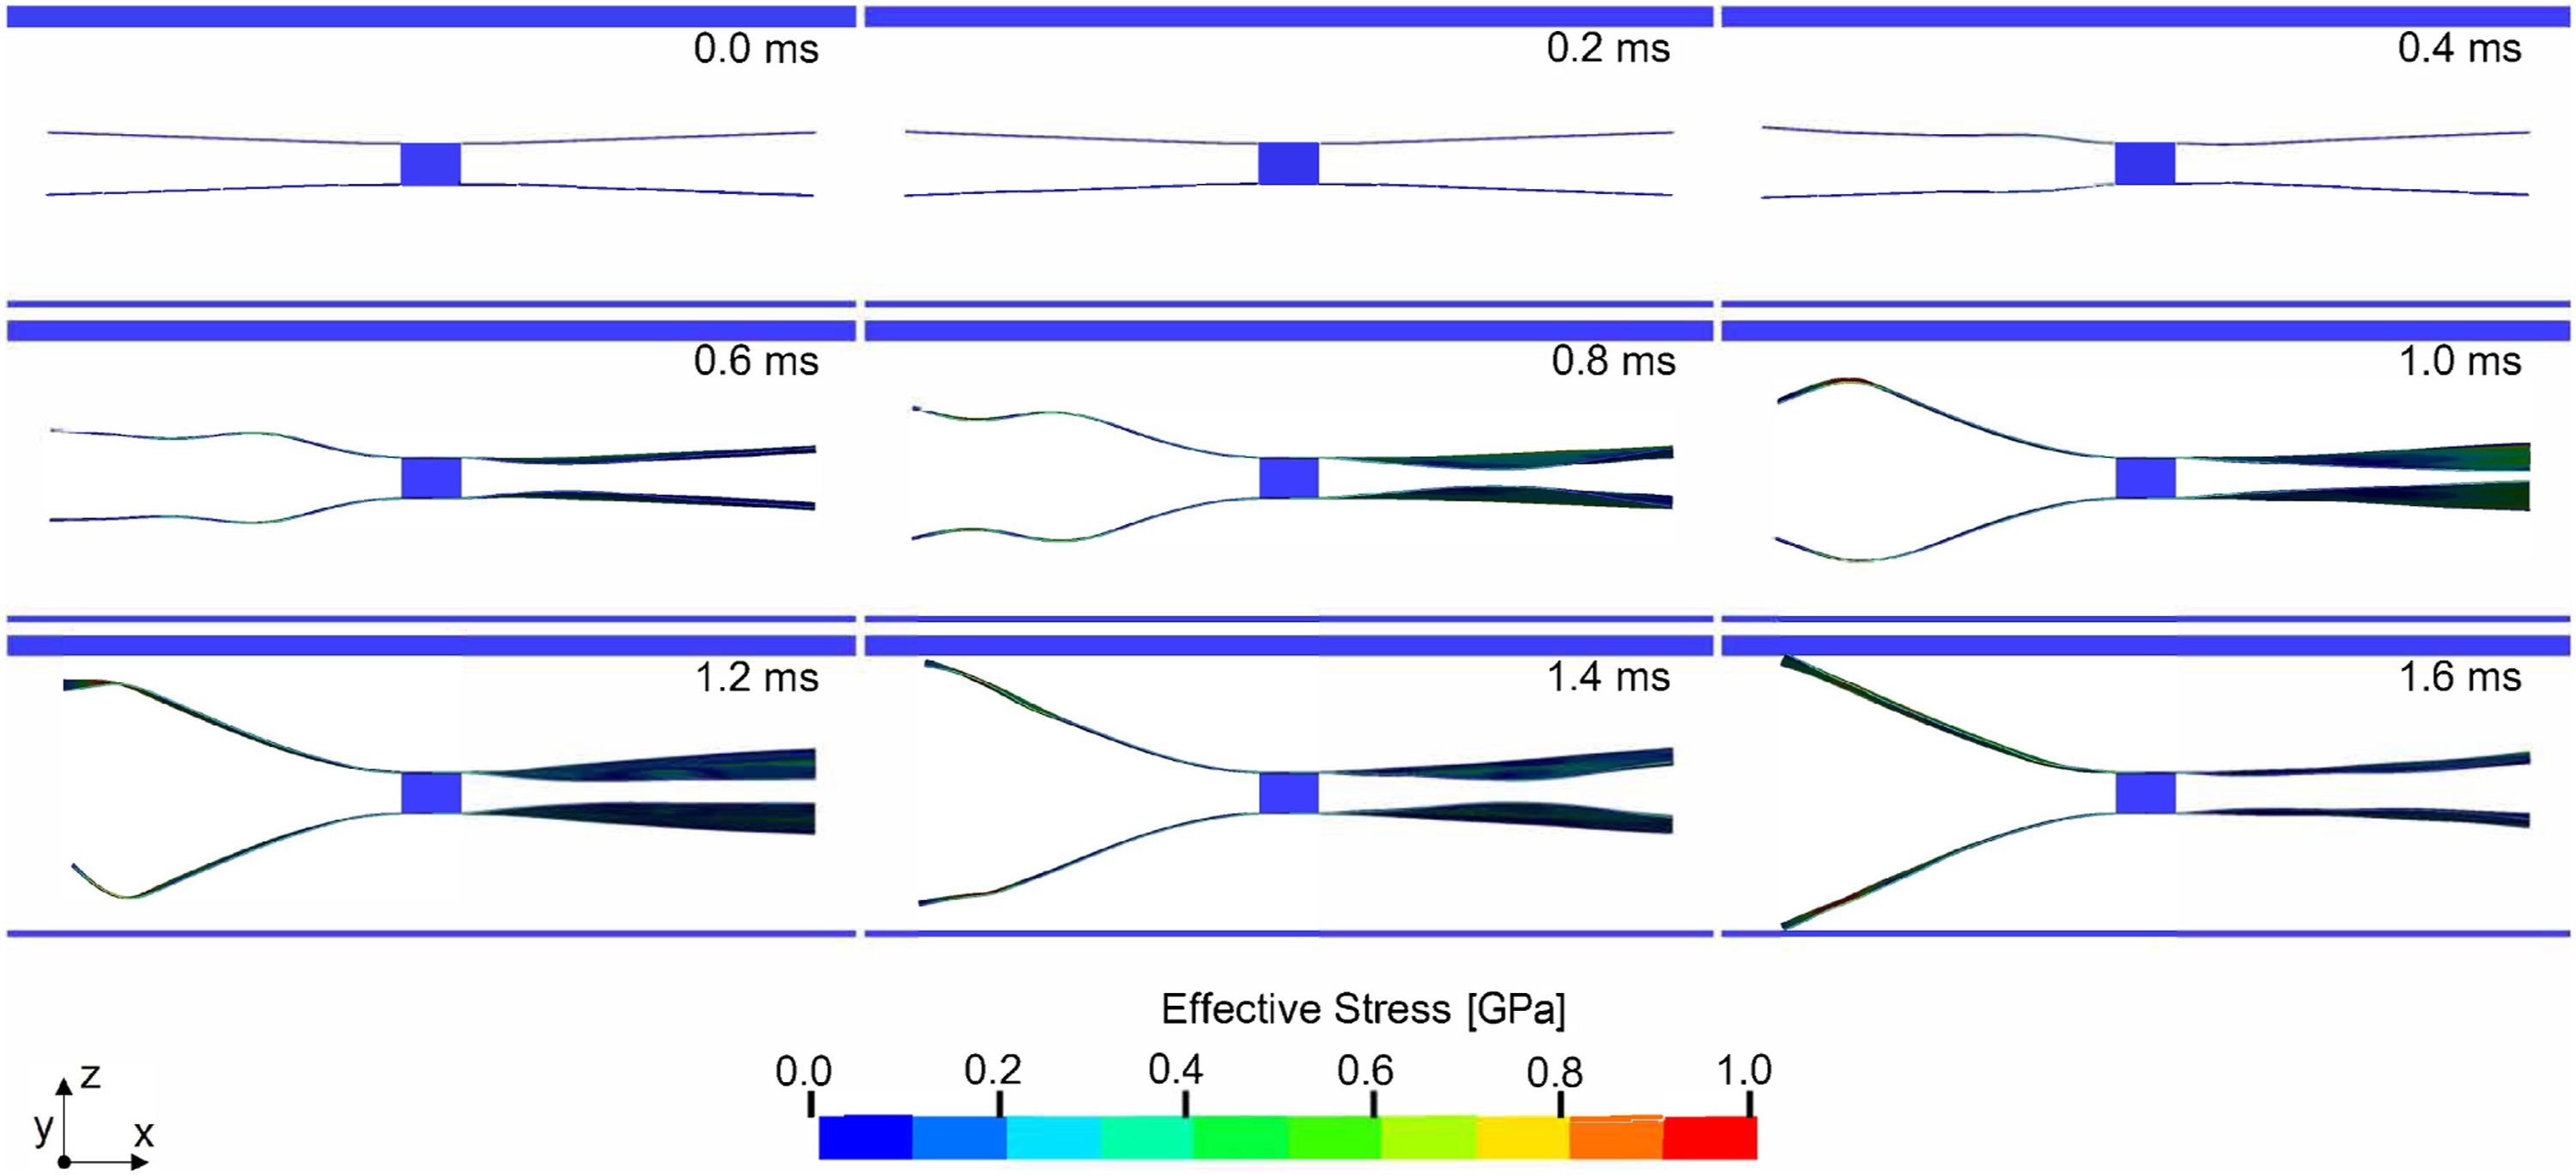
Fluid dynamic analysis
Figure 16 depicts the comparison between the measured and simulated residual pressure (p
res
) at measuring location MS2 of test case 2, where pressure contour plots at different time steps are depicted in Figure 17. The comparison of the data shows that the zero-crossing of the pressure of the indirectly coupled simulation occurs slightly earlier in the numerical analysis ( Comparison between measurement and FSI simulations of the residual overpressure p
res
(t) and residual impulse i
res
(t) at measuring location MS2 of test case 2 (meas = measured data, indirect = indirect coupling, direct = direct coupling). Overpressure contour plots in a vertical cut through the safety valve and shock tube (mirrored quarter model) of test case 2 during blast loading at different time steps.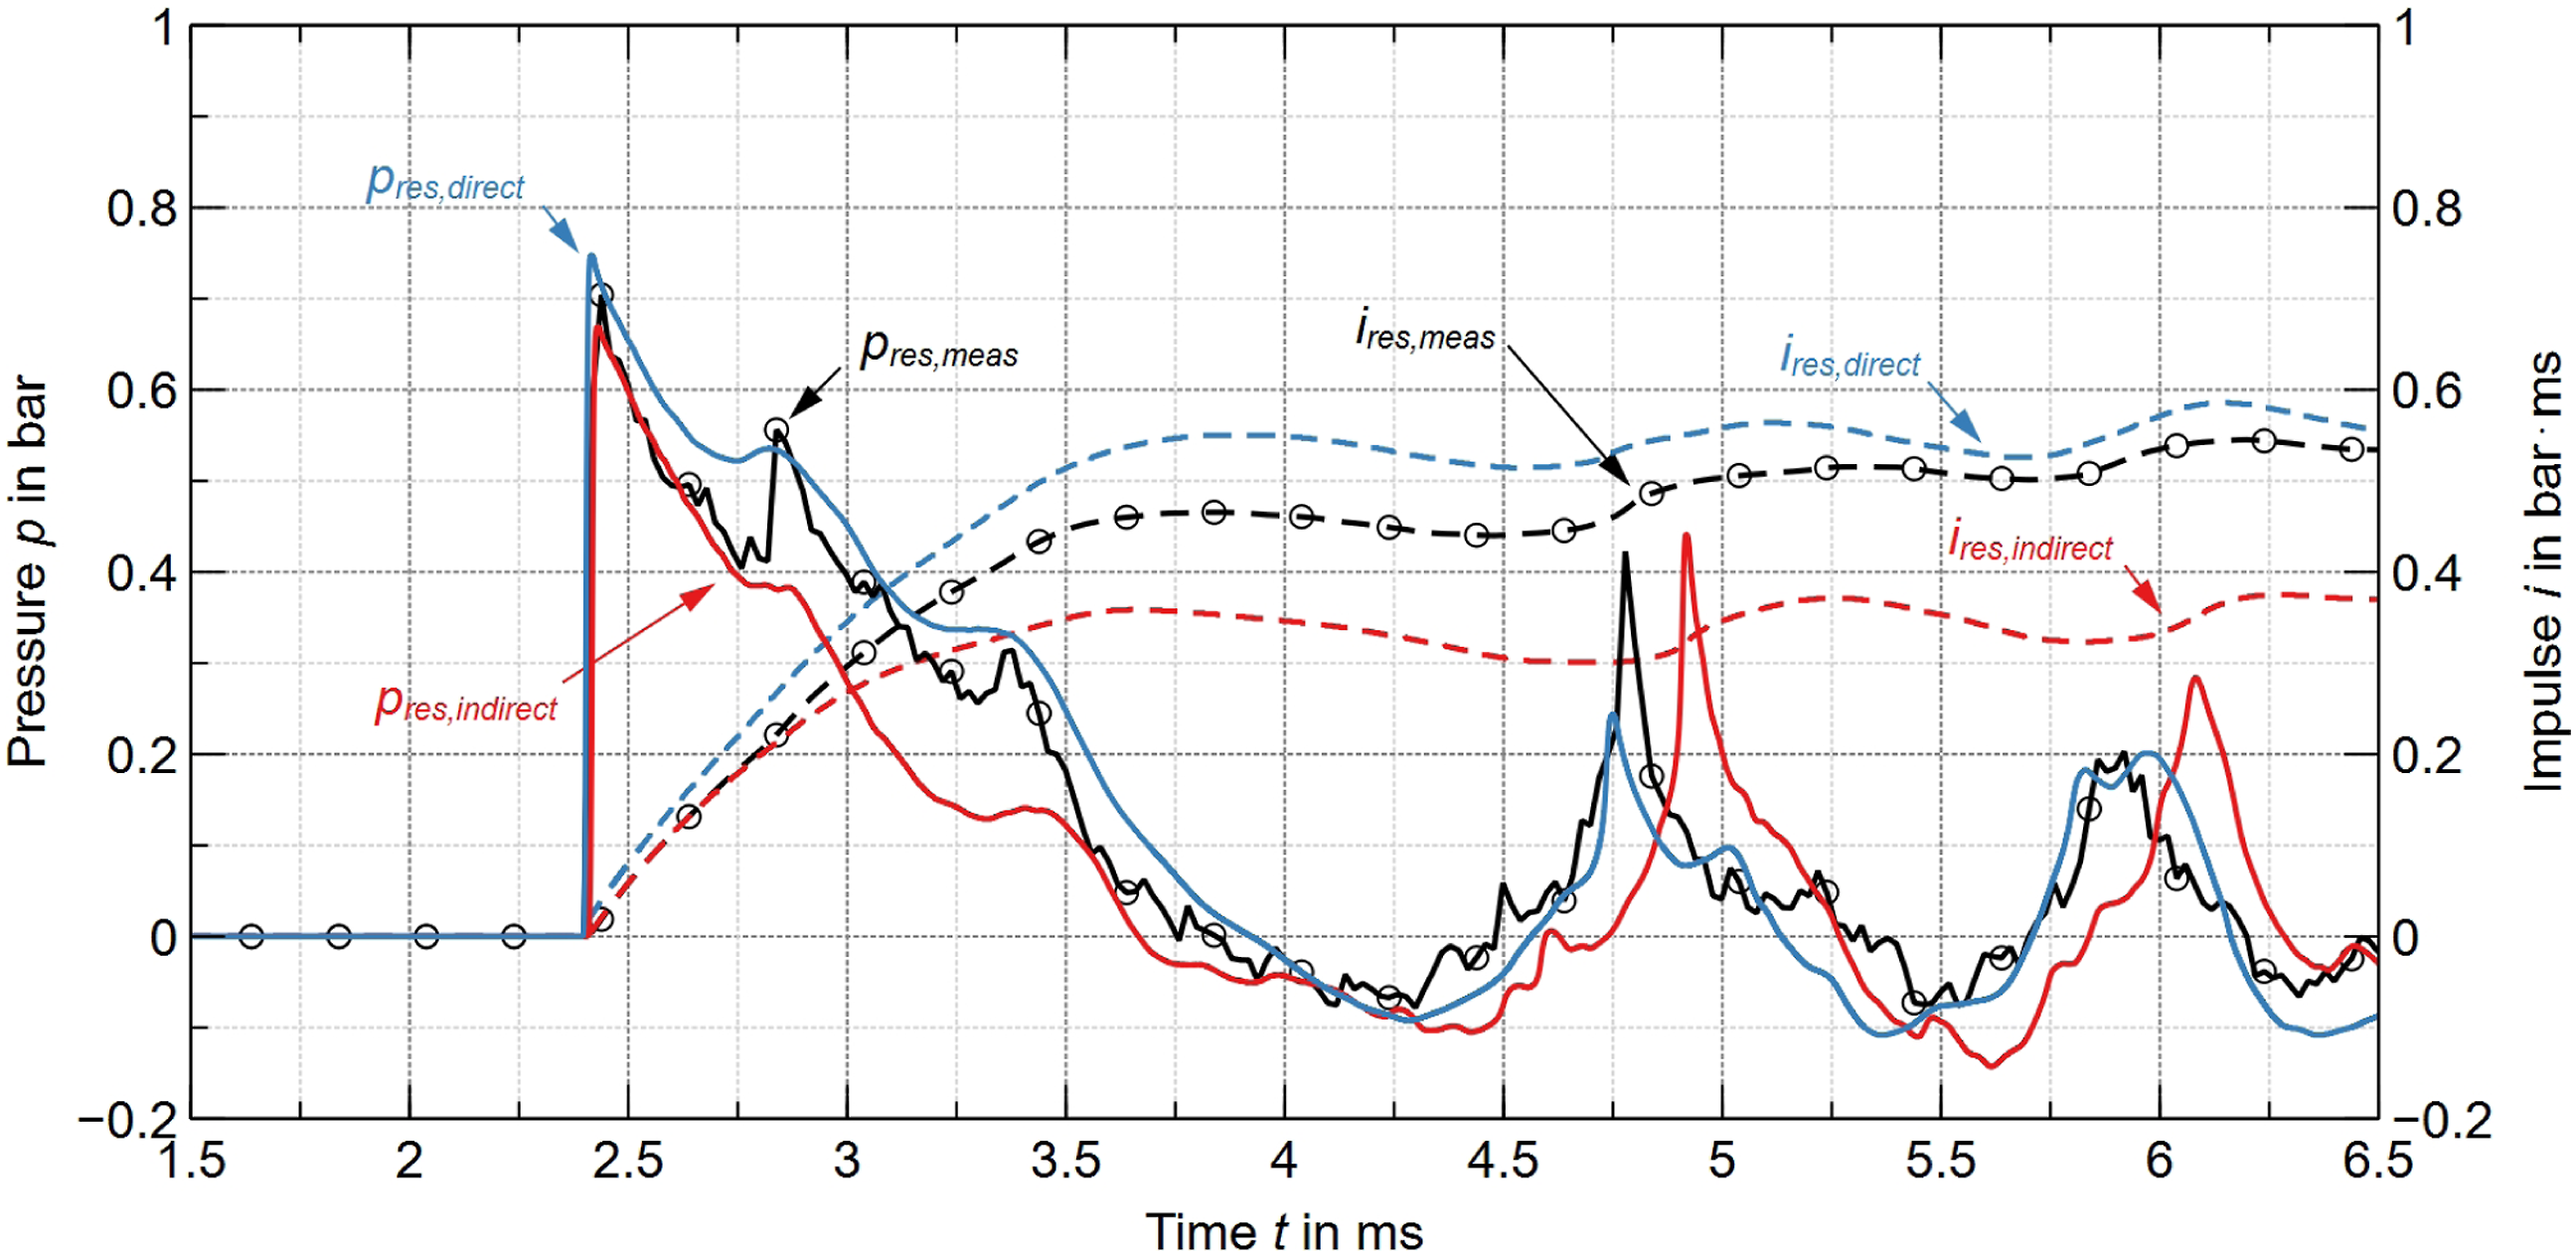
High-speed camera recordings
Figure 18 depicts the high-speed camera recordings of test case 2. Like in test case 1, at t = 0 ms the safety valve is loaded by the air blast, where the red cross represents the position of the thin metal sheets, that is, the closing mechanism. The red dashed line marks the centre steel plate of the safety valve casing (compare Figure 1(c)). Even if the incoming blast wave is planar, the upper and lower closing mechanism exhibit an unequal closing time of 1.6 ms and 1.4 ms, respectively. The reason for this behaviour can finally not be determined. High-speed camera recordings of the closing process in flow direction at 10’000 frames per second (time relative to the initial movement of the valve body) of test case 2. Additionally, the location of the recording is shown.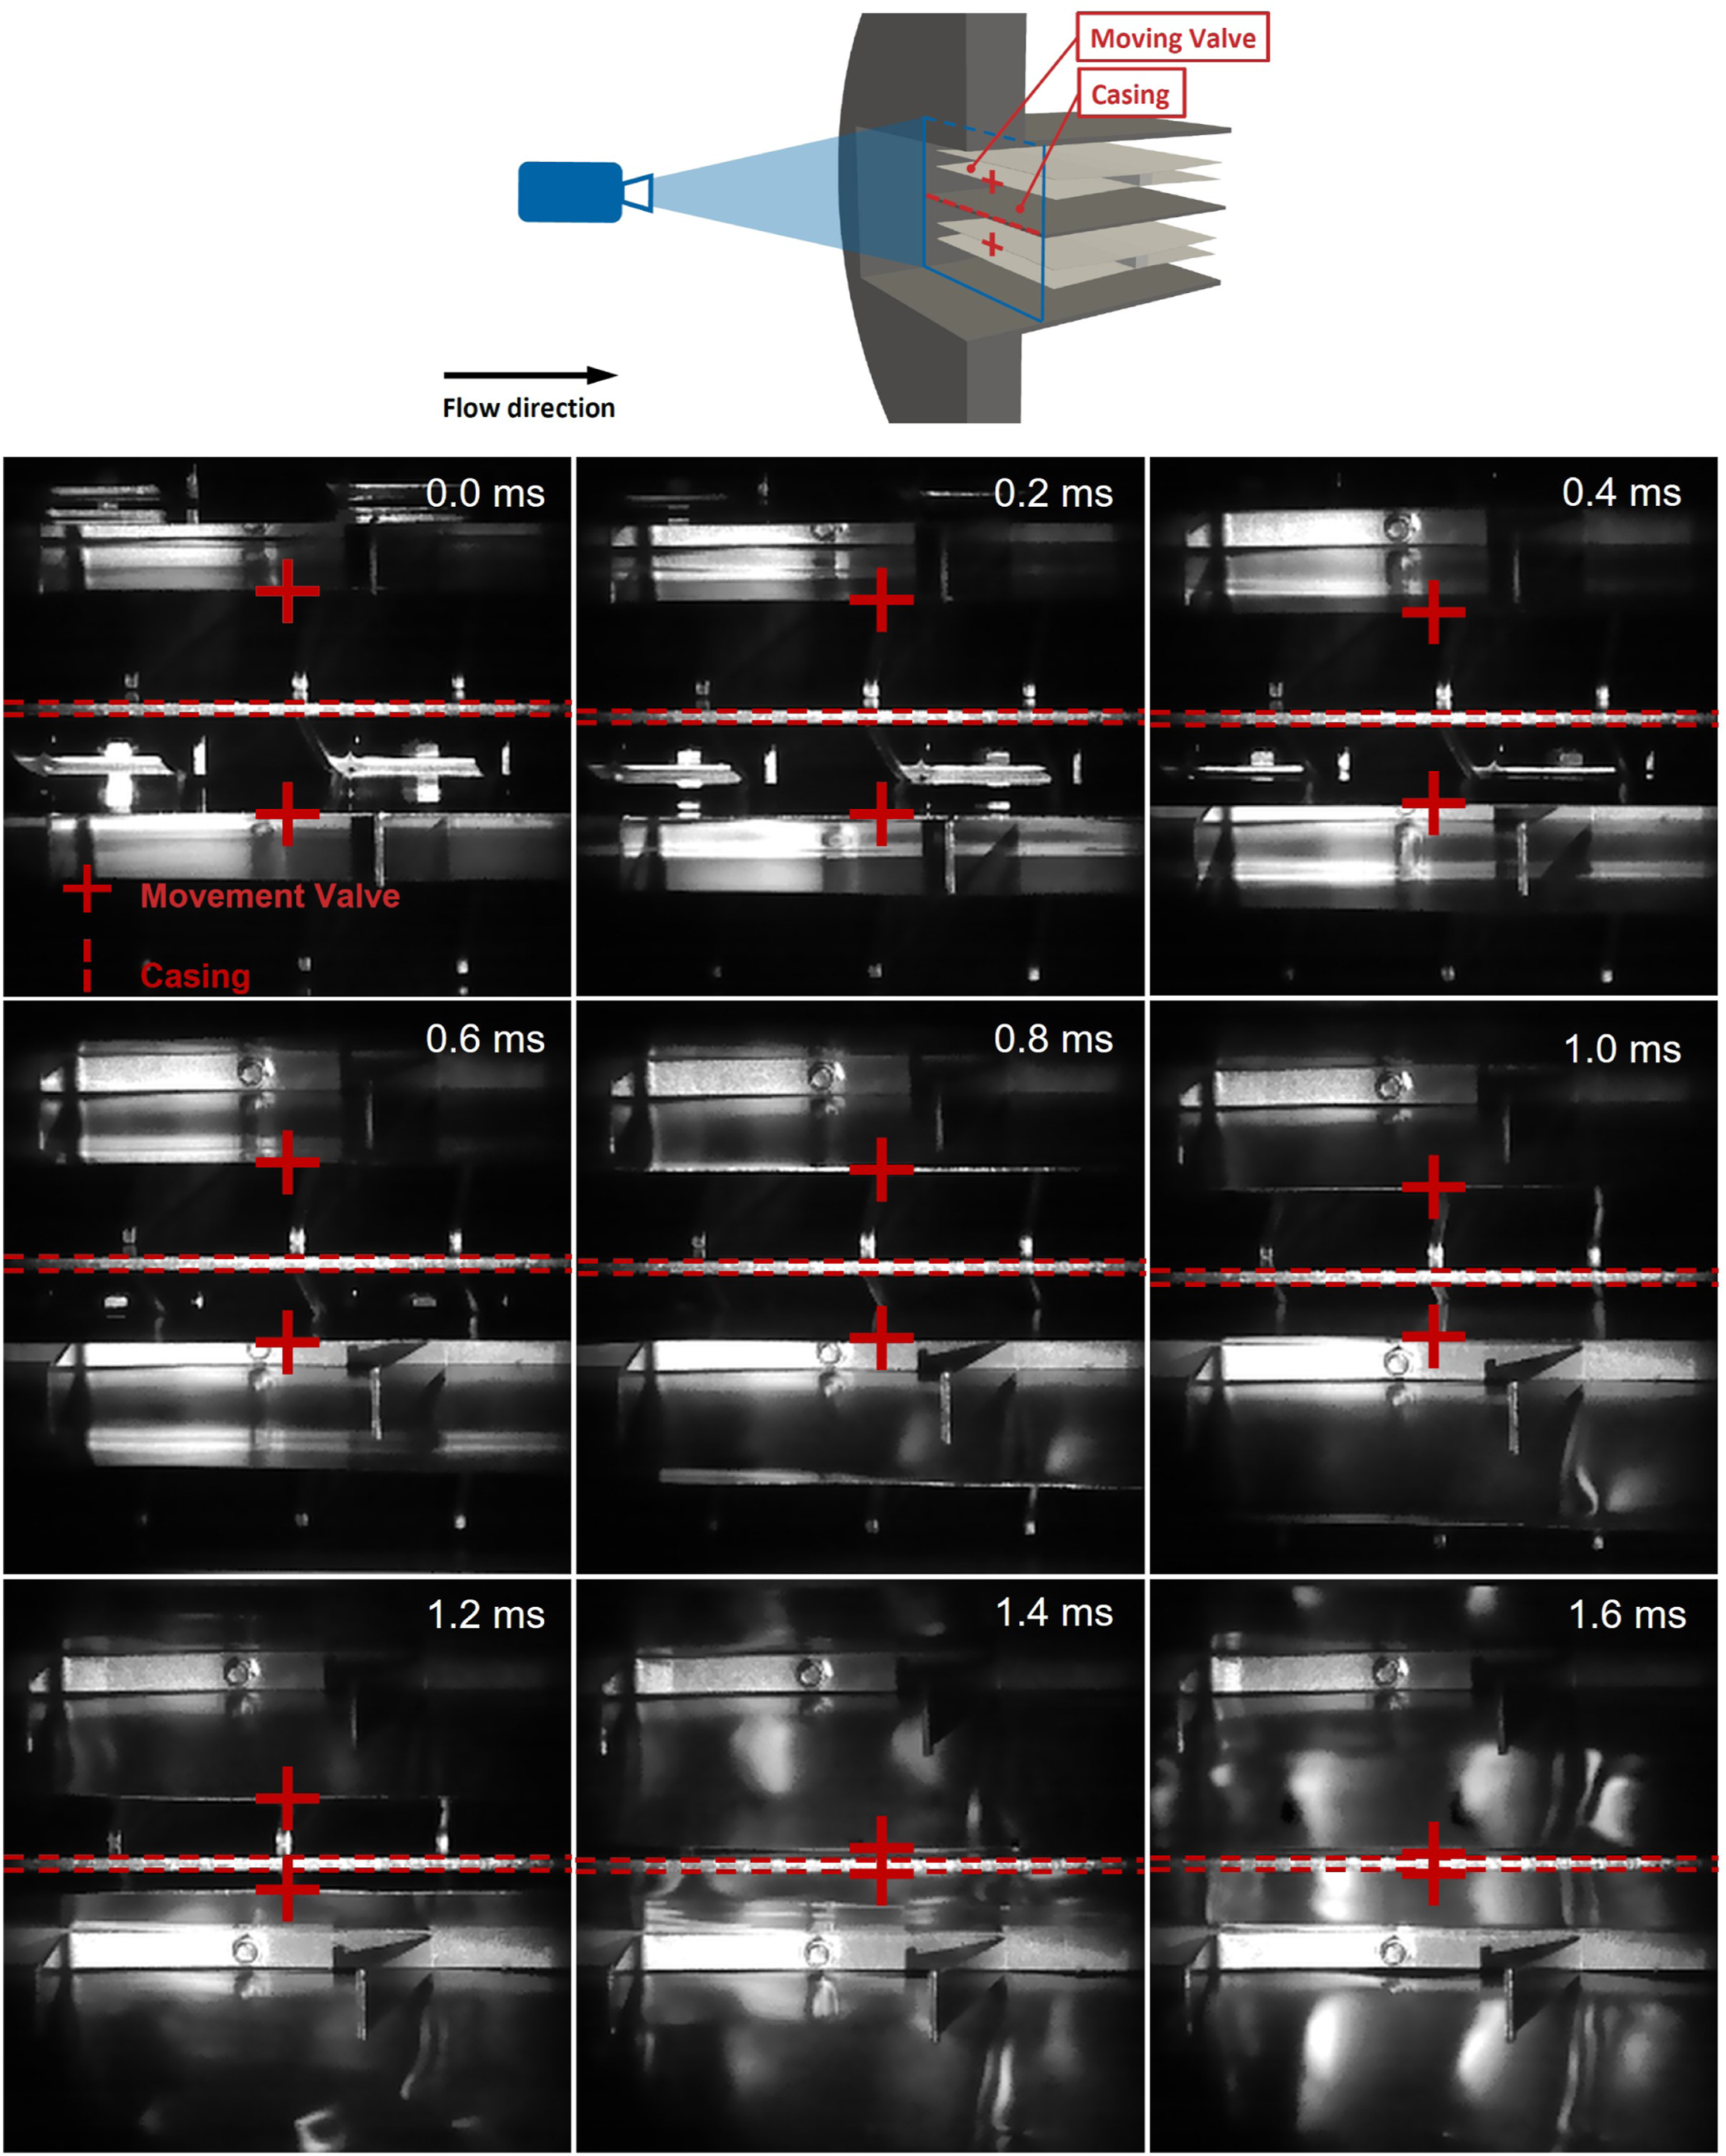
Conclusion and outlook
In the present work, a practical numerical procedure involving indirectly as well as directly coupled FSI simulations was successfully elaborated to determine the blast pressure leakage of passive air blast safety valves and the corresponding structural response when subjected to blast waves. The application on two test cases with fundamentally different closing mechanisms demonstrates the robustness of the method. To the best of the authors’ knowledge, the proposed procedure may be applied to support the error analysis during development of novel passive air blast safety valve designs, where it delivers important insights regarding the flow and structural behaviour.
In general, the pressure–time history and closing time of the valves are predicted with increased accuracy when applying directly coupled FSI simulations. The latter is shown clearly by test case 2, where the plastic deformation has a significant influence on the closing mechanism behaviour, especially after the first closing phase. To the best of the authors’ knowledge and according to the outcome of the present study, directly coupled FSI simulations are necessary for such types of passive air blast safety valves. Nevertheless, the blast pressure leakage may be predicted with sufficient accuracy by applying indirectly coupled simulations when considering simpler closing mechanisms like a translational movement in test case 1.
Since the pressure–time histories are partially underpredicted, for example, the initial pressure peak in test case 1, future work should cover the analysis of different material models including experimental tests, since the behaviour of the closing mechanisms after reaching the contact point highly depends on the material modelling. Also, the coupling area, that is, the integration of safety valve components, could be extended, with the drawback of having an increased model complexity. Moreover, LS-DYNA has the capability to perform stand-alone fully coupled FSI simulations with the Arbitrary Lagrangian Eulerian (ALE) method. A comparison of such simulations with the data generated in this work could be of interest and the subject of future investigations. While in the present study the high-speed camera recordings are in a proof-of-concept stage, novel approaches could increase the visibility of the safety valve. The latter may help to better understand the safety valve behaviour under blast loading or even allows a visual validation of the FSI simulations, not only by the closing time but also by the complete safety valve deflection. However, this is regarded as challenging considering the pressure magnitudes typically applied in such shock tube tests.
Footnotes
Acknowledgements
Special thanks goes to Michael Riedo and Michel Schilling from Andair AG as the lead partner in a previous research project, which provided the basis for this work. In the former study, an evaluation and optimization procedure for passive air blast safety valves was developed, which ultimately resulted in a completely new generation of valves. Many thanks for the valuable support during the present project go to the participating experts who took time for a conversation or contributed with additional information. Furthermore, the authors would like to thank Angelo Seitz for the help during the shock tube experiments.
Declaration of conflicting interests
The author(s) declared no potential conflicts of interest with respect to the research, authorship, and/or publication of this article.
Funding
The author(s) received no financial support for the research, authorship, and/or publication of this article.